Test du Dell XPS 15 9520 3.5K OLED 2022 : acheter ou laisser tomber ?
Dell a démarré la décennie en fanfare en présentant le XPS 15 9500 entièrement rafraîchi pour succéder à l'ancienne génération Série XPS 15 7590. Ce modèle a fait passer la famille XPS 15 de 16:9 à 16:10 avec un tout nouveau design de châssis, des processeurs Intel 10e génération Comet Lake-H et le GPU GeForce GTX 1650 Ti. Le XPS 15 9510 est allé encore plus loin avec les CPU de 11e génération Tiger Lake-H et des panneaux OLED 3,5K en option. Maintenant, le XPS 15 9520 est encore une autre mise à jour incrémentale avec des CPU Alder Lake-H de 12e génération et une RAM DDR5 plus rapide.
Nous vous recommandons de consulter notre revue existante sur le XPS 15 9500 car le châssis du XPS 15 9520 reste identique. Cette page d'examen se concentrera sur les performances du XPS 15 9520 et les autres différences auxquelles les utilisateurs peuvent s'attendre par rapport aux modèles précédents.
Les alternatives au Dell XPS 15 9520 comprennent d'autres ordinateurs portables multimédias haut de gamme de 15,6 pouces dotés d'une carte graphique discrète, comme le Asus Zenbook Pro 15 OLED, Lenovo Yoga Creator 7 15, HP Spectre x360 15, HP Envy 15ou le MSI Creator 15.
Plus de commentaires sur Dell :
Comparaison avec les concurrents potentiels
Note | Date | Modèle | Poids | Épaisseur | Taille | Résolution | Prix |
|---|---|---|---|---|---|---|---|
| 89.5 % v7 (old) | 05/22 | Dell XPS 15 9520 RTX 3050 Ti i7-12700H, GeForce RTX 3050 Ti Laptop GPU | 1.9 kg | 18 mm | 15.60" | 3456x2160 | |
| 88.4 % v7 (old) | 08/21 | Dell XPS 15 9510 11800H RTX 3050 Ti OLED i7-11800H, GeForce RTX 3050 Ti Laptop GPU | 1.9 kg | 18 mm | 15.60" | 3456x2160 | |
| 85 % v7 (old) | 01/20 | HP Spectre X360 15-5ZV31AV i7-10510U, GeForce MX250 | 2.1 kg | 19.3 mm | 15.60" | 3840x2160 | |
| 87.7 % v7 (old) | 05/22 | Asus Zenbook Pro 15 OLED UM535Q R9 5900HX, GeForce RTX 3050 Ti Laptop GPU | 1.9 kg | 18 mm | 15.60" | 1920x1080 | |
| 82.4 % v7 (old) | 02/21 | MSI Stealth 15M A11SEK i7-1185G7, GeForce RTX 2060 Max-Q | 1.7 kg | 16.15 mm | 15.60" | 1920x1080 | |
| 93.2 % v7 (old) | 11/21 | Apple MacBook Pro 16 2021 M1 Pro M1 Pro, M1 Pro 16-Core GPU | 2.2 kg | 16.8 mm | 16.20" | 3456x2234 |
Cas
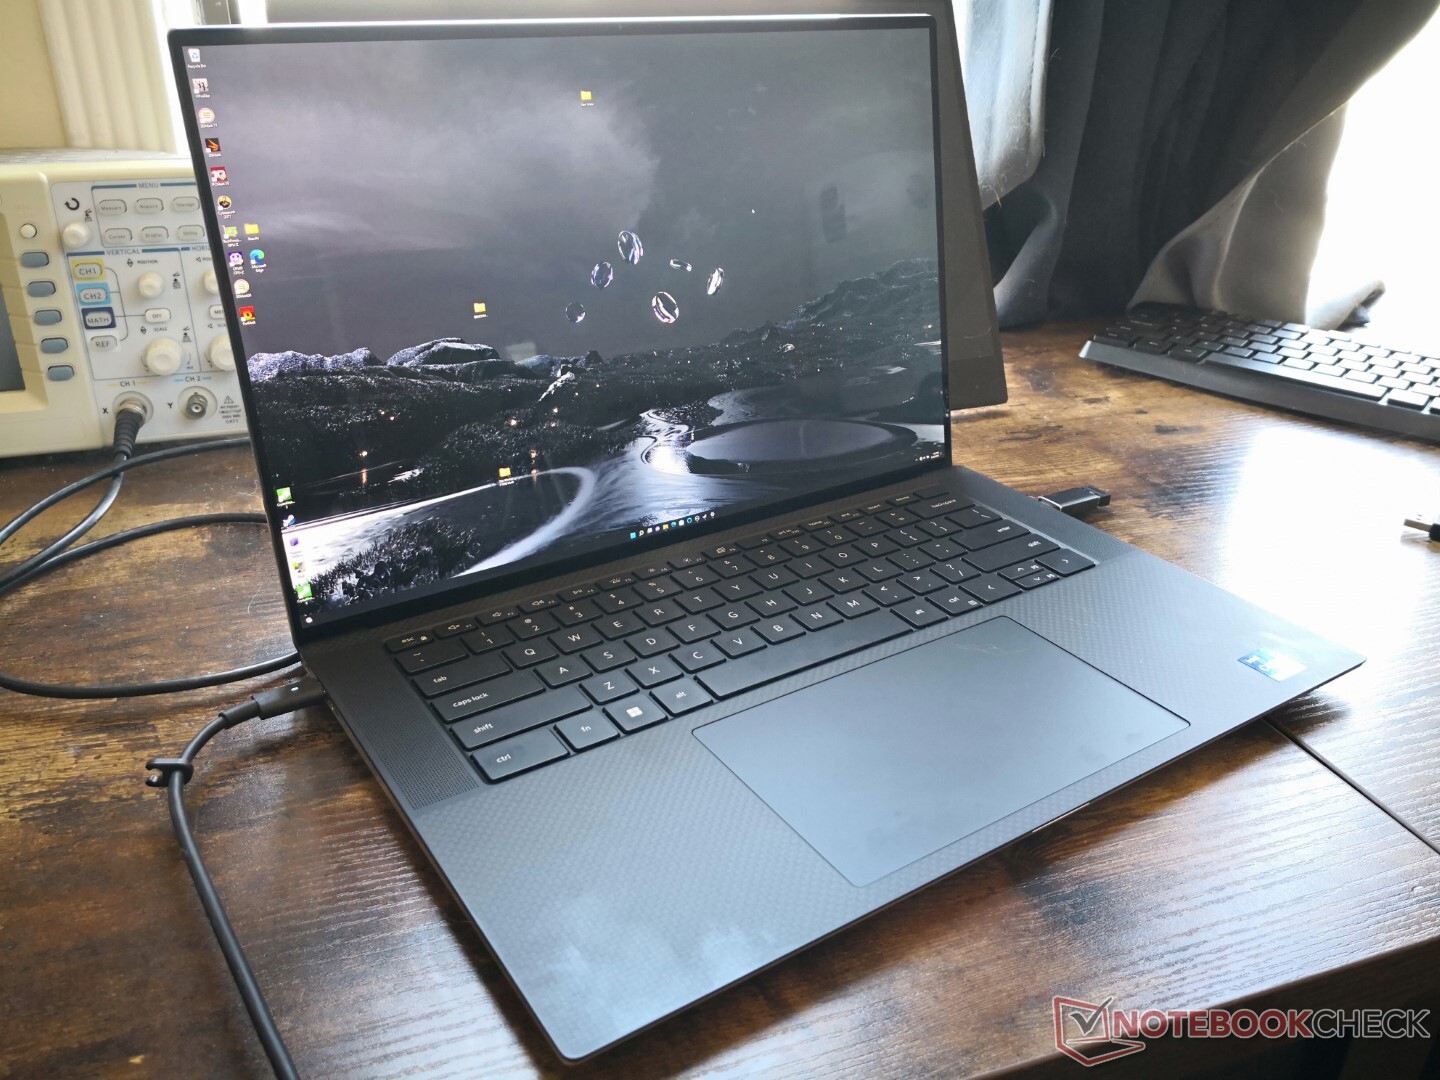
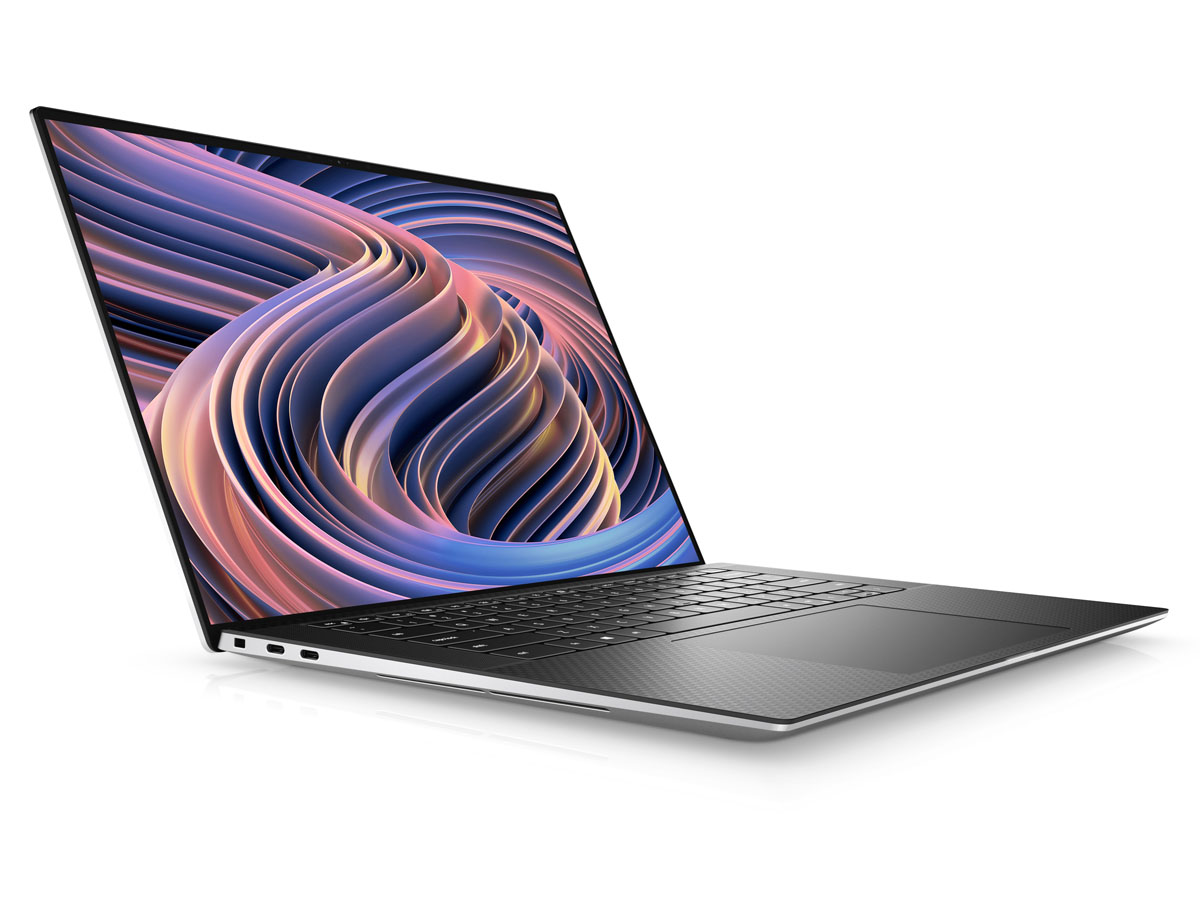
Le châssis du XPS 15 9520 est toujours l'un des plus petits modèles de sa catégorie, malgré ses deux ans d'existence. Les bords très étroits sur les quatre côtés, y compris le menton, aident à réduire l'encombrement par de plus grandes marges que le Zenbook Pro 15 ou le Spectre x360 15.
Lecteur de carte SD
| SD Card Reader | |
| average JPG Copy Test (av. of 3 runs) | |
| Dell XPS 15 9510 11800H RTX 3050 Ti OLED (AV Pro V60) | |
| Dell XPS 15 9500 Core i7 4K UHD (Toshiba Exceria Pro SDXC 64 GB UHS-II) | |
| MSI Stealth 15M A11SEK (Toshiba Exceria Pro M501 microSDXC 32GB) | |
| Dell XPS 15 9520 RTX 3050 Ti (Toshiba Exceria Pro SDXC 64 GB UHS-II) | |
| HP Spectre X360 15-5ZV31AV (Toshiba Exceria Pro M501 UHS-II) | |
| Asus Zenbook Pro 15 OLED UM535Q (Toshiba Exceria Pro SDXC 64 GB UHS-II) | |
| maximum AS SSD Seq Read Test (1GB) | |
| MSI Stealth 15M A11SEK (Toshiba Exceria Pro M501 microSDXC 32GB) | |
| Dell XPS 15 9510 11800H RTX 3050 Ti OLED (AV Pro V60) | |
| Dell XPS 15 9500 Core i7 4K UHD (Toshiba Exceria Pro SDXC 64 GB UHS-II) | |
| HP Spectre X360 15-5ZV31AV (Toshiba Exceria Pro M501 UHS-II) | |
| Dell XPS 15 9520 RTX 3050 Ti (Toshiba Exceria Pro SDXC 64 GB UHS-II) | |
| Asus Zenbook Pro 15 OLED UM535Q (Toshiba Exceria Pro SDXC 64 GB UHS-II) | |
Communication
Une puce Intel AX211 est fournie en standard pour la connectivité Wi-Fi 6E et Bluetooth 5.2. Cependant, Dell nous a confirmé que le XPS 15 9520 n'a pas été conçu pour prendre en charge les réseaux Wi-Fi 6E à 6 GHz, malgré le fait que la puce AX211 le puisse. Ainsi, les propriétaires du XPS 15 9520 ne pourront se connecter qu'aux réseaux 2,4 GHz et 5 GHz jusqu'au Wi-Fi 6.
| Networking | |
| iperf3 transmit AX12 | |
| Dell XPS 15 9510 11800H RTX 3050 Ti OLED | |
| Dell XPS 15 9500 Core i7 4K UHD | |
| MSI Stealth 15M A11SEK | |
| Asus Zenbook Pro 15 OLED UM535Q | |
| iperf3 receive AX12 | |
| Dell XPS 15 9500 Core i7 4K UHD | |
| Dell XPS 15 9510 11800H RTX 3050 Ti OLED | |
| MSI Stealth 15M A11SEK | |
| Asus Zenbook Pro 15 OLED UM535Q | |
| iperf3 receive AXE11000 | |
| Dell XPS 15 9520 RTX 3050 Ti | |
| iperf3 transmit AXE11000 | |
| Dell XPS 15 9520 RTX 3050 Ti | |
Webcam
Dell a amélioré les couleurs de la webcam en séparant les capteurs IR et RVB par rapport au XPS 15 9510 ou 9500. Elle reste cependant à 1 MP, contre 2 MP sur d'autres ordinateurs portables phares de 15,6 pouces comme le Razer Blade 15. Ainsi, même si les couleurs sont un peu meilleures, l'image est encore boueuse.


Maintenance
Accessoires et garantie
La boîte de détail comprend l'adaptateur secteur USB-C, des papiers et un adaptateur USB-C vers HDMI et USB-A de taille normale. Ce dernier est particulièrement utile car le système n'intègre que des ports USB-C.
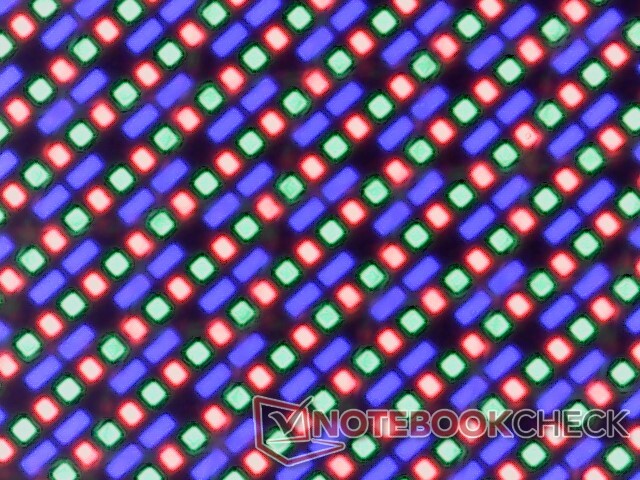
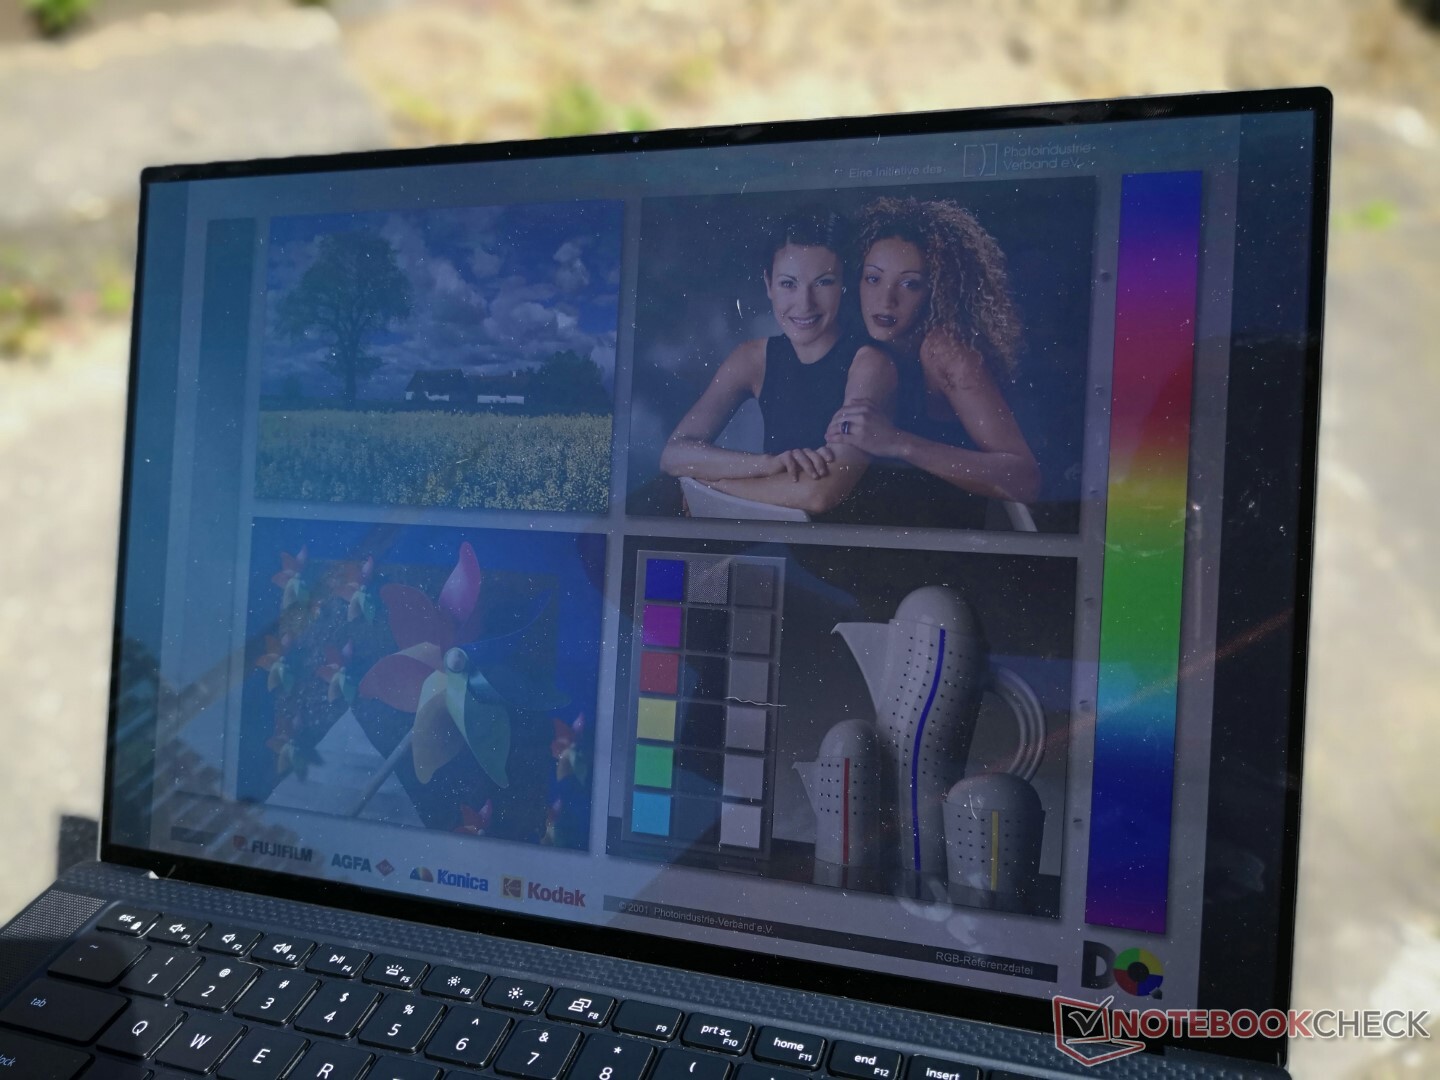
Écran - Uncommon 3.5K OLED
Notre unité de test est équipée du même écran tactile OLED 3,5K que le XPS 15 9510 de l'année dernière, ce qui signifie que l'expérience visuelle n'a pas changé d'une année sur l'autre. Une option IPS 1920 x 1200 de résolution inférieure et une option IPS 3840 x 2400 de résolution supérieure sont également disponibles, mais tous les panneaux sont malheureusement limités à un taux de rafraîchissement de 60 Hz. Certains ultrabooks, comme le Lenovo IdeaPad Slim 7i Pro ou le Asus Vivobook Pro 14, sont déjà équipés de panneaux plus rapides de 90 Hz pour une expérience d'interface utilisateur nettement plus fluide.
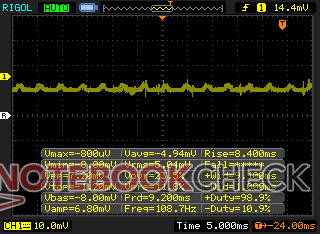
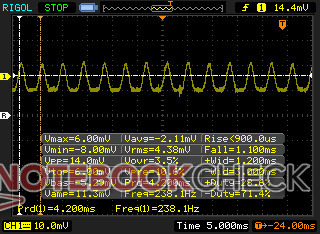
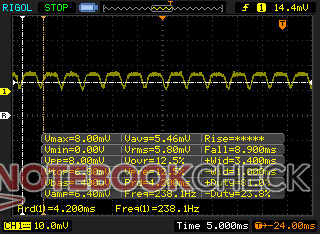
N'oubliez pas que la modulation de largeur d'impulsion est présente sur toutes les luminosités à 238 Hz de 0 à 25 % de luminosité et à 59 Hz de 26 à 100 % de luminosité. Si le scintillement de l'écran est un problème, nous vous recommandons d'opter pour une configuration IPS.
| |||||||||||||||||||||||||
Homogénéité de la luminosité: 95 %
Valeur mesurée au centre, sur batterie: 381.4 cd/m²
Contraste: ∞:1 (Valeurs des noirs: 0 cd/m²)
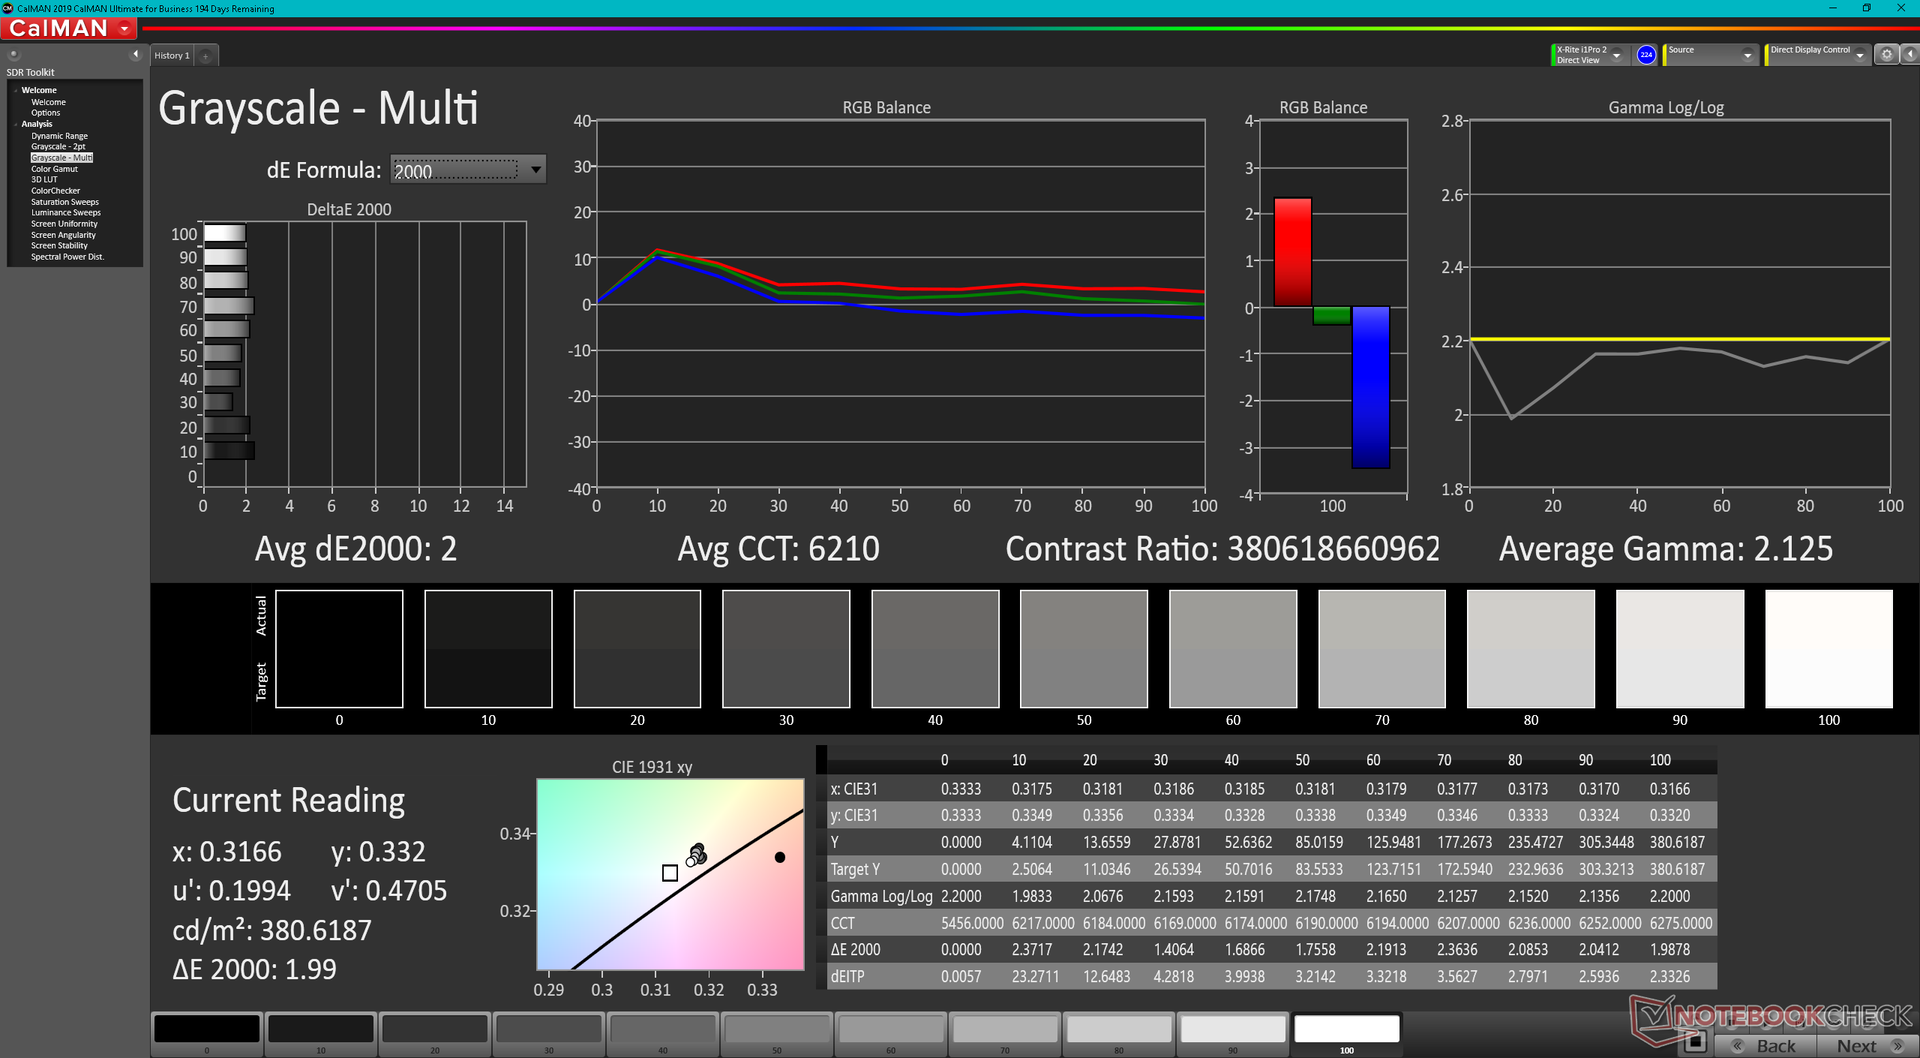
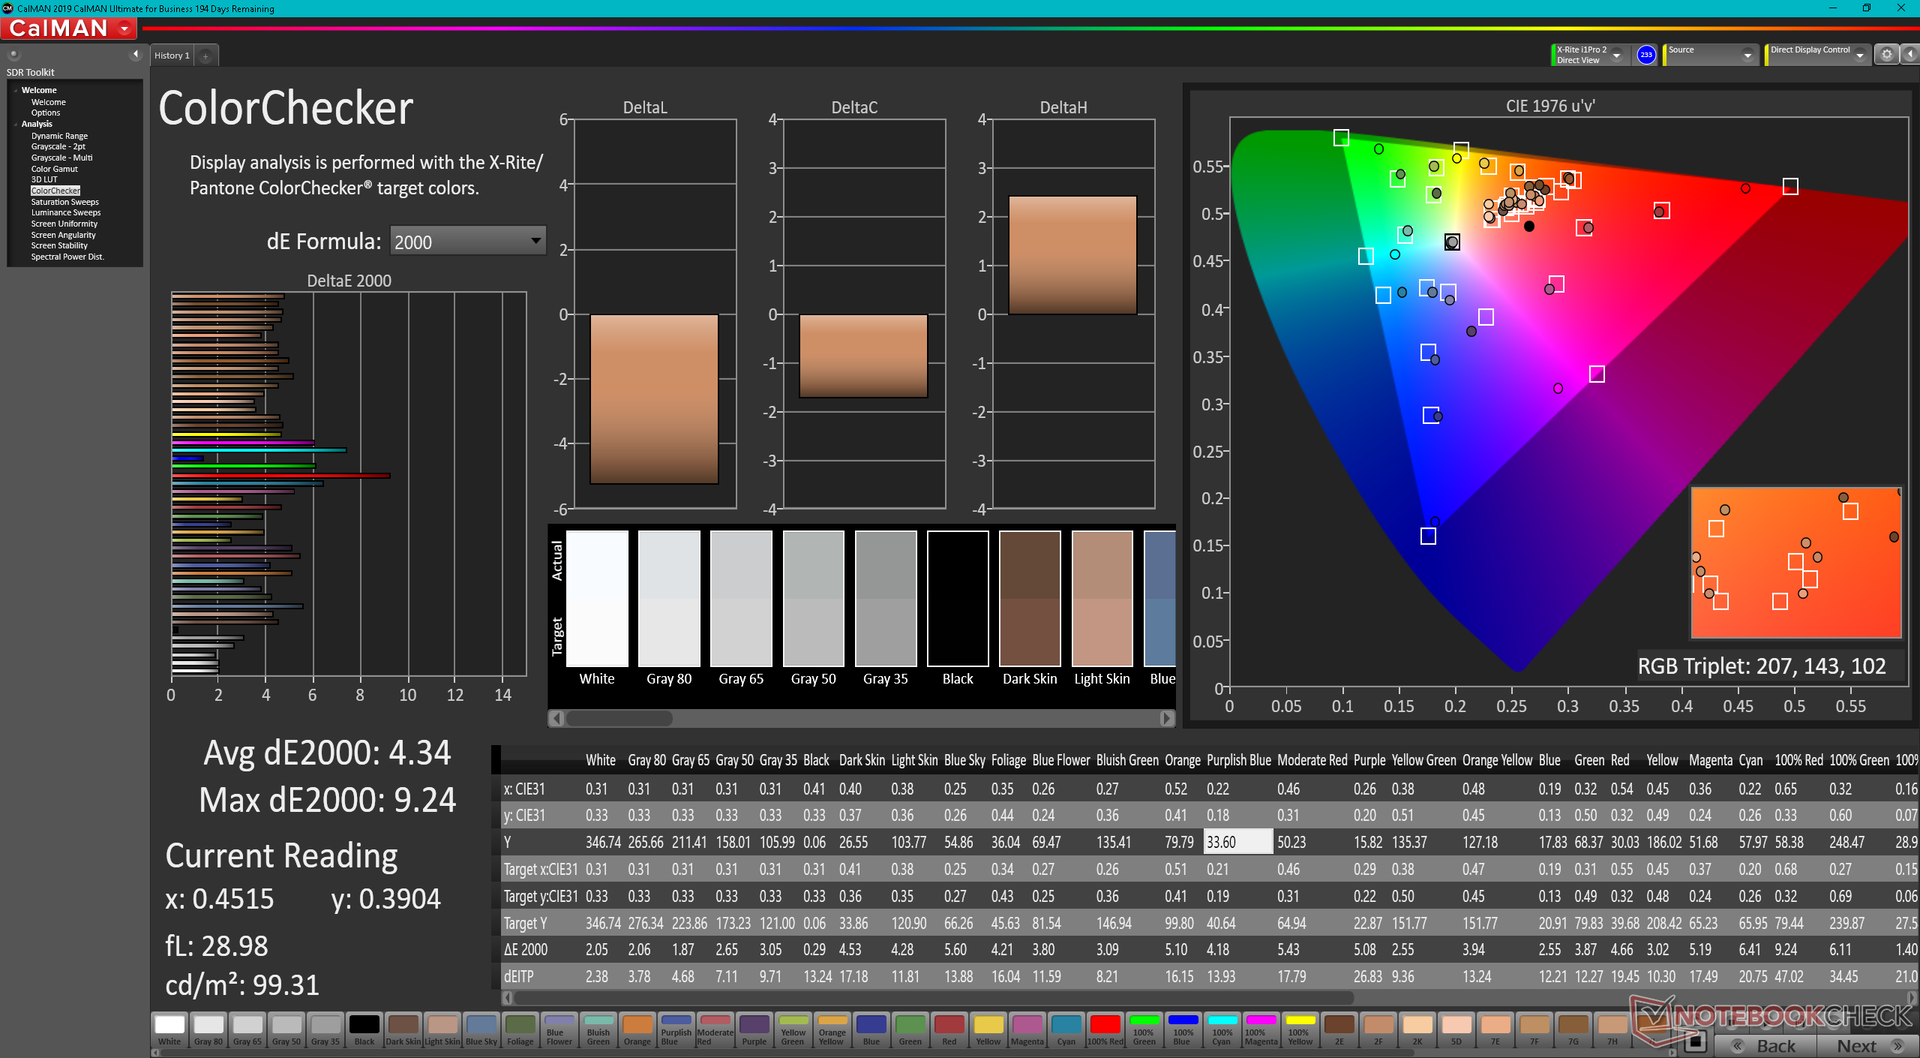
ΔE ColorChecker Calman: 4.34 | ∀{0.5-29.43 Ø4.71}
ΔE Greyscale Calman: 2 | ∀{0.09-98 Ø4.96}
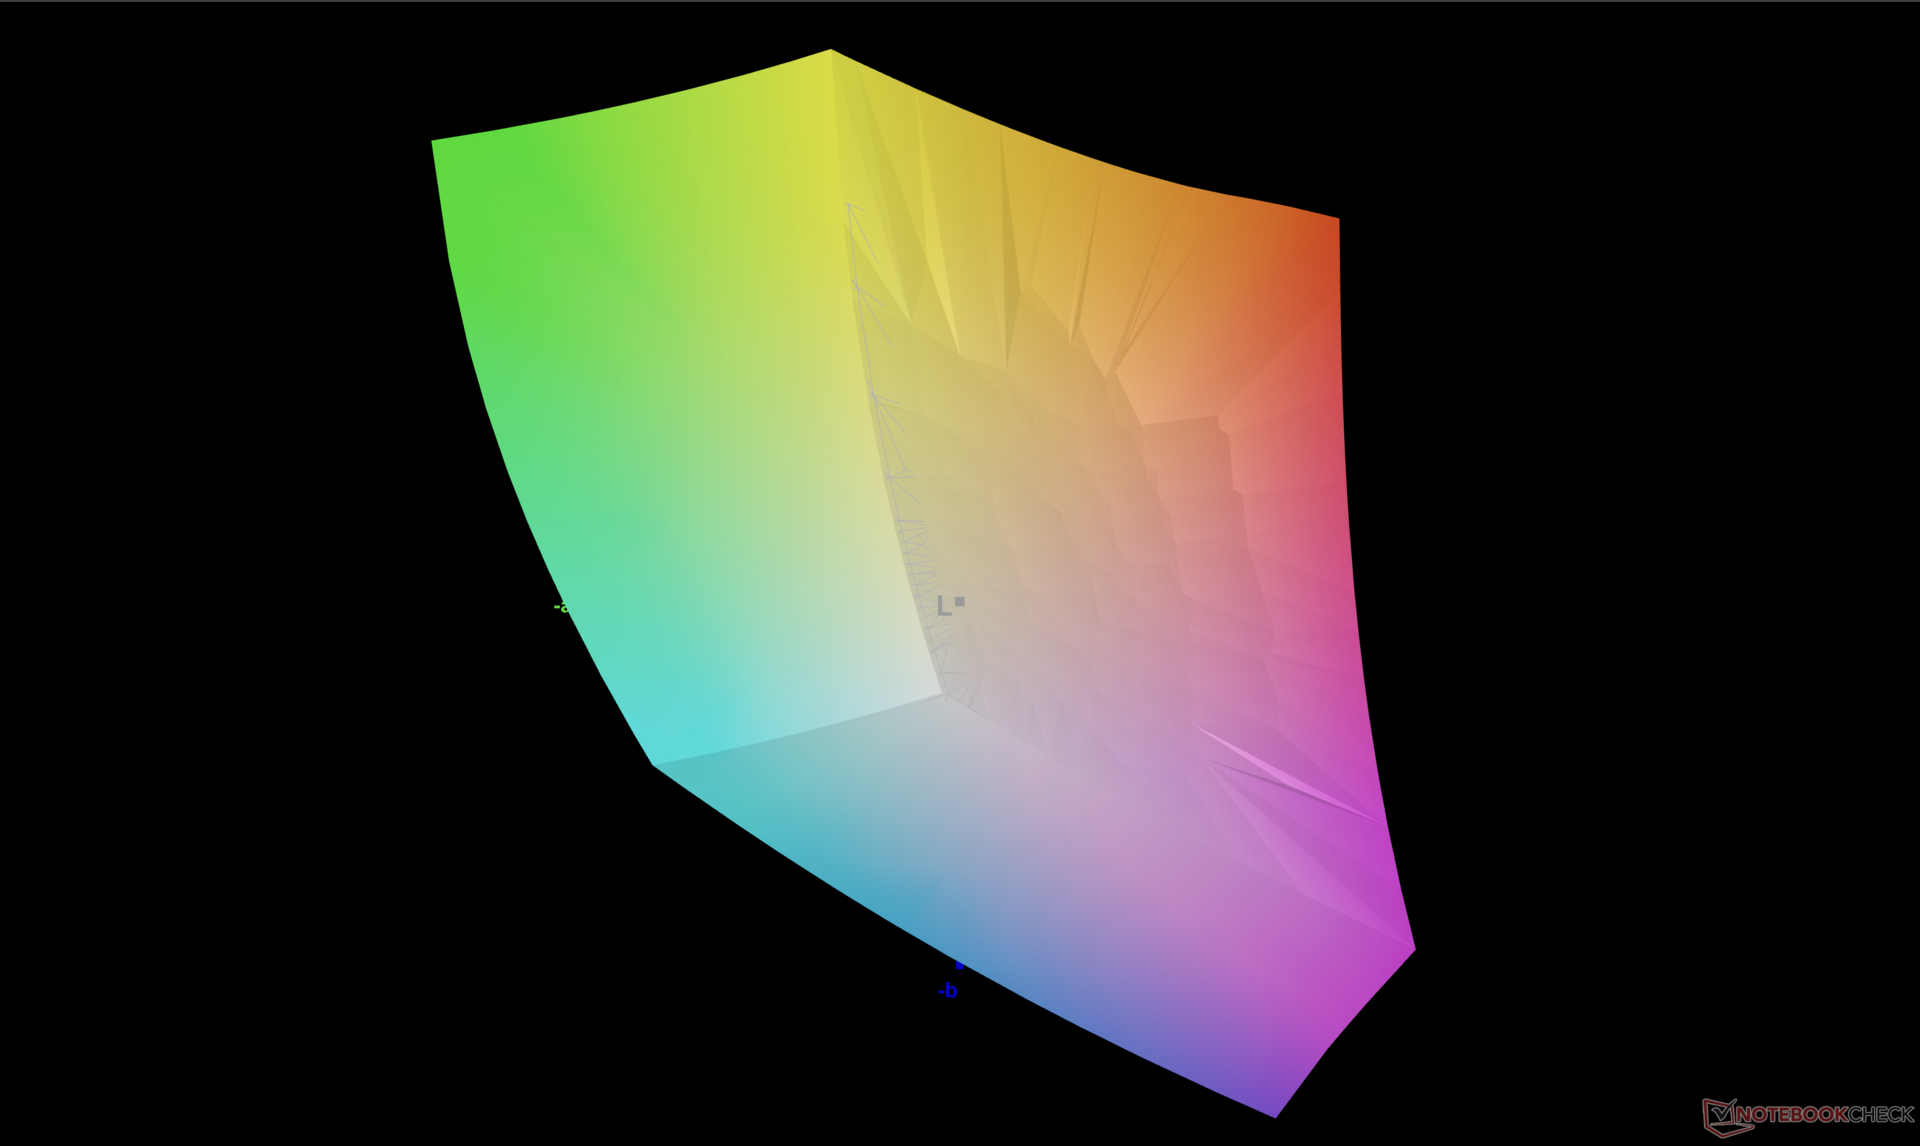
86% AdobeRGB 1998 (Argyll 3D)
99.9% sRGB (Argyll 3D)
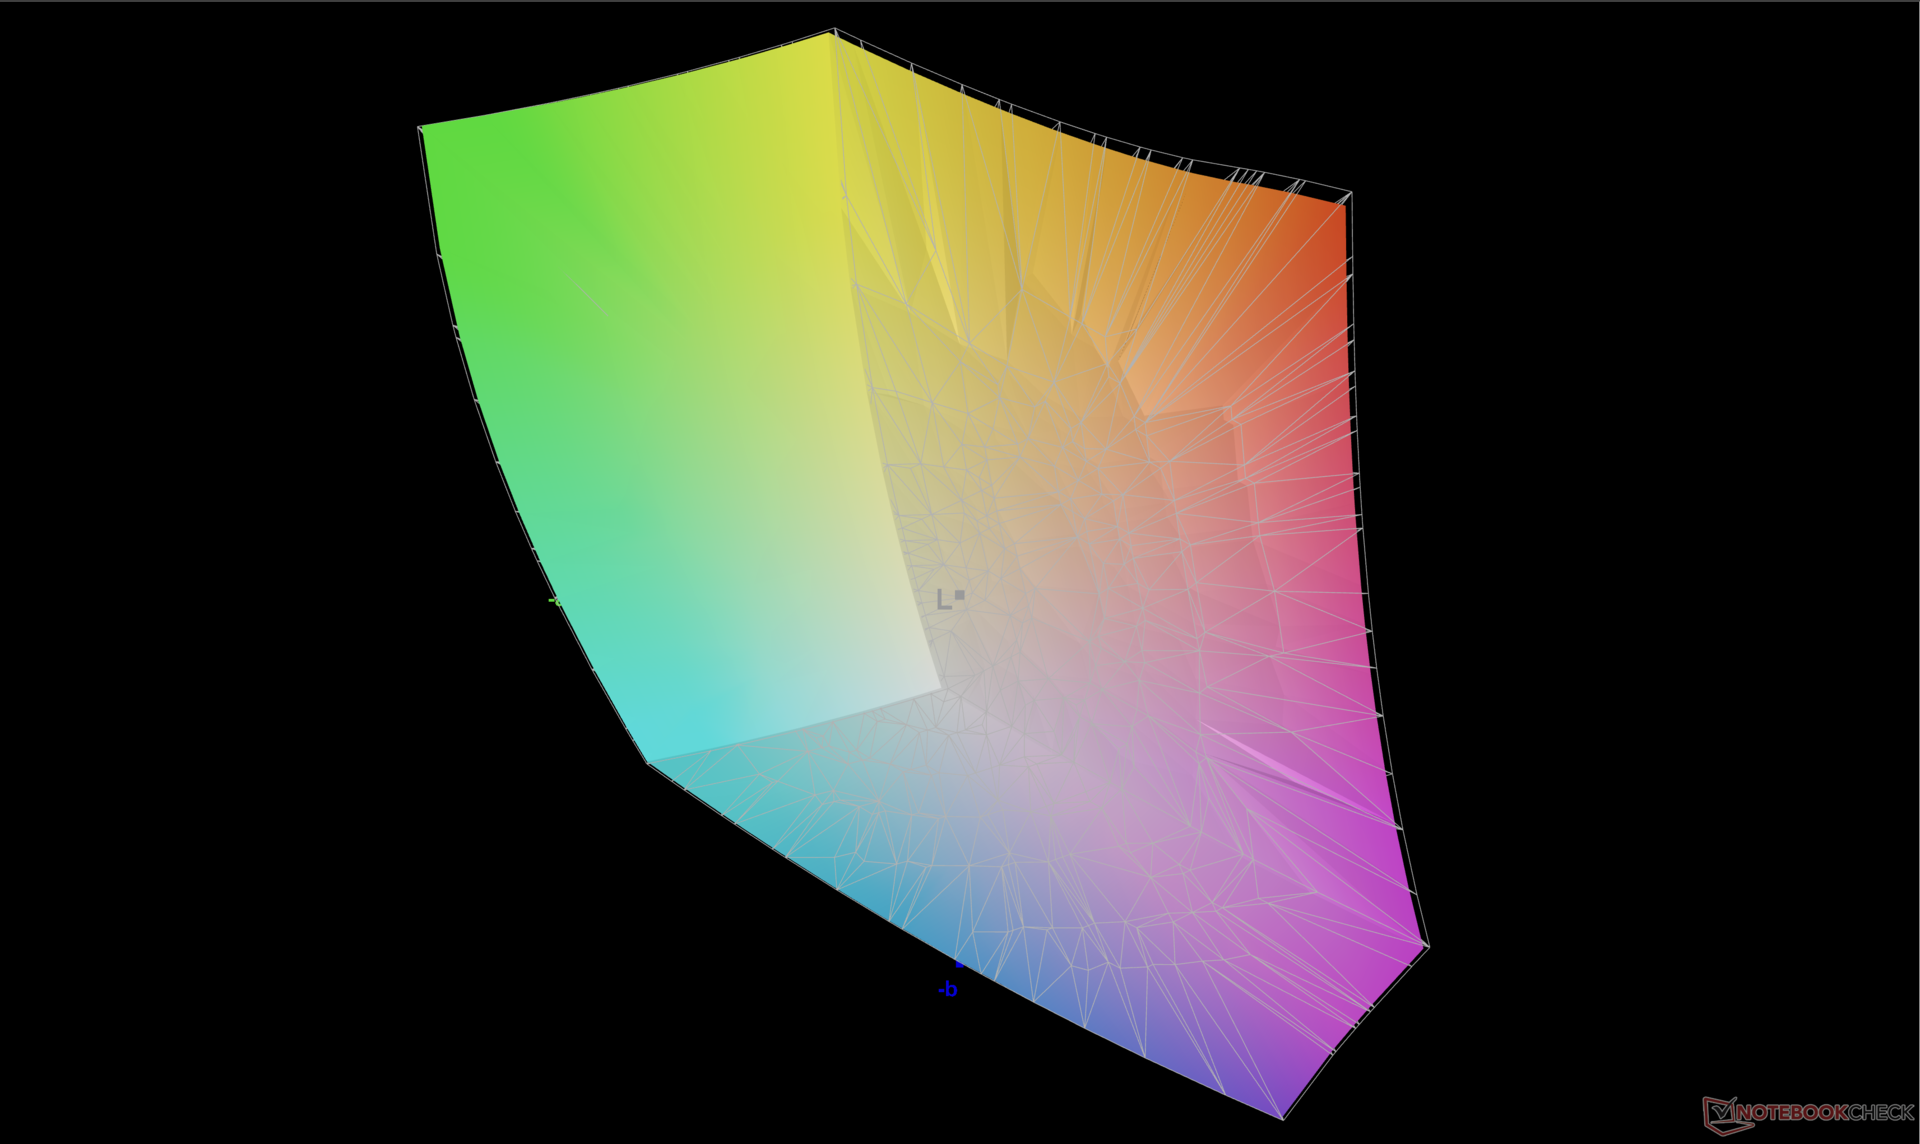
97.8% Display P3 (Argyll 3D)
Gamma: 2.13
CCT: 6210 K
| Dell XPS 15 9520 RTX 3050 Ti Samsung 156XG01, OLED, 3456x2160, 15.6" | Dell XPS 15 9510 11800H RTX 3050 Ti OLED SDC414D, OLED, 3456x2160, 15.6" | Dell XPS 15 9500 Core i7 4K UHD Sharp LQ156R1, IPS, 3840x2400, 15.6" | HP Spectre X360 15-5ZV31AV AU Optronics AUO30EB, IPS, 3840x2160, 15.6" | Asus Zenbook Pro 15 OLED UM535Q Samsung ATNA56YX03-0, OLED, 1920x1080, 15.6" | MSI Stealth 15M A11SEK Chi Mei N156HCE-EN1, IPS, 1920x1080, 15.6" | |
|---|---|---|---|---|---|---|
| Display | 5% | 3% | -19% | -7% | -23% | |
| Display P3 Coverage (%) | 97.8 | 99.9 2% | 89.7 -8% | 68.3 -30% | 79.3 -19% | 62 -37% |
| sRGB Coverage (%) | 99.9 | 100 0% | 100 0% | 94.3 -6% | 95.6 -4% | 93.4 -7% |
| AdobeRGB 1998 Coverage (%) | 86 | 98.1 14% | 99.8 16% | 68.4 -20% | 87.3 2% | 64.1 -25% |
| Response Times | -68% | -2195% | -2468% | -16% | -2079% | |
| Response Time Grey 50% / Grey 80% * (ms) | 1.9 ? | 3.6 ? -89% | 54 ? -2742% | 56.8 ? -2889% | 2.1 ? -11% | 47.6 ? -2405% |
| Response Time Black / White * (ms) | 1.9 ? | 2.8 ? -47% | 33.2 ? -1647% | 40.8 ? -2047% | 2.3 ? -21% | 35.2 ? -1753% |
| PWM Frequency (Hz) | 59.52 ? | 59.5 ? | 60.2 | 25000 ? | ||
| Screen | 22% | 5% | -11% | 13% | -4% | |
| Brightness middle (cd/m²) | 381.4 | 362 -5% | 557.9 46% | 284.6 -25% | 342.9 -10% | 279 -27% |
| Brightness (cd/m²) | 384 | 367 -4% | 541 41% | 285 -26% | 346 -10% | 252 -34% |
| Brightness Distribution (%) | 95 | 97 2% | 91 -4% | 85 -11% | 98 3% | 82 -14% |
| Black Level * (cd/m²) | 0.06 | 0.39 | 0.25 | 0.32 | ||
| Colorchecker dE 2000 * | 4.34 | 2.1 52% | 4.54 -5% | 3.52 19% | 2.42 44% | 1.72 60% |
| Colorchecker dE 2000 max. * | 9.24 | 4.1 56% | 7.92 14% | 5.56 40% | 4.05 56% | 5.62 39% |
| Greyscale dE 2000 * | 2 | 1.4 30% | 3.2 -60% | 3.2 -60% | 2.1 -5% | 2.9 -45% |
| Gamma | 2.13 103% | 2.18 101% | 1.99 111% | 2.28 96% | 2.21 100% | 2.3 96% |
| CCT | 6210 105% | 6608 98% | 6451 101% | 7070 92% | 6364 102% | 6700 97% |
| Contrast (:1) | 6033 | 1431 | 1138 | 872 | ||
| Colorchecker dE 2000 calibrated * | 2.5 | 3.82 | 3 | 1.39 | ||
| Color Space (Percent of AdobeRGB 1998) (%) | 89.5 | 61.1 | 59 | |||
| Color Space (Percent of sRGB) (%) | 100 | 93.8 | 93.2 | |||
| Moyenne finale (programmes/paramètres) | -14% /
1% | -729% /
-395% | -833% /
-460% | -3% /
2% | -702% /
-386% |
* ... Moindre est la valeur, meilleures sont les performances
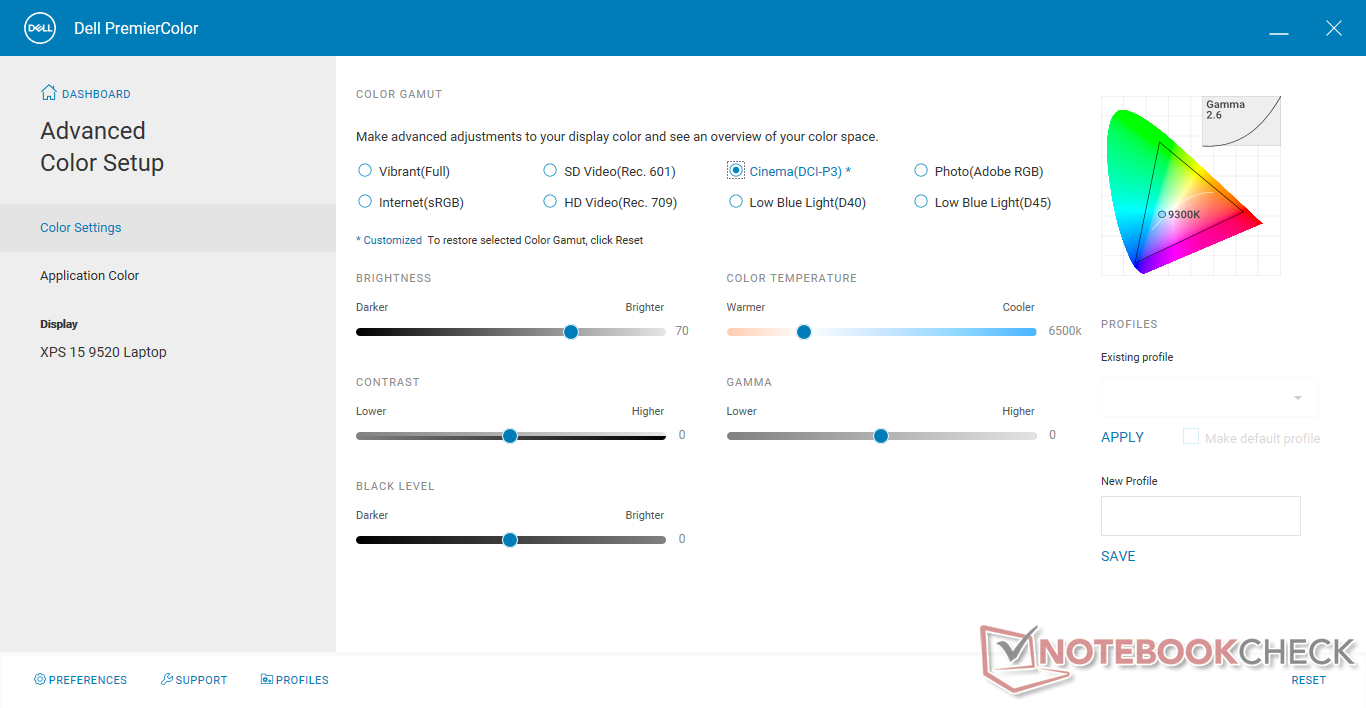
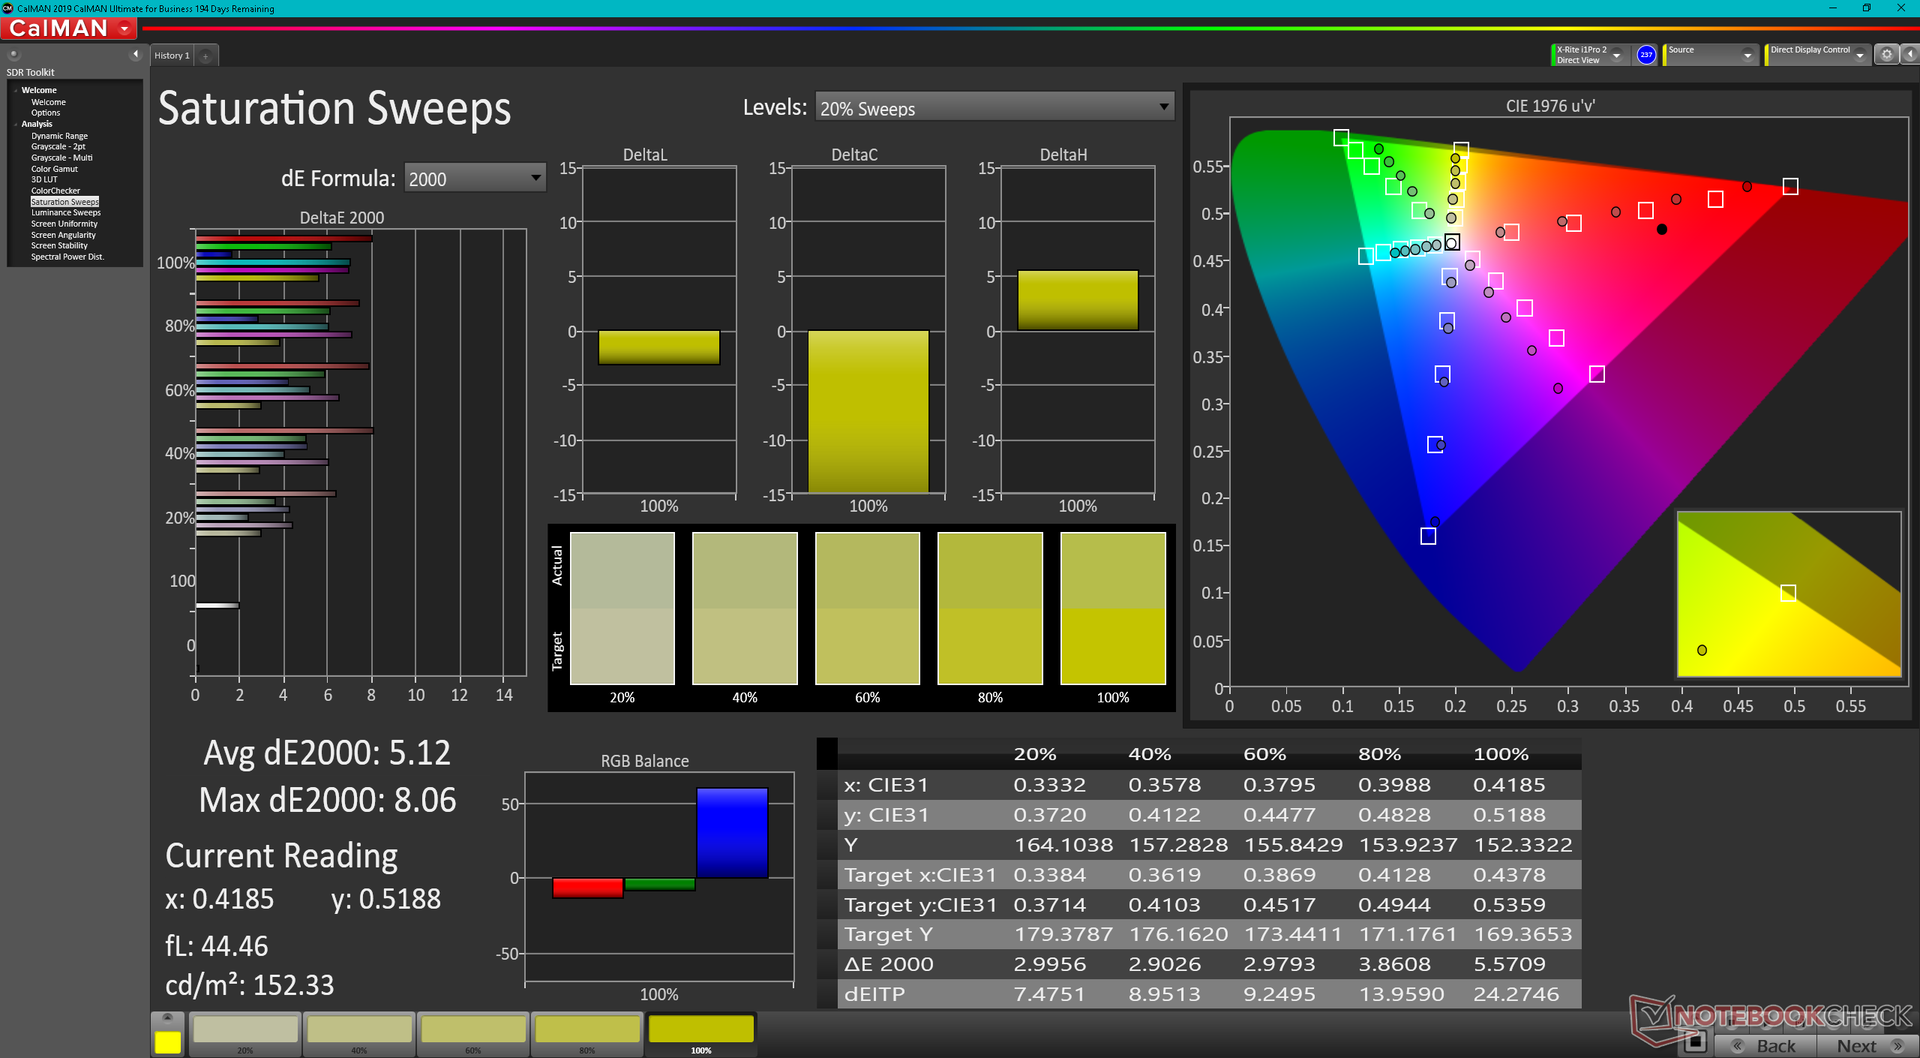
Bien que nous puissions confirmer une couverture DCI-P3 d'au moins 98 %, les couleurs de notre appareil n'ont pas été bien étalonnées par rapport à la norme, même lorsqu'elles ont été réglées sur DCI-P3 via le logiciel PremierColor.
Temps de réponse de l'écran
| ↔ Temps de réponse noir à blanc | ||
|---|---|---|
| 1.9 ms ... hausse ↗ et chute ↘ combinées | ↗ 1.1 ms hausse | 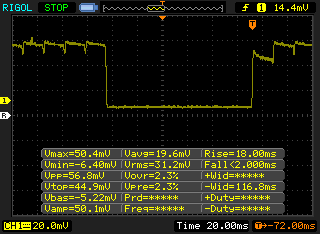 |
| ↘ 0.8 ms chute | ||
| L'écran montre de très faibles temps de réponse, parfait pour le jeu. En comparaison, tous les appareils testés affichent entre 0.1 (minimum) et 240 (maximum) ms. » 11 % des appareils testés affichent de meilleures performances. Cela signifie que les latences relevées sont meilleures que la moyenne (19.8 ms) de tous les appareils testés. | ||
| ↔ Temps de réponse gris 50% à gris 80% | ||
| 1.9 ms ... hausse ↗ et chute ↘ combinées | ↗ 1.1 ms hausse | 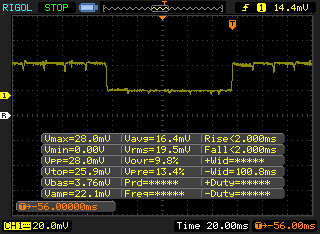 |
| ↘ 0.8 ms chute | ||
| L'écran montre de très faibles temps de réponse, parfait pour le jeu. En comparaison, tous les appareils testés affichent entre 0.165 (minimum) et 636 (maximum) ms. » 9 % des appareils testés affichent de meilleures performances. Cela signifie que les latences relevées sont meilleures que la moyenne (31 ms) de tous les appareils testés. | ||
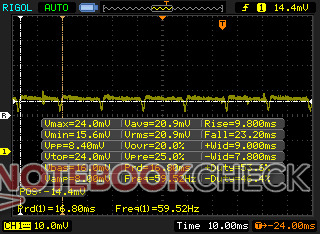
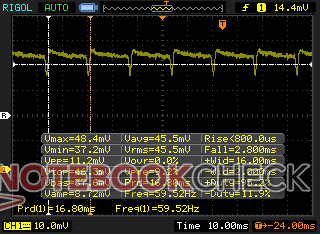
Scintillement / MLI (Modulation de largeur d'impulsion)
| Scintillement / MLI (Modulation de largeur d'impulsion) décelé | 59.52 Hz | ≤ 100 Niveau de luminosité | 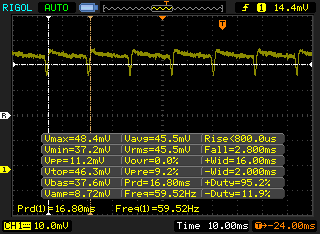 |
Le rétroéclairage de l'écran scintille à la fréquence de 59.52 Hz (certainement du fait de l'utilisation d'une MDI - Modulation de largeur d'impulsion) à un niveau de luminosité inférieur ou égal à 100 % . Aucun scintillement ne devrait être perceptible au-dessus de cette valeur. La fréquence de rafraîchissement de 59.52 Hz est extrêmement faible, de grands risques de fatigue oculaire accrue et de maux de tête en cas d'utilisation prolongée. En comparaison, 52 % des appareils testés n'emploient pas MDI pour assombrir leur écran. Nous avons relevé une moyenne à 7754 (minimum : 5 - maximum : 343500) Hz dans le cas où une MDI était active. | |||
Performances - Options Intel 12e génération
Conditions d'essai
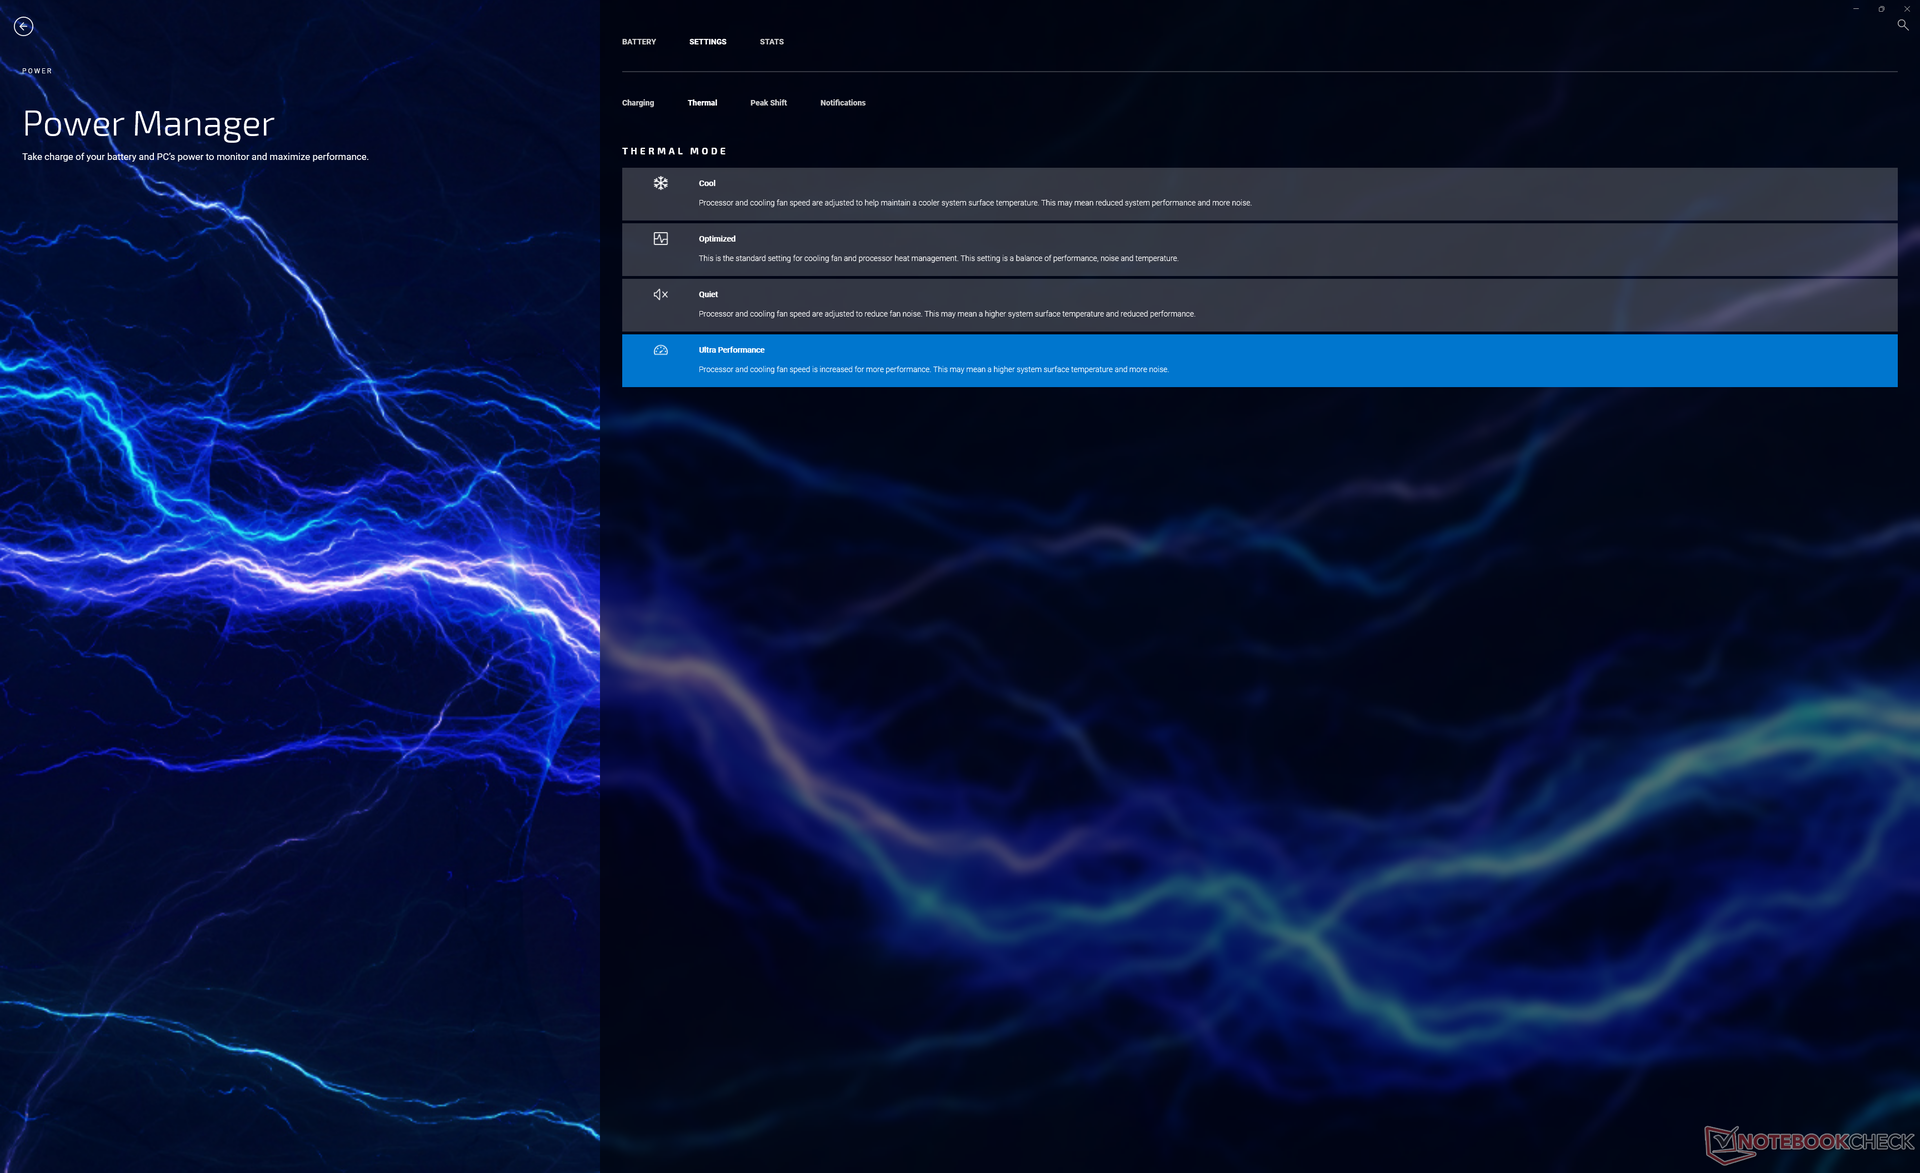
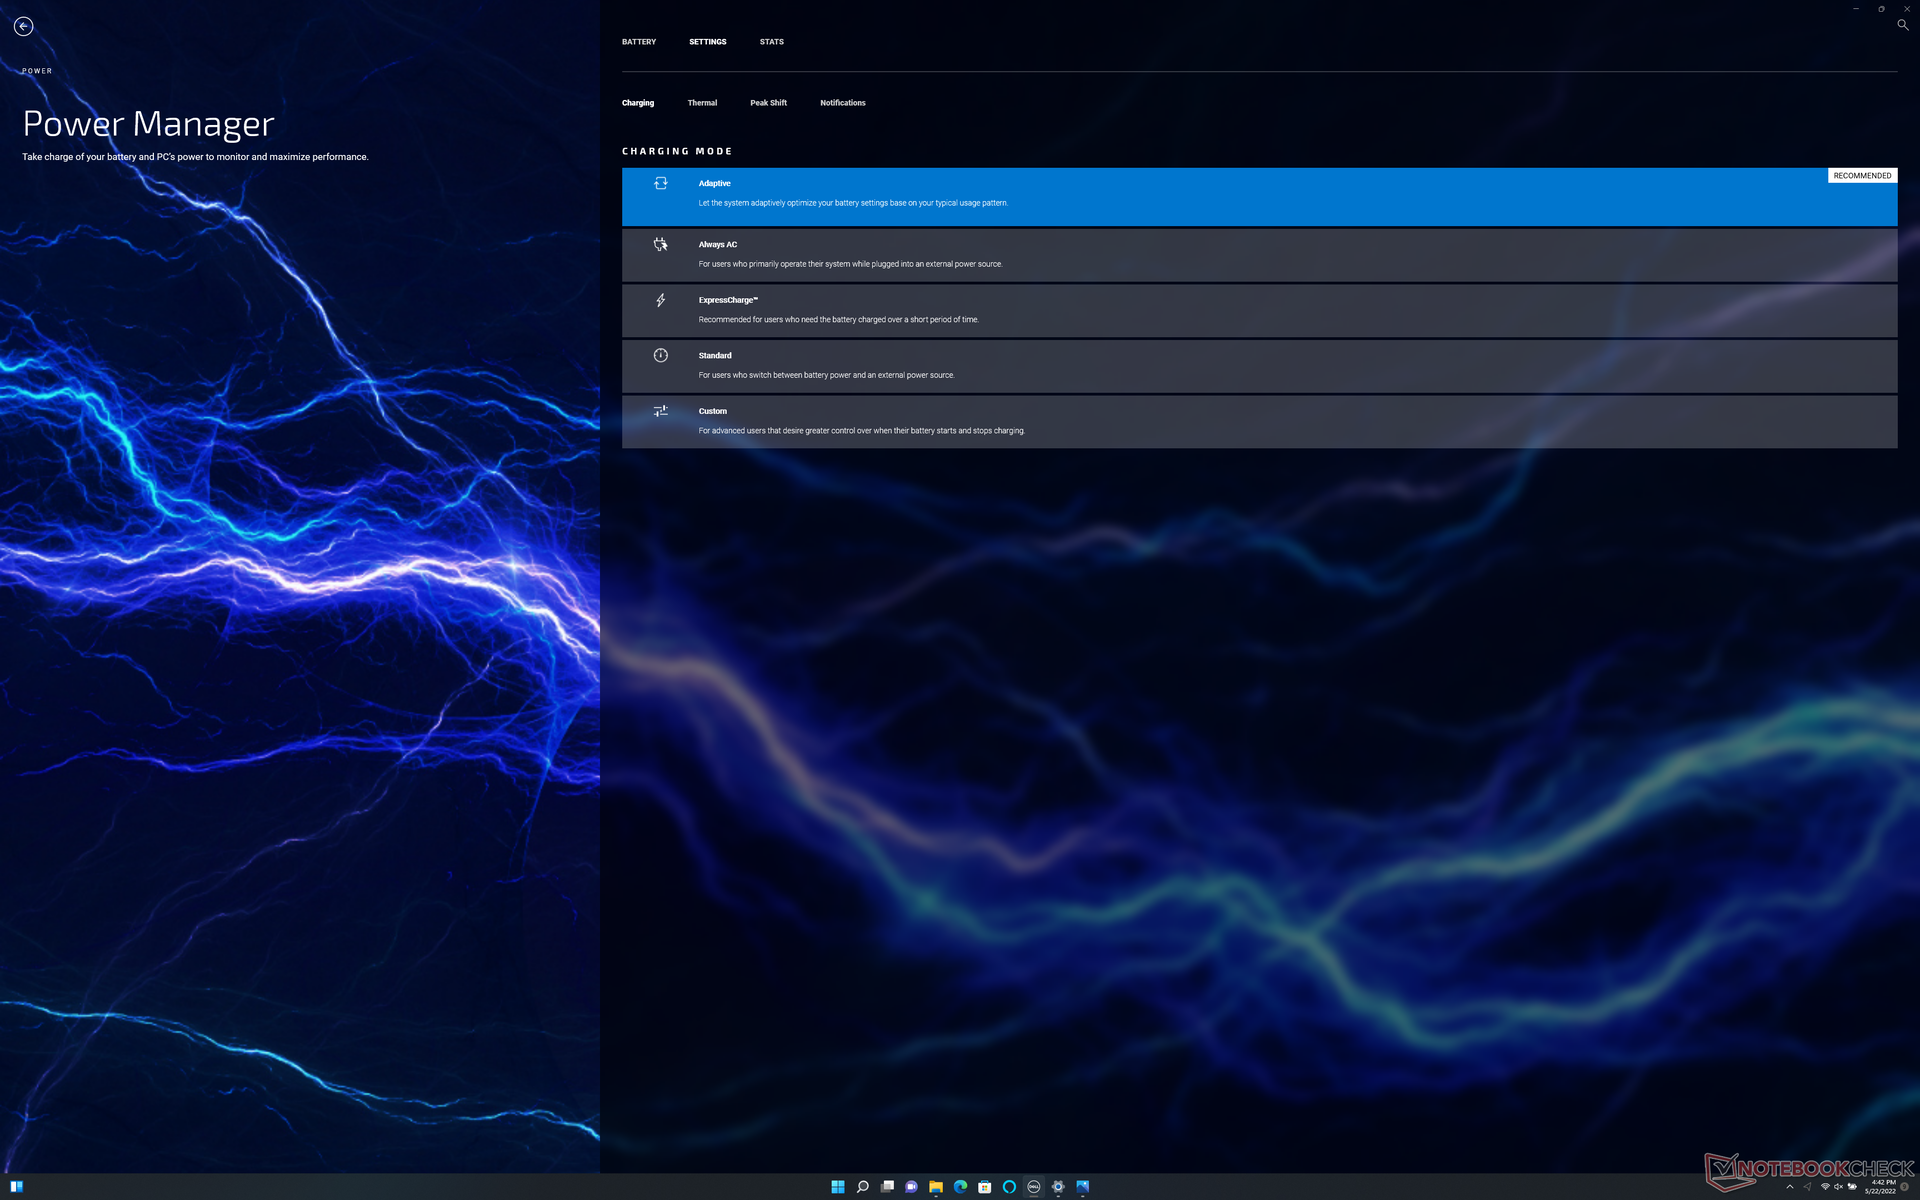
Notre appareil a été réglé en mode Performance via Windows et en mode Ultra Performance via l'application My Dell avant d'exécuter les tests de référence ci-dessous pour obtenir les meilleurs résultats possibles. Notez que l'application My Dell a effectivement remplacé l'ancien logiciel Dell Power Manager. Nous recommandons aux utilisateurs de se familiariser avec la nouvelle application, car elle constitue le guichet unique pour les mises à jour et les paramètres de performance de Dell
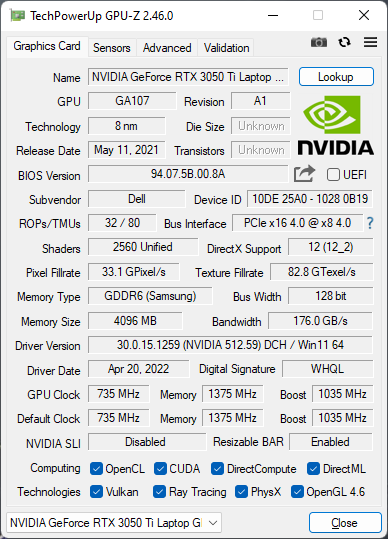
Le GPU 45 W TGP GeForce RTX 3050 Ti n'a pas changé par rapport au précédent XPS 15 9510. Il n'y a pas de commutateur MUX ou de synchronisation adaptative, puisque le XPS 15 n'est pas conçu pour le jeu.
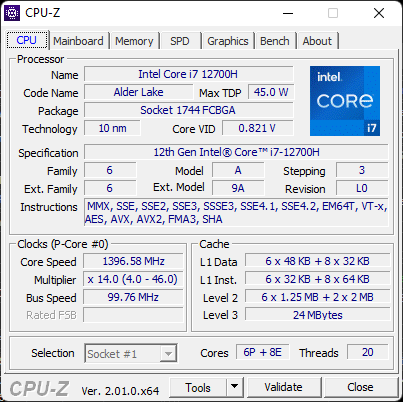
Processeur
L'augmentation des performances du processeur du XPS 15 9510 au 9520 est plus significative que l'augmentation des performances du processeur du XPS 9500 au 9510. En passant duCore i7-11800H du XPS 15 9510 au Core i7-12700H de notre 9520 permettra une augmentation de 35 à 40 % des performances multithread et de 15 à 20 % des performances single-thread. Ce bond est suffisant pour propulser le CPU Intel de 12e génération légèrement devant le populaire Ryzen 7 5800H qui a tristement surpassé la plupart des processeurs Intel Core-H de 11e génération dans les charges de travail multithread
Les performances du CPU auraient pu être meilleures malgré l'augmentation susmentionnée d'une année sur l'autre. Par rapport à plus de 20 autres ordinateurs portables que nous avons testés jusqu'à présent avec le même processeur Core i7-12700H, celui de notre XPS 15 9520 est plus lent que la moyenne d'environ 5 à 15 %. L'exécution de CineBench R15 xT en boucle montre que le CPU de Dell n'est pas capable de maintenir des fréquences d'horloge Turbo Boost élevées aussi longtemps que la plupart des autres ordinateurs portables équipés du même processeur. Des modèles comme leAsus TUF Gaming F15 FX507ZM peuvent faire tourner le même processeur jusqu'à 36 % plus vite que notre Dell.
Cinebench R15 Multi Loop
Cinebench R23: Multi Core | Single Core
Cinebench R15: CPU Multi 64Bit | CPU Single 64Bit
Blender: v2.79 BMW27 CPU
7-Zip 18.03: 7z b 4 | 7z b 4 -mmt1
Geekbench 5.5: Multi-Core | Single-Core
HWBOT x265 Benchmark v2.2: 4k Preset
LibreOffice : 20 Documents To PDF
R Benchmark 2.5: Overall mean
* ... Moindre est la valeur, meilleures sont les performances
AIDA64: FP32 Ray-Trace | FPU Julia | CPU SHA3 | CPU Queen | FPU SinJulia | FPU Mandel | CPU AES | CPU ZLib | FP64 Ray-Trace | CPU PhotoWorxx
| Performance rating | |
| Asus Zenbook Pro 15 OLED UM535Q | |
| Moyenne Intel Core i7-12700H | |
| Dell XPS 15 9520 RTX 3050 Ti | |
| Dell XPS 15 9500 Core i7 4K UHD | |
| Dell XPS 15 9510 11800H RTX 3050 Ti OLED -9! | |
| AIDA64 / FP32 Ray-Trace | |
| Asus Zenbook Pro 15 OLED UM535Q | |
| Moyenne Intel Core i7-12700H (2585 - 17957, n=64) | |
| Dell XPS 15 9500 Core i7 4K UHD | |
| Dell XPS 15 9520 RTX 3050 Ti | |
| AIDA64 / FPU Julia | |
| Asus Zenbook Pro 15 OLED UM535Q | |
| Dell XPS 15 9500 Core i7 4K UHD | |
| Moyenne Intel Core i7-12700H (12439 - 90760, n=64) | |
| Dell XPS 15 9520 RTX 3050 Ti | |
| AIDA64 / CPU SHA3 | |
| Asus Zenbook Pro 15 OLED UM535Q | |
| Moyenne Intel Core i7-12700H (833 - 4242, n=64) | |
| Dell XPS 15 9500 Core i7 4K UHD | |
| Dell XPS 15 9520 RTX 3050 Ti | |
| AIDA64 / CPU Queen | |
| Asus Zenbook Pro 15 OLED UM535Q | |
| Dell XPS 15 9520 RTX 3050 Ti | |
| Moyenne Intel Core i7-12700H (57923 - 103202, n=63) | |
| Dell XPS 15 9500 Core i7 4K UHD | |
| AIDA64 / FPU SinJulia | |
| Asus Zenbook Pro 15 OLED UM535Q | |
| Dell XPS 15 9500 Core i7 4K UHD | |
| Moyenne Intel Core i7-12700H (3249 - 9939, n=64) | |
| Dell XPS 15 9520 RTX 3050 Ti | |
| AIDA64 / FPU Mandel | |
| Asus Zenbook Pro 15 OLED UM535Q | |
| Dell XPS 15 9500 Core i7 4K UHD | |
| Moyenne Intel Core i7-12700H (7135 - 44760, n=64) | |
| Dell XPS 15 9520 RTX 3050 Ti | |
| AIDA64 / CPU AES | |
| Asus Zenbook Pro 15 OLED UM535Q | |
| Moyenne Intel Core i7-12700H (31839 - 144360, n=64) | |
| Dell XPS 15 9520 RTX 3050 Ti | |
| Dell XPS 15 9500 Core i7 4K UHD | |
| AIDA64 / CPU ZLib | |
| Moyenne Intel Core i7-12700H (305 - 1171, n=64) | |
| Dell XPS 15 9520 RTX 3050 Ti | |
| Asus Zenbook Pro 15 OLED UM535Q | |
| Dell XPS 15 9500 Core i7 4K UHD | |
| Dell XPS 15 9510 11800H RTX 3050 Ti OLED | |
| AIDA64 / FP64 Ray-Trace | |
| Asus Zenbook Pro 15 OLED UM535Q | |
| Moyenne Intel Core i7-12700H (1437 - 9692, n=64) | |
| Dell XPS 15 9520 RTX 3050 Ti | |
| Dell XPS 15 9500 Core i7 4K UHD | |
| AIDA64 / CPU PhotoWorxx | |
| Dell XPS 15 9520 RTX 3050 Ti | |
| Moyenne Intel Core i7-12700H (12863 - 52207, n=64) | |
| Dell XPS 15 9500 Core i7 4K UHD | |
| Asus Zenbook Pro 15 OLED UM535Q | |
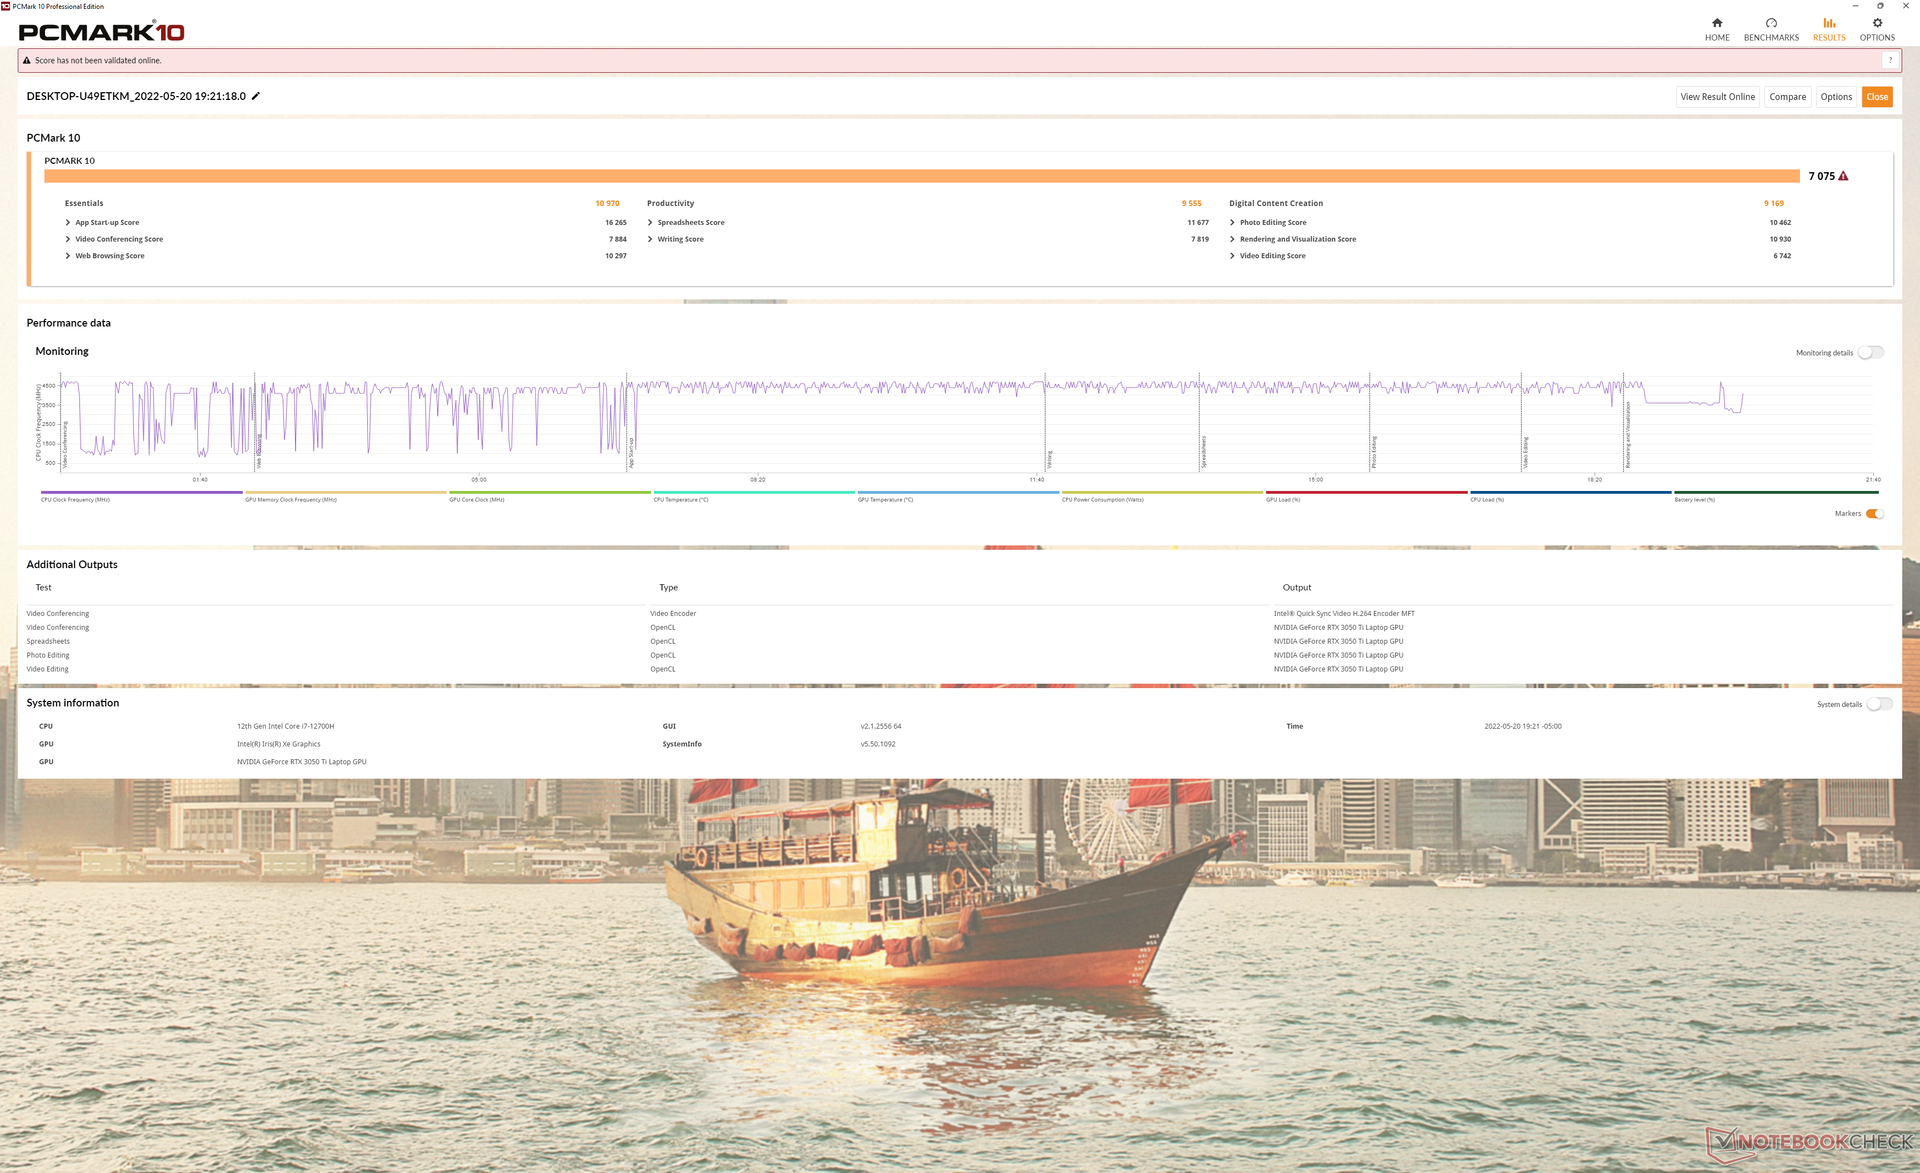
Performance du système
Les résultats de PCMark 10 sont systématiquement supérieurs à ceux que nous avons enregistrés sur les anciens XPS 15 9510 et 9500, en grande partie grâce à l'augmentation des performances du CPU et du SSD.
CrossMark: Overall | Productivity | Creativity | Responsiveness
| PCMark 10 / Score | |
| Dell XPS 15 9520 RTX 3050 Ti | |
| Moyenne Intel Core i7-12700H, NVIDIA GeForce RTX 3050 Ti Laptop GPU (6623 - 7075, n=5) | |
| Asus Zenbook Pro 15 OLED UM535Q | |
| Dell XPS 15 9510 11800H RTX 3050 Ti OLED | |
| MSI Stealth 15M A11SEK | |
| Dell XPS 15 9500 Core i7 4K UHD | |
| HP Spectre X360 15-5ZV31AV | |
| PCMark 10 / Essentials | |
| Dell XPS 15 9520 RTX 3050 Ti | |
| Asus Zenbook Pro 15 OLED UM535Q | |
| Moyenne Intel Core i7-12700H, NVIDIA GeForce RTX 3050 Ti Laptop GPU (9540 - 10970, n=5) | |
| Dell XPS 15 9500 Core i7 4K UHD | |
| MSI Stealth 15M A11SEK | |
| Dell XPS 15 9510 11800H RTX 3050 Ti OLED | |
| HP Spectre X360 15-5ZV31AV | |
| PCMark 10 / Productivity | |
| Asus Zenbook Pro 15 OLED UM535Q | |
| Dell XPS 15 9520 RTX 3050 Ti | |
| Moyenne Intel Core i7-12700H, NVIDIA GeForce RTX 3050 Ti Laptop GPU (8530 - 9555, n=5) | |
| MSI Stealth 15M A11SEK | |
| Dell XPS 15 9510 11800H RTX 3050 Ti OLED | |
| Dell XPS 15 9500 Core i7 4K UHD | |
| HP Spectre X360 15-5ZV31AV | |
| PCMark 10 / Digital Content Creation | |
| Moyenne Intel Core i7-12700H, NVIDIA GeForce RTX 3050 Ti Laptop GPU (8855 - 9542, n=5) | |
| Dell XPS 15 9520 RTX 3050 Ti | |
| Asus Zenbook Pro 15 OLED UM535Q | |
| Dell XPS 15 9510 11800H RTX 3050 Ti OLED | |
| MSI Stealth 15M A11SEK | |
| Dell XPS 15 9500 Core i7 4K UHD | |
| HP Spectre X360 15-5ZV31AV | |
| CrossMark / Overall | |
| Dell XPS 15 9520 RTX 3050 Ti | |
| Moyenne Intel Core i7-12700H, NVIDIA GeForce RTX 3050 Ti Laptop GPU (1654 - 1872, n=5) | |
| Asus Zenbook Pro 15 OLED UM535Q | |
| CrossMark / Productivity | |
| Dell XPS 15 9520 RTX 3050 Ti | |
| Moyenne Intel Core i7-12700H, NVIDIA GeForce RTX 3050 Ti Laptop GPU (1595 - 1792, n=5) | |
| Asus Zenbook Pro 15 OLED UM535Q | |
| CrossMark / Creativity | |
| Dell XPS 15 9520 RTX 3050 Ti | |
| Moyenne Intel Core i7-12700H, NVIDIA GeForce RTX 3050 Ti Laptop GPU (1699 - 1993, n=5) | |
| Asus Zenbook Pro 15 OLED UM535Q | |
| CrossMark / Responsiveness | |
| Dell XPS 15 9520 RTX 3050 Ti | |
| Moyenne Intel Core i7-12700H, NVIDIA GeForce RTX 3050 Ti Laptop GPU (1383 - 1768, n=5) | |
| Asus Zenbook Pro 15 OLED UM535Q | |
| PCMark 10 Score | 7075 points | |
Aide | ||
| AIDA64 / Memory Copy | |
| Dell XPS 15 9520 RTX 3050 Ti | |
| Moyenne Intel Core i7-12700H (25615 - 80511, n=64) | |
| Asus Zenbook Pro 15 OLED UM535Q | |
| Dell XPS 15 9500 Core i7 4K UHD | |
| AIDA64 / Memory Read | |
| Dell XPS 15 9520 RTX 3050 Ti | |
| Moyenne Intel Core i7-12700H (25586 - 79442, n=64) | |
| Asus Zenbook Pro 15 OLED UM535Q | |
| Dell XPS 15 9500 Core i7 4K UHD | |
| AIDA64 / Memory Write | |
| Dell XPS 15 9520 RTX 3050 Ti | |
| Moyenne Intel Core i7-12700H (23679 - 88660, n=64) | |
| Asus Zenbook Pro 15 OLED UM535Q | |
| Dell XPS 15 9500 Core i7 4K UHD | |
| AIDA64 / Memory Latency | |
| Dell XPS 15 9520 RTX 3050 Ti | |
| Asus Zenbook Pro 15 OLED UM535Q | |
| Moyenne Intel Core i7-12700H (76.2 - 133.9, n=62) | |
| Dell XPS 15 9500 Core i7 4K UHD | |
| Dell XPS 15 9510 11800H RTX 3050 Ti OLED | |
* ... Moindre est la valeur, meilleures sont les performances
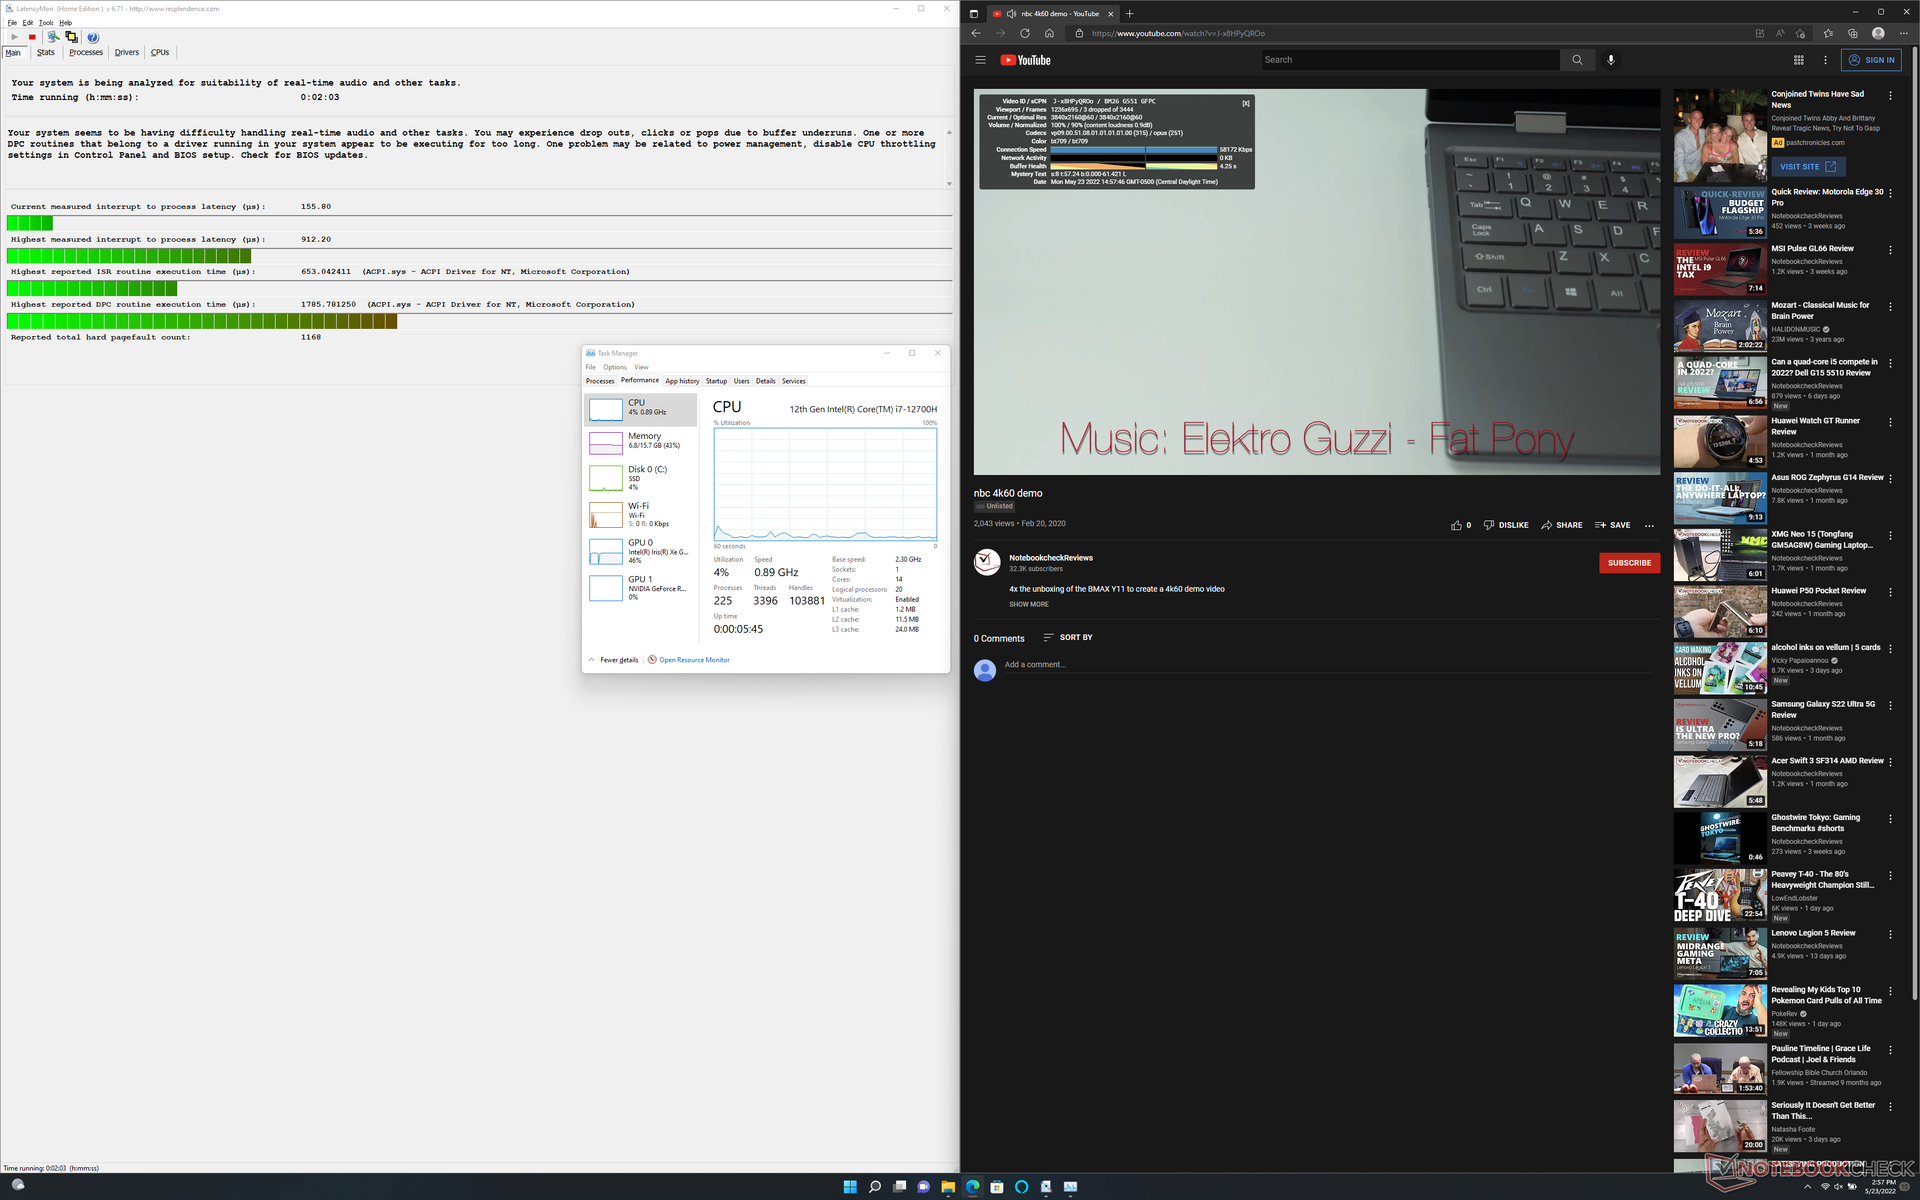
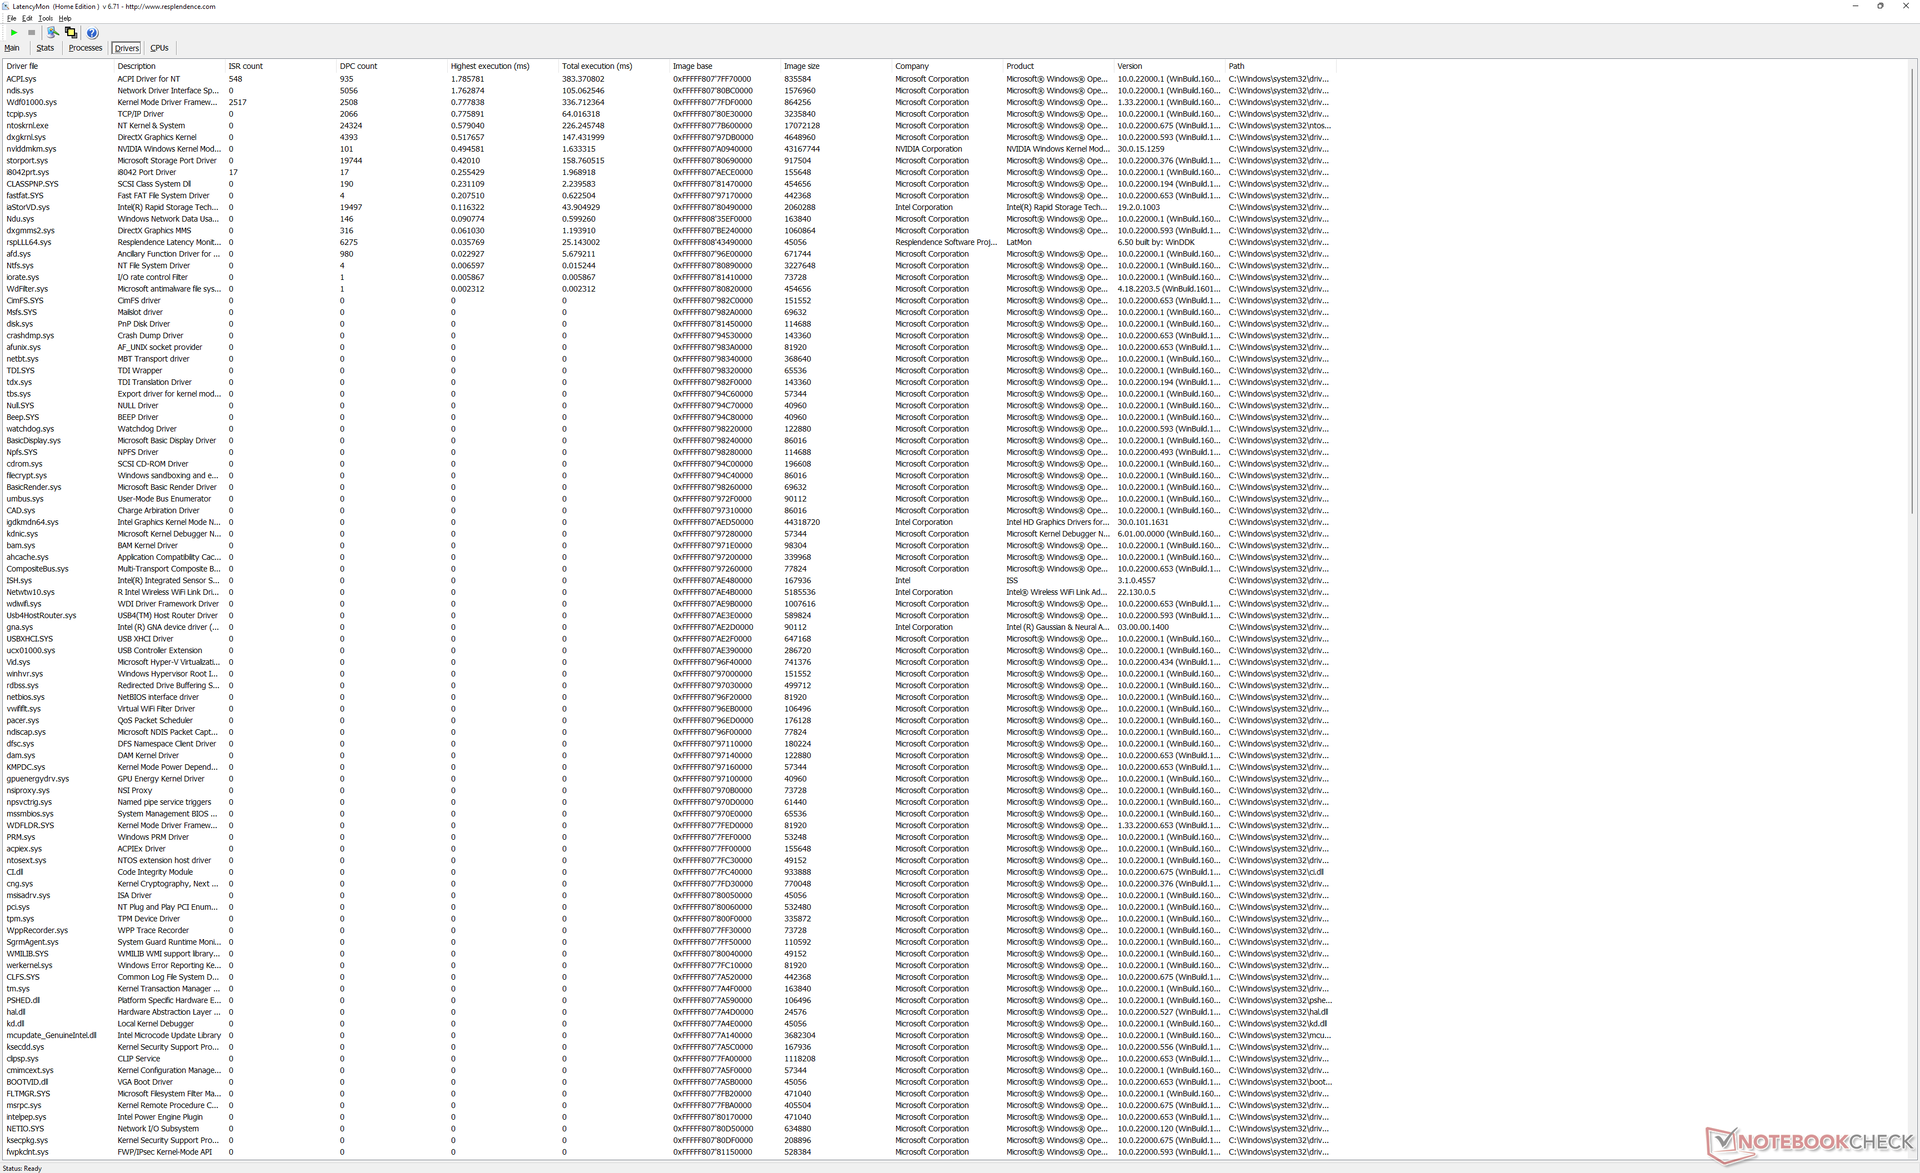
Latence DPC
LatencyMon révèle des problèmes mineurs de DPC lors de l'ouverture de plusieurs onglets de navigateur sur notre page d'accueil. la lecture de vidéos 4K à 60 FPS est autrement fluide et avec seulement 3 images perdues pendant notre test vidéo d'une minute.
| DPC Latencies / LatencyMon - interrupt to process latency (max), Web, Youtube, Prime95 | |
| Dell XPS 15 9500 Core i7 4K UHD | |
| Dell XPS 15 9510 11800H RTX 3050 Ti OLED | |
| Dell XPS 15 9520 RTX 3050 Ti | |
| MSI Stealth 15M A11SEK | |
| Asus Zenbook Pro 15 OLED UM535Q | |
* ... Moindre est la valeur, meilleures sont les performances
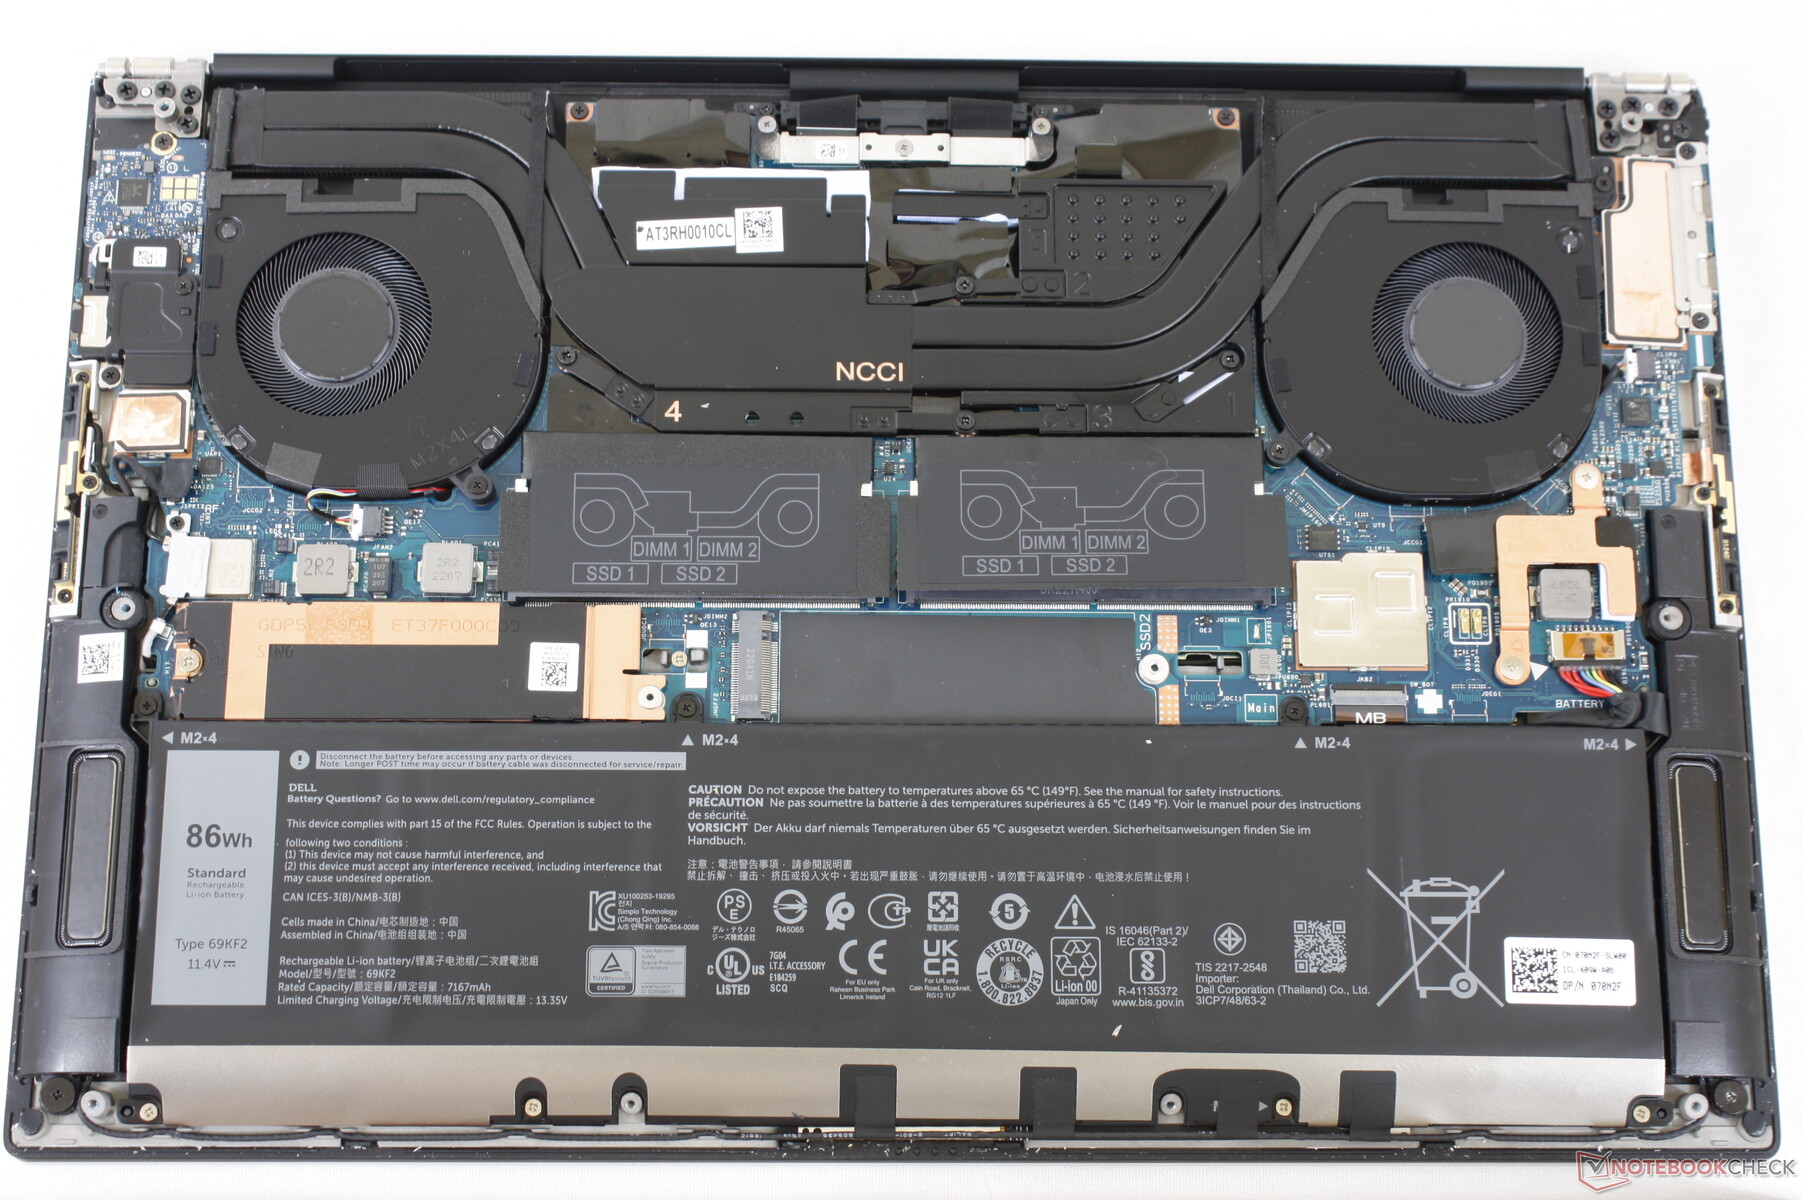
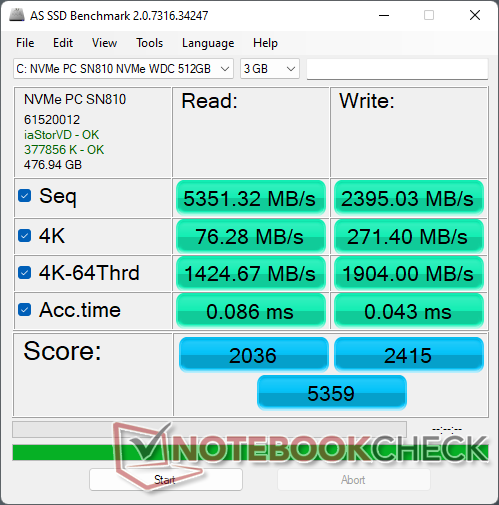
Périphériques de stockage - Supporte jusqu'à deux SSD NVMe PCIe4
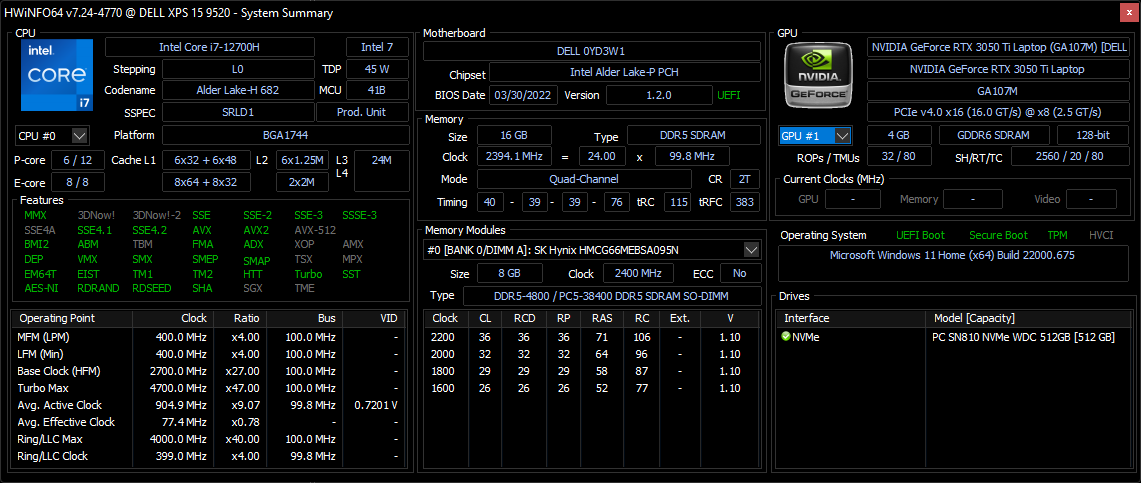
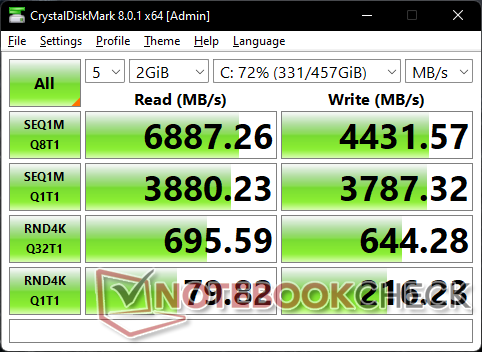
Notre unité d'essai est livrée avec une carte PCIe4 x4 Western Digital SN810 NVMe SSD par opposition aux solutions PCIe3 x4 des anciens modèles. Les taux de transfert sont donc nettement plus rapides, jusqu'à 6700 Mo/s, soit plus du double de ceux de la plupart des disques PCIe3. Le SN810 de notre unité n'a eu aucun problème à maintenir son taux de transfert maximal pendant de longues périodes lorsqu'il a été sollicité par DiskSpd, ce qui suggère une excellente dissipation de la chaleur.

* ... Moindre est la valeur, meilleures sont les performances
Disk Throttling: DiskSpd Read Loop, Queue Depth 8
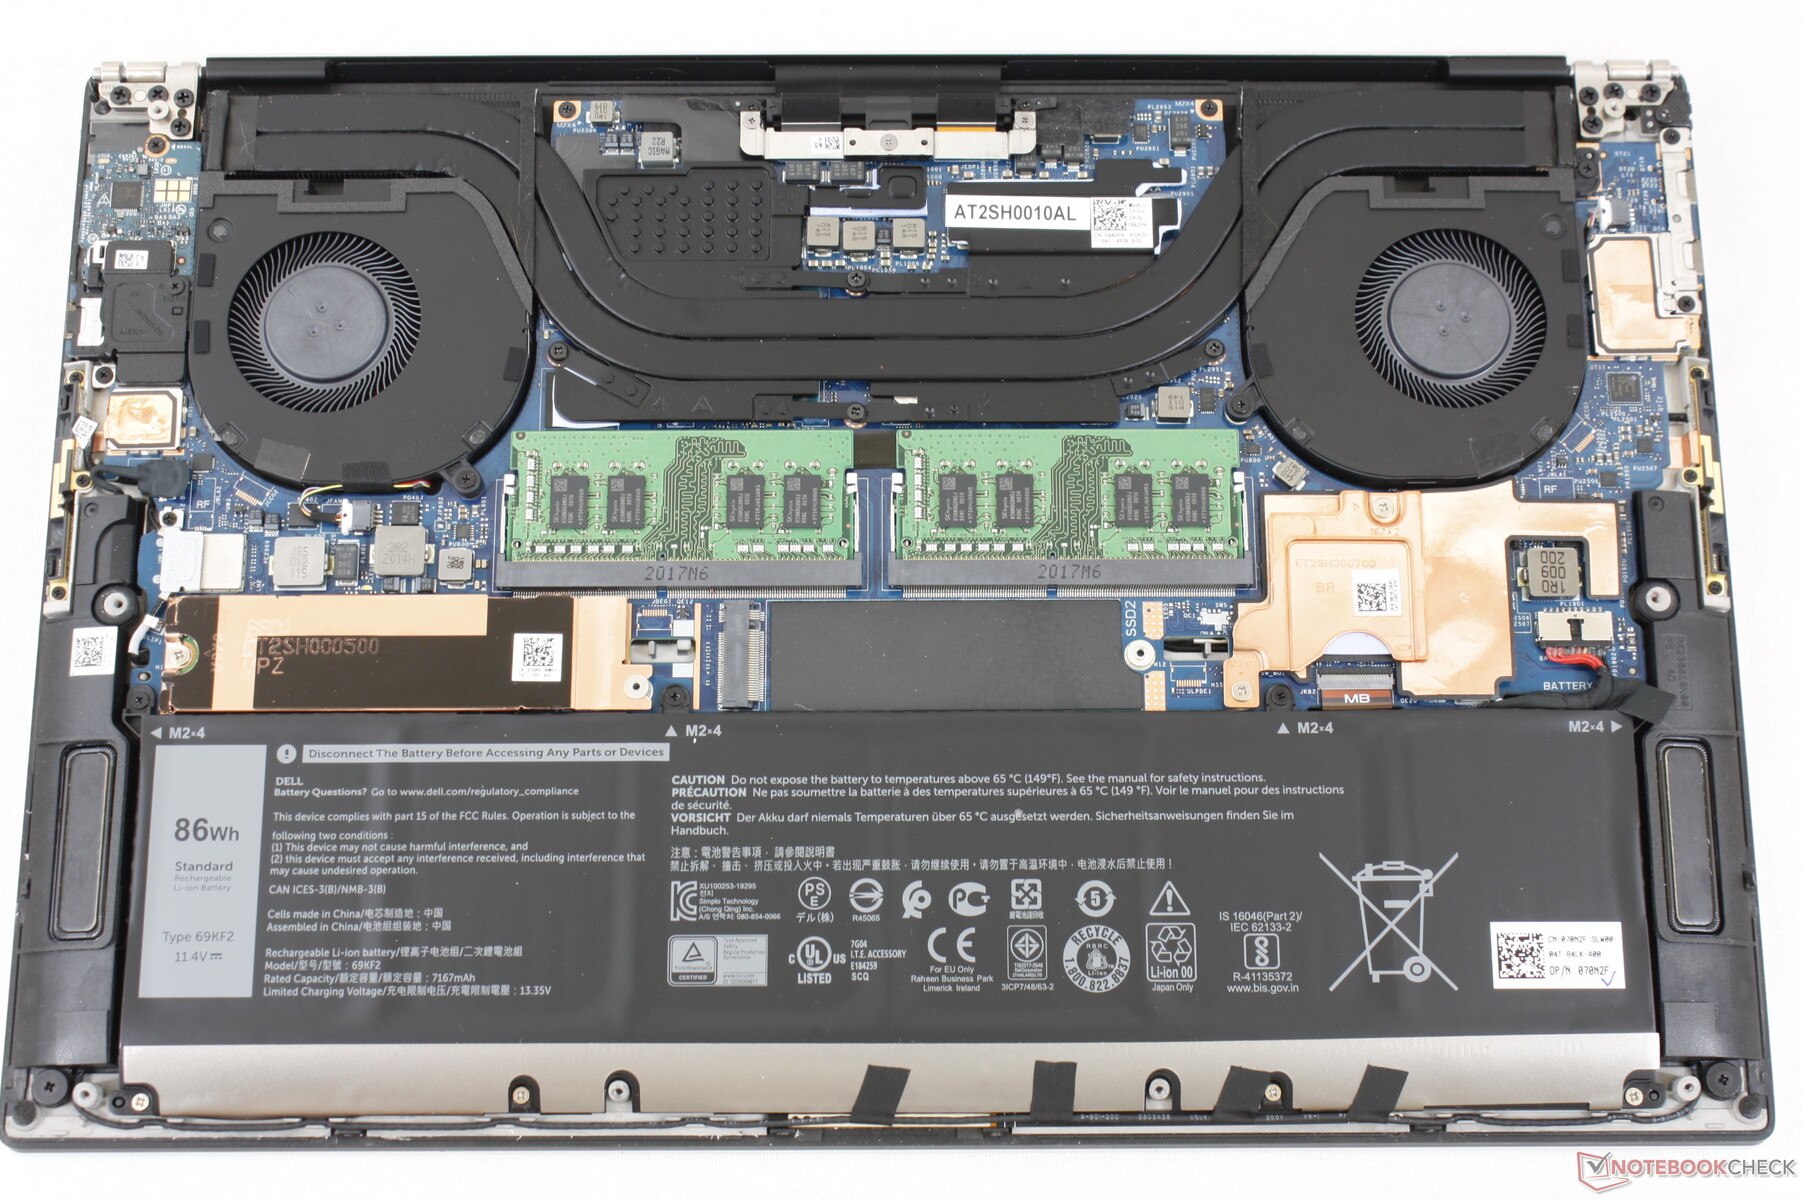
Performances des GPU - GeForce RTX 3050 Ti pour la deuxième année consécutive
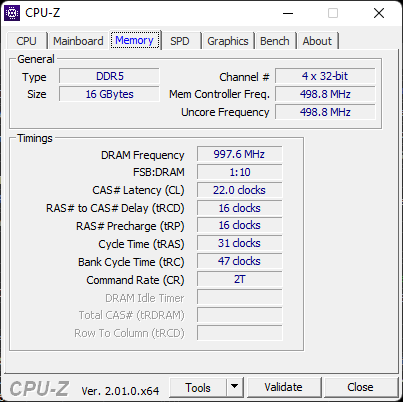
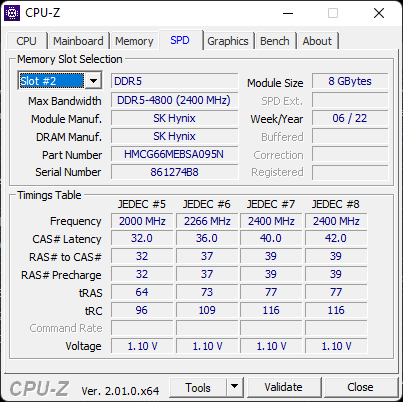
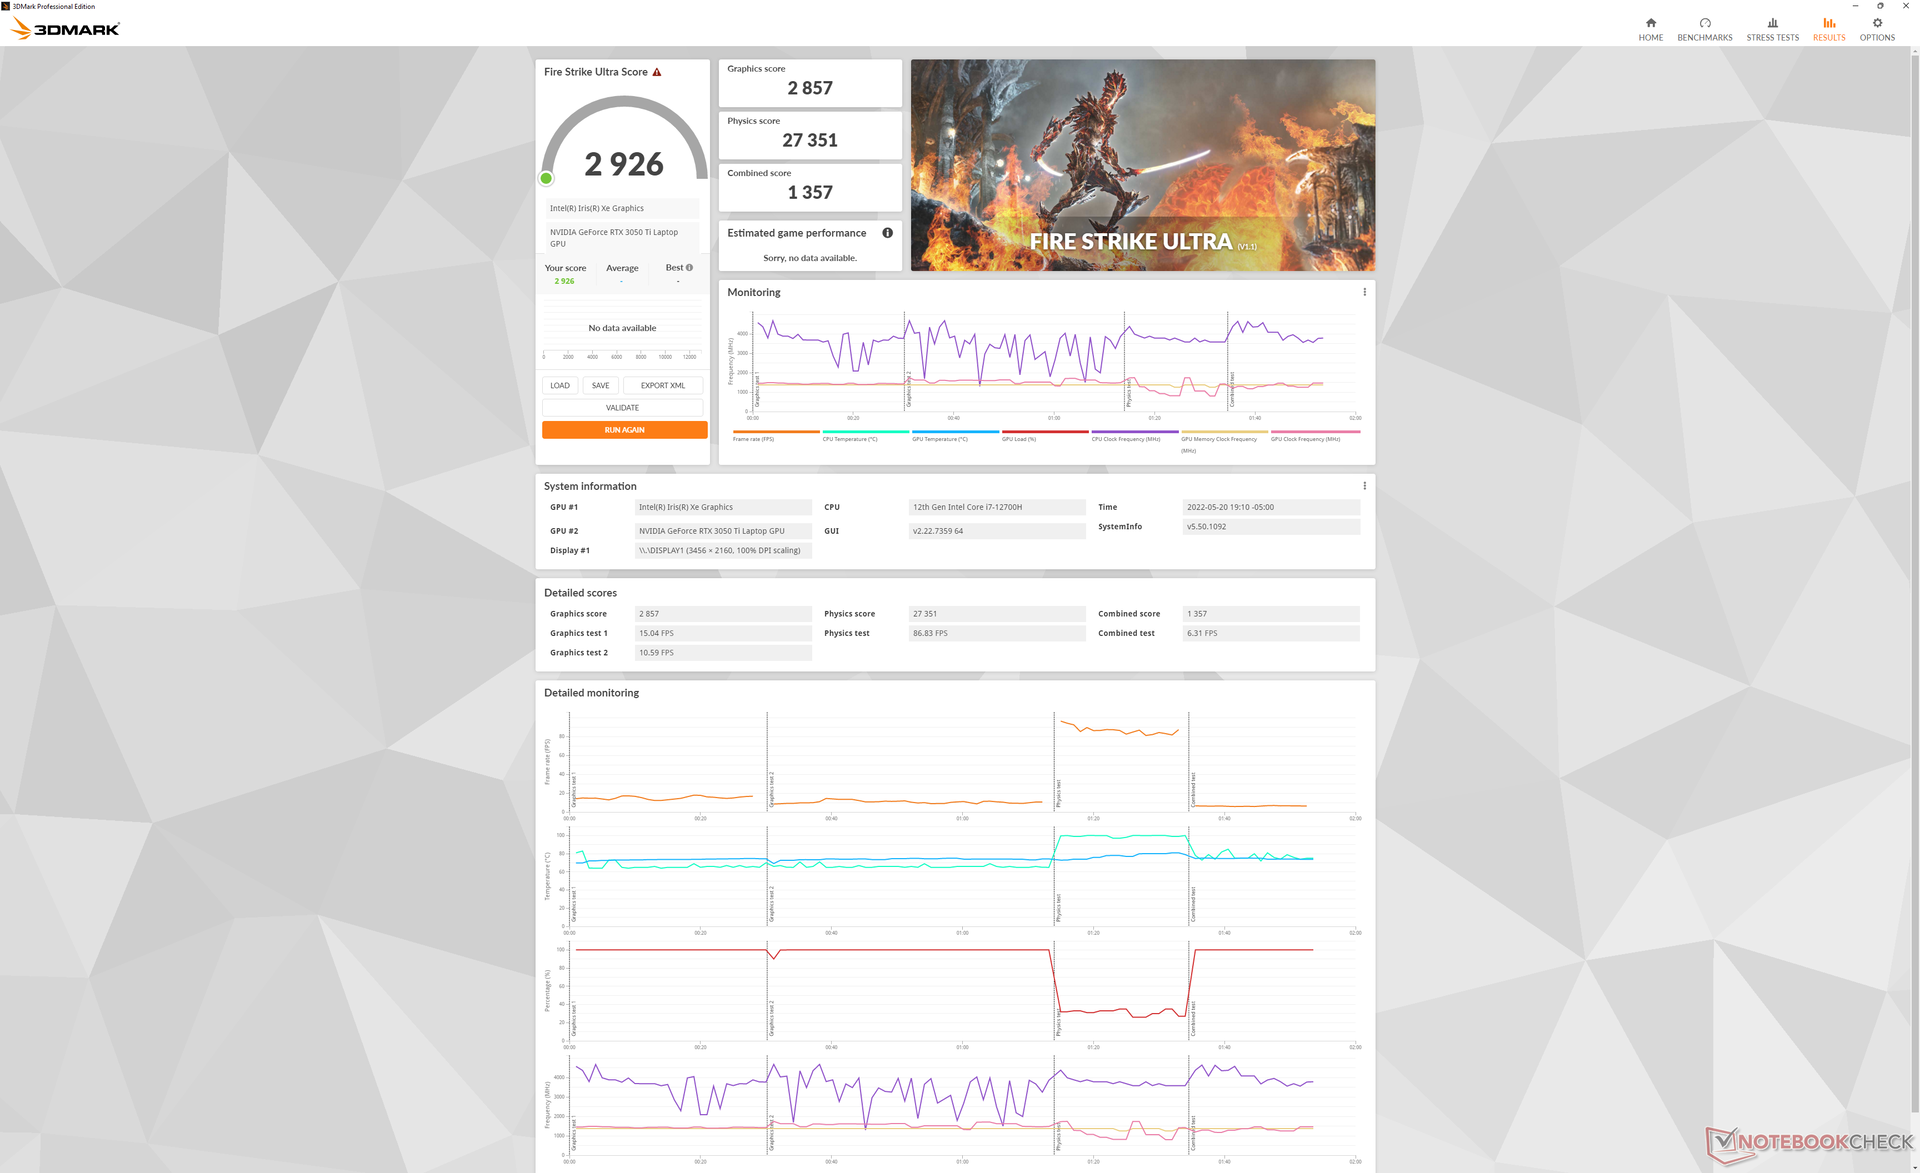
Le XPS 15 9520 est équipé d'une RAM plus rapide que celle du XPS 15 9510 (DDR5-4800 contre DDR4-3200), ce qui devrait se traduire par des performances graphiques légèrement supérieures. Malheureusement, Dell a réduit la fréquence d'horloge du GPU de 1530 MHz sur le XPS 15 9510 à 1035 MHz sur le 9520 et donc tous les gains de performance potentiels de la RAM plus rapide ont été annulés GeForce RTX 3050 Ti les résultats 3DMark entre les XPS 15 9510 et 9520 sont presque identiques.
La performance graphique reste environ 20 à 30 pour cent plus rapide que la GTX 1650 Ti sur l'ancien XPS 15 9500.
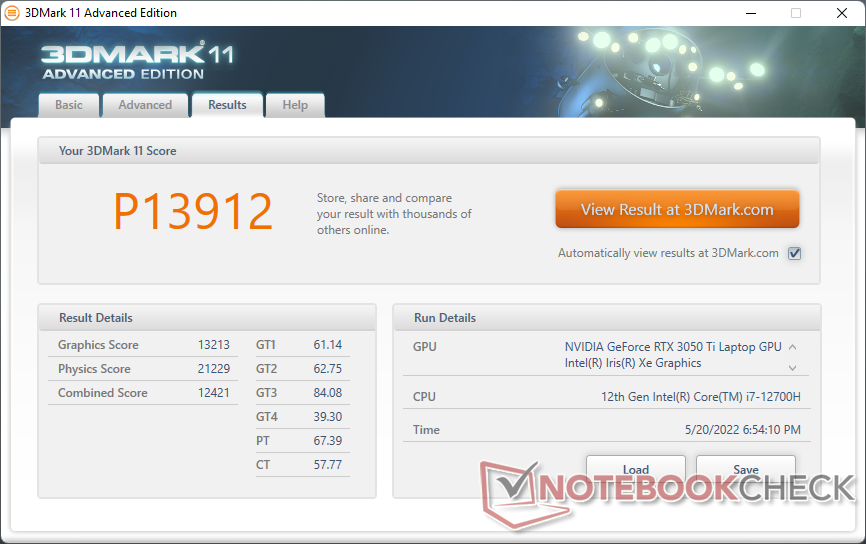
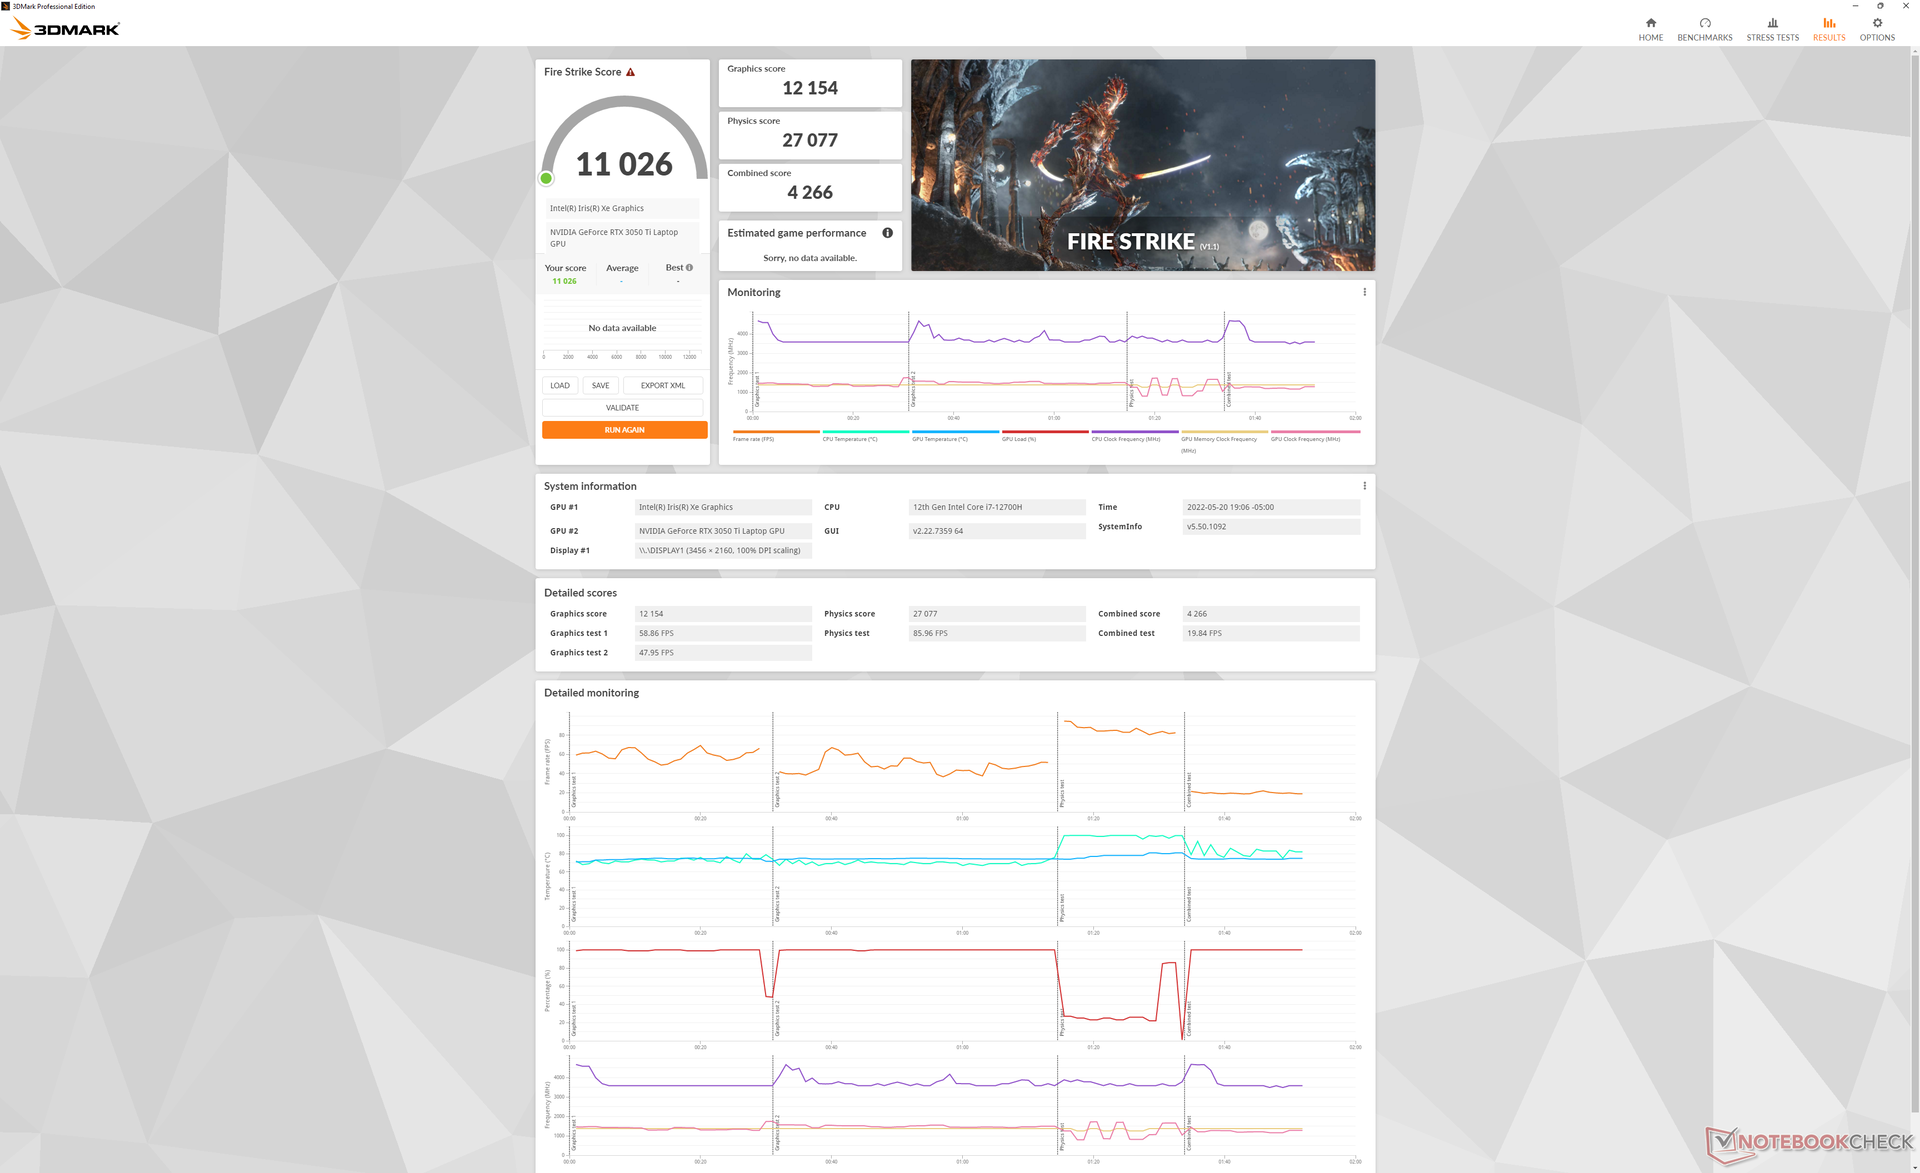
| 3DMark 11 Performance | 13912 points | |
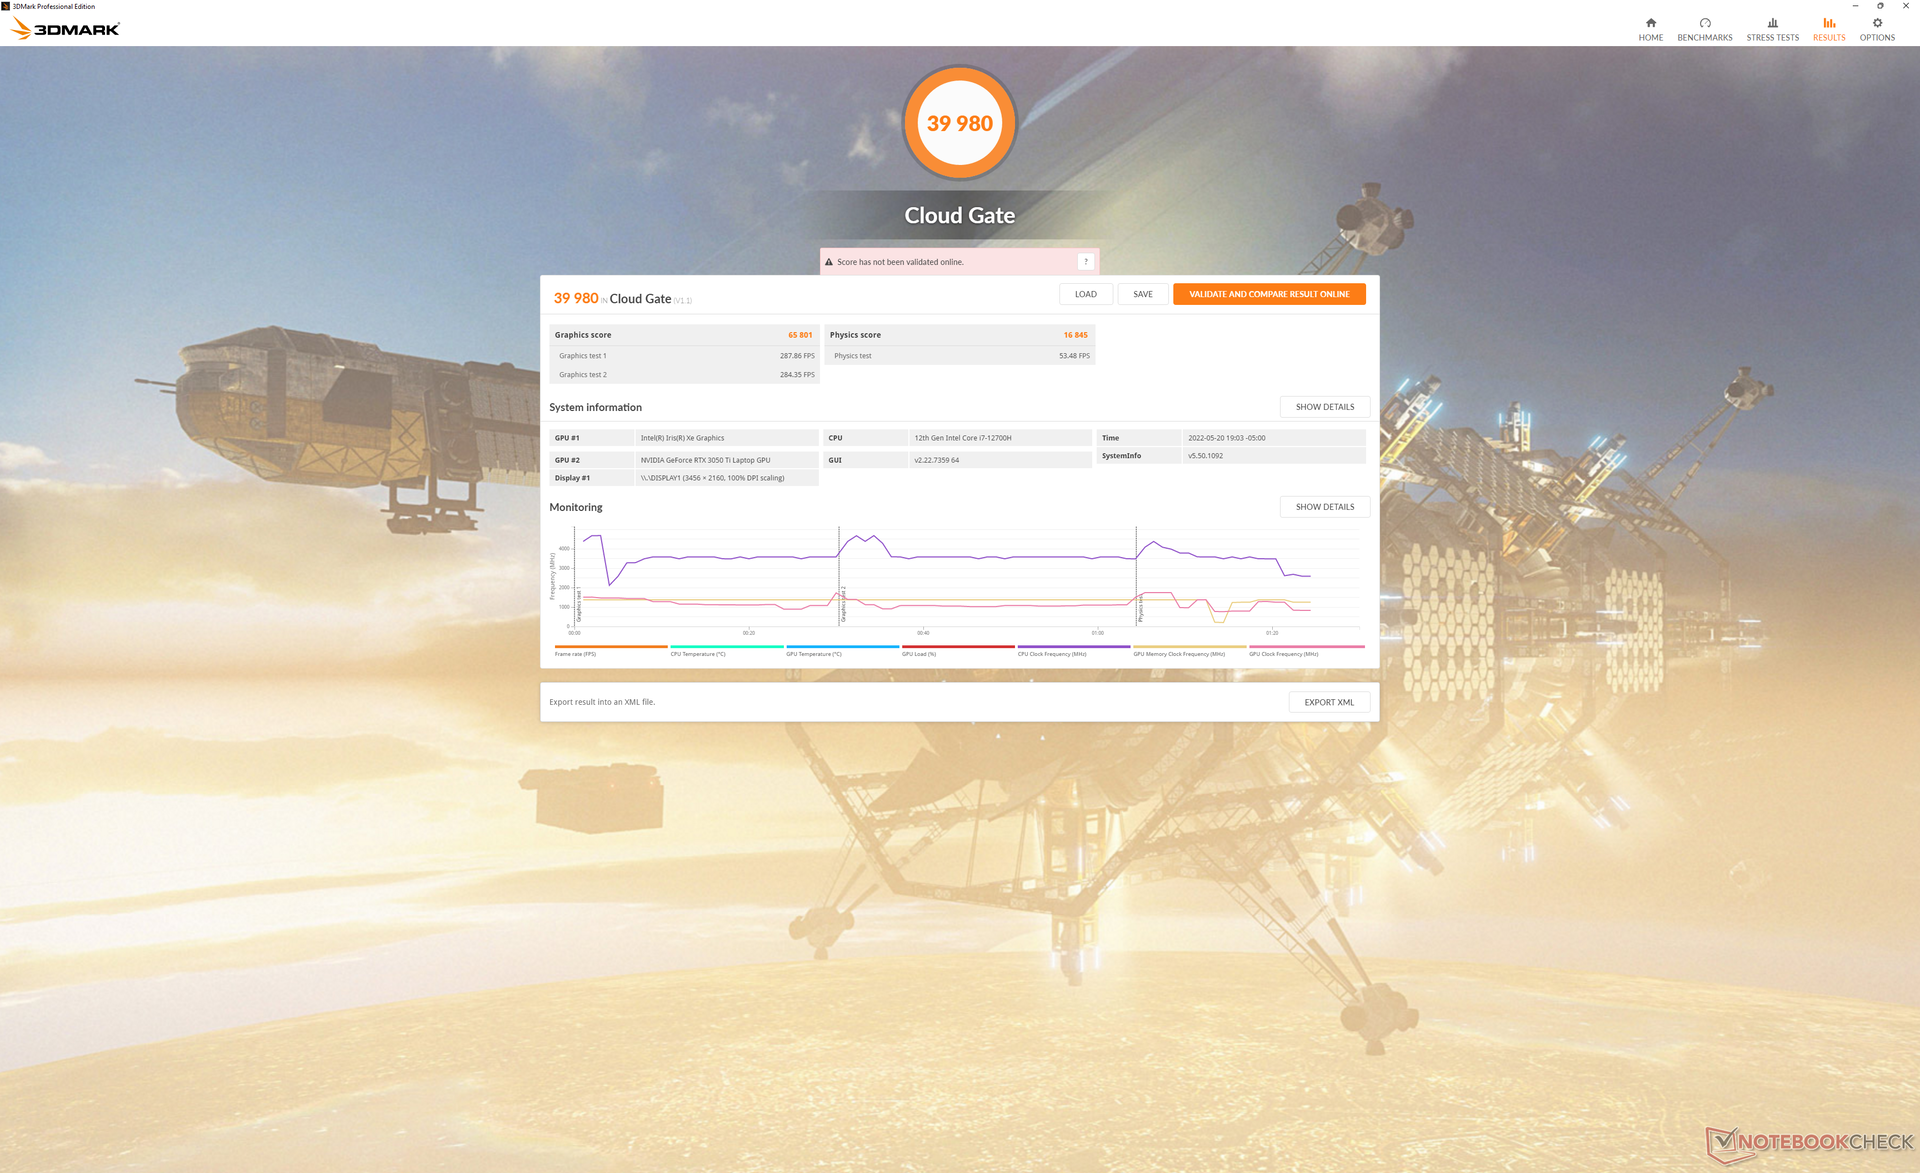
| 3DMark Cloud Gate Standard Score | 39980 points | |
| 3DMark Fire Strike Score | 11026 points | |
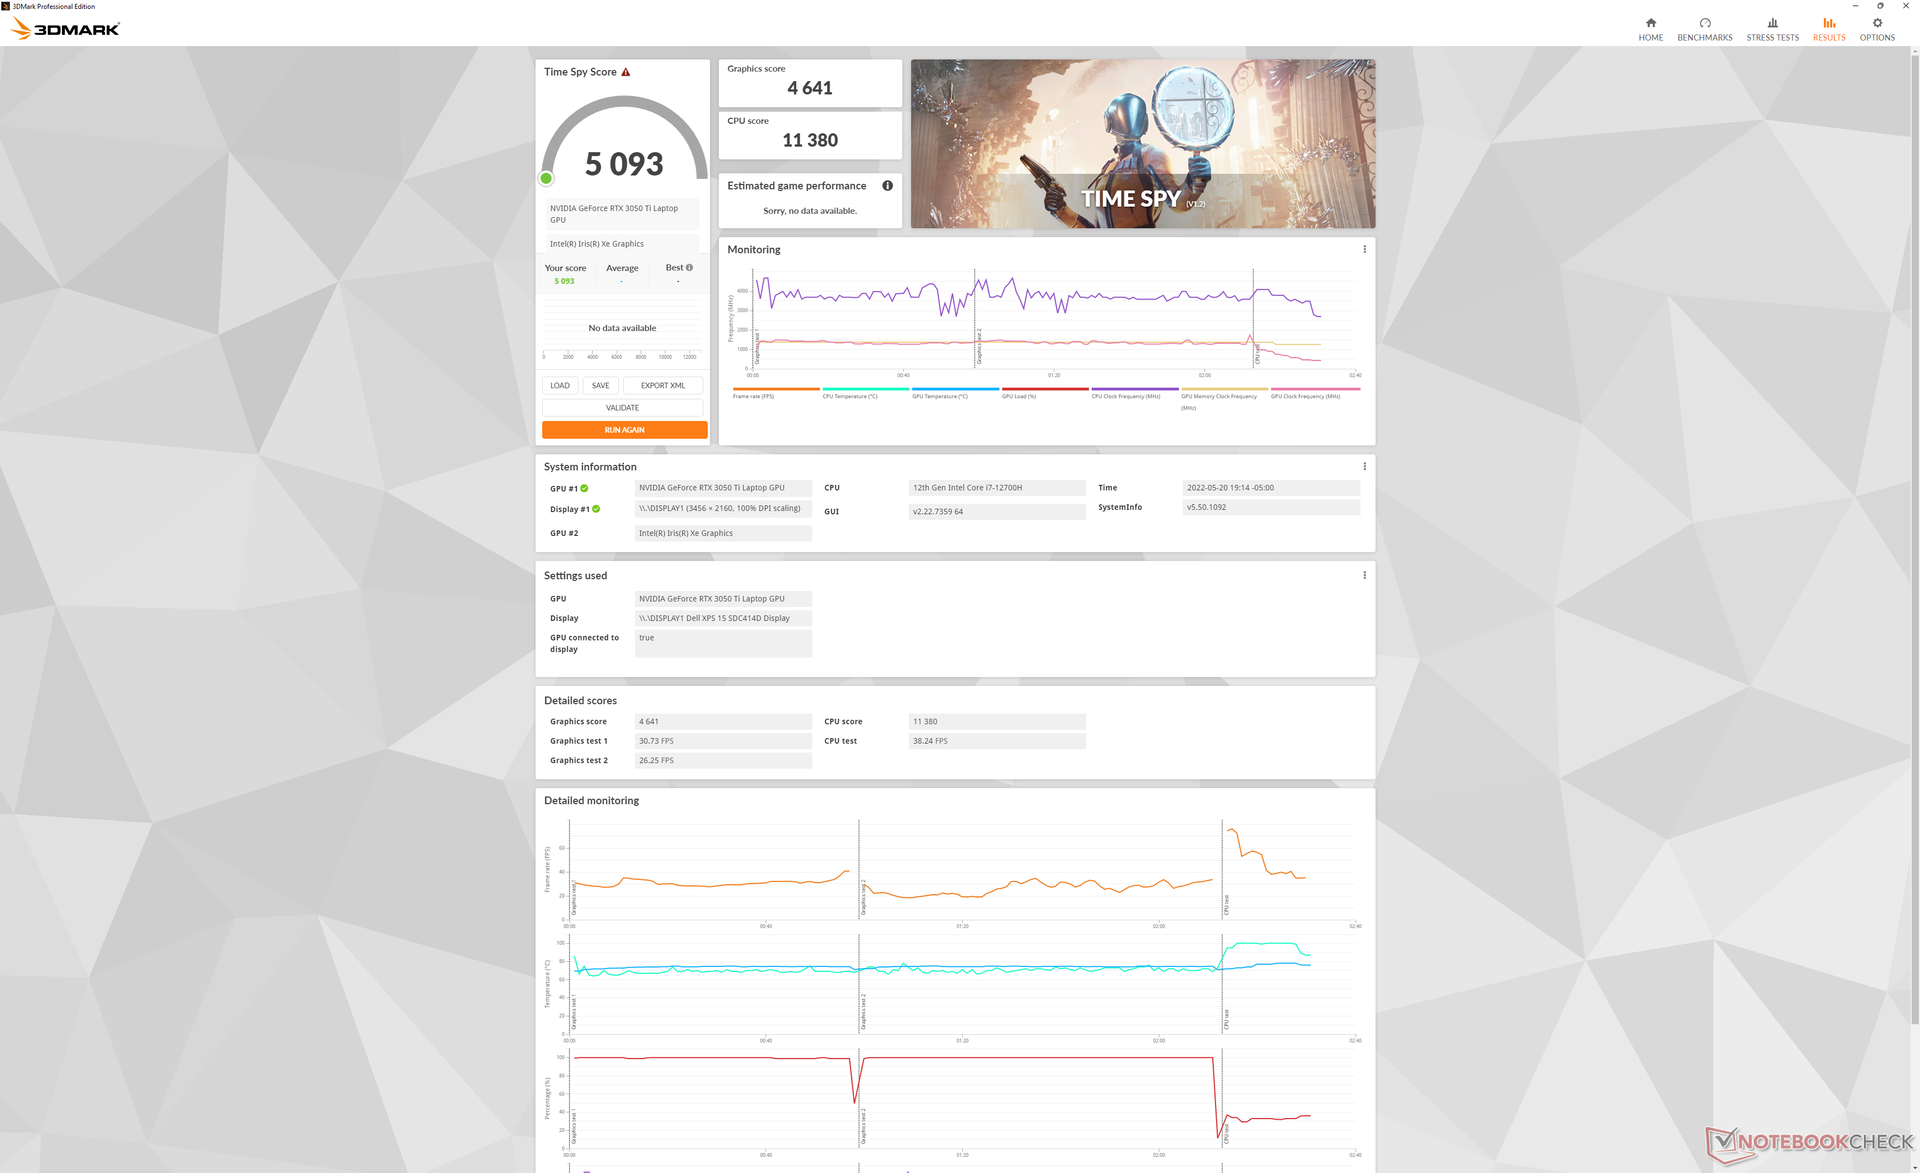
| 3DMark Time Spy Score | 5093 points | |
Aide | ||
Witcher 3 FPS Chart
| Bas | Moyen | Élevé | Ultra | QHD | 4K | |
|---|---|---|---|---|---|---|
| GTA V (2015) | 185 | 181.3 | 90.3 | 49.9 | 37.4 | |
| The Witcher 3 (2015) | 226.5 | 127.1 | 62.4 | 34.2 | ||
| Dota 2 Reborn (2015) | 180.3 | 166.1 | 116.1 | 104.5 | 47.1 | |
| Final Fantasy XV Benchmark (2018) | 106.6 | 62.9 | 45.7 | 34.1 | ||
| X-Plane 11.11 (2018) | 137.6 | 117 | 100.6 | 73.7 | ||
| Strange Brigade (2018) | 206 | 109.6 | 91.1 | 79.4 | 60.4 | |
| Cyberpunk 2077 1.6 (2022) | 59.4 | 47.4 | 39.3 | 39.5 | 20.2 |
Émissions
Bruit du système
Le bruit des ventilateurs semble être plus faible que sur les anciens modèles XPS lorsqu'ils sont soumis à des charges similaires. Ou, à tout le moins, les ventilateurs du 9520 mettent un peu plus de temps à monter en régime lorsque des charges exigeantes sont introduites. A la fin de la première scène du benchmark 3DMark 06, par exemple, le bruit des ventilateurs n'est que de 31 dB(A) comparé à 36 dB(A) et 46 dB(A) sur les XPS 15 9510 et 9500, respectivement. Le système est toujours plus silencieux que prévu dans la plupart des conditions, même lorsqu'il est réglé sur le mode Ultra Performance.
Degré de la nuisance sonore
| Au repos |
| 22.9 / 22.9 / 22.9 dB(A) |
| Fortement sollicité |
| 30.9 / 44.7 dB(A) |
 | ||
30 dB silencieux 40 dB(A) audible 50 dB(A) bruyant |
||
min: | ||
| Dell XPS 15 9520 RTX 3050 Ti GeForce RTX 3050 Ti Laptop GPU, i7-12700H, WDC PC SN810 512GB | Dell XPS 15 9510 11800H RTX 3050 Ti OLED GeForce RTX 3050 Ti Laptop GPU, i7-11800H, Micron 2300 512GB MTFDHBA512TDV | Dell XPS 15 9500 Core i7 4K UHD GeForce GTX 1650 Ti Mobile, i7-10875H, SK Hynix PC611 512GB | HP Spectre X360 15-5ZV31AV GeForce MX250, i7-10510U, Intel SSD 660p 2TB SSDPEKNW020T8 | Asus Zenbook Pro 15 OLED UM535Q GeForce RTX 3050 Ti Laptop GPU, R9 5900HX, WDC PC SN730 SDBPNTY-1T00 | MSI Stealth 15M A11SEK GeForce RTX 2060 Max-Q, i7-1185G7, WDC PC SN530 SDBPNPZ-1T00 | |
|---|---|---|---|---|---|---|
| Noise | -2% | -23% | -17% | -7% | -34% | |
| arrêt / environnement * (dB) | 22.8 | 23.8 -4% | 28.4 -25% | 30.1 -32% | 22.8 -0% | 27.5 -21% |
| Idle Minimum * (dB) | 22.9 | 23.8 -4% | 28.4 -24% | 30.1 -31% | 22.9 -0% | 32.3 -41% |
| Idle Average * (dB) | 22.9 | 23.8 -4% | 28.4 -24% | 30.1 -31% | 22.9 -0% | 32.3 -41% |
| Idle Maximum * (dB) | 22.9 | 23.8 -4% | 28.4 -24% | 30.1 -31% | 22.9 -0% | 33.7 -47% |
| Load Average * (dB) | 30.9 | 36 -17% | 46 -49% | 30.1 3% | 33.2 -7% | 46.3 -50% |
| Witcher 3 ultra * (dB) | 37.8 | 36 5% | 42 -11% | 39.7 -5% | 47.3 -25% | 41.3 -9% |
| Load Maximum * (dB) | 44.7 | 38.2 15% | 47.1 -5% | 42 6% | 52.8 -18% | 56.2 -26% |
* ... Moindre est la valeur, meilleures sont les performances
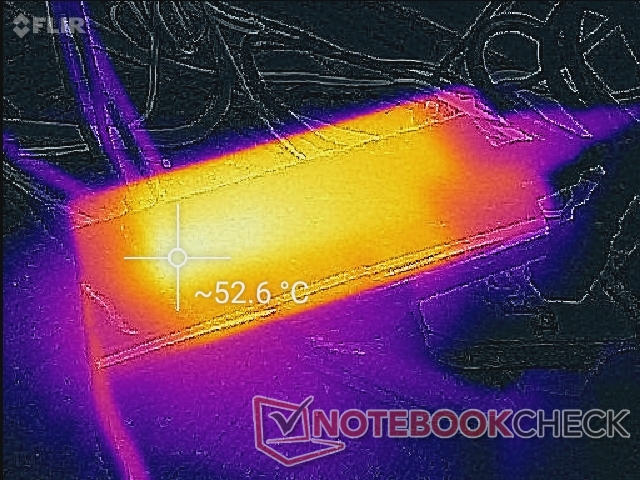
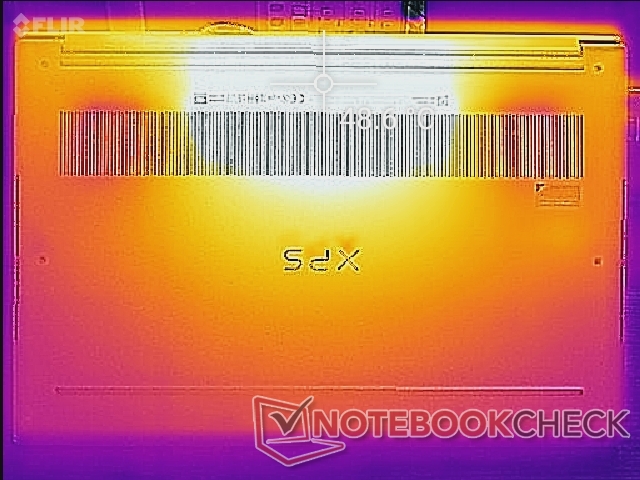
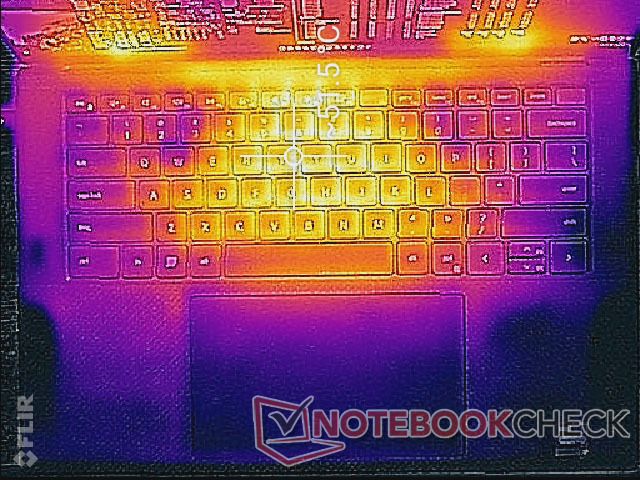
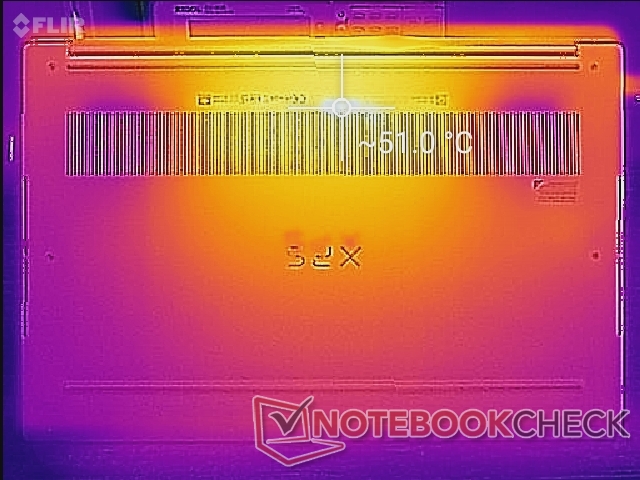
Température - Légèrement plus chaude dans l'ensemble
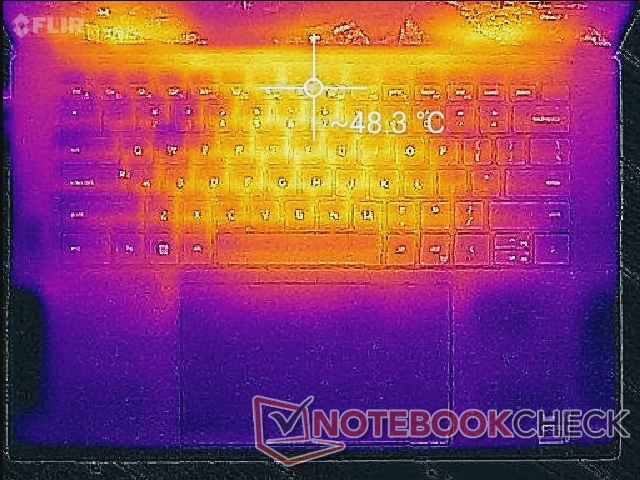
Les températures de surface en charge sont plus élevées que celles que nous avons enregistrées sur les anciens modèles XPS 15 9510 et 9500. Les points chauds peuvent atteindre 51 C à 52 C sur le dessus et le dessous, respectivement, contre 44 C à 47 C sur chacune des versions précédentes. Les points chauds sur les concurrents comme le Zenbook Pro 15 OLED sont plus frais de quelques degrés C dans des conditions similaires. Après tout, le XPS 9520 est l'un des plus petits ordinateurs portables de 15,6 pouces équipés de Core H sur le marché.
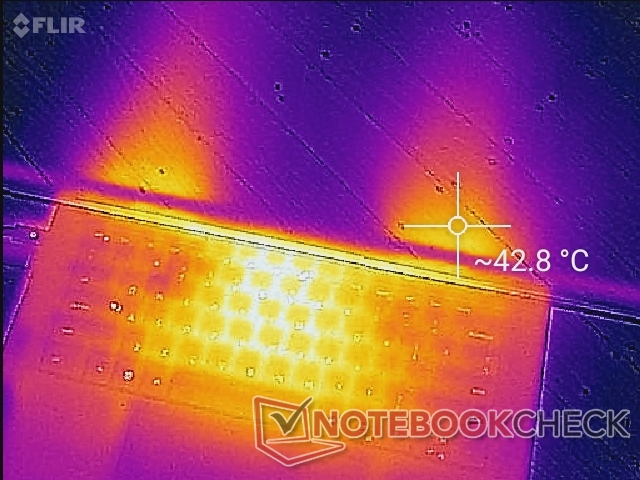
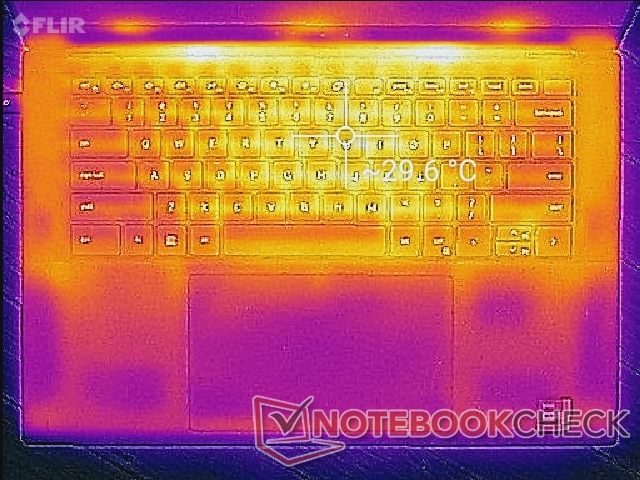
(-) La température maximale du côté supérieur est de 51.4 °C / 125 F, par rapport à la moyenne de 36.8 °C / 98 F, allant de 21 à 71 °C pour la classe Multimedia.
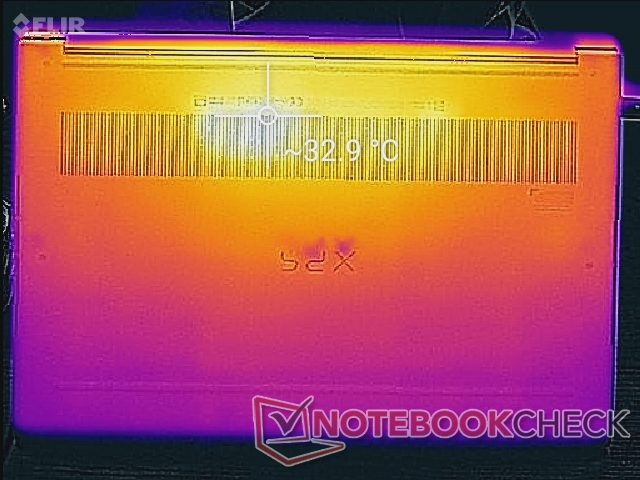
(-) Le fond chauffe jusqu'à un maximum de 51 °C / 124 F, contre une moyenne de 39.1 °C / 102 F
(+) En utilisation inactive, la température moyenne du côté supérieur est de 27.8 °C / 82 F, par rapport à la moyenne du dispositif de 31.3 °C / 88 F.
(±) En jouant à The Witcher 3, la température moyenne du côté supérieur est de 35.2 °C / 95 F, alors que la moyenne de l'appareil est de 31.3 °C / 88 F.
(+) Les repose-poignets et le pavé tactile sont plus froids que la température de la peau avec un maximum de 31.6 °C / 88.9 F et sont donc froids au toucher.
(-) La température moyenne de la zone de l'appui-paume de dispositifs similaires était de 28.7 °C / 83.7 F (-2.9 °C / #-5.2 F).
| Dell XPS 15 9520 RTX 3050 Ti Intel Core i7-12700H, NVIDIA GeForce RTX 3050 Ti Laptop GPU | Dell XPS 15 9510 11800H RTX 3050 Ti OLED Intel Core i7-11800H, NVIDIA GeForce RTX 3050 Ti Laptop GPU | Dell XPS 15 9500 Core i7 4K UHD Intel Core i7-10875H, NVIDIA GeForce GTX 1650 Ti Mobile | HP Spectre X360 15-5ZV31AV Intel Core i7-10510U, NVIDIA GeForce MX250 | Asus Zenbook Pro 15 OLED UM535Q AMD Ryzen 9 5900HX, NVIDIA GeForce RTX 3050 Ti Laptop GPU | MSI Stealth 15M A11SEK Intel Core i7-1185G7, NVIDIA GeForce RTX 2060 Max-Q | |
|---|---|---|---|---|---|---|
| Heat | 13% | 3% | 17% | -1% | 10% | |
| Maximum Upper Side * (°C) | 51.4 | 45.5 11% | 44 14% | 47 9% | 36 30% | 47.2 8% |
| Maximum Bottom * (°C) | 51 | 44.2 13% | 48.8 4% | 47.4 7% | 47.2 7% | 47.4 7% |
| Idle Upper Side * (°C) | 30 | 27 10% | 33 -10% | 22.8 24% | 37 -23% | 27.2 9% |
| Idle Bottom * (°C) | 33 | 26.7 19% | 32.4 2% | 23.6 28% | 39.2 -19% | 28.2 15% |
* ... Moindre est la valeur, meilleures sont les performances
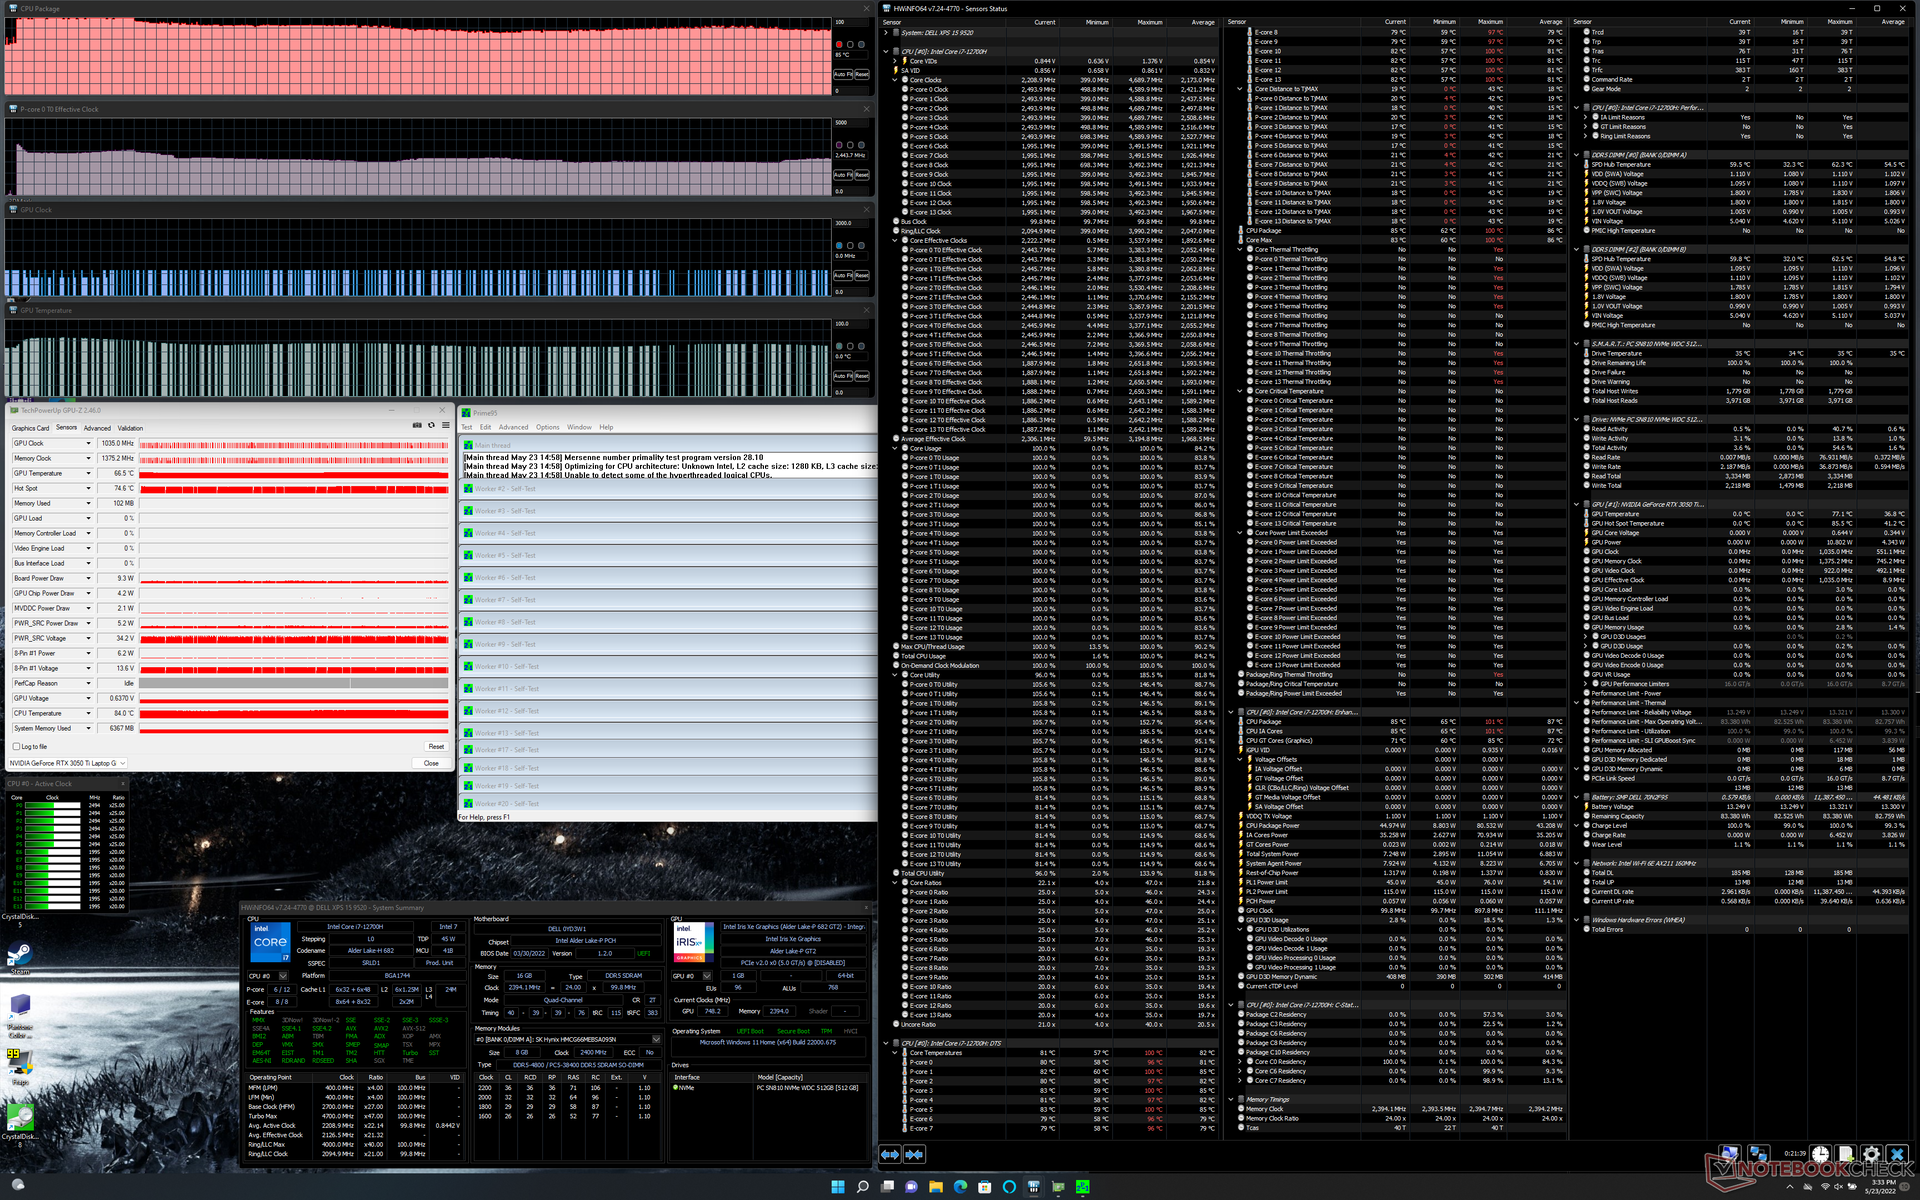
Test de stress
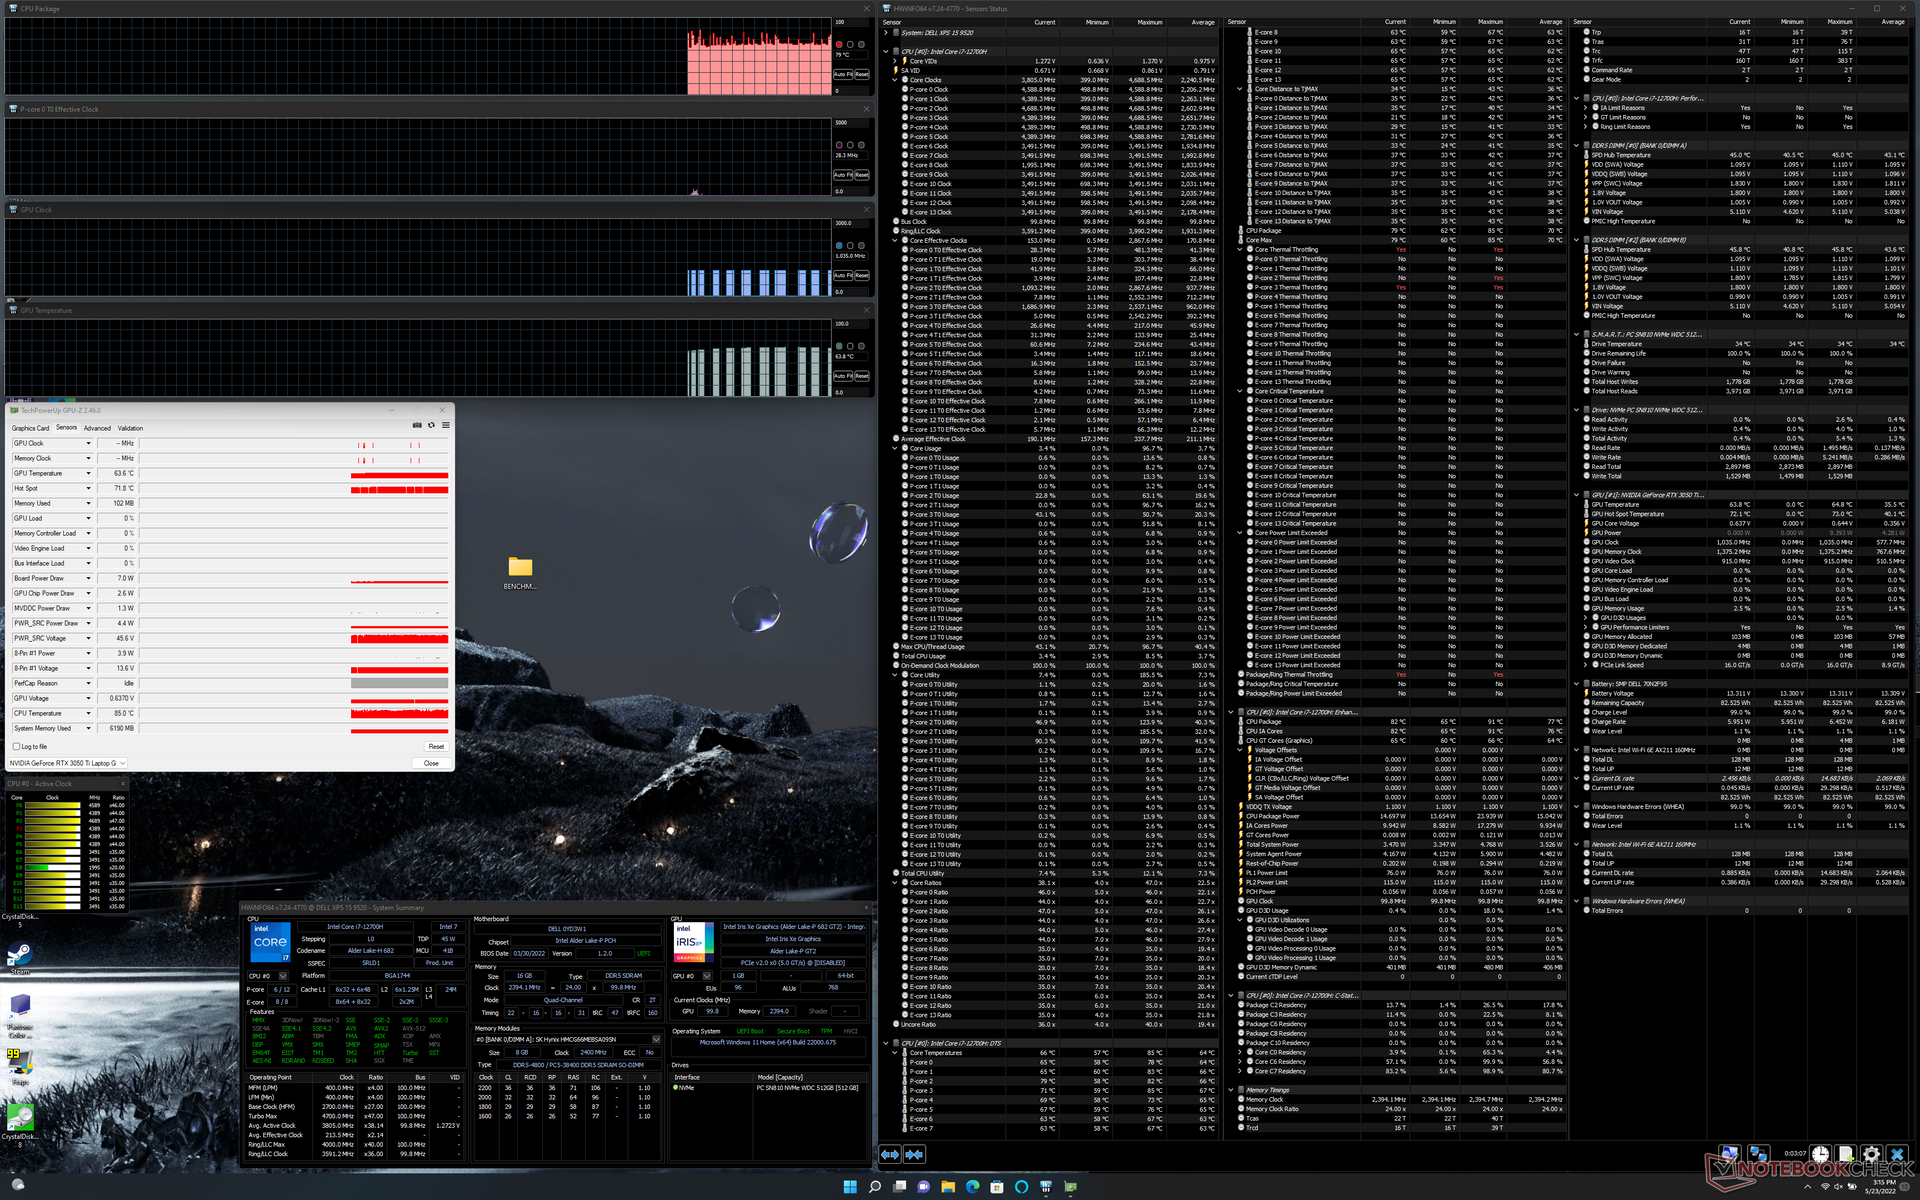
Lorsqu'il est sollicité par Prime95, le CPU monte à 81 W, 100 C et 3,3 GHz pendant les 10 premières secondes environ, avant de redescendre rapidement et de se stabiliser à 45 W, 85 C et 2,5 GHz afin de maintenir les températures sous contrôle. En effectuant ce même test sur le XPS 15 9500, on obtient une température stable du CPU de 73 C en comparaison. Ainsi, il semble que le XPS 15 9520 fonctionne à une température plus élevée que ses prédécesseurs afin d'extraire davantage de performances du processeur à partir de la même conception globale du châssis.
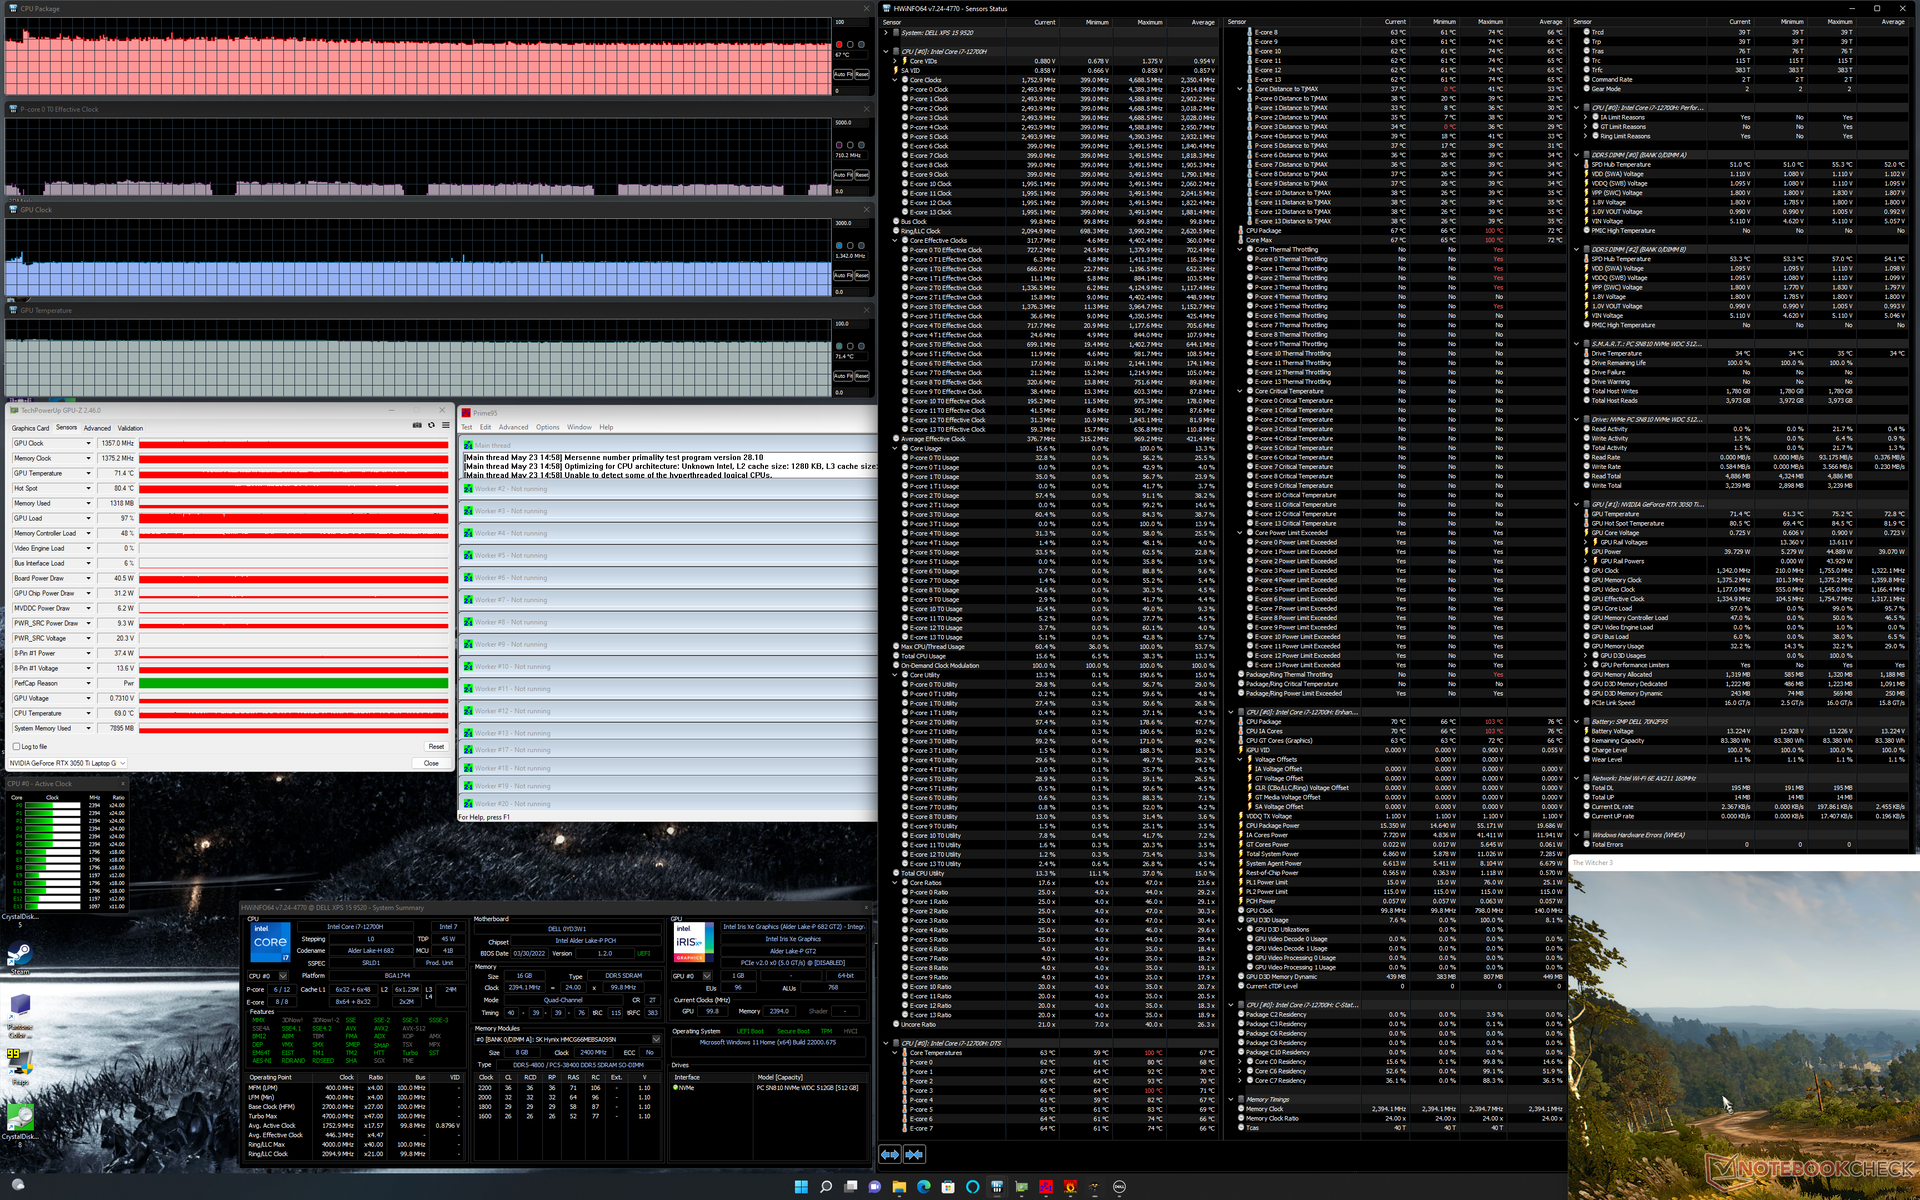
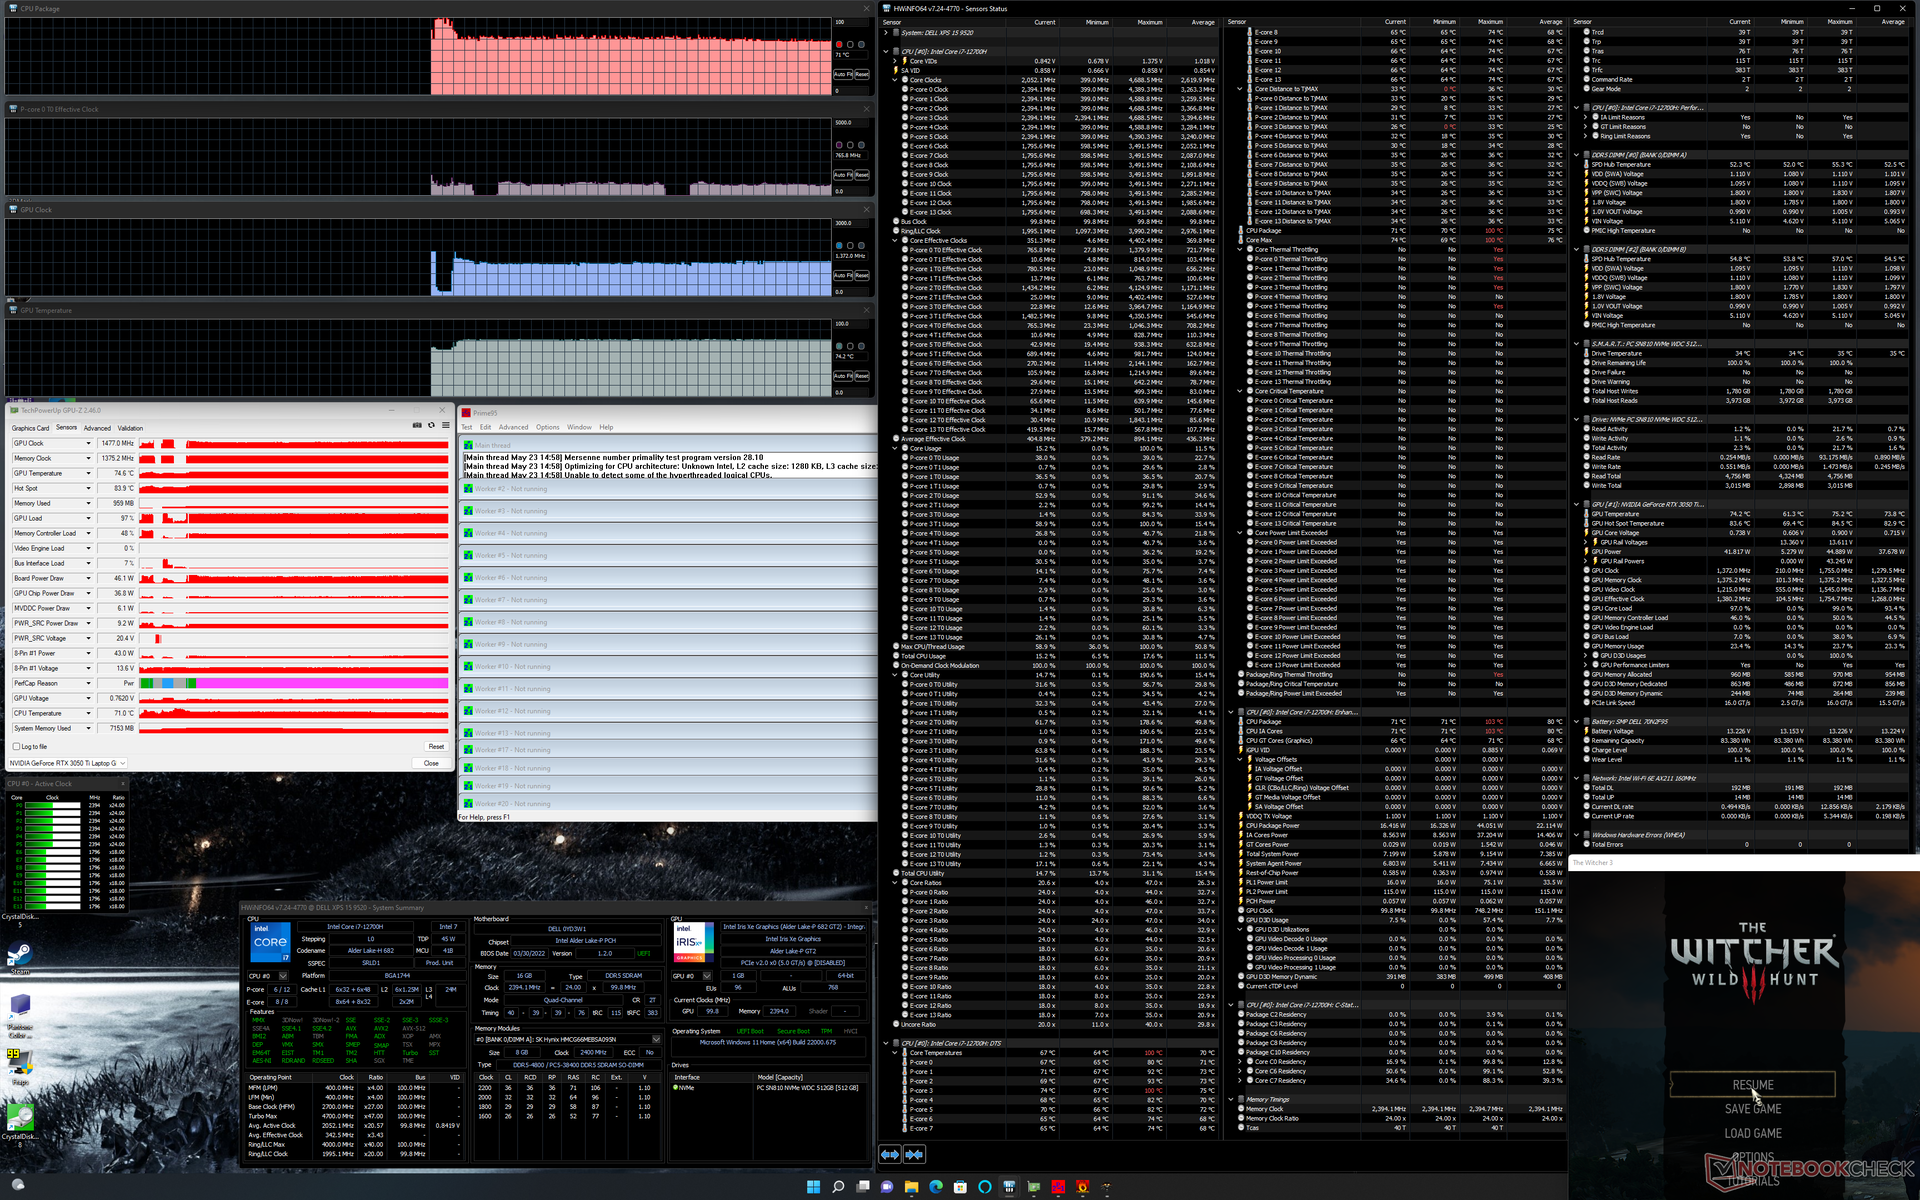
Les fréquences d'horloge, la consommation d'énergie et la température du GPU se stabilisent à 1477 MHz, 46 W et 74 C, respectivement, en mode Ultra Performance Witcher 3 en mode Ultra Performance. L'exécution en mode Optimisé se traduirait par des fréquences d'horloge et des températures légèrement inférieures, comme le montre le tableau ci-dessous, ainsi que par une consommation d'énergie inférieure de 41 W. Les utilisateurs doivent exécuter le système en mode Ultra Performance s'ils veulent extraire le maximum de performances du GPU. L'exécution de ce même test sur le XPS 15 9500 avec le plus lent GeForce GTX 1650 Ti se traduirait par des températures similaires du CPU et du GPU.
Le fonctionnement sur batterie limite les performances. Un test Fire Strike sur batterie donnerait des scores de physique et de graphisme de 9450 et 8332 points, respectivement, contre 27077 et 12154 points sur secteur.
| Fréquence CPU (GHz) | Fréquence GPU (MHz) | Température CPU moyenne (°C) | Température GPU moyenne (°C) | |
| Système au repos | -- | -- | 79 | 64 |
| Prime95 Stress | 2.4 | 85 | -- | 67 |
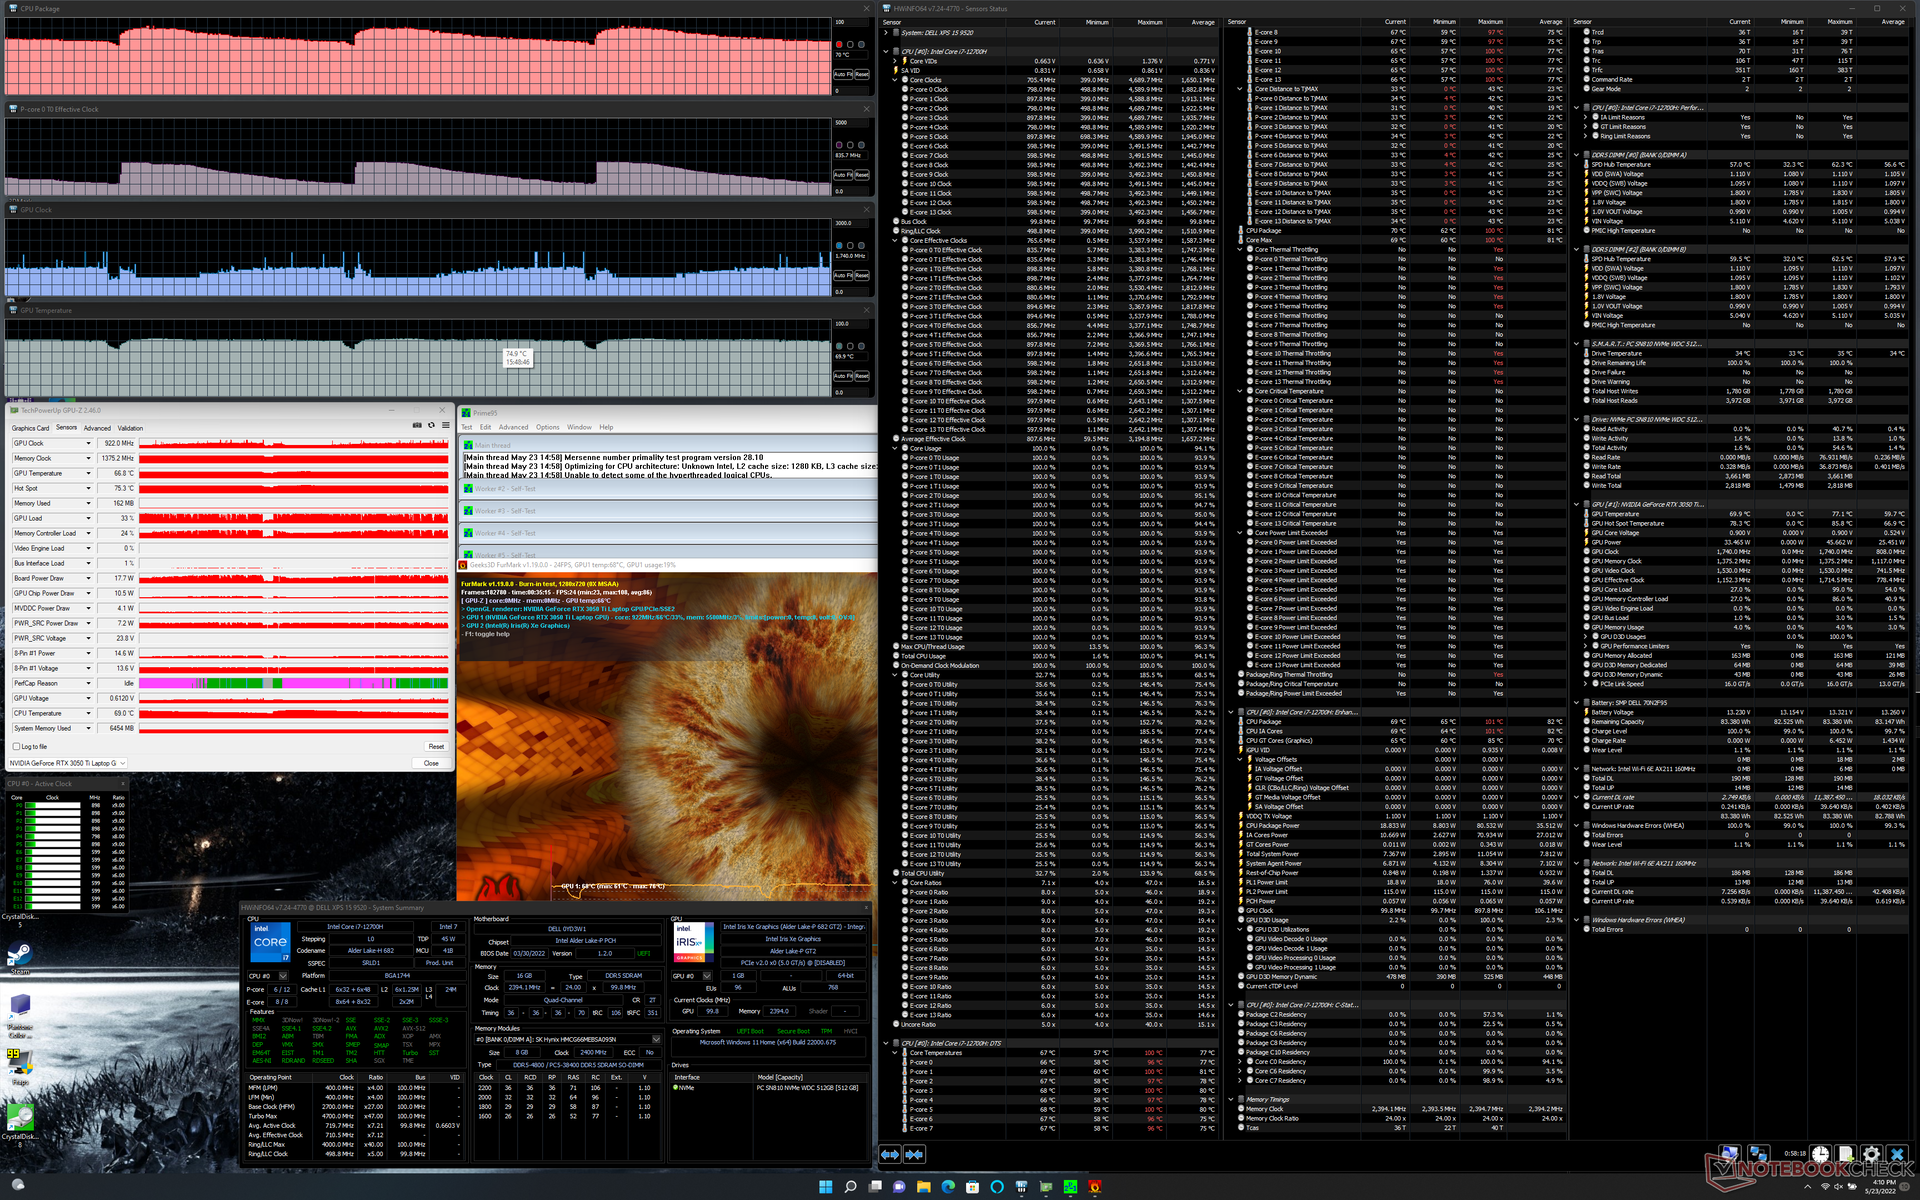
| Prime95+ FurMark Stress | 0.8 - 2.3 | 700 - 1100 | 79 - 86 | 62 - 75 |
| Witcher 3 Stress (mode équilibré) | 0.7 | 1357 | 67 | 71 |
| Witcher 3 Stress (mode Performance) | 0.8 | 1477 | 71 | 74 |
Haut-parleurs
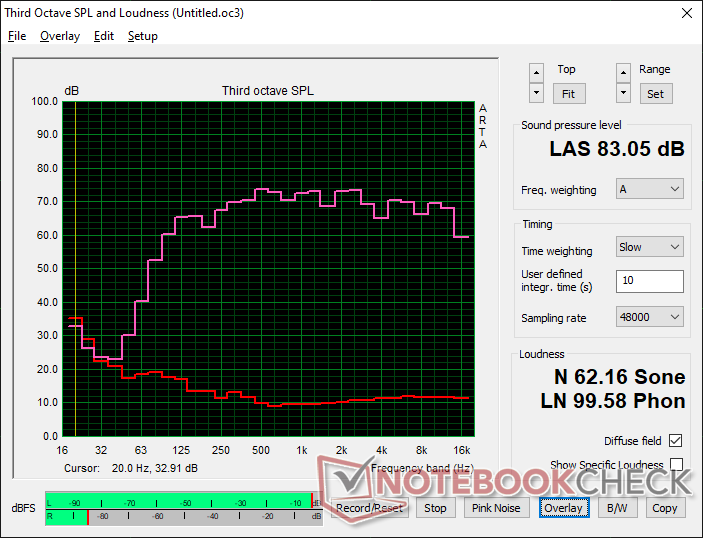
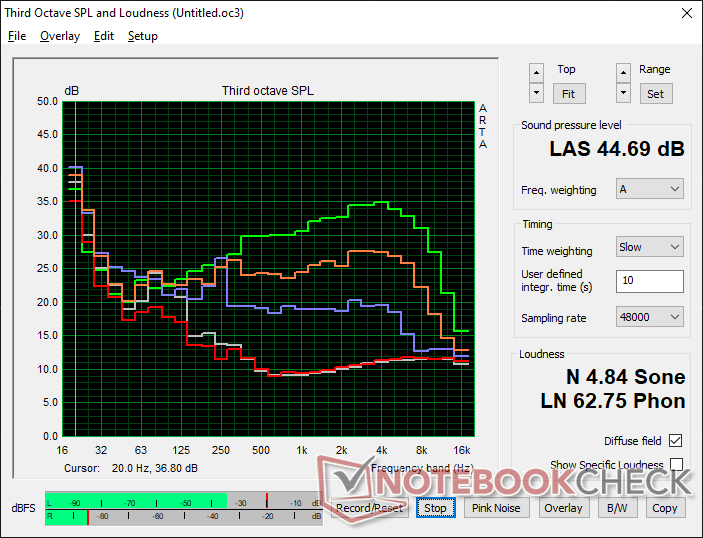
Dell XPS 15 9520 RTX 3050 Ti analyse audio
(+) | les haut-parleurs peuvent jouer relativement fort (83.1# dB)
Basses 100 - 315 Hz
(+) | bonne basse - seulement 4.4% loin de la médiane
(+) | les basses sont linéaires (6.8% delta à la fréquence précédente)
Médiums 400 - 2000 Hz
(+) | médiane équilibrée - seulement 2.6% de la médiane
(+) | les médiums sont linéaires (4.1% delta à la fréquence précédente)
Aiguës 2 - 16 kHz
(+) | des sommets équilibrés - à seulement 1.9% de la médiane
(+) | les aigus sont linéaires (5.4% delta à la fréquence précédente)
Globalement 100 - 16 000 Hz
(+) | le son global est linéaire (6.4% différence à la médiane)
Par rapport à la même classe
» 4% de tous les appareils testés de cette catégorie étaient meilleurs, 1% similaires, 95% pires
» Le meilleur avait un delta de 5%, la moyenne était de 17%, le pire était de 45%.
Par rapport à tous les appareils testés
» 1% de tous les appareils testés étaient meilleurs, 0% similaires, 99% pires
» Le meilleur avait un delta de 4%, la moyenne était de 23%, le pire était de 134%.
Apple MacBook Pro 16 2021 M1 Pro analyse audio
(+) | les haut-parleurs peuvent jouer relativement fort (84.7# dB)
Basses 100 - 315 Hz
(+) | bonne basse - seulement 3.8% loin de la médiane
(+) | les basses sont linéaires (5.2% delta à la fréquence précédente)
Médiums 400 - 2000 Hz
(+) | médiane équilibrée - seulement 1.3% de la médiane
(+) | les médiums sont linéaires (2.1% delta à la fréquence précédente)
Aiguës 2 - 16 kHz
(+) | des sommets équilibrés - à seulement 1.9% de la médiane
(+) | les aigus sont linéaires (2.7% delta à la fréquence précédente)
Globalement 100 - 16 000 Hz
(+) | le son global est linéaire (4.6% différence à la médiane)
Par rapport à la même classe
» 0% de tous les appareils testés de cette catégorie étaient meilleurs, 0% similaires, 100% pires
» Le meilleur avait un delta de 5%, la moyenne était de 17%, le pire était de 45%.
Par rapport à tous les appareils testés
» 0% de tous les appareils testés étaient meilleurs, 0% similaires, 100% pires
» Le meilleur avait un delta de 4%, la moyenne était de 23%, le pire était de 134%.
Gestion de l'énergie - Plus de puissance
Consommation d'énergie
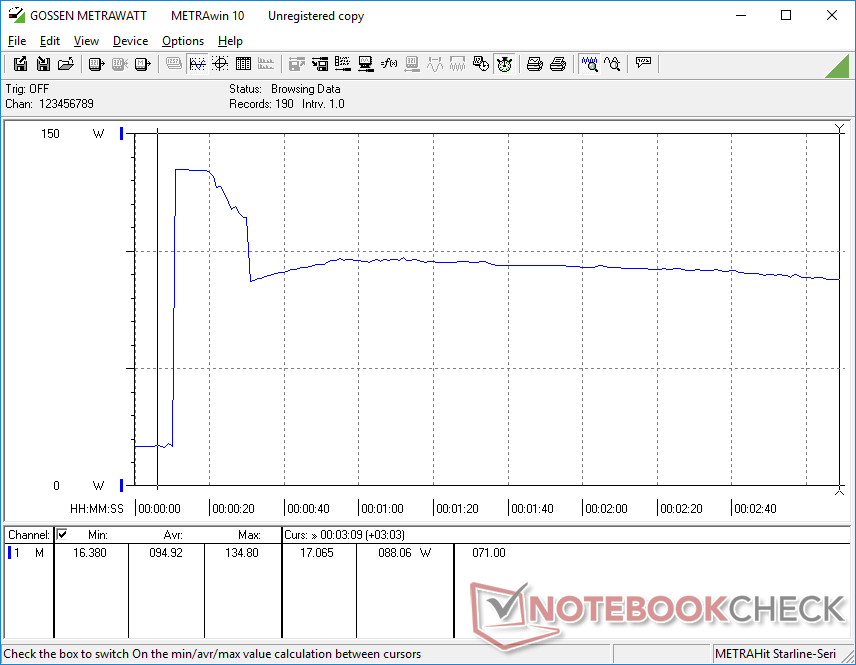
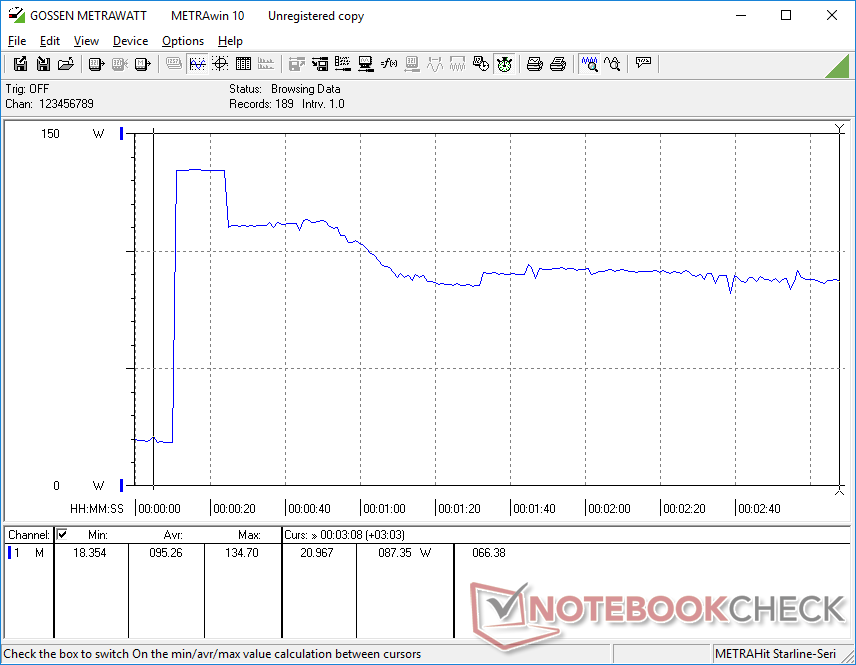
Les XPS 15 9500, 9510 et 9520 sont les seuls grands ordinateurs portables sur le marché à l'heure actuelle à être équipés d'adaptateurs USB-C 130 W pour dépasser la limite USB-C Power Delivery de 100 W fixée par l'USB-IF. Le surdébit plus élevé permet à la batterie de continuer à se charger à un rythme décent, même lors de l'exécution de charges exigeantes comme les jeux. Il est également intéressant de noter que notre unité de test ne présente pas les problèmes de charge que nous avons rencontrés sur le XPS 17 9700.
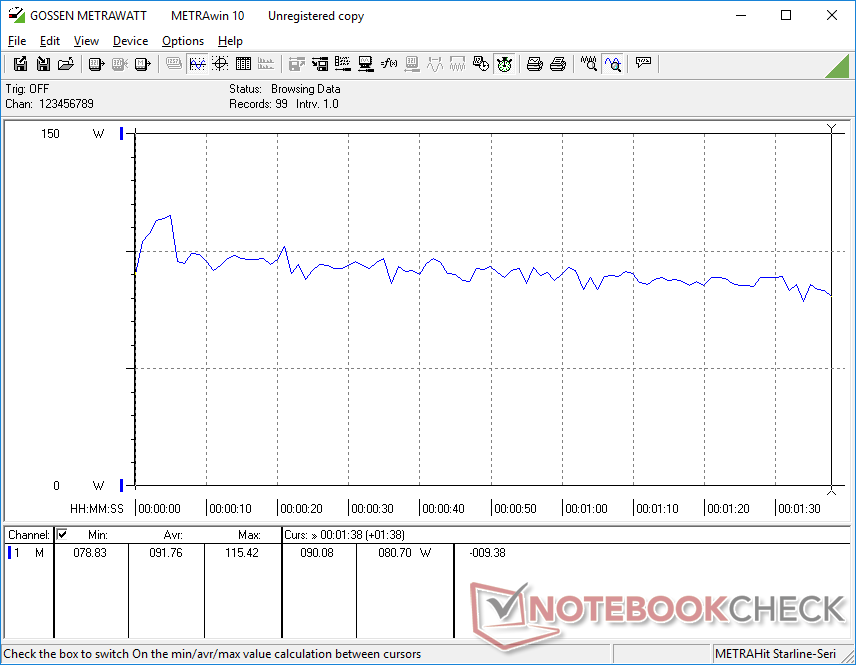
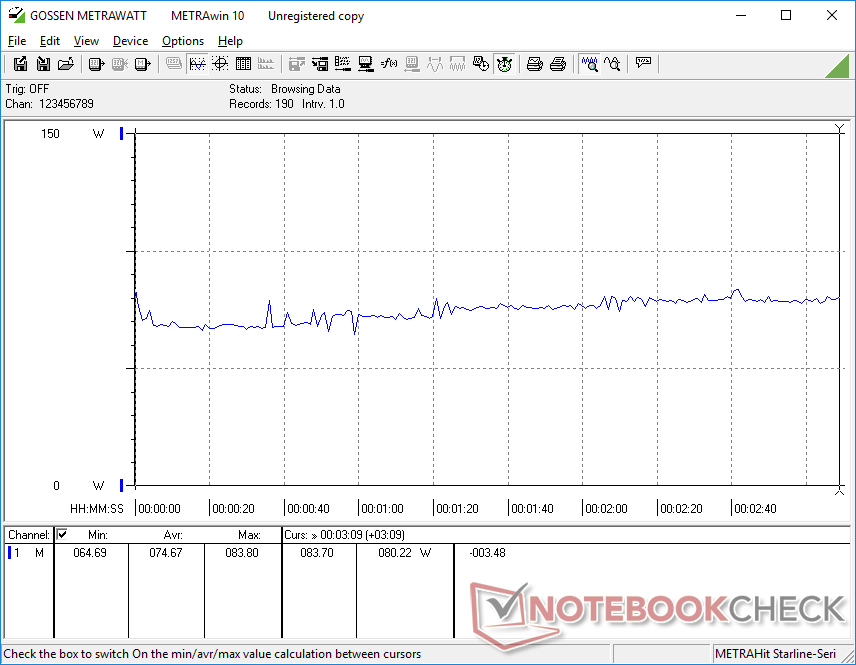
L'exécution de Witcher 3 consomme 75 W, ce qui est proche de ce que nous avons enregistré sur le XPS 15 9510 ou le Zenbook Pro 15 OLED alimenté par AMD. Il est peut-être plus intéressant de noter que l'exécution de Prime95 consomme 88 W, contre 65 W sur le XPS 15 9510 équipé d'un Core 7-11800H. Ainsi, la consommation d'énergie a augmenté d'environ 35 % pour le gain de 35 à 42 % d'une année sur l'autre dans les performances multithread que nous avons enregistrées ci-dessus. La consommation d'énergie généralement plus élevée correspond à ce que nous observons sur la plateforme Alder Lake dans son ensemble Plate-forme Alder Lake dans son ensemble
L'adaptateur secteur USB-C 130 W de taille moyenne (~14,3 x 6,6 x 2,3 cm) livré avec le XPS 15 9520 est identique à celui livré avec les XPS 9500 et 9510.
| Éteint/en veille | |
| Au repos | |
| Fortement sollicité |
|
Légende:
min: | |
| Dell XPS 15 9520 RTX 3050 Ti i7-12700H, GeForce RTX 3050 Ti Laptop GPU, WDC PC SN810 512GB, OLED, 3456x2160, 15.6" | Dell XPS 15 9510 11800H RTX 3050 Ti OLED i7-11800H, GeForce RTX 3050 Ti Laptop GPU, Micron 2300 512GB MTFDHBA512TDV, OLED, 3456x2160, 15.6" | Dell XPS 15 9500 Core i7 4K UHD i7-10875H, GeForce GTX 1650 Ti Mobile, SK Hynix PC611 512GB, IPS, 3840x2400, 15.6" | HP Spectre X360 15-5ZV31AV i7-10510U, GeForce MX250, Intel SSD 660p 2TB SSDPEKNW020T8, IPS, 3840x2160, 15.6" | Asus Zenbook Pro 15 OLED UM535Q R9 5900HX, GeForce RTX 3050 Ti Laptop GPU, WDC PC SN730 SDBPNTY-1T00, OLED, 1920x1080, 15.6" | MSI Stealth 15M A11SEK i7-1185G7, GeForce RTX 2060 Max-Q, WDC PC SN530 SDBPNPZ-1T00, IPS, 1920x1080, 15.6" | |
|---|---|---|---|---|---|---|
| Power Consumption | -5% | -27% | 20% | 5% | -25% | |
| Idle Minimum * (Watt) | 5.5 | 7.6 -38% | 5.7 -4% | 5.2 5% | 5.5 -0% | 7.3 -33% |
| Idle Average * (Watt) | 7.2 | 9.9 -38% | 13.5 -88% | 8.5 -18% | 7.4 -3% | 10.1 -40% |
| Idle Maximum * (Watt) | 16 | 10.8 32% | 19.6 -23% | 8.7 46% | 14.9 7% | 17.6 -10% |
| Load Average * (Watt) | 91.8 | 81 12% | 114.1 -24% | 65.6 29% | 78.2 15% | 106.6 -16% |
| Witcher 3 ultra * (Watt) | 74.6 | 76.2 -2% | 93 -25% | 56.5 24% | 80.1 -7% | 105.4 -41% |
| Load Maximum * (Watt) | 134.7 | 131 3% | 135.2 -0% | 92.4 31% | 110.9 18% | 151.2 -12% |
* ... Moindre est la valeur, meilleures sont les performances
Power Consumption Witcher 3 / Stresstest
Power Consumption external Monitor
Autonomie de la batterie
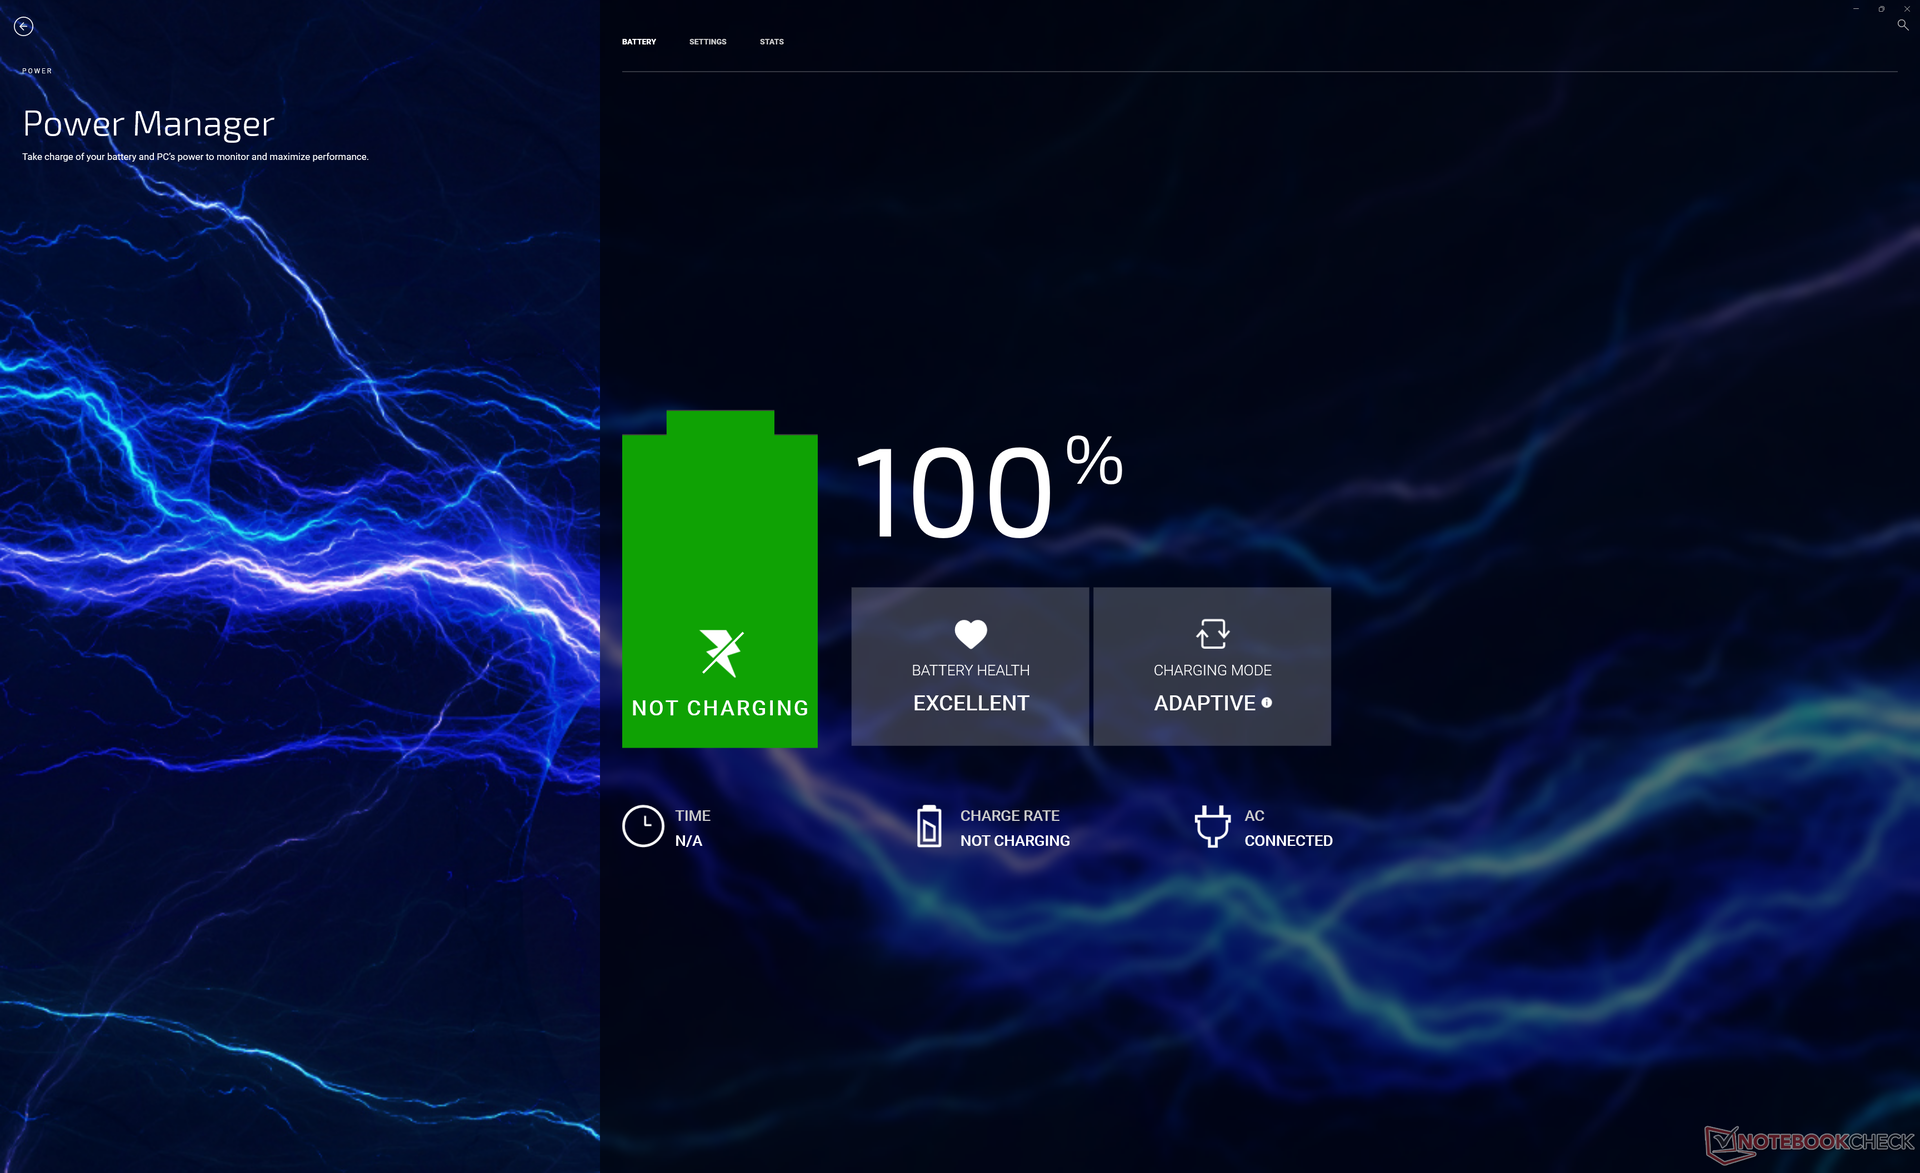
Avec presque 9 heures d'utilisation constante du WLAN dans le monde réel, les durées d'exécution sont globalement similaires à celles que nous avons enregistrées sur le XPS 9500 et presque 2 heures de plus que sur le XPS 9510. Cependant, gardez à l'esprit que les couleurs blanches demanderont quelques watts de plus que les couleurs plus sombres avec le même réglage de luminosité, car notre configuration utilise un panneau OLED.
La charge de l'adaptateur secteur fourni, de l'état vide à l'état plein, prend environ 2 à 2,5 heures lorsque l'ordinateur tourne au ralenti ou à faible charge.
| Dell XPS 15 9520 RTX 3050 Ti i7-12700H, GeForce RTX 3050 Ti Laptop GPU, 86 Wh | Dell XPS 15 9510 11800H RTX 3050 Ti OLED i7-11800H, GeForce RTX 3050 Ti Laptop GPU, 86 Wh | Dell XPS 15 9500 Core i7 4K UHD i7-10875H, GeForce GTX 1650 Ti Mobile, 86 Wh | HP Spectre X360 15-5ZV31AV i7-10510U, GeForce MX250, 84 Wh | Asus Zenbook Pro 15 OLED UM535Q R9 5900HX, GeForce RTX 3050 Ti Laptop GPU, 96 Wh | MSI Stealth 15M A11SEK i7-1185G7, GeForce RTX 2060 Max-Q, 52 Wh | |
|---|---|---|---|---|---|---|
| Autonomie de la batterie | -32% | 7% | 22% | 45% | -42% | |
| Reader / Idle (h) | 14.8 | 23 55% | 22.6 53% | 26.2 77% | 10.5 -29% | |
| WiFi v1.3 (h) | 8.8 | 7 -20% | 9.1 3% | 10.8 23% | 12.8 45% | 6.3 -28% |
| Load (h) | 3.2 | 1.8 -44% | 2 -37% | 2.9 -9% | 3.6 13% | 1 -69% |
| H.264 (h) | 10.4 |
Points positifs
Points négatifs
Verdict - La différence Alder Lake
Si les processeurs des XPS 15 9500 ou 9510 étaient trop lents pour vos applications spécifiques, alors le 9520 serait à considérer. Son 12ème génération Core i7-12700H de 12e génération peut offrir des performances multithread 70 % et 40 % plus rapides que les processeurs Core i7-10875H et le 11eCore i7-11800Hde 10e génération, sans que cela n'ait d'incidence significative sur l'autonomie de la batterie. L'augmentation inhérente des performances graphiques intégrées peut également suffire à satisfaire la plupart des utilisateurs de bureau sans avoir à passer à des options discrètes Nvidia coûteuses.
Les utilisateurs intensifs apprécieront les gains significatifs en termes de performances du processeur par rapport aux options Intel de 11e ou 10e génération. Pour les tâches de bureau plus basiques ou modérées, cependant, la puissance supplémentaire de la série 12e génération ne vaut peut-être pas la peine d'augmenter le prix.
En dehors des performances du processeur, cependant, l'expérience reste la même que sur le XPS 9510 ou même 9500. Le GPU Nvidia a été downclocké par rapport au 9510 et donc les avantages de la RAM DDR5 plus rapide ont été minimisés. Certains changements que nous aurions aimé voir comme des écrans à plus haute fréquence, une webcam à plus haute résolution, un support Wi-Fi 6E approprié, ou un volet de confidentialité continuent d'être absents. Si le CPU 12ème génération plus rapide n'est pas attrayant, alors vous pouvez acheter le XPS 15 9510 qui a exactement les mêmes options d'affichage et de GPU que notre 9520 mais à des prix inférieurs.
Prix et disponibilité
Dell dell livre actuellement sa série XPS 15 9520 à partir de 1500 $ US pour le modèle de base jusqu'à 3500 $ US si elle est configurée avec tout au maximum.
Dell XPS 15 9520 RTX 3050 Ti
- 08/30/2022 v7 (old)
Allen Ngo
Price comparison

