Test du Dell Latitude 13 7330 de 1 kg : les débuts de l'Intel Core i7-1265U
A ne pas confondre avec le Dell Latitude 7330 Ruggedle Latitude 7330 est un ordinateur portable plus traditionnel destiné aux bureaux et aux entreprises. Il est disponible en deux versions, une version à clapet et une version convertible 2-en-1, chacune avec des options de CPU Intel Core-U de 12e génération, des ports et un design de châssis similaires, mais avec des options d'écran et de matériaux de châssis différents. Nous vous recommandons de consulter la page produit ou le PDF technique disponible publiquement pour le Latitude 7330 car il offre plus d'options configurables que la plupart des autres ordinateurs portables, allant de différentes webcams, tailles de batterie, WAN, et même des lecteurs MicroSD
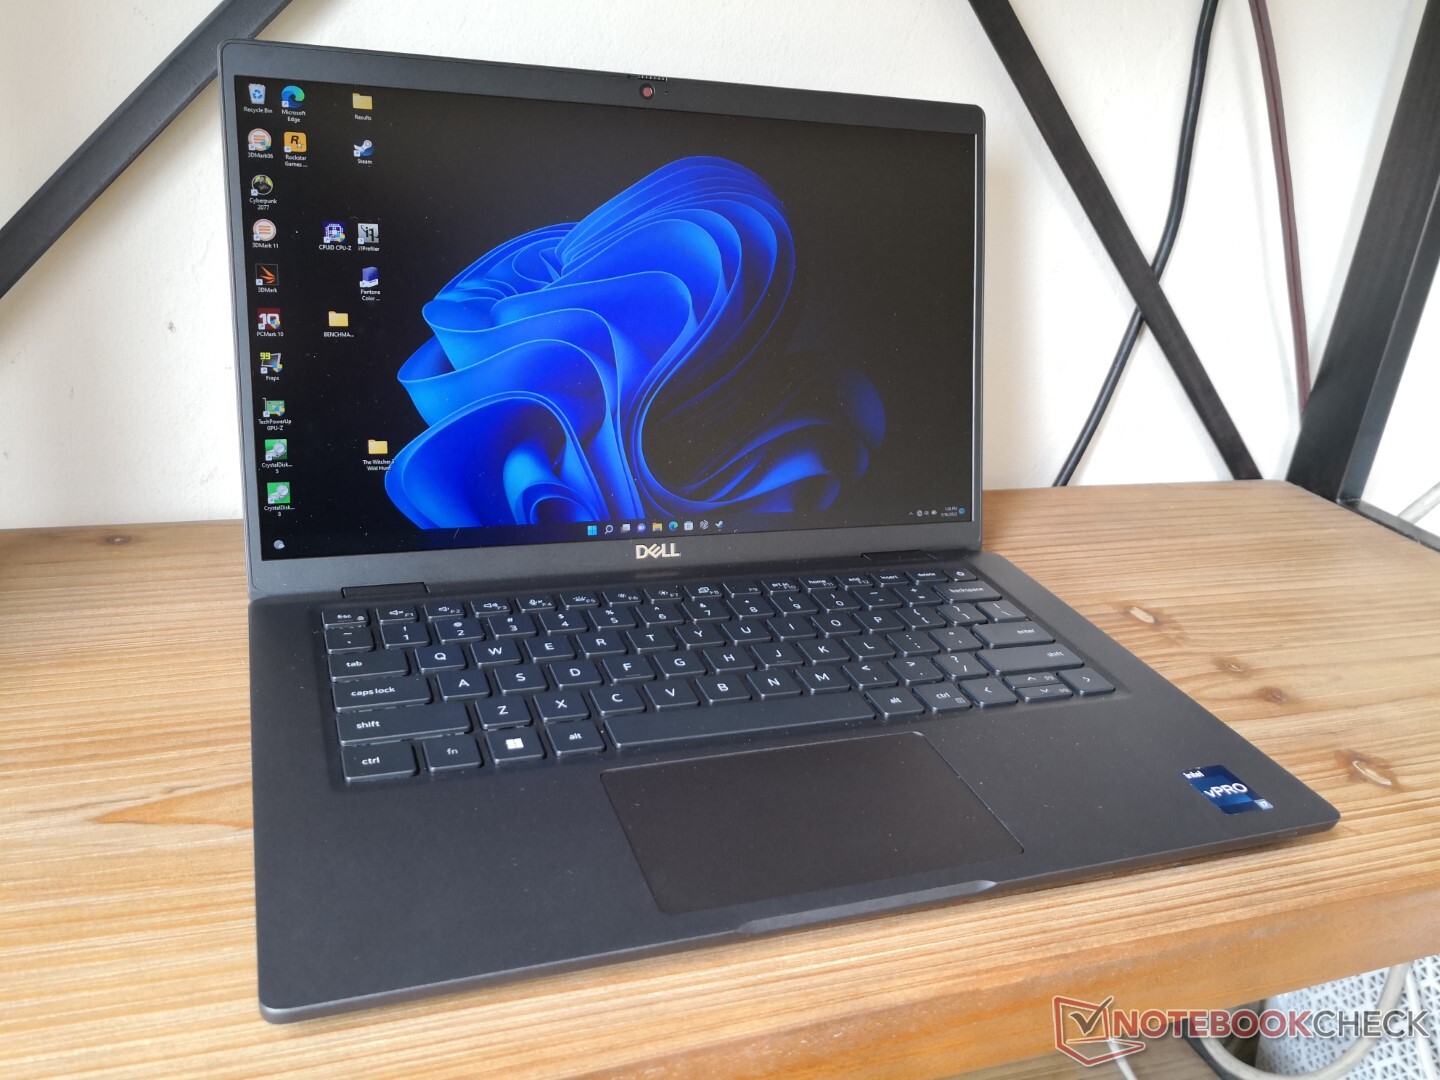
Notre unité d'examen spécifique est le clamshell en alliage de magnésium Latitude 7330 visant un poids de seulement 1 kg pour être l'un des ordinateurs portables professionnels de 13,3 pouces les plus légers du marché. Quelques autres ordinateurs portables ont également promis des conceptions super légères similaires dans le passé, tels que les séries Série LG Gram, Samsung Galaxy Book Pro series, HP Elite Dragonflyou le Toshiba Portege Z series qui sont toutes des alternatives au Latitude 7330. Notre configuration, telle qu'elle a été examinée, est vendue au détail à environ 2 000 $ US.
Plus de commentaires sur Dell
Comparaison avec les concurrents potentiels
Note | Date | Modèle | Poids | Épaisseur | Taille | Résolution | Prix |
|---|---|---|---|---|---|---|---|
| 89 % v7 (old) | 07/22 | Dell Latitude 13 7330 i7-1265U, Iris Xe G7 96EUs | 1 kg | 16.96 mm | 13.30" | 1920x1080 | |
| 87.9 % v7 (old) | 10/20 | Lenovo ThinkPad X13 Yoga 20SX0004GE i7-10510U, UHD Graphics 620 | 1.3 kg | 15.95 mm | 13.30" | 1920x1080 | |
| 85.1 % v7 (old) | 07/22 | Framework Laptop 13.5 12th Gen Intel i7-1260P, Iris Xe G7 96EUs | 1.3 kg | 15.85 mm | 13.50" | 2256x1504 | |
| 86.6 % v7 (old) | 12/20 | Razer Book 13 FHD i7-1165G7, Iris Xe G7 96EUs | 1.4 kg | 15.15 mm | 13.40" | 1920x1200 | |
| 89.4 % v7 (old) | 08/20 | Dell Latitude 7310 i7-10610U, UHD Graphics 620 | 1.2 kg | 18.3 mm | 13.30" | 1920x1080 | |
| 85.2 % v7 (old) | 05/21 | Microsoft Surface Laptop 4 13 Ryzen 5 R5 4680U, Vega 7 | 1.3 kg | 14 mm | 13.50" | 2256x1504 |
Cas - Trois options différentes
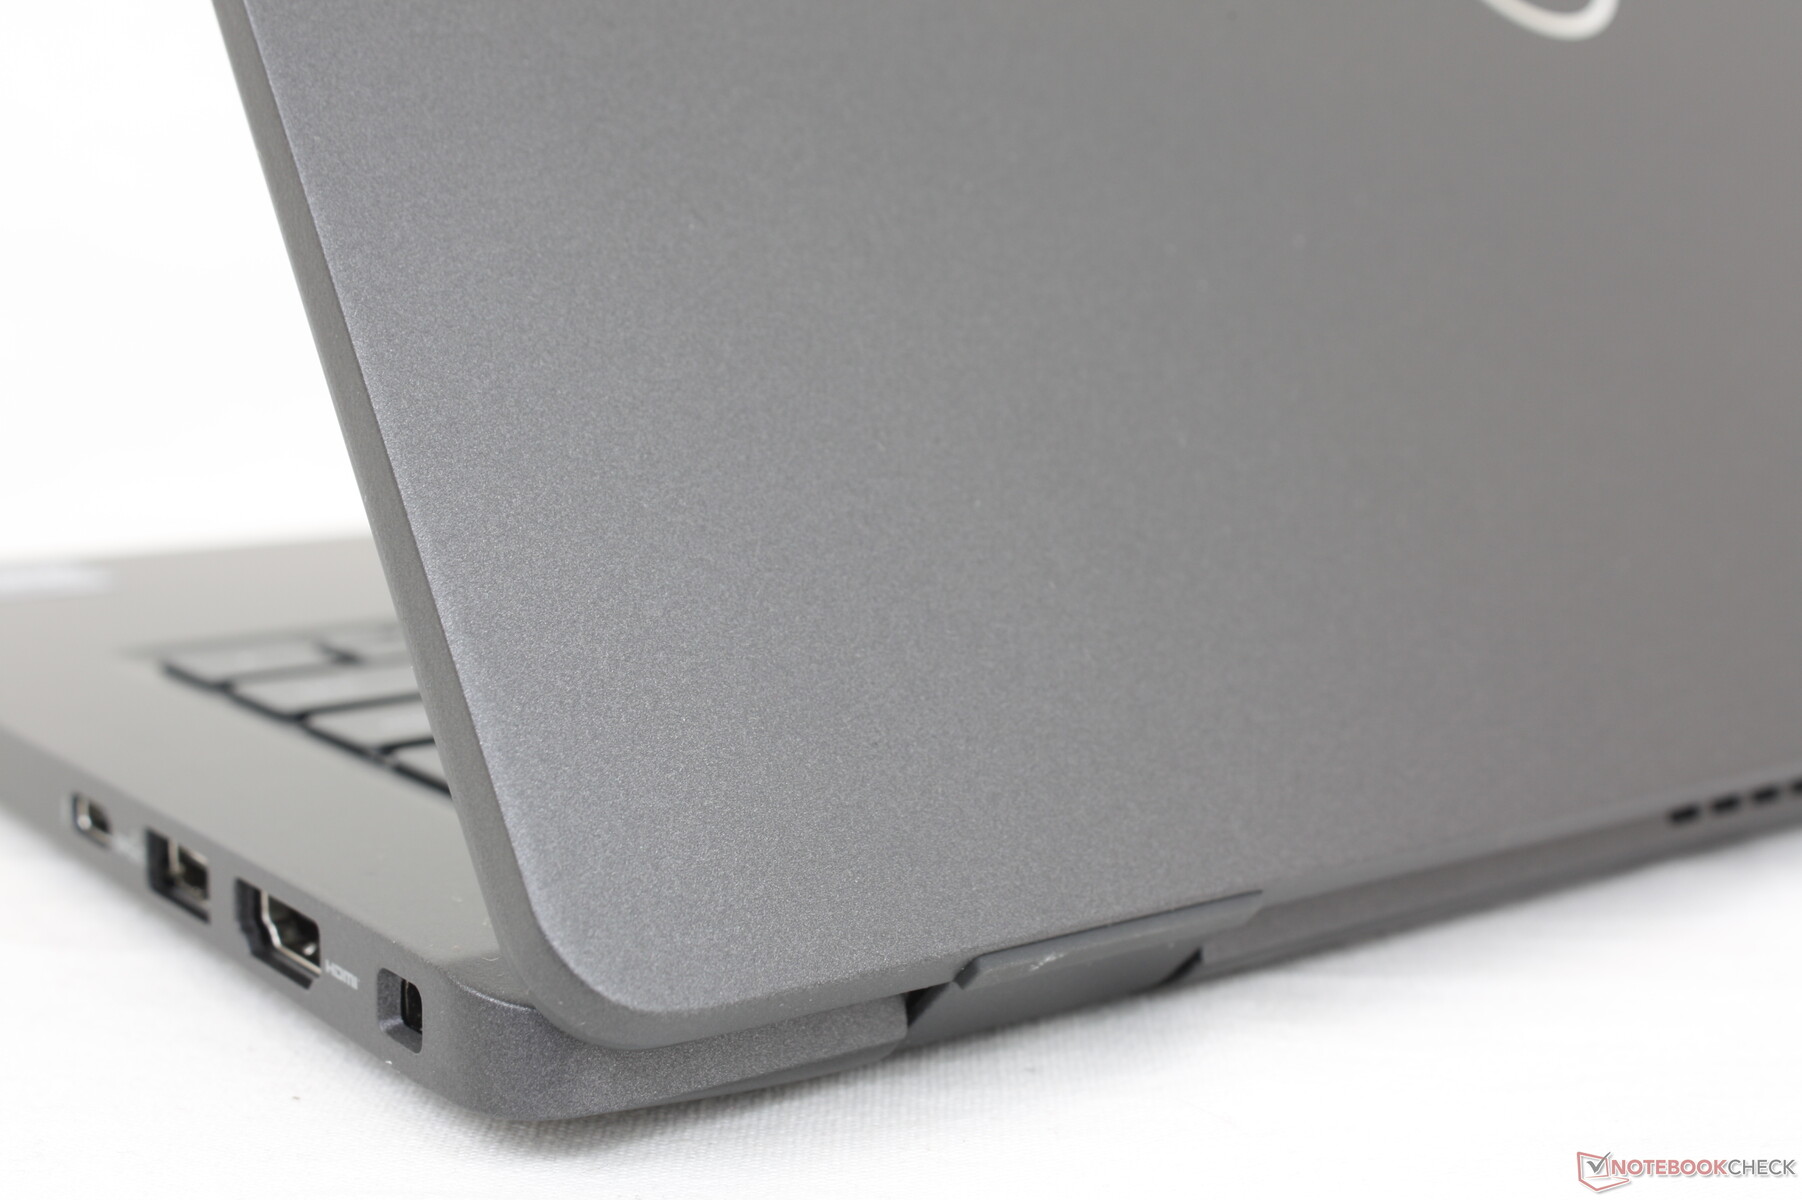
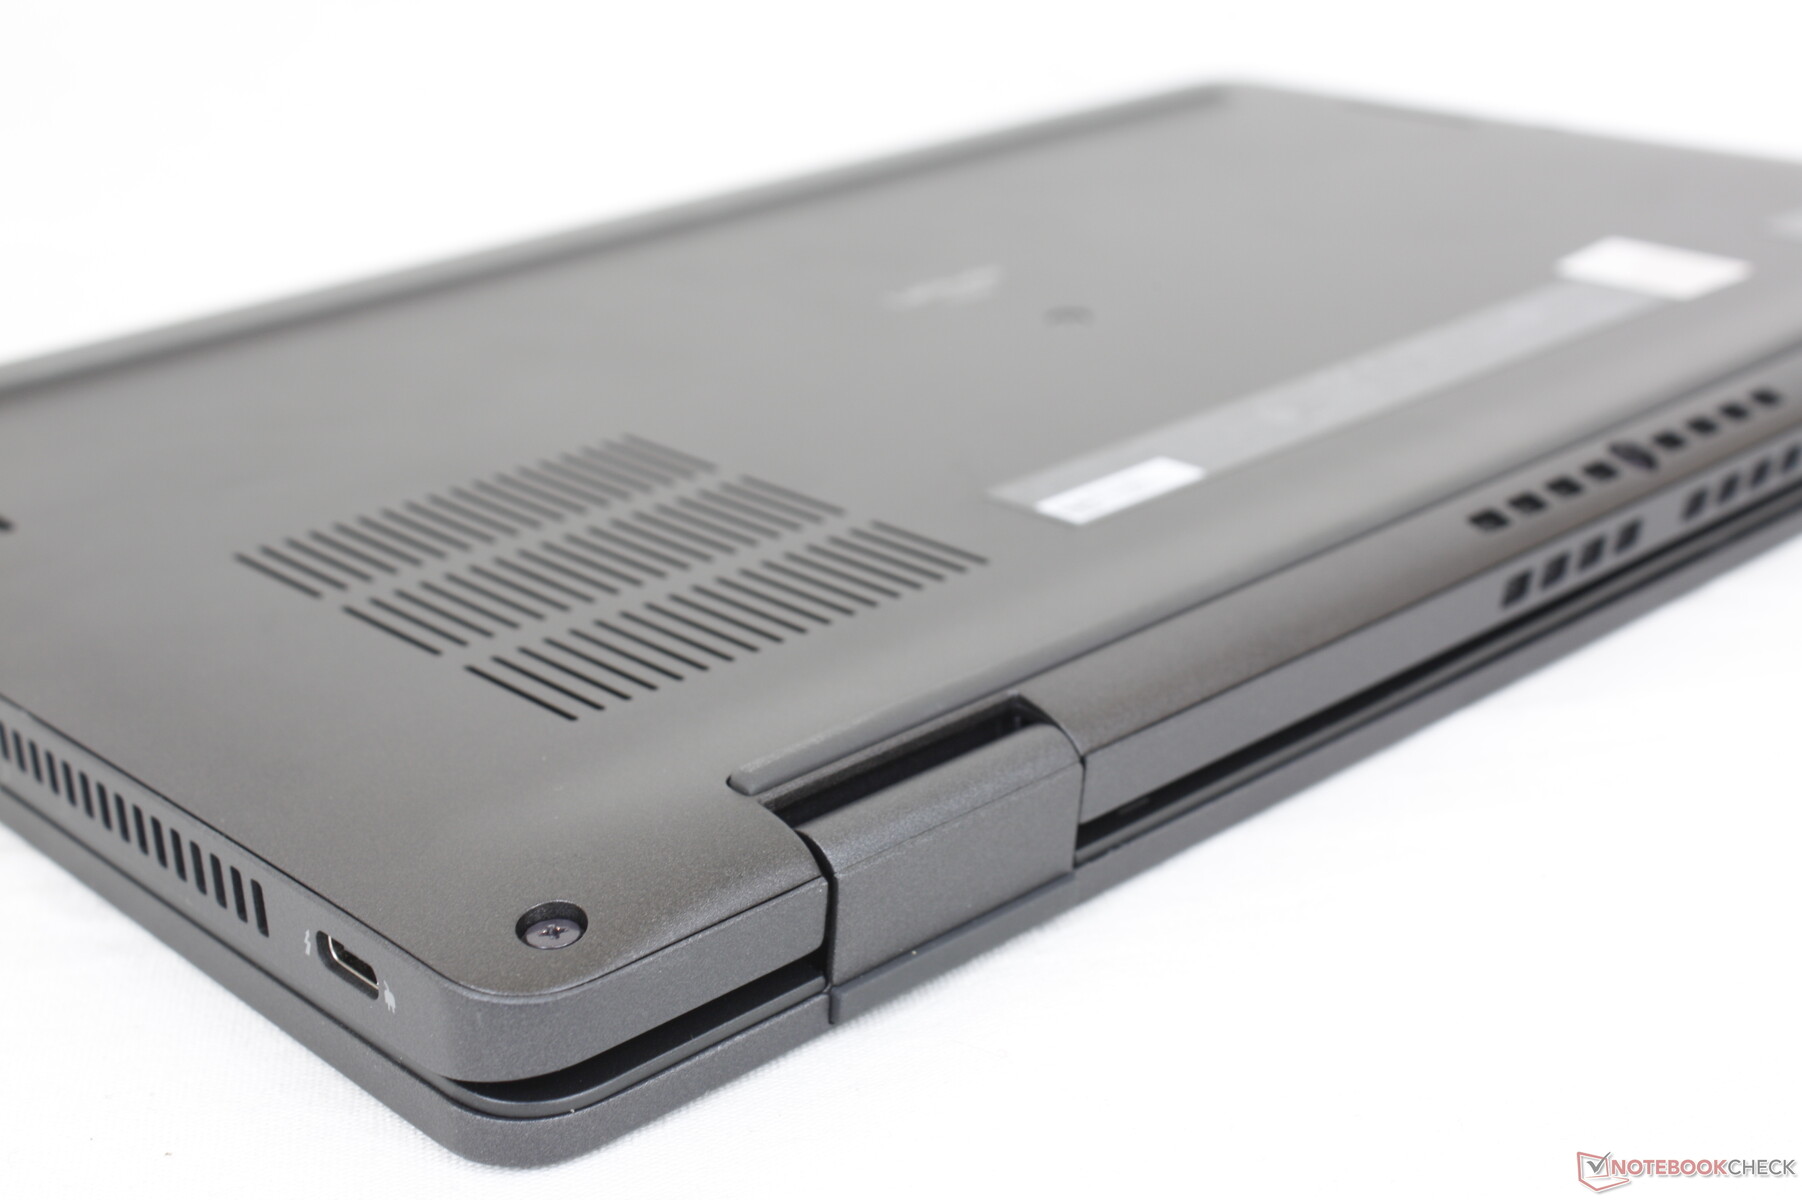
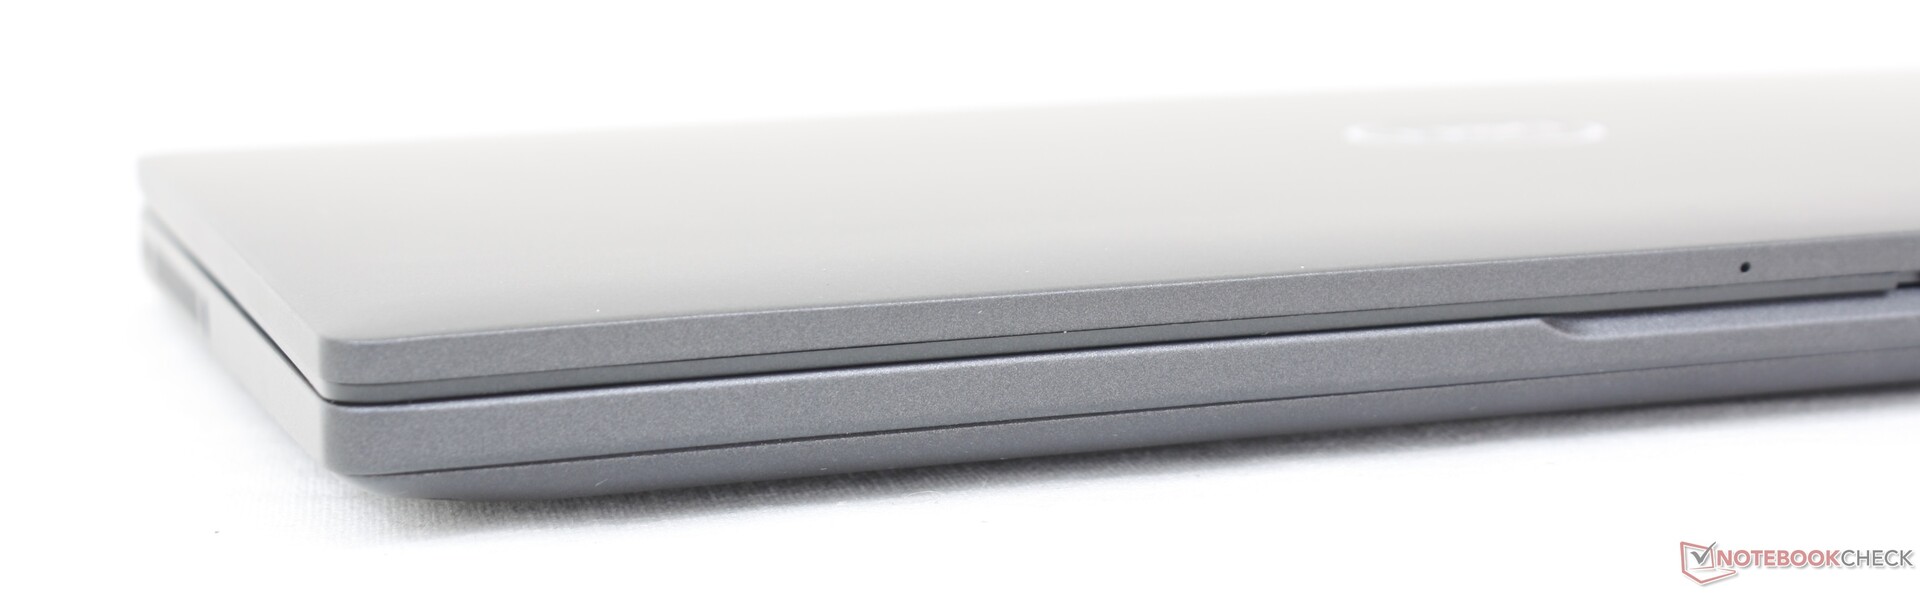
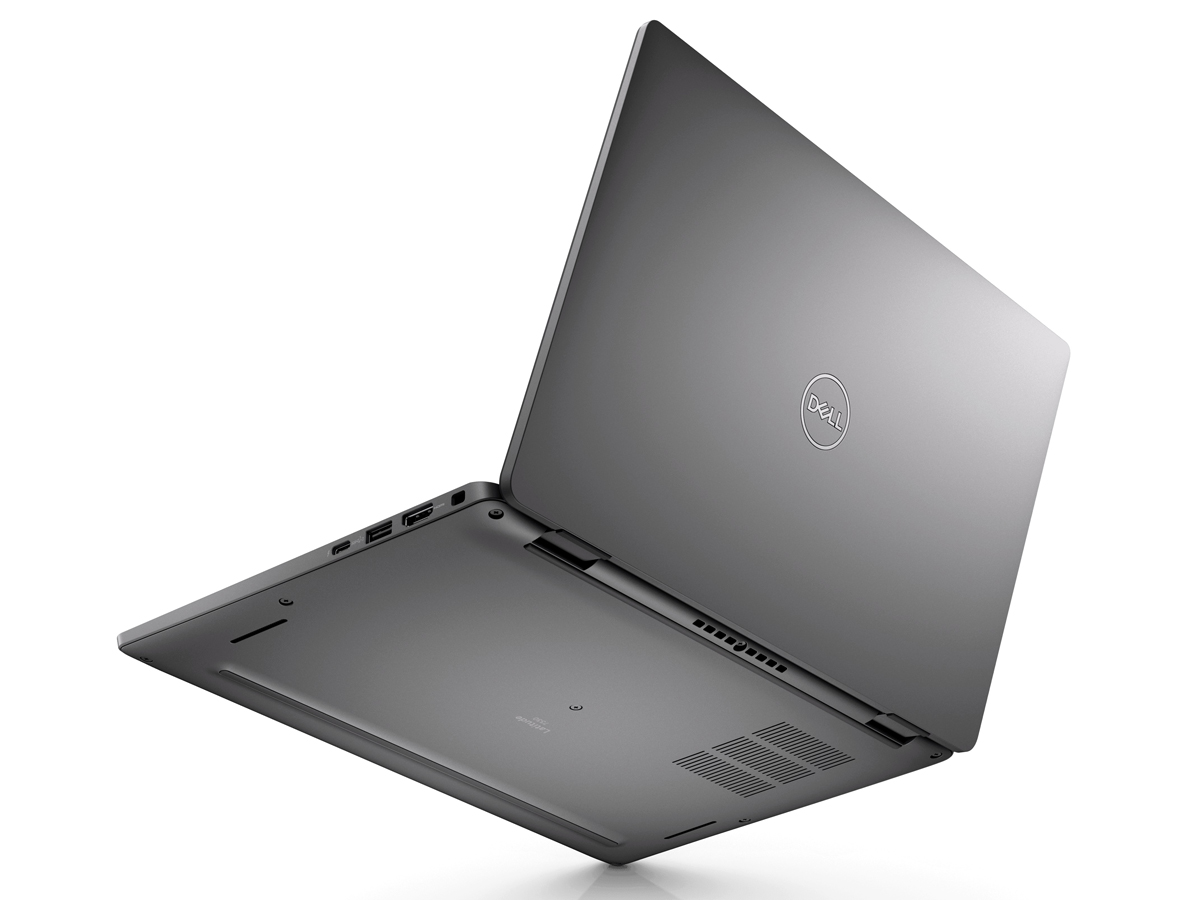
il existe déjà des ordinateurs portables de 13 pouces promettant de peser 1 kg, voire moins, mais ils sont presque toujours accompagnés de certaines réserves. En particulier, ces modèles sont généralement beaucoup plus flexibles, ce qui donne une impression générale moins bonne en termes de durabilité. Passez juste une minute avec le LG Gram 13 comparé au plus lourd Dell XPS 13 9310 et les différences de finesse de leurs squelettes deviennent immédiatement perceptibles. Le Latitude 7330 a en quelque sorte évité la tendance en étant plus rigide que prévu pour une construction de 1 kg. La base, par exemple, ne se tord pas ou ne se plie pas autant que sur le LG susmentionné. La rigidité globale se situe quelque part entre celle du Gram 13 et du XPS 13, ce que nous considérons comme un compromis équitable si vous appréciez le poids super léger.
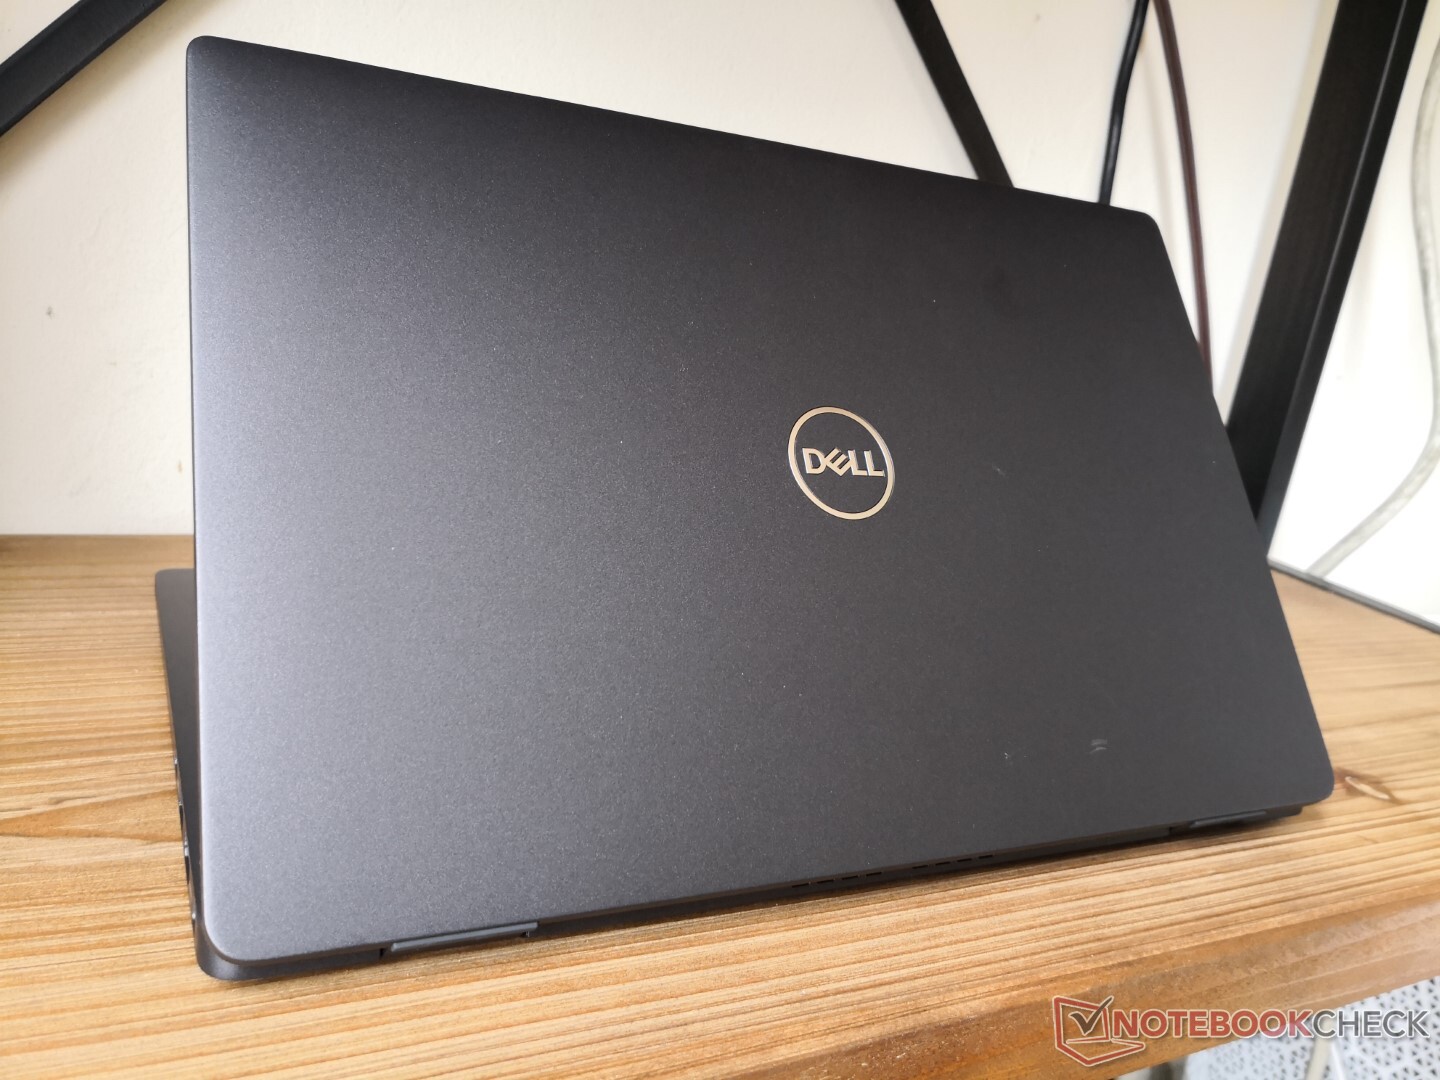
Le poids très faible de seulement 1 kg est le principal argument de vente de l'option en alliage de magnésium. La plupart des ordinateurs portables de cette catégorie pèsent généralement quelques centaines de grammes de plus, ce qui se remarque lors des déplacements ou du travail en déplacement. Les dimensions globales sont à peine inférieures à celles du Latitude 7310 qui était déjà assez petit
Si l'on opte pour les options en fibre de carbone ou en aluminium, le poids augmente d'environ 160 g et 240 g, respectivement, par rapport à notre option en magnésium.
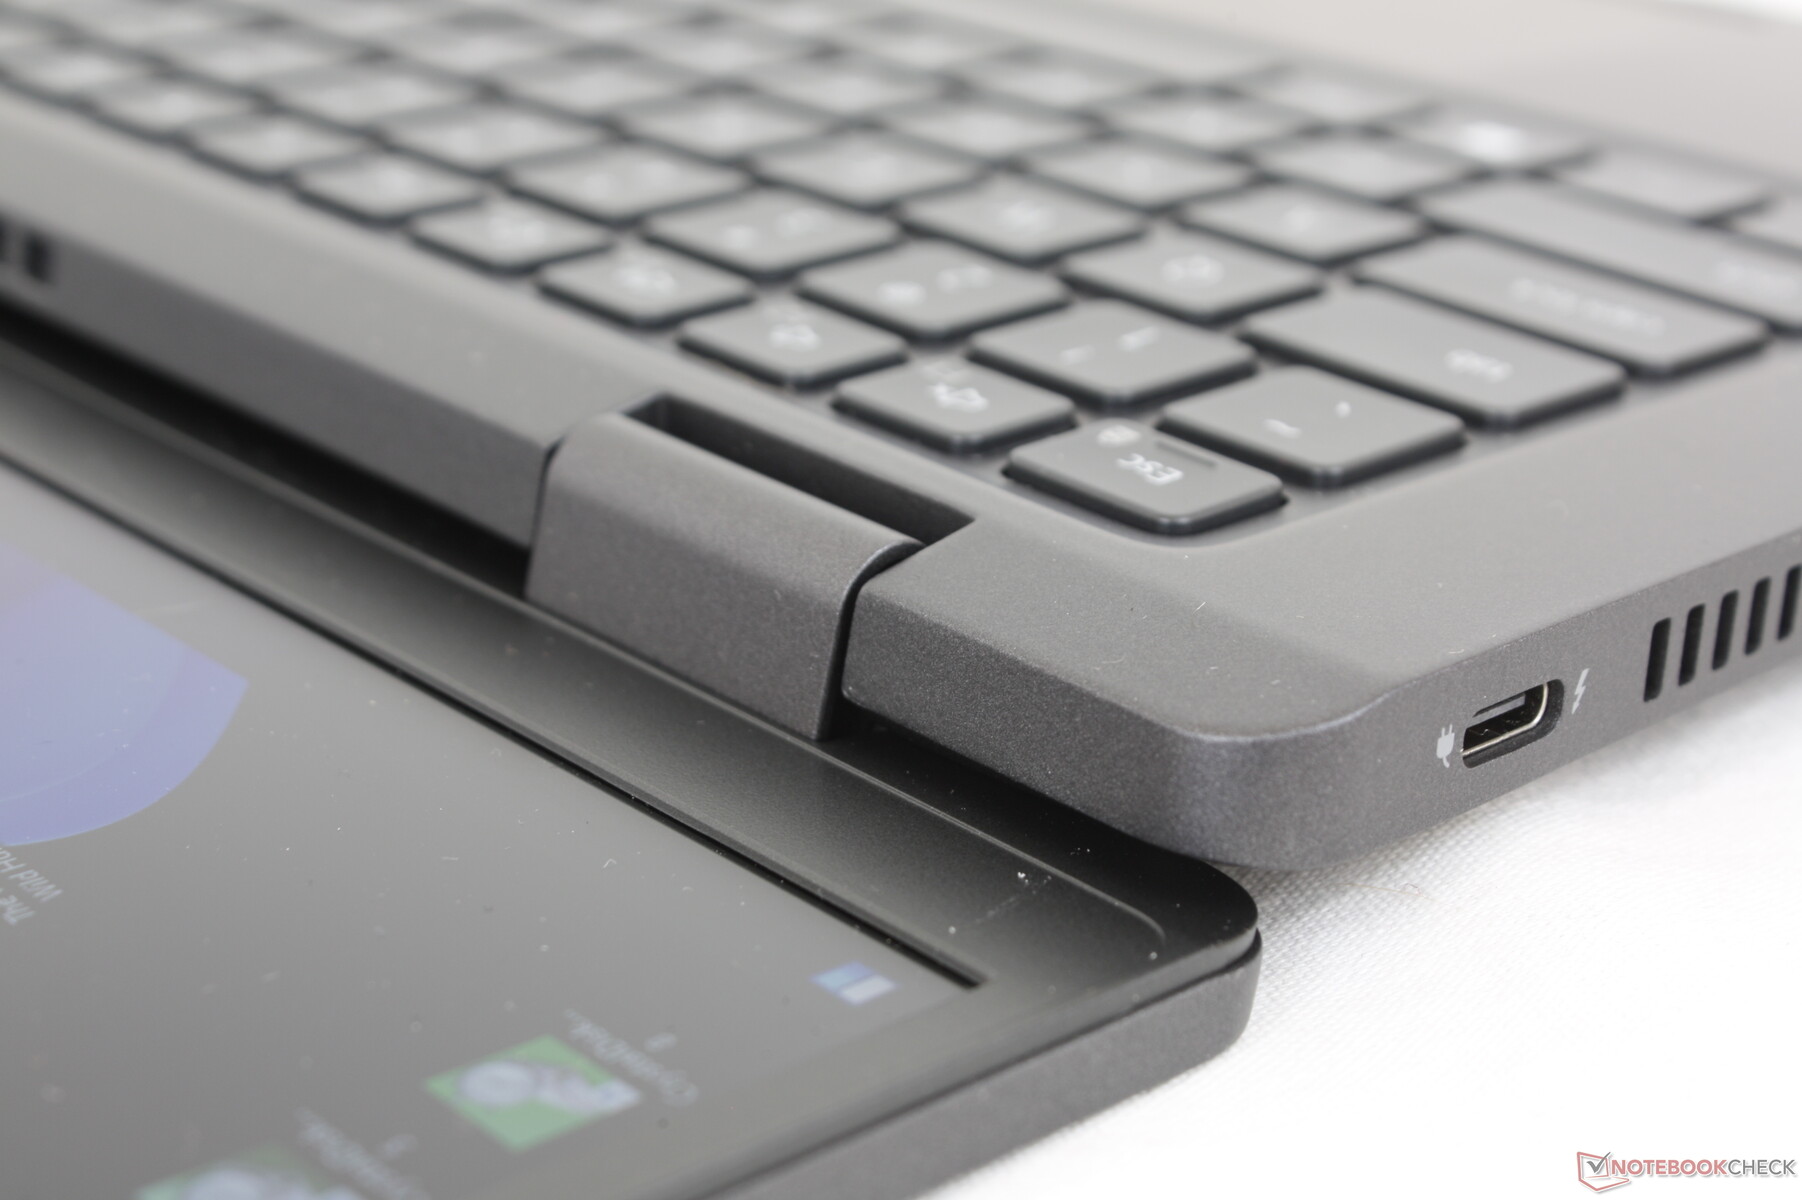
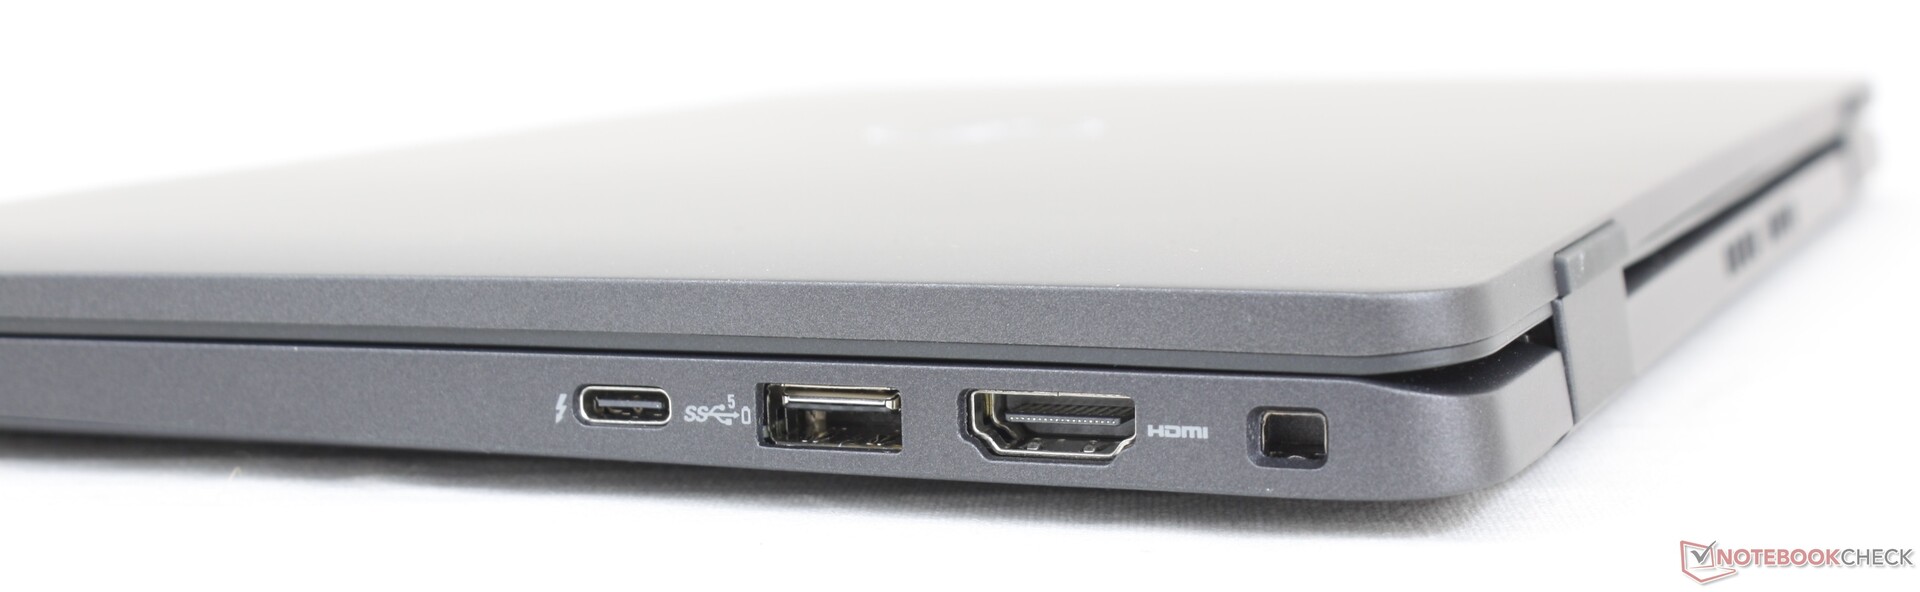
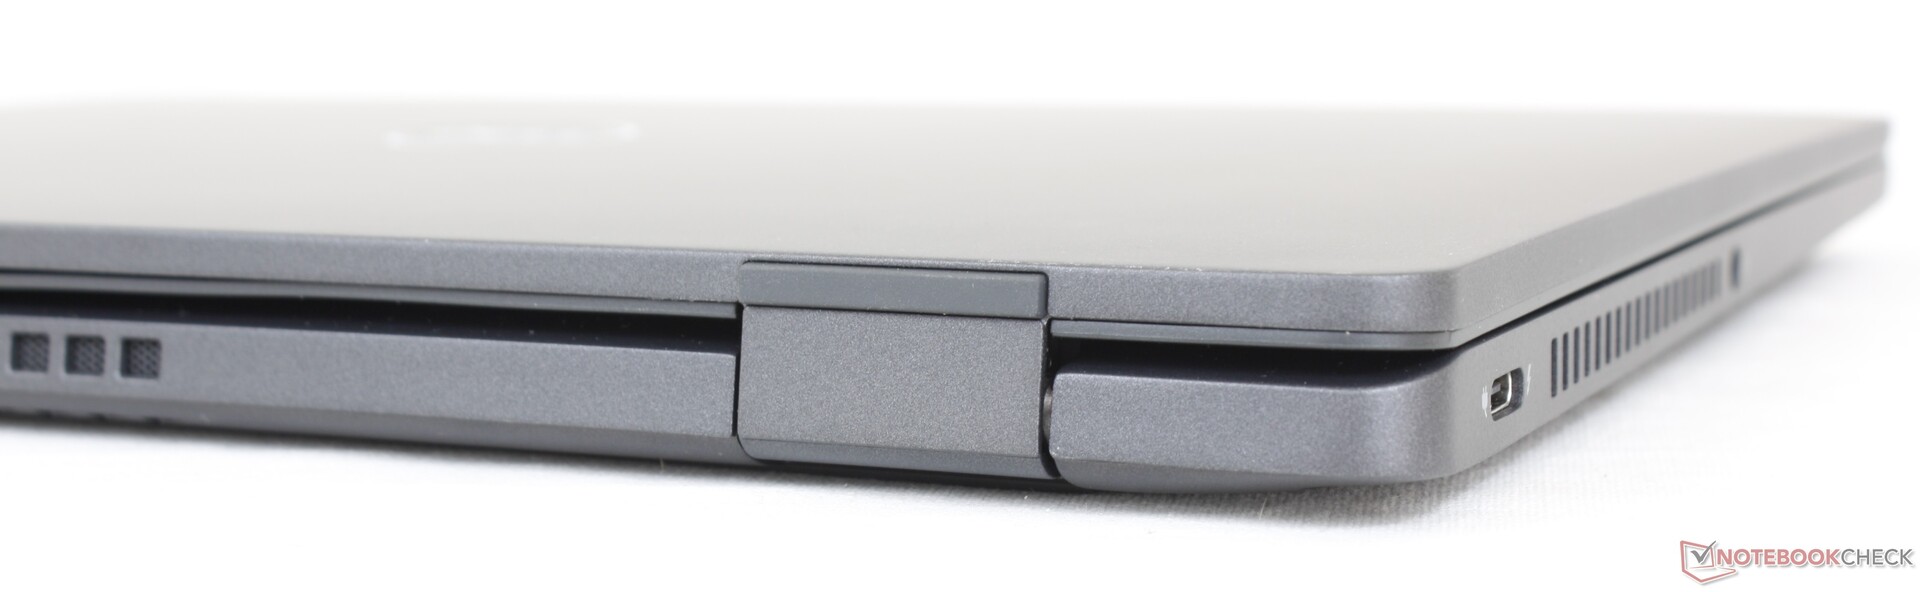
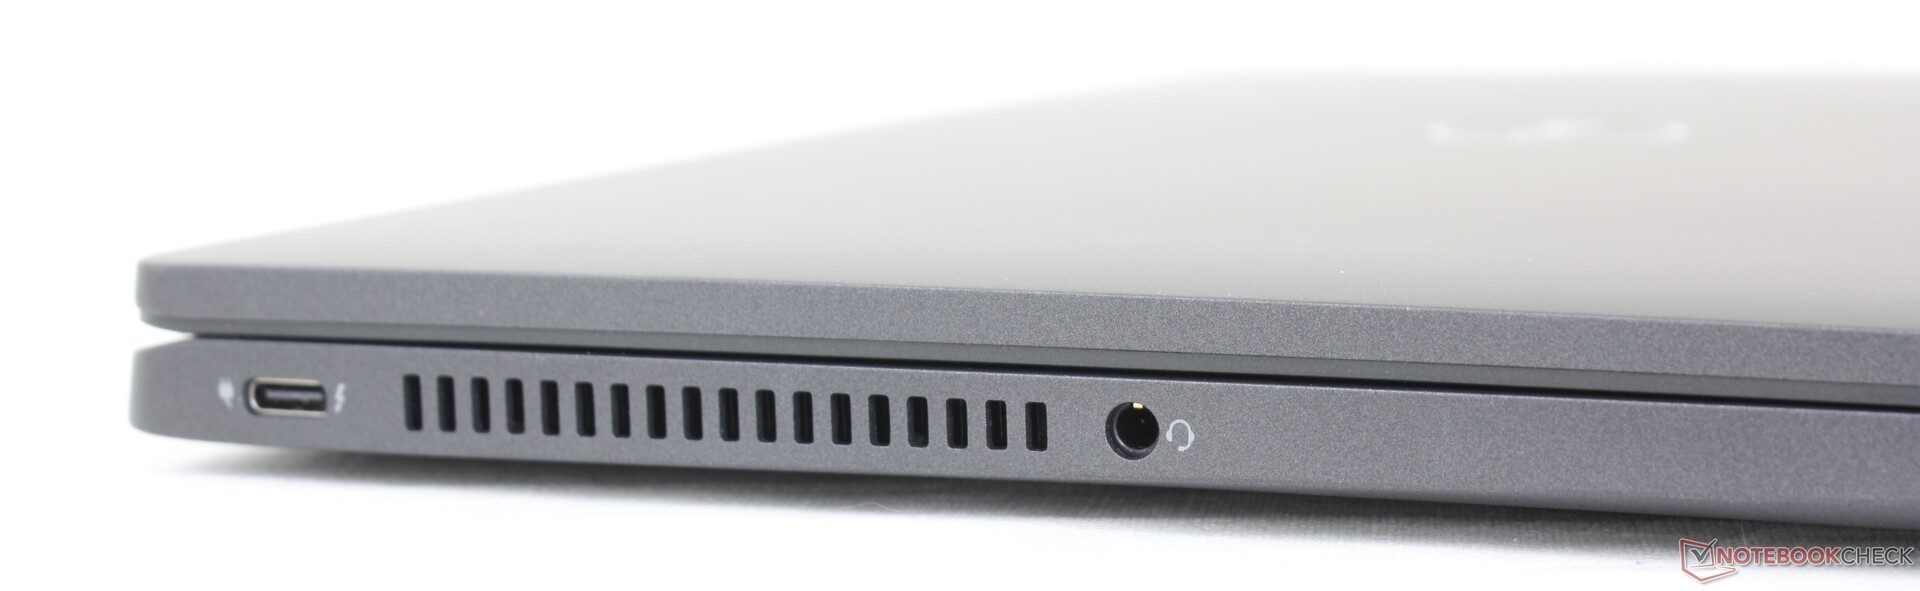
Connectivité - Support Thunderbolt 4
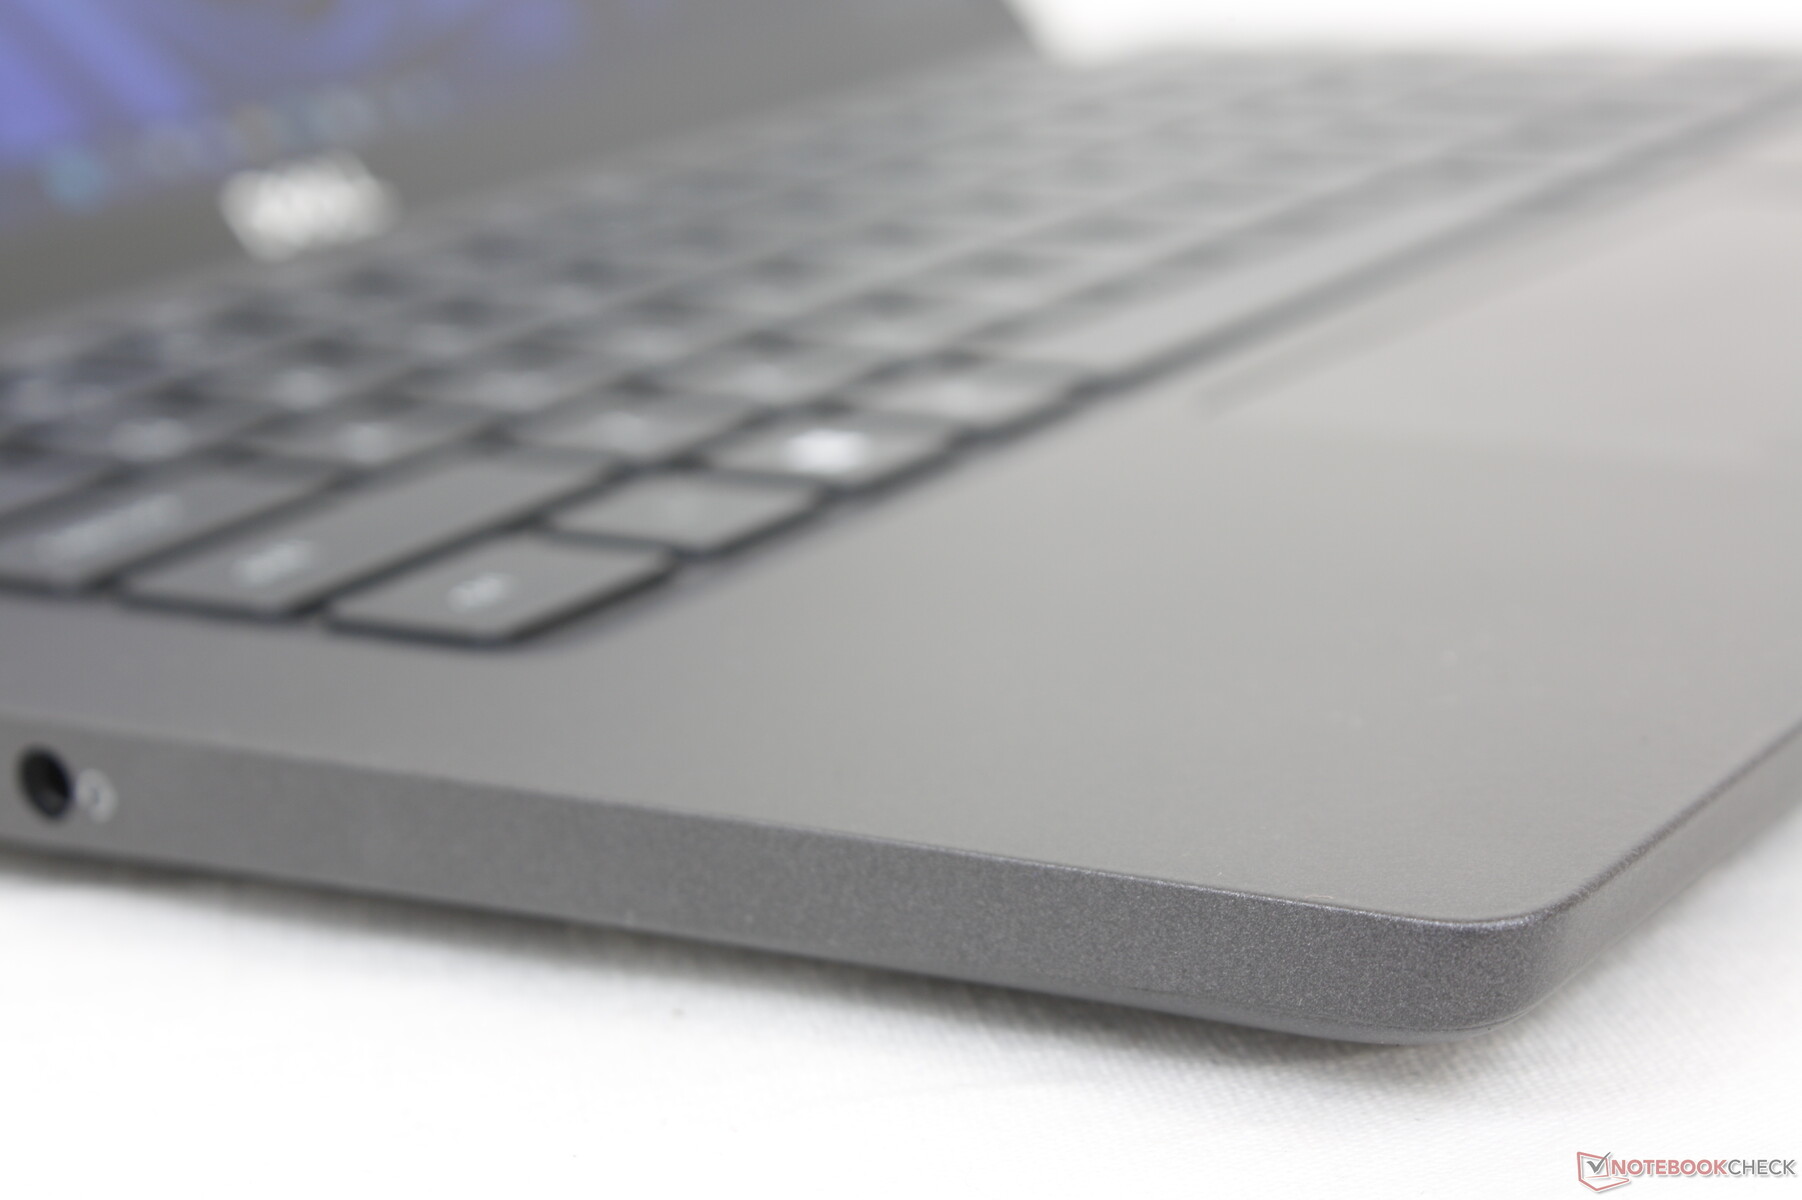
Les options de port sont les mêmes que sur le Latitude 7310, mais elles ont été réorganisées pour être plus pratiques. Les deux ports USB-C, par exemple, se trouvent désormais chacun le long des bords gauche et droit du châssis, respectivement, contre seulement le bord gauche sur l'ancien modèle. Ce changement permet aux utilisateurs de charger l'ordinateur portable d'un côté ou de l'autre.
Communication - LTE en option
L'Intel AX211 est équipé en standard des connectivités Wi-Fi 6E et Bluetooth 5.2. Nous n'avons rencontré aucun problème de connectivité majeur lorsque nous l'avons couplé à notre réseau 6 GHz. Les différences de performances entre le Wi-Fi 6 et le Wi-Fi 6E seront minimes pour la plupart des utilisateurs.
Bien que notre appareil ne soit pas configuré avec le WAN, les utilisateurs ont la possibilité de le configurer avec un module Qualcomm Snapdragon X20 LTE-A CAT 9 ou CAT 16 compatible eSIM.
| Networking | |
| iperf3 transmit AX12 | |
| Microsoft Surface Laptop 4 13 Ryzen 5 | |
| Dell Latitude 7310 | |
| Razer Book 13 FHD | |
| Lenovo ThinkPad X13 Yoga 20SX0004GE | |
| iperf3 receive AX12 | |
| Razer Book 13 FHD | |
| Microsoft Surface Laptop 4 13 Ryzen 5 | |
| Dell Latitude 7310 | |
| Lenovo ThinkPad X13 Yoga 20SX0004GE | |
| iperf3 receive AXE11000 6GHz | |
| Framework Laptop 13.5 12th Gen Intel | |
| Dell Latitude 13 7330 | |
| iperf3 transmit AXE11000 6GHz | |
| Dell Latitude 13 7330 | |
| Framework Laptop 13.5 12th Gen Intel | |
Webcam
Les utilisateurs peuvent choisir entre une webcam HD (720p) ou FHD (1080p) avec IR en option pour le support de Windows Hello. Nous recommandons de passer à 1080p car la qualité d'image de notre configuration 720p est floue et brutalement dépassée.
Un curseur d'obturateur manuel est installé pour la confidentialité.


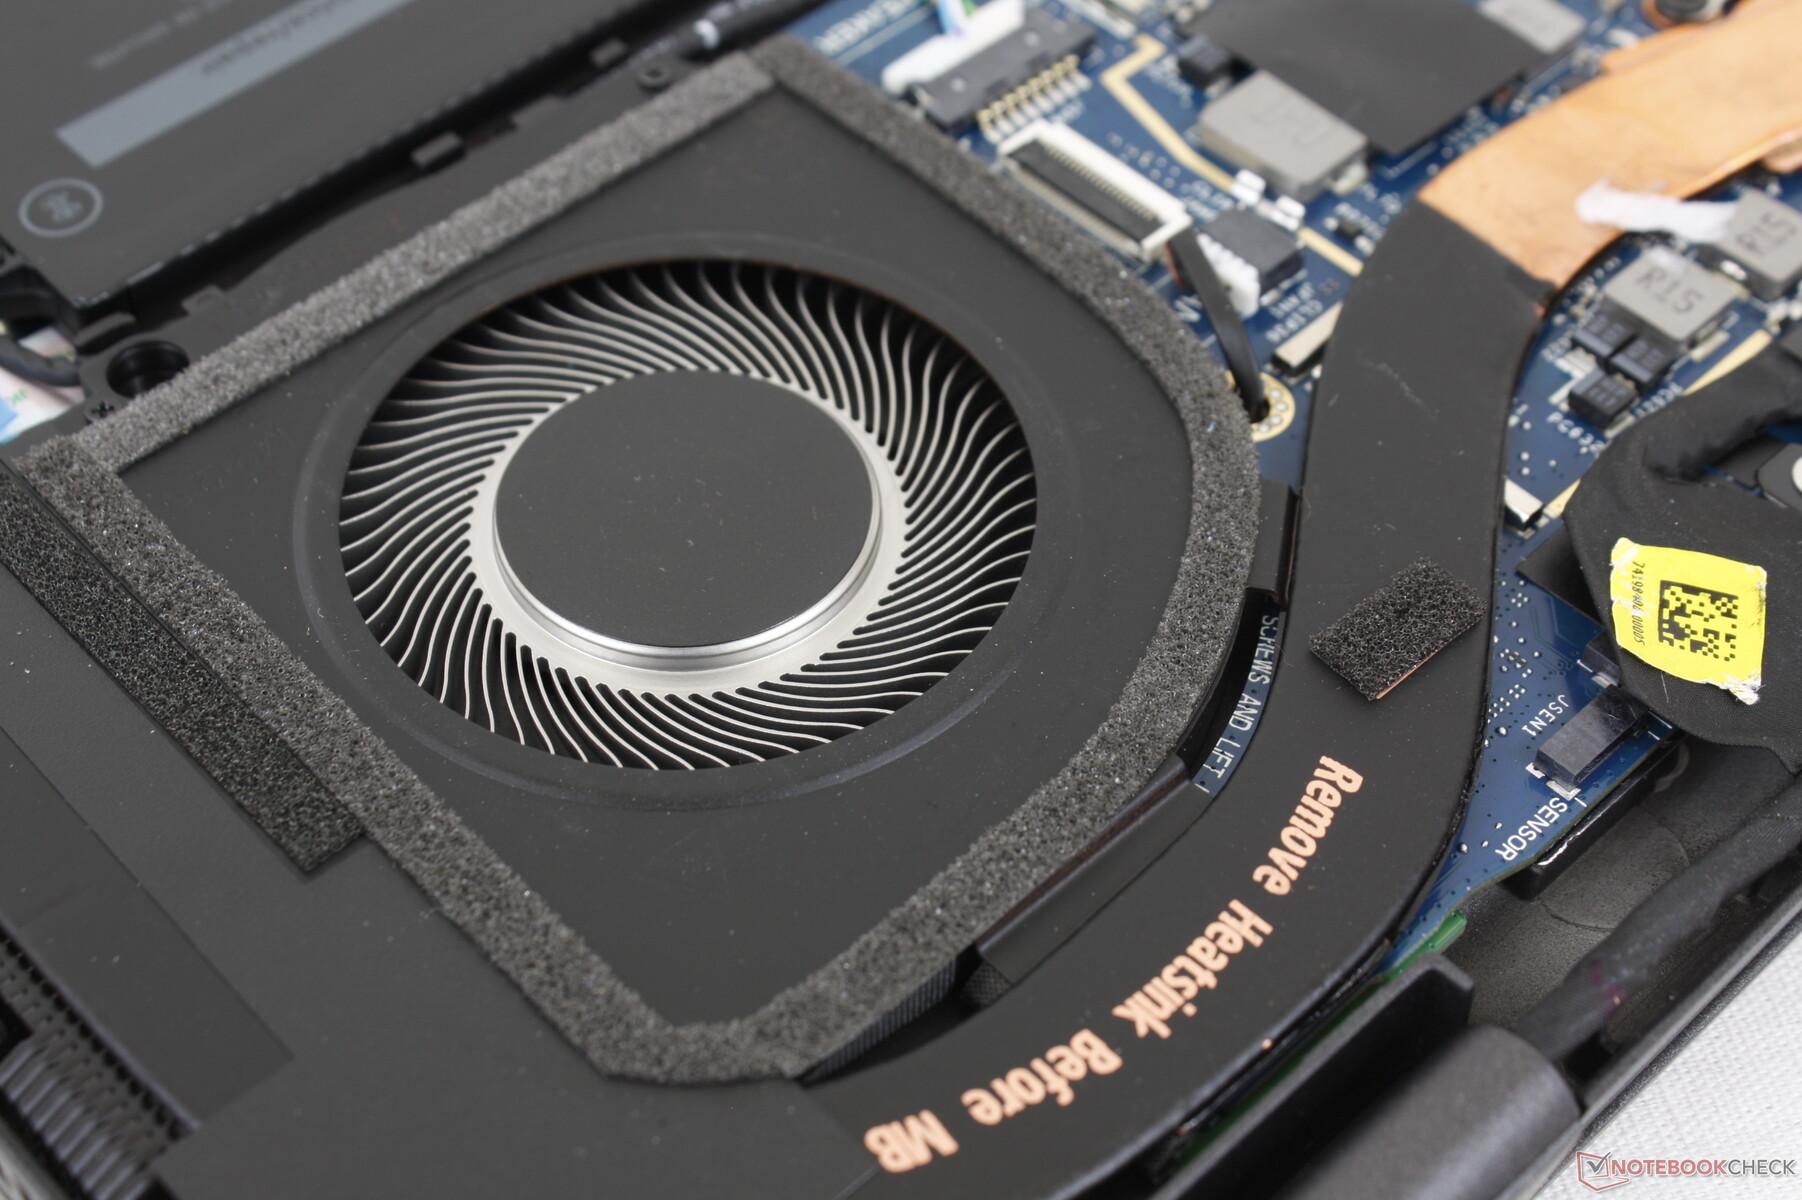
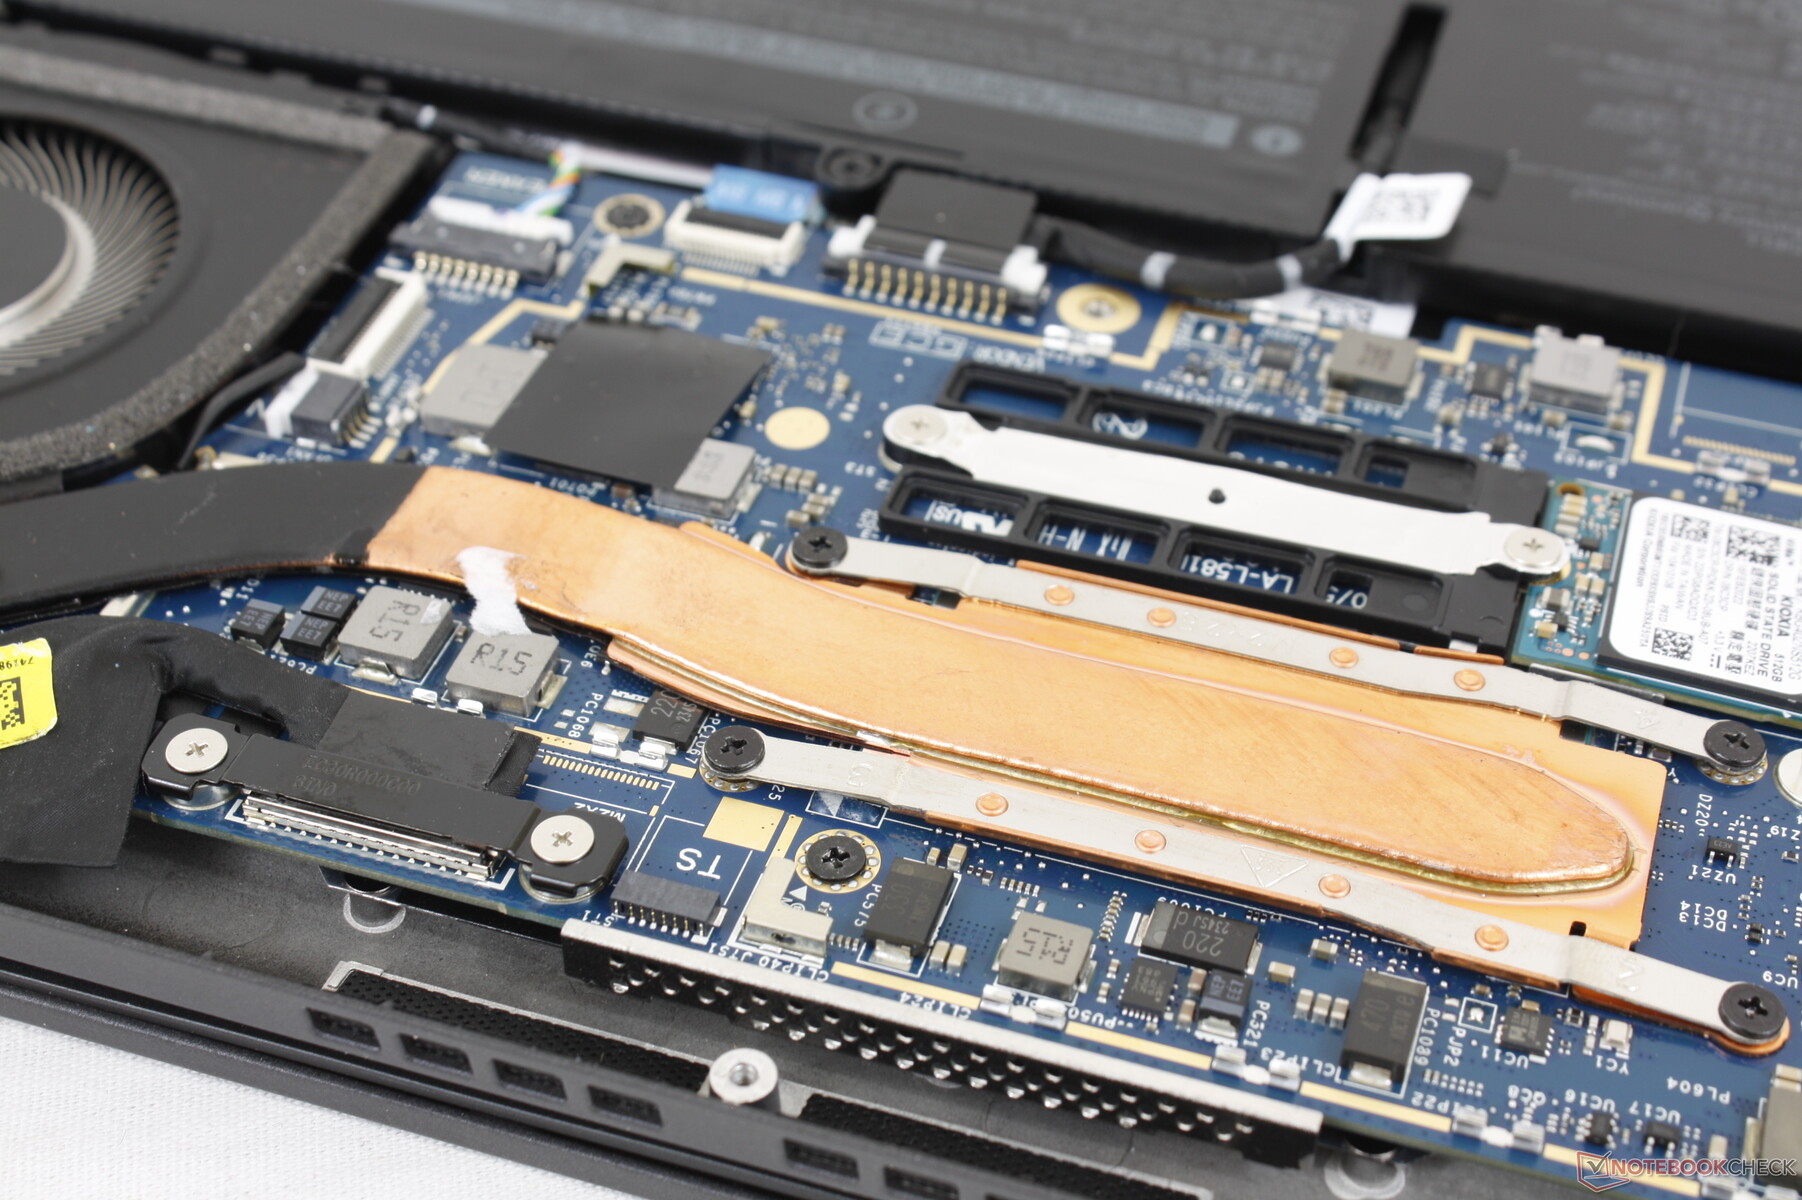
Maintenance
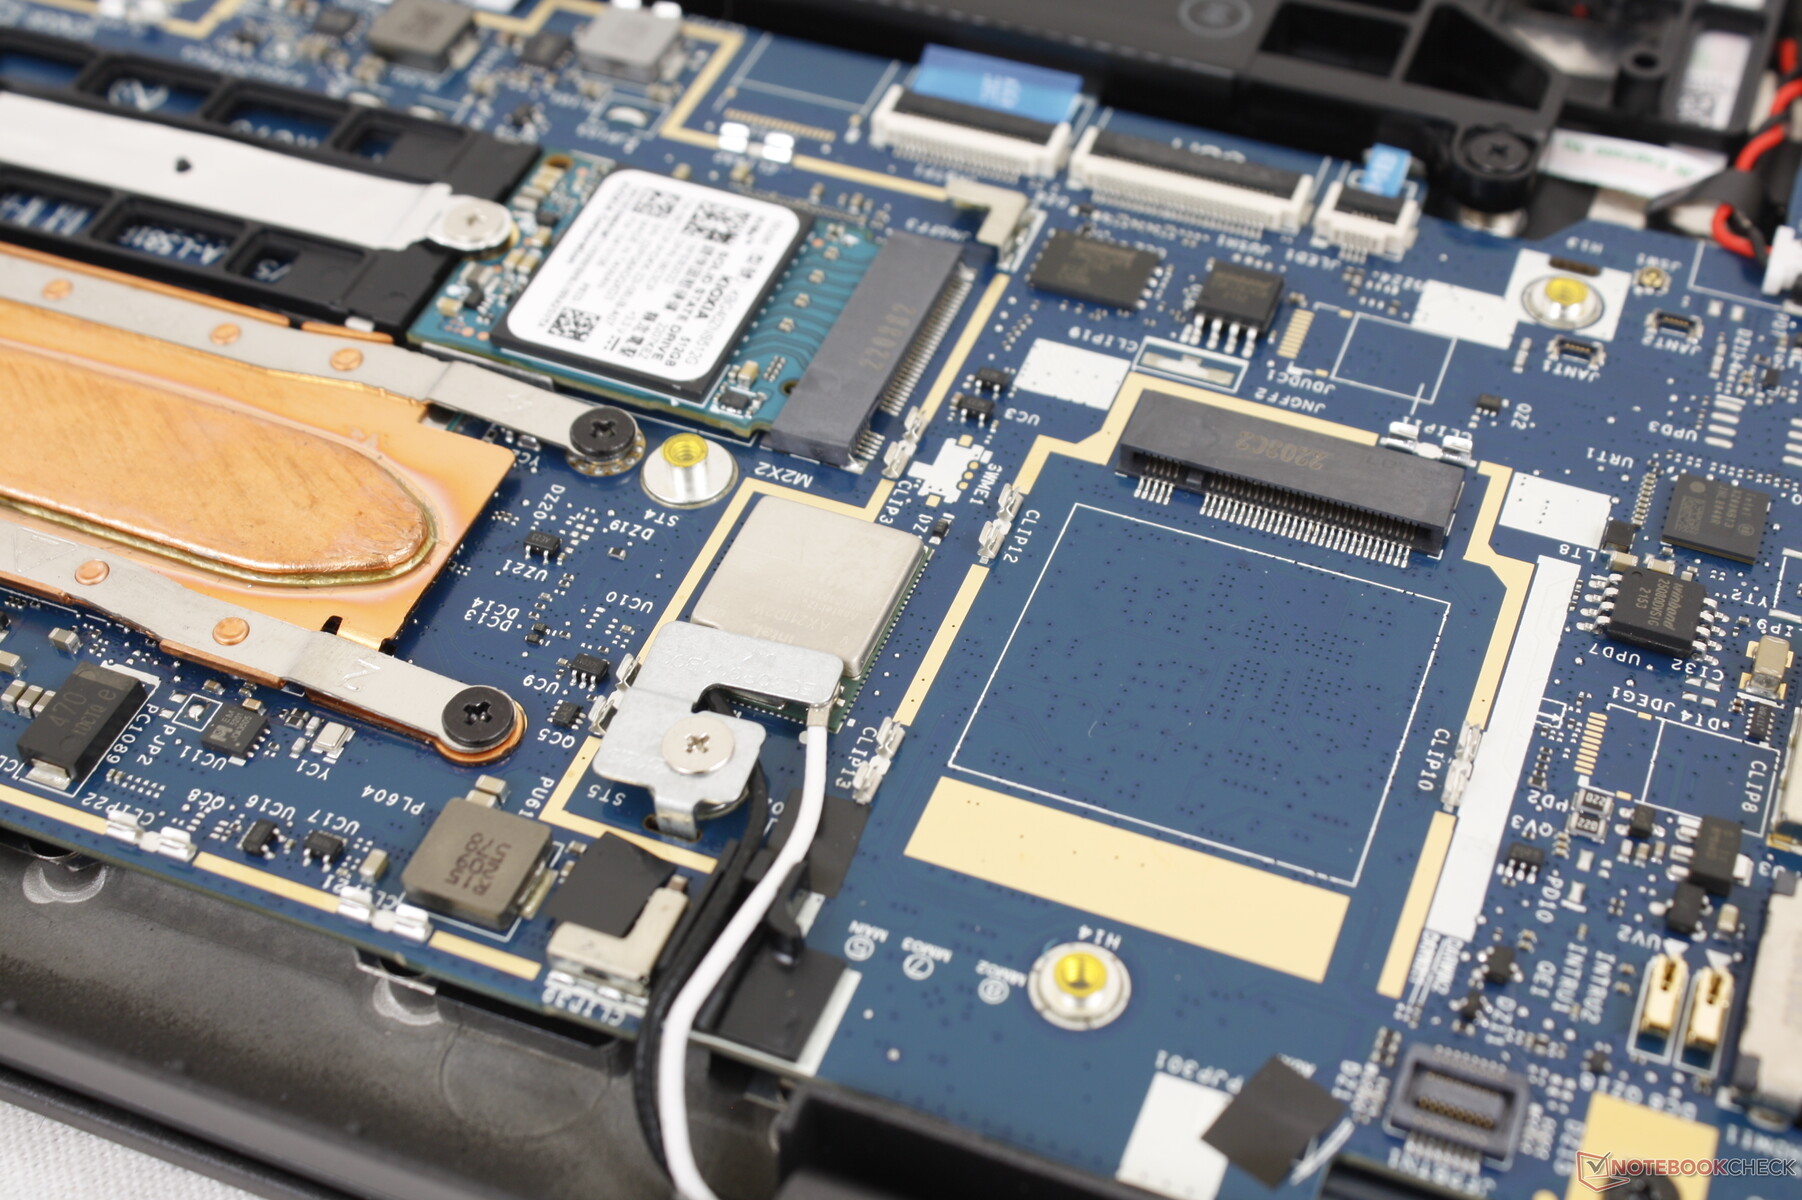
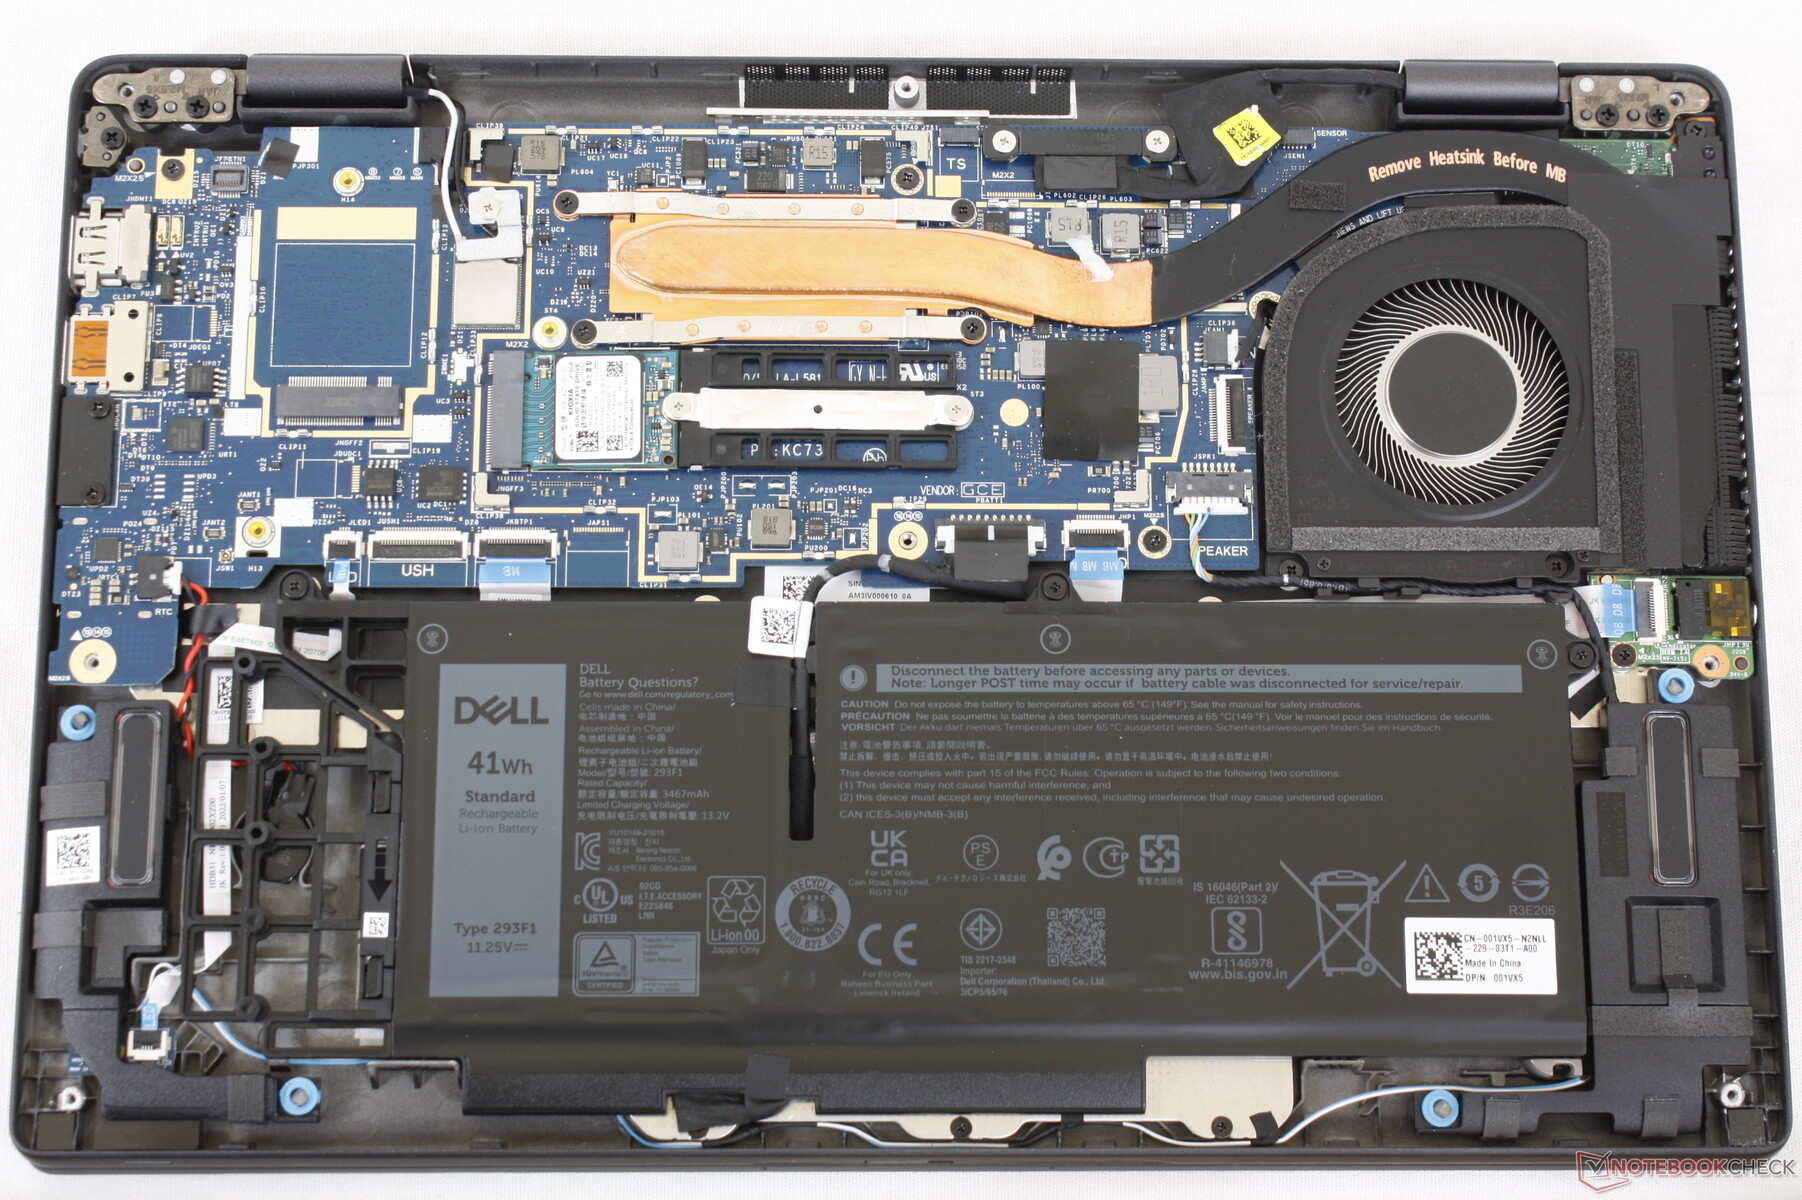
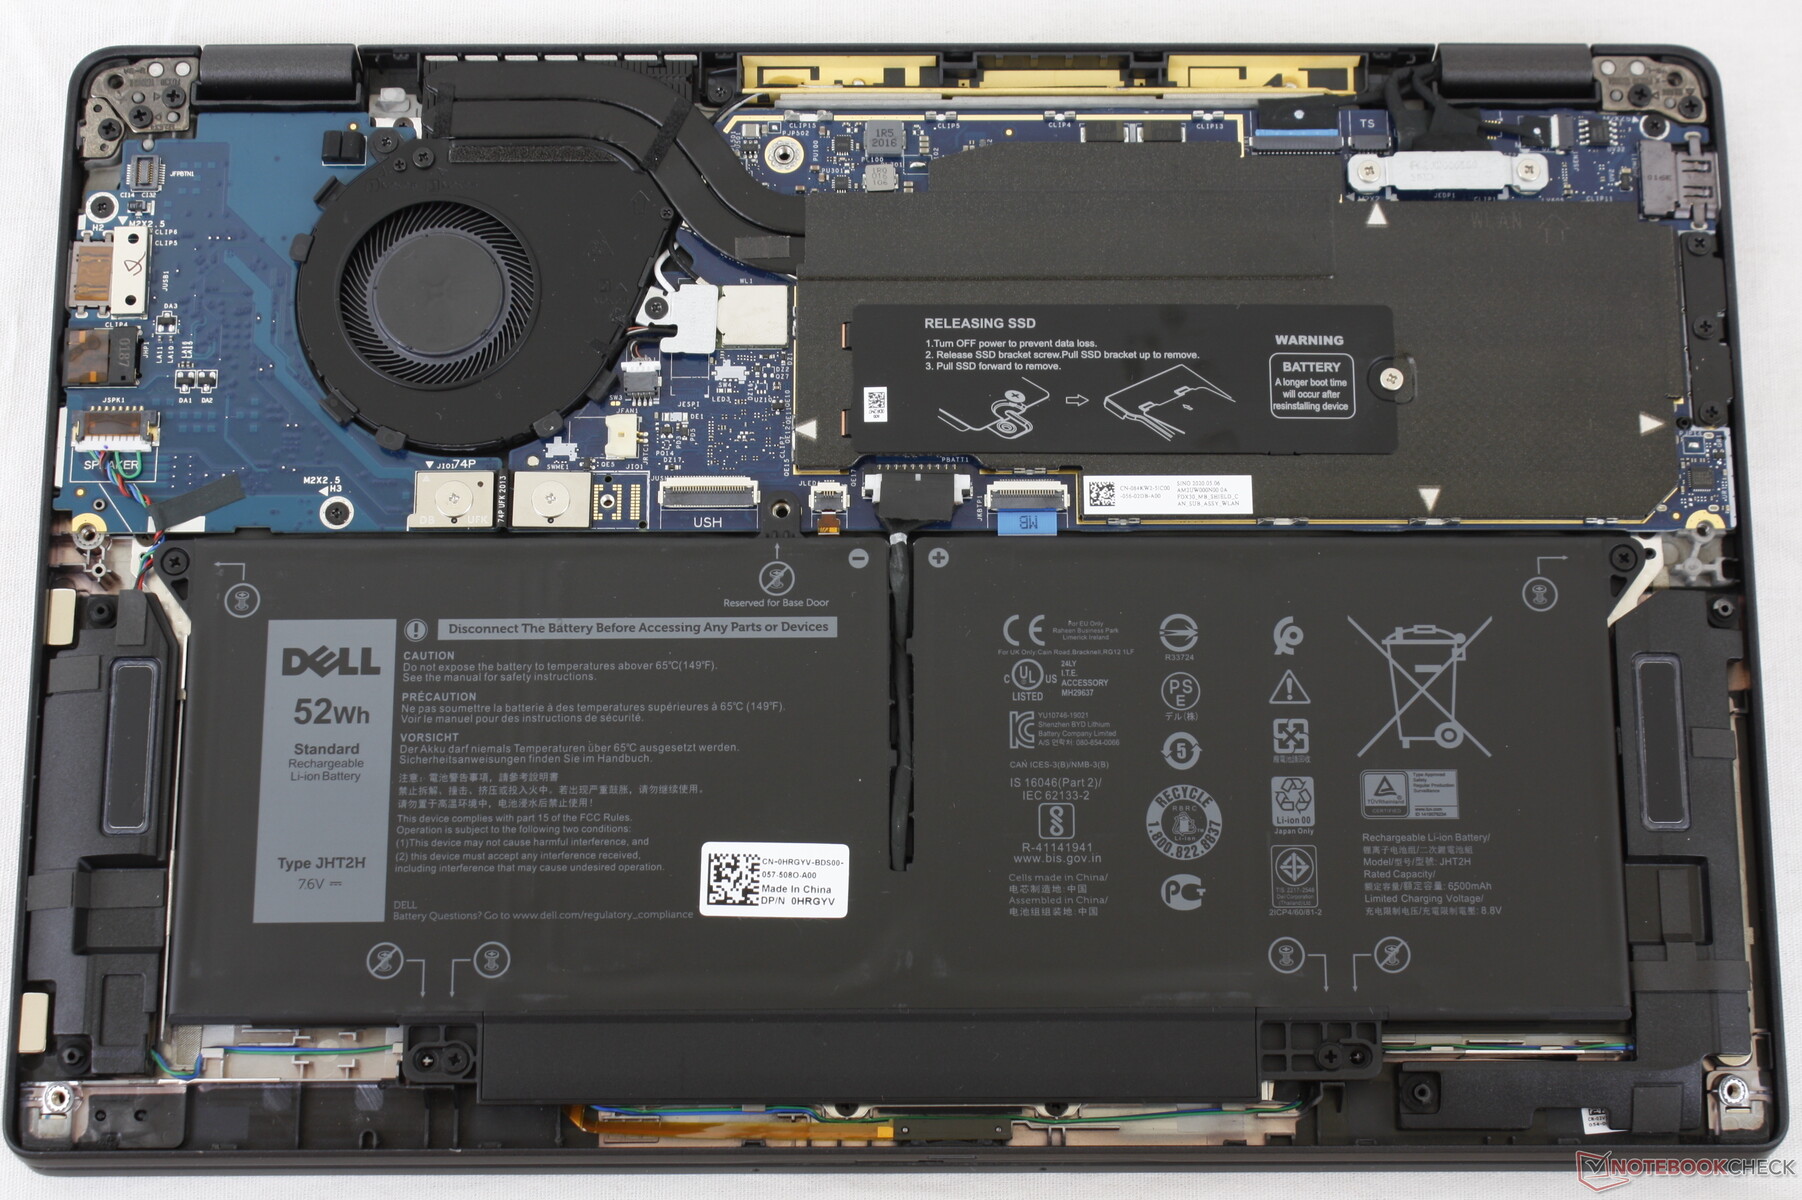
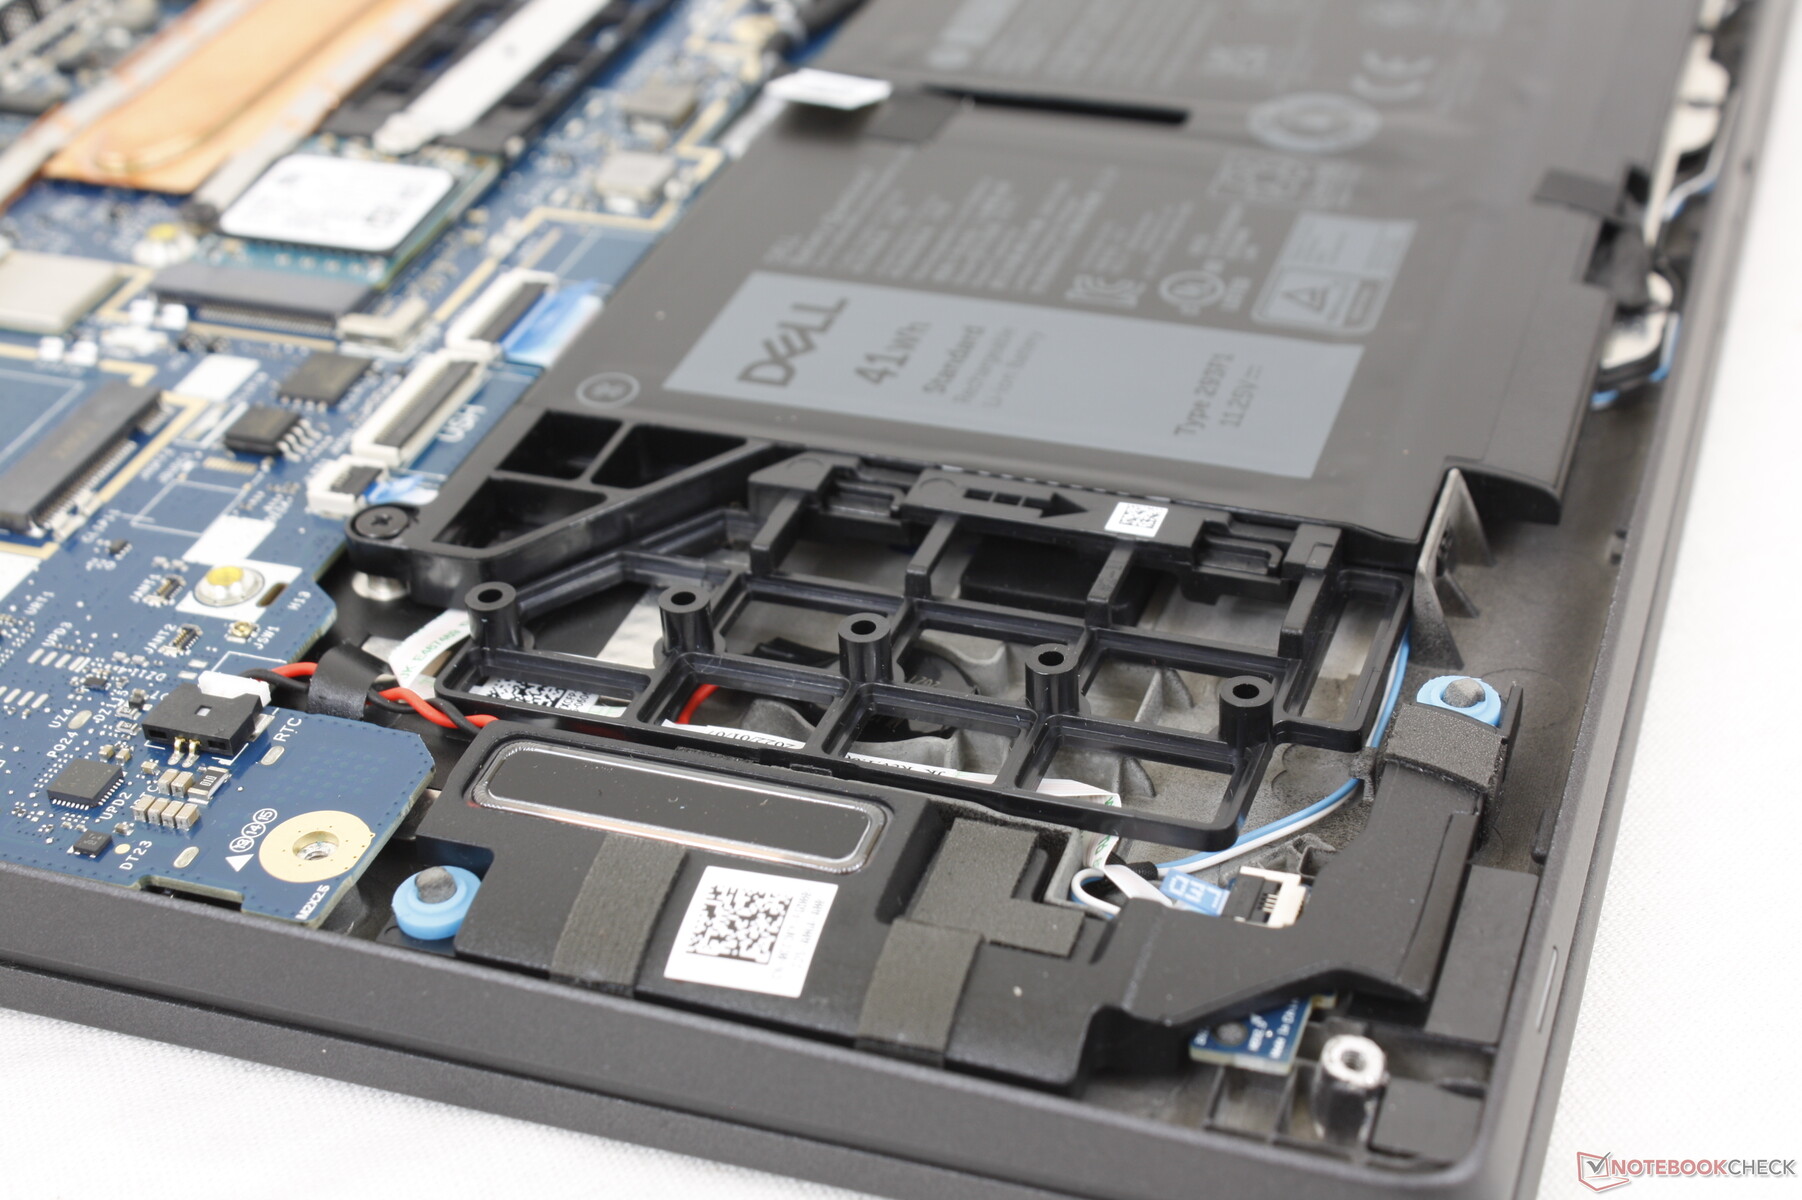
Le panneau inférieur est facilement démontable avec un simple tournevis Philips. Il n'y a pas grand-chose à réparer à part le SSD M.2 et la batterie puisque les modules WLAN et RAM sont soudés.
Notez qu'il n'y a pas d'antenne incluse en cas de configuration sans WAN pour décourager les propriétaires d'installer leur propre module WAN. En outre, notez l'espace vide à gauche de la batterie de 41 Wh pour réduire le poids ; cet espace est occupé si vous configurez avec l'option plus grande de 58 Wh.
Accessoires et garantie
Il n'y a pas d'extras dans la boîte, à part l'adaptateur secteur et les papiers. Une garantie de trois ans est fournie en standard, comme c'est le cas pour la plupart des modèles Latitude.
Périphériques d'entrée - Comme avant
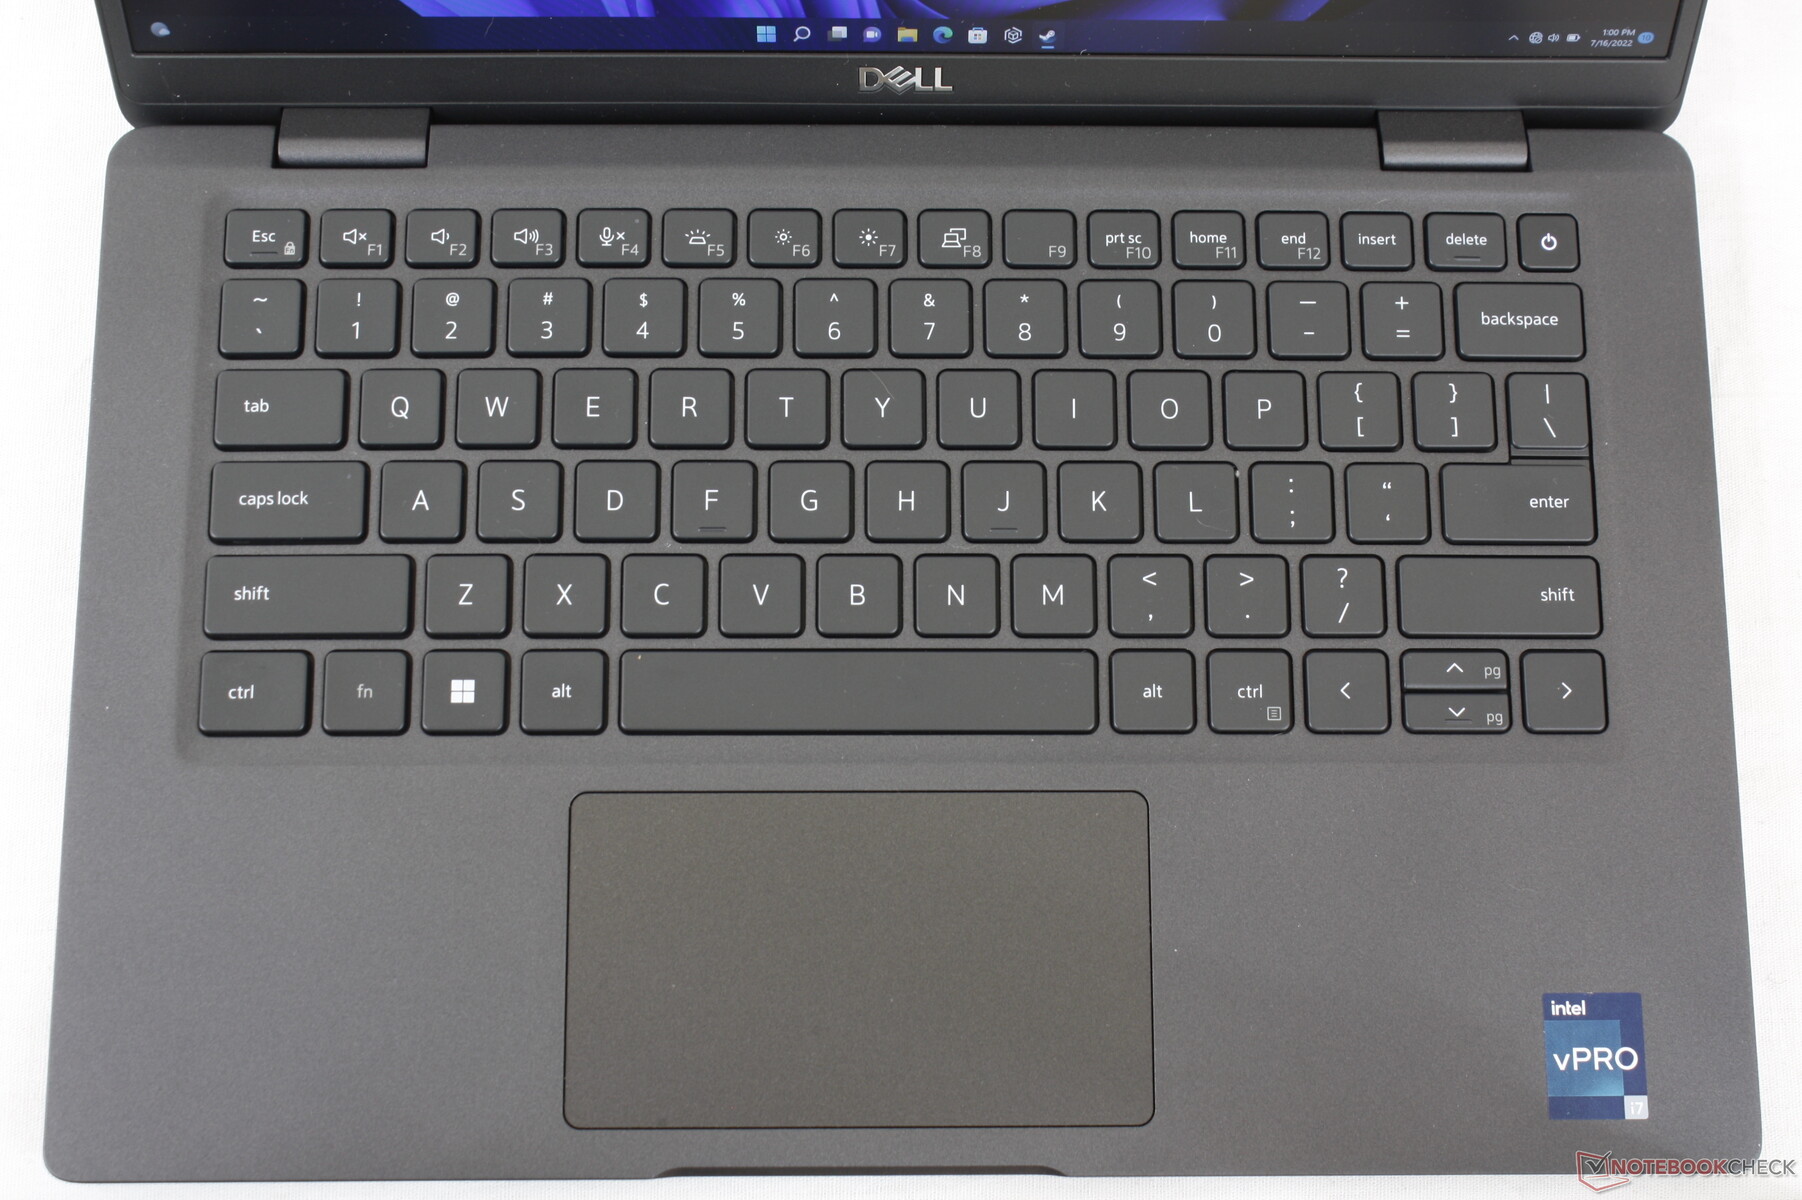
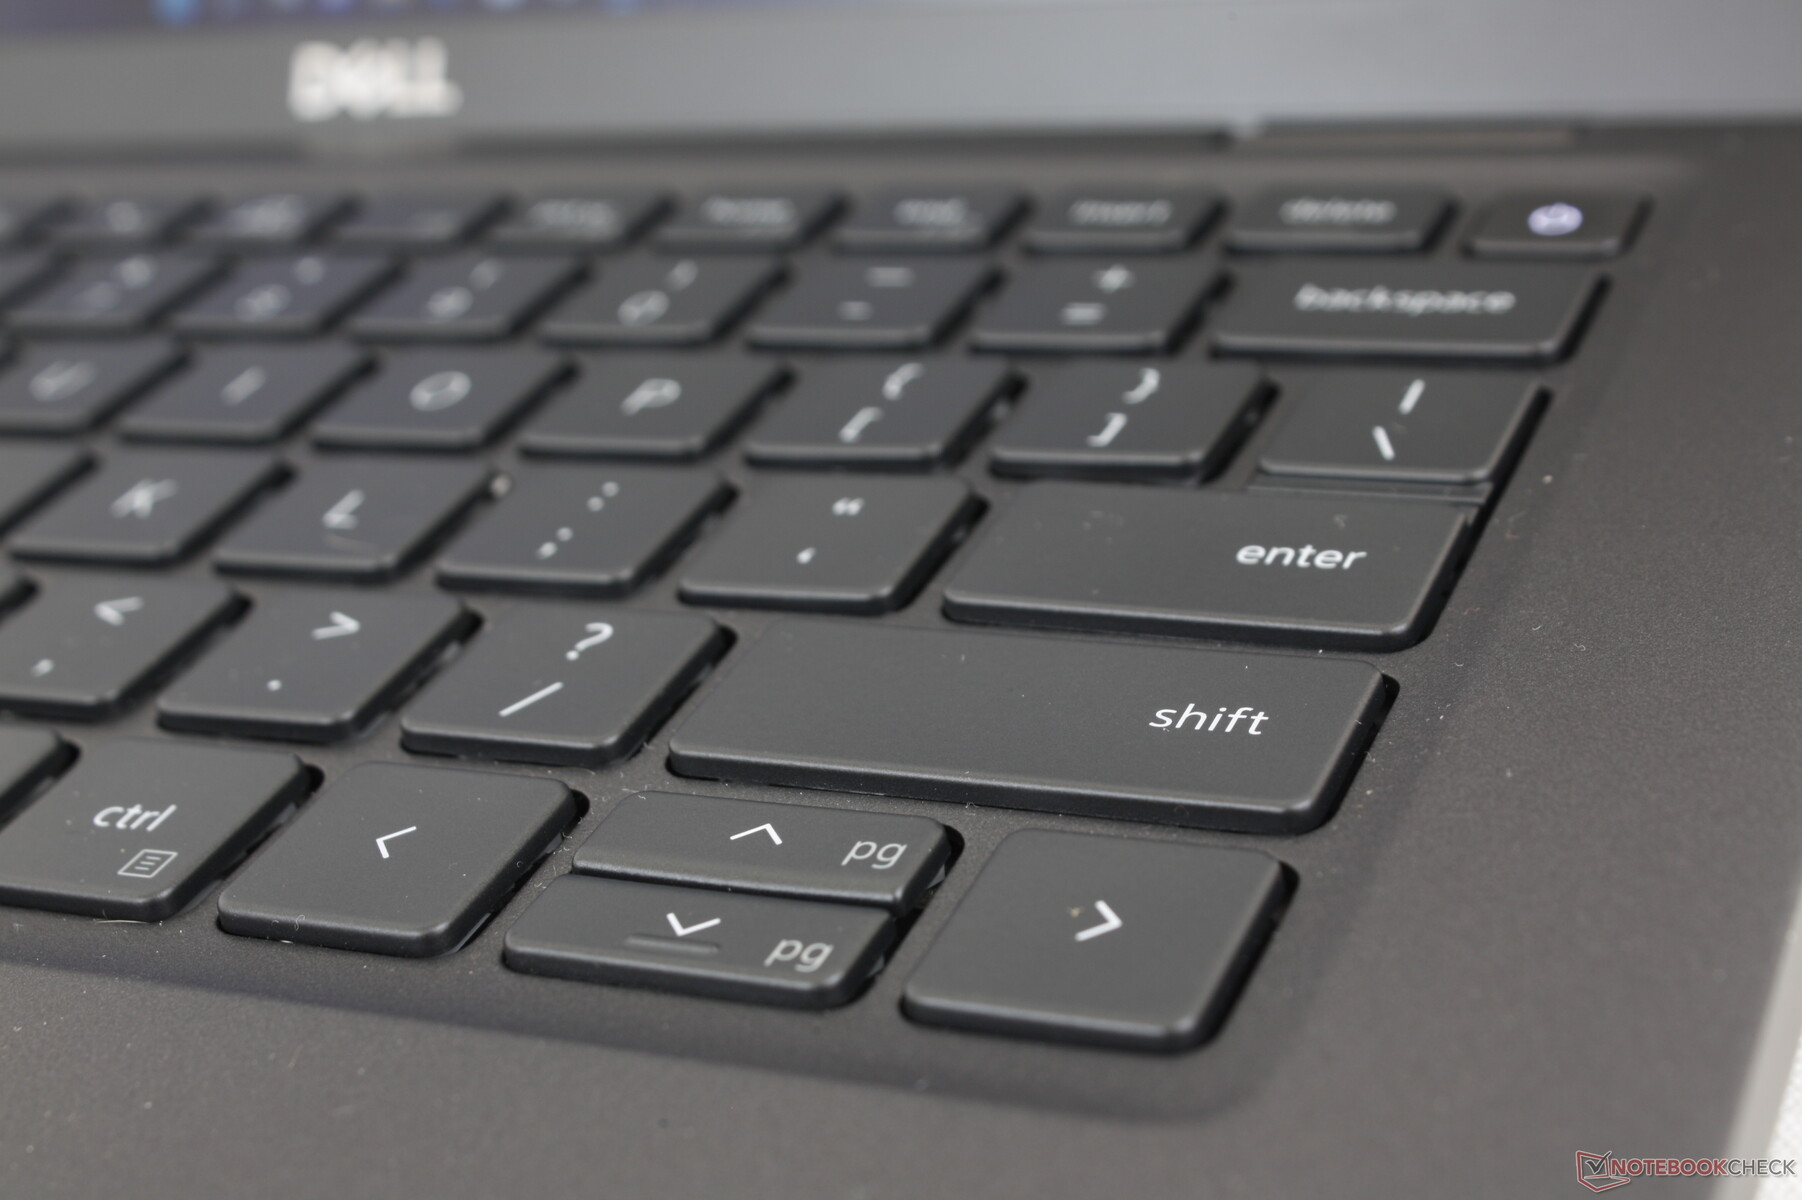
Clavier
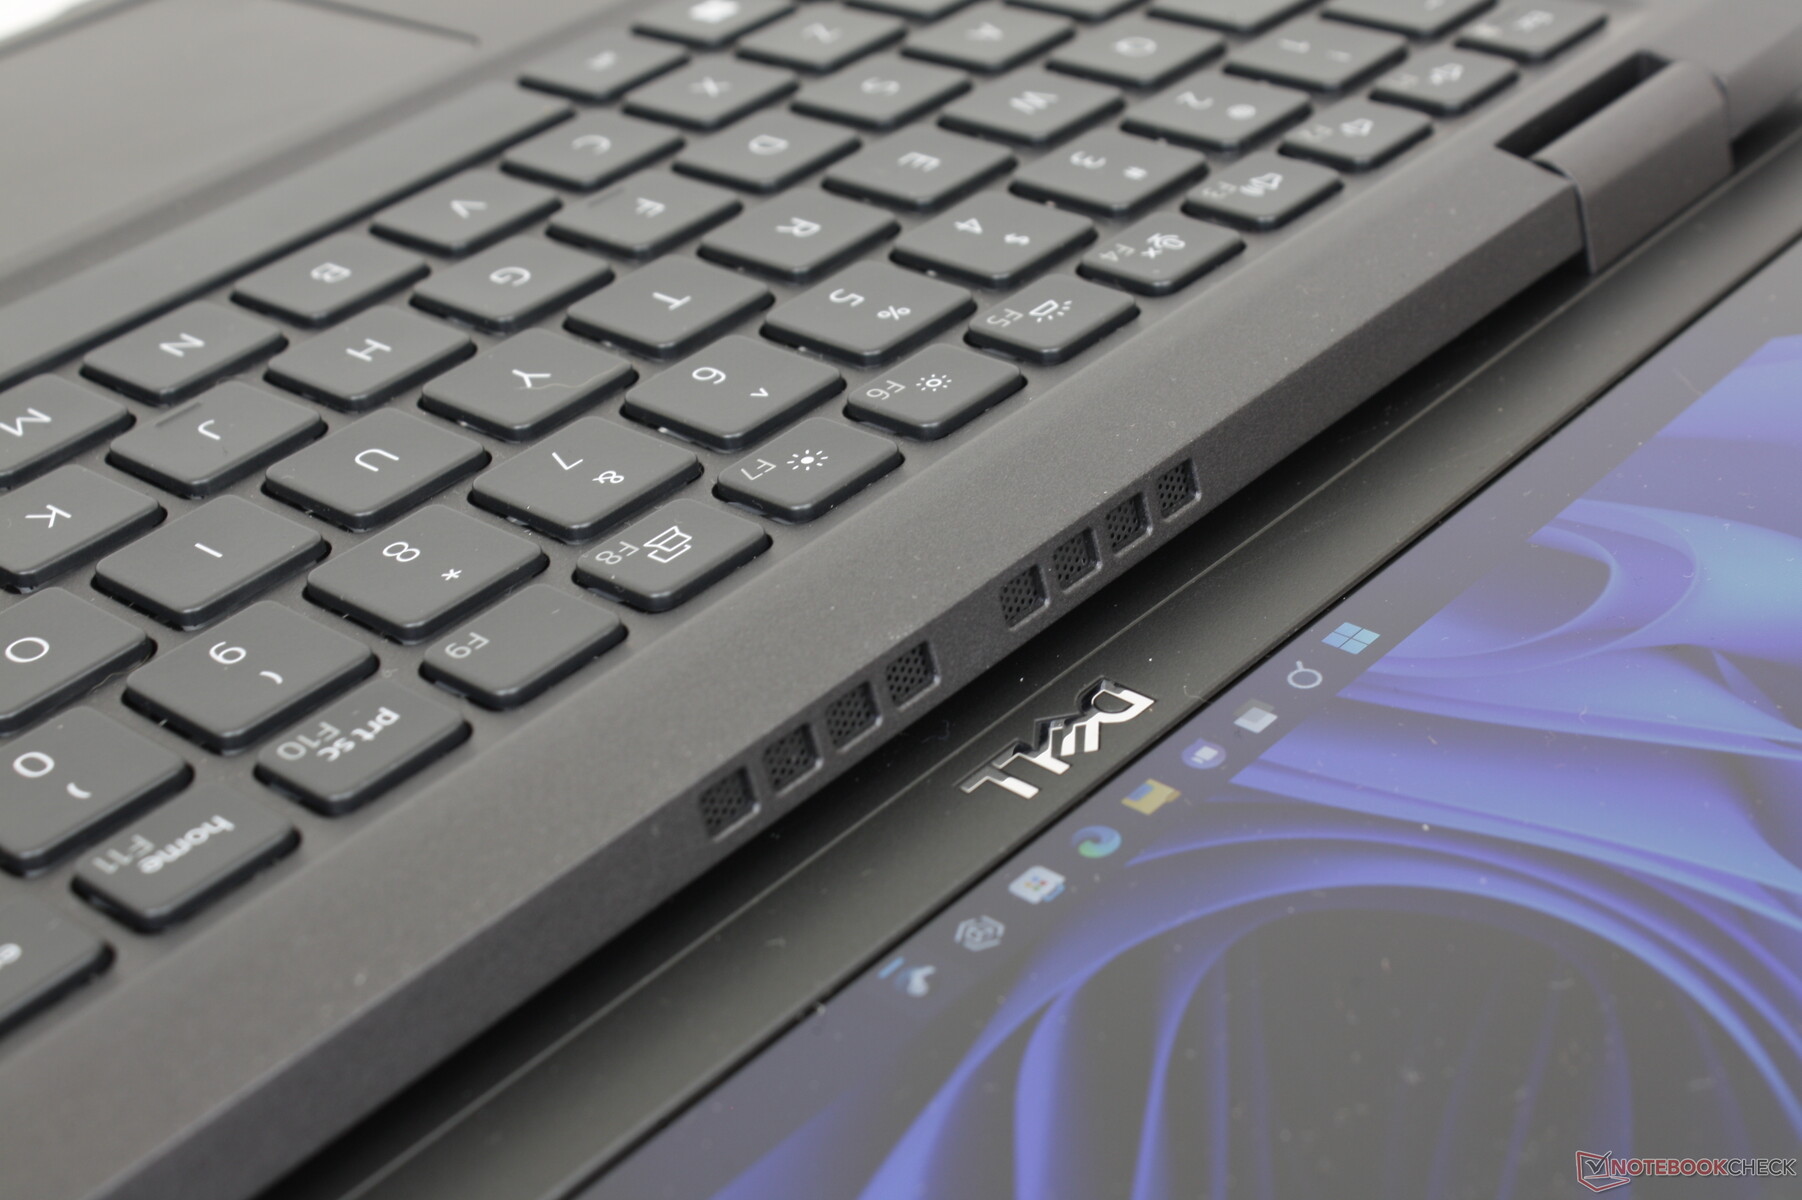
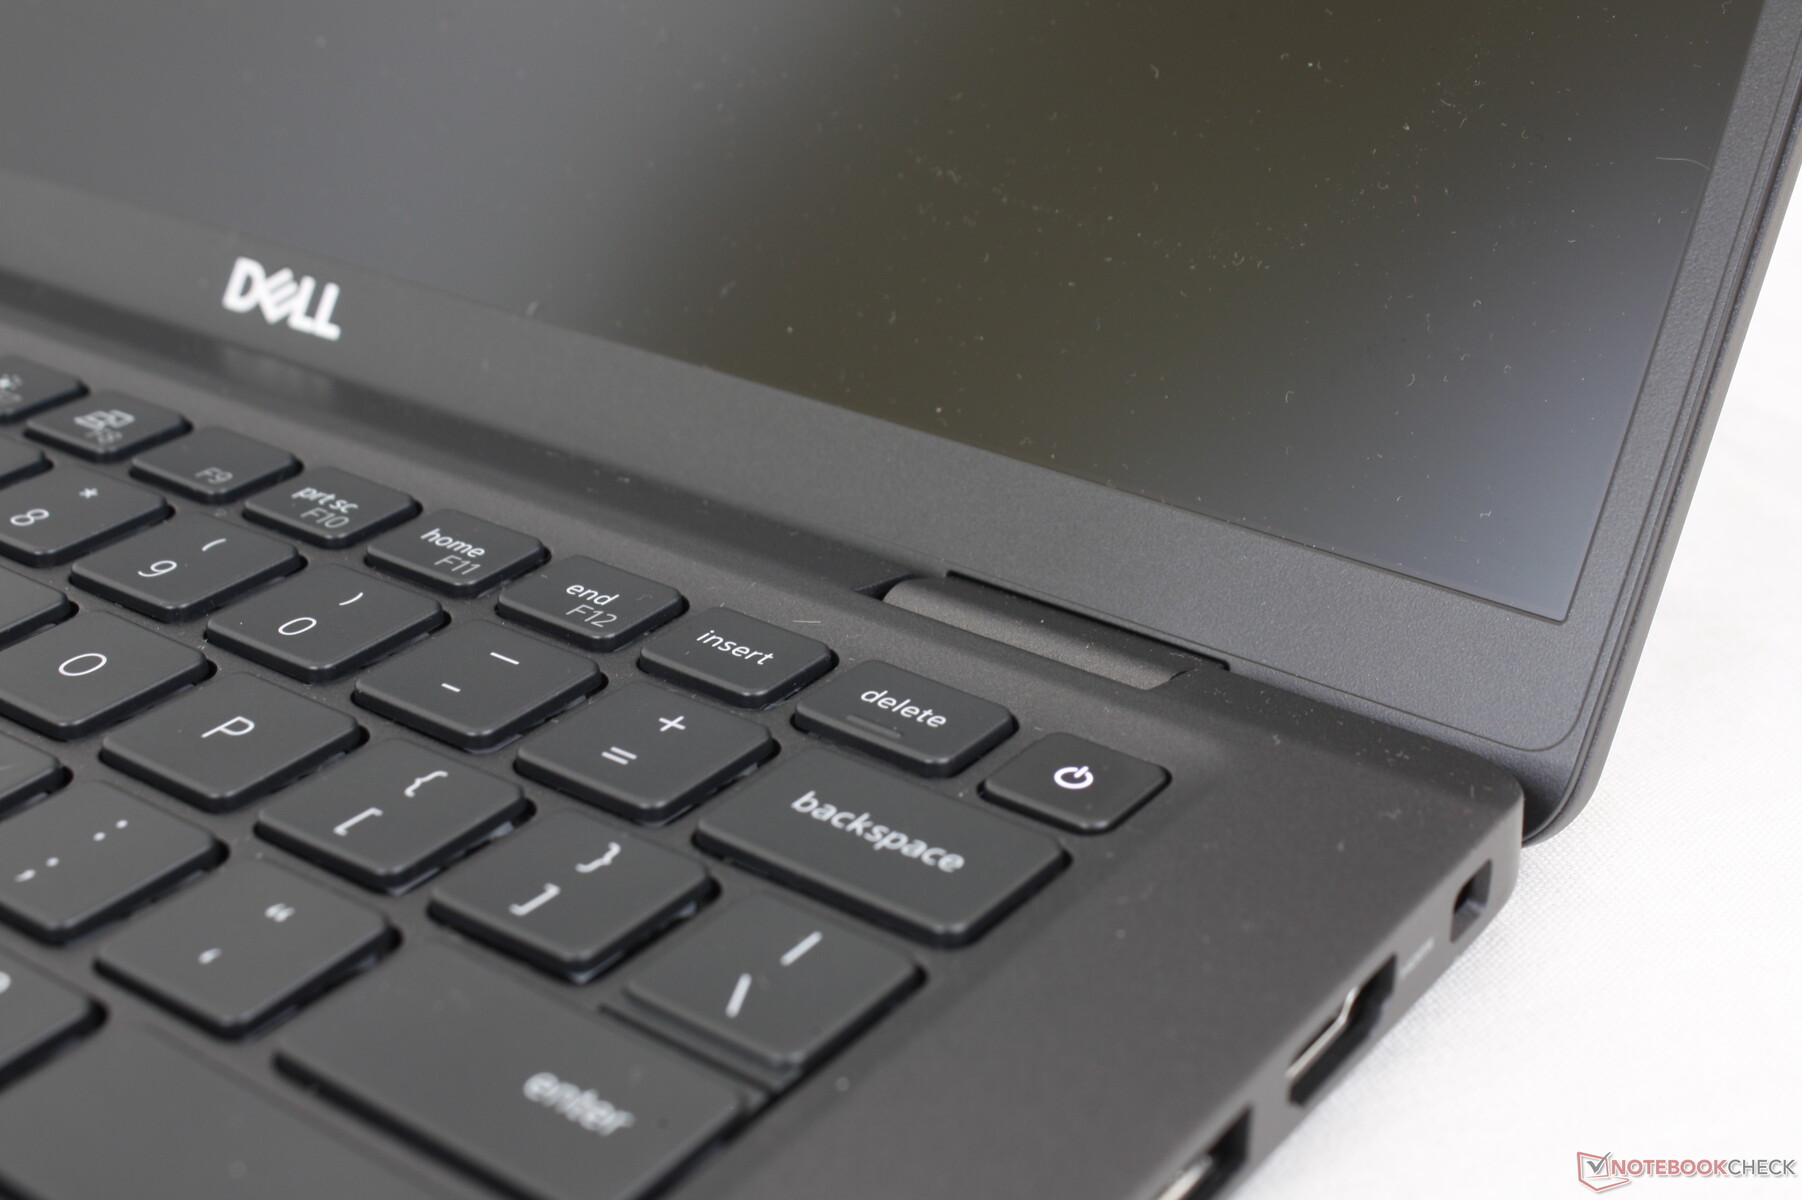
Dell n'a apporté aucune modification au clavier entre le Latitude 7310 et le Latitude 7330. En fait, la plupart des nouveaux modèles Latitude partagent le même design et la même disposition du clavier, notamment les modèles Latitude 7400 7410, 7310 et 7330. Nous trouvons que les touches plus fermes du Latitude sont plus confortables pour taper que les touches plus légères du XPS 13. Les touches du LG Gram 14 ou du HP EliteBook series ont un retour plus net ou plus précis.
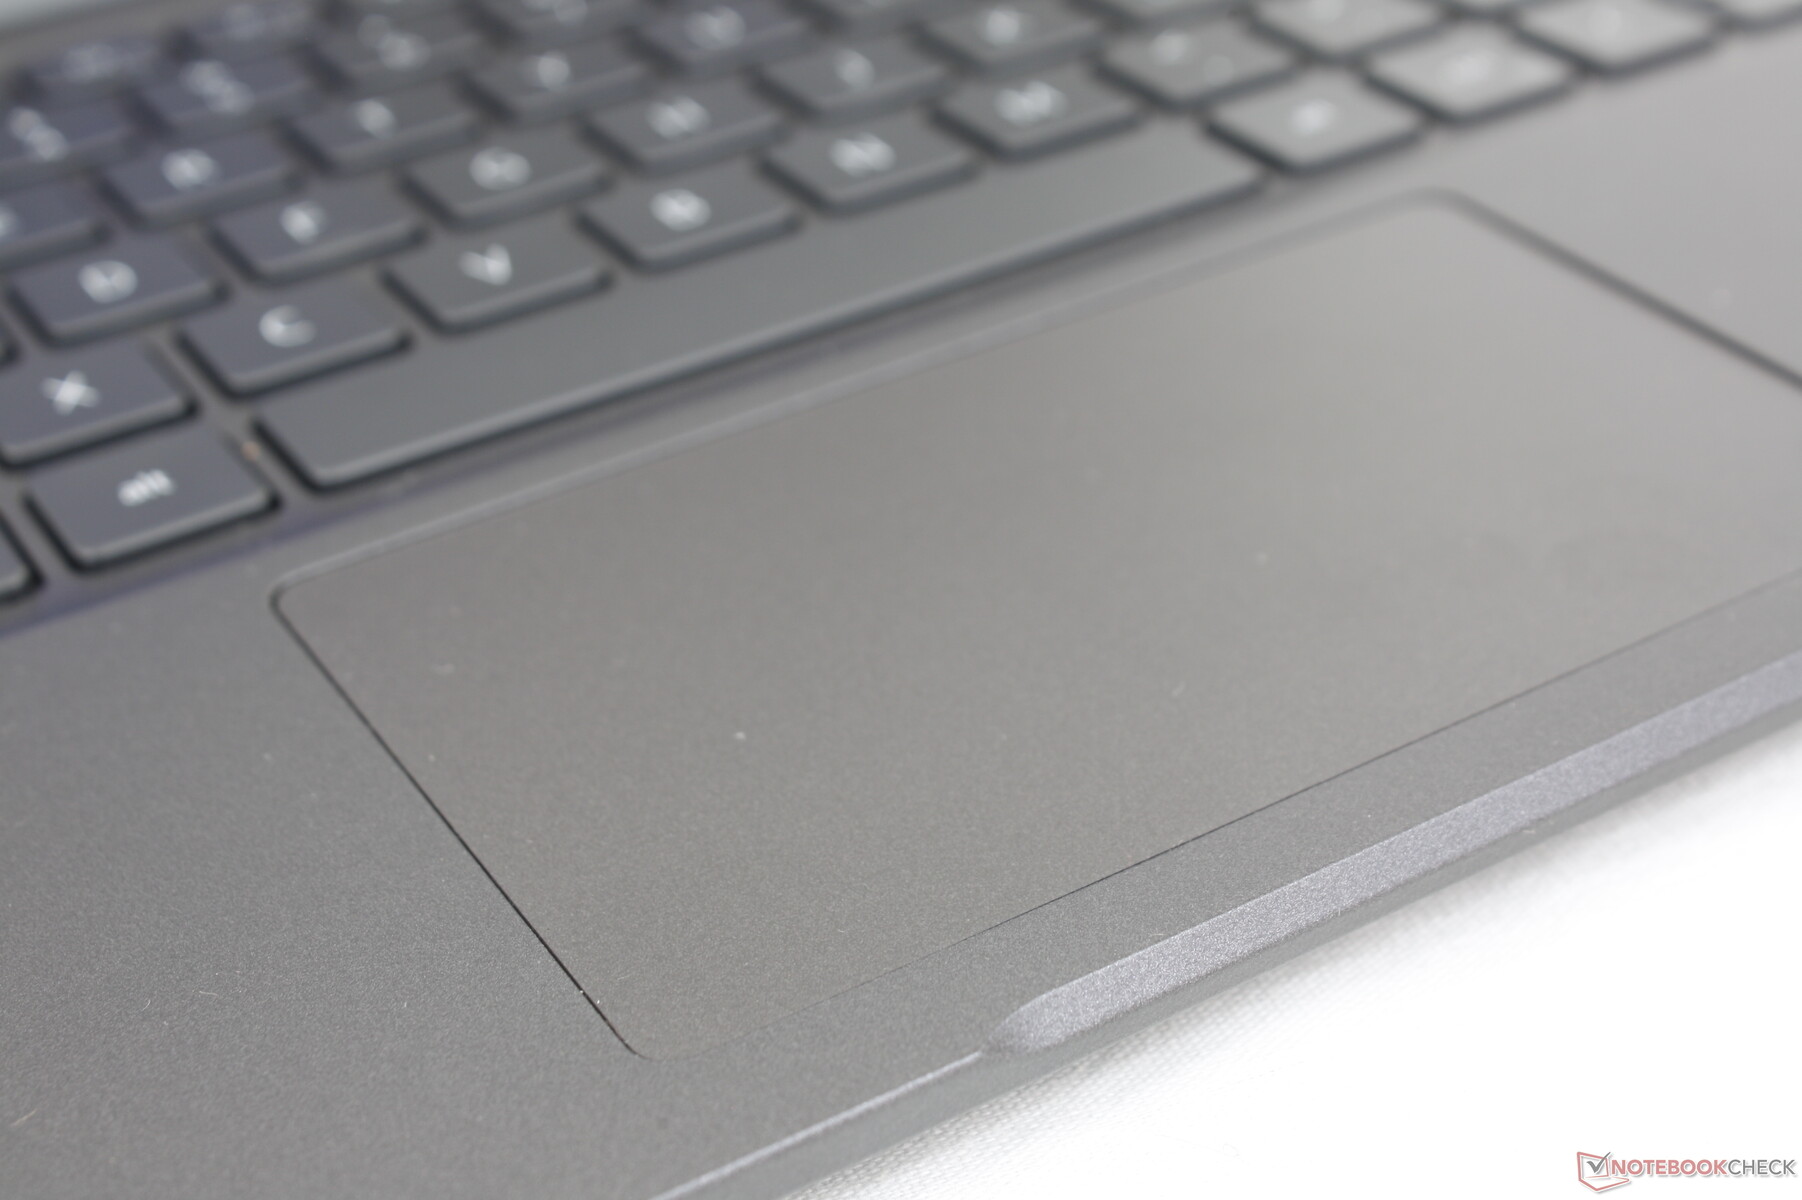
Pavé tactile
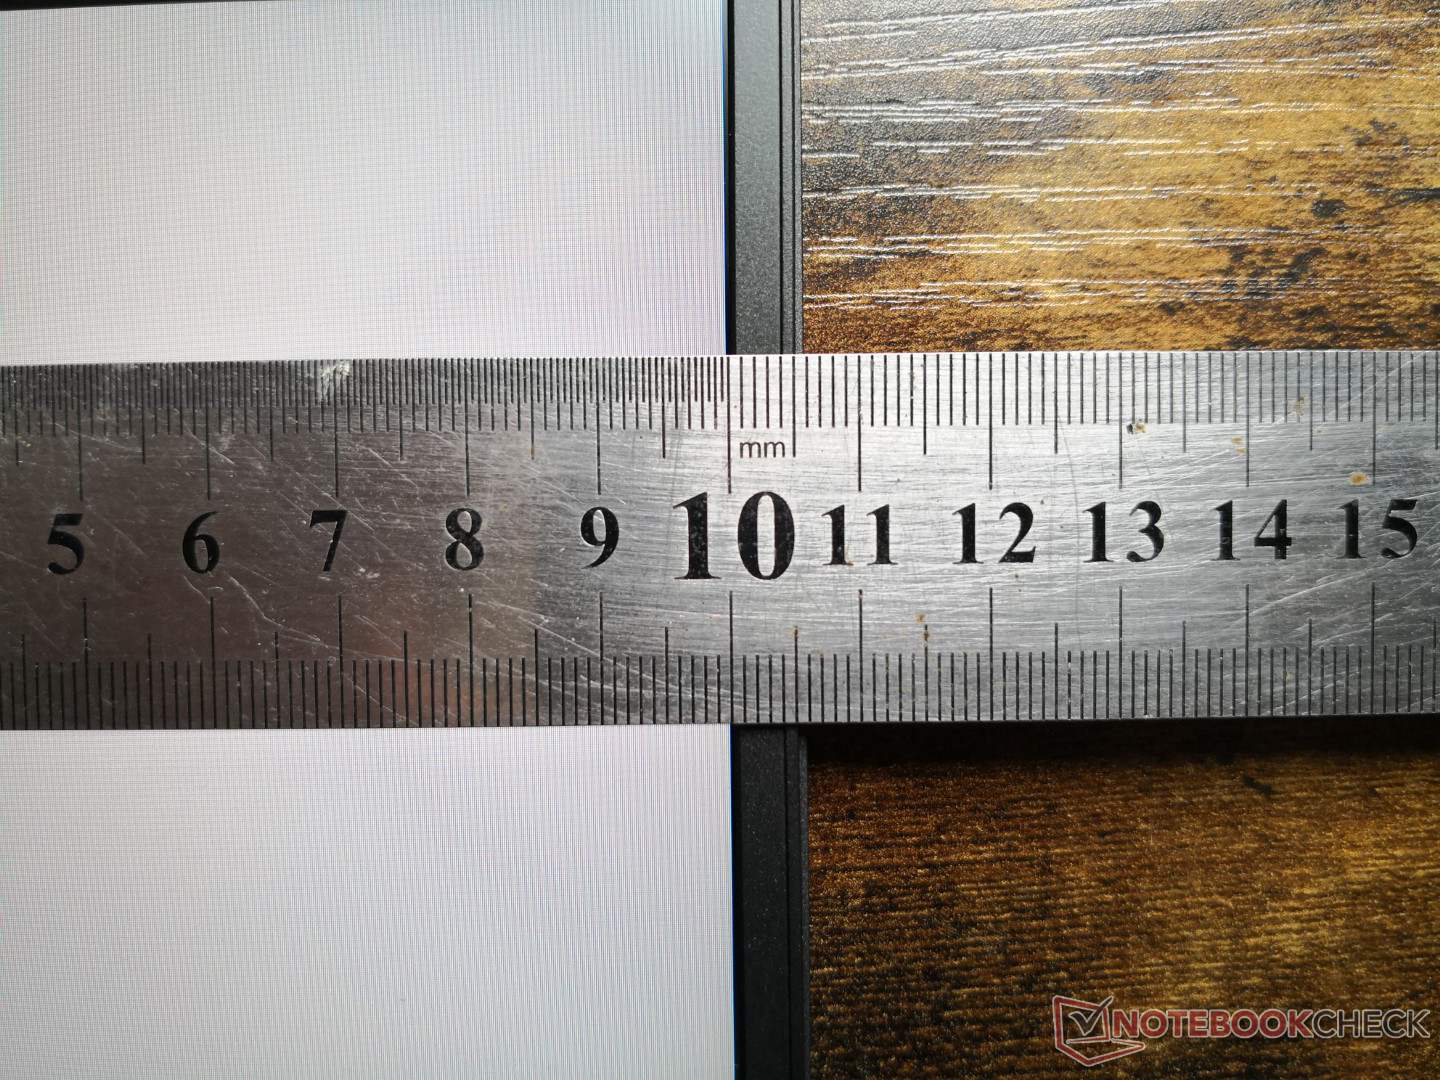
La taille du pavé tactile n'a pas changé par rapport à l'ancien Latitude 7310, soit environ 10 x 6,1 cm. Nous aurions cependant souhaité qu'il soit plus grand, car les mouvements verticaux du curseur et le défilement multi-touch peuvent être un peu étroits. Les touches de la souris intégrée sont également plus molles que nous le souhaiterions et il devient fatigant d'appuyer dessus après un court moment.

Écran - Pas d'OLED ni de taux de rafraîchissement rapide
Quatre options d'affichage sont disponibles, de la plus mauvaise à la meilleure
- Non-touch, 250-nits, ~60% sRGB
- Tactile, 300-nits, ~60% sRGB
- Non-touch, 400-nits, 100% sRGB, faible lumière bleue, faible consommation d'énergie
- Non tactile, 400-nits, 100% sRGB, faible lumière bleue, faible consommation, ultraléger
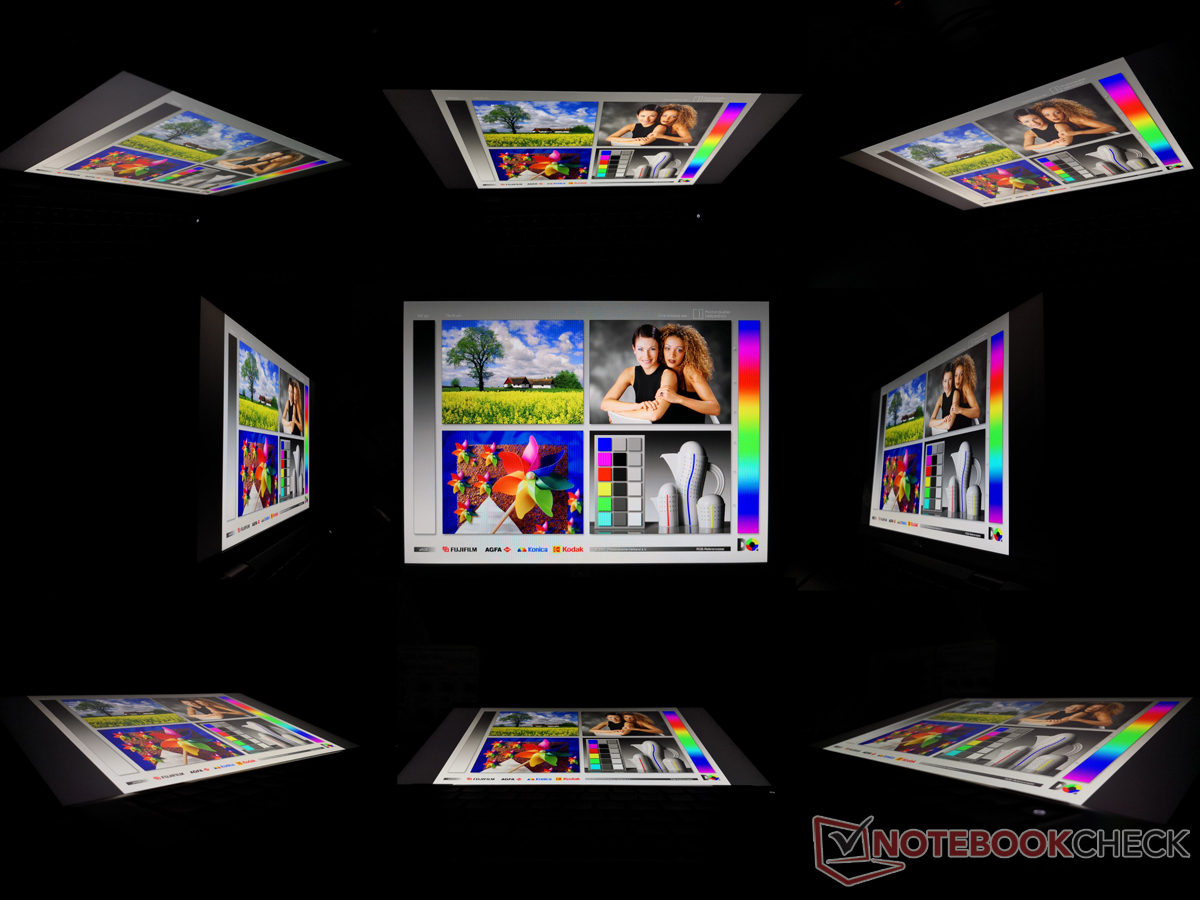
Toutes les options sont FHD, WVA/IPS, et mates uniquement, ce qui signifie qu'il n'y a pas d'alternatives 2K, 4K, OLED, ou brillantes. Nous recommandons d'éviter la première dalle en raison de son faible rétroéclairage et de sa gamme de couleurs très étroite. Notre unité de test spécifique est équipée de la quatrième option ci-dessus.
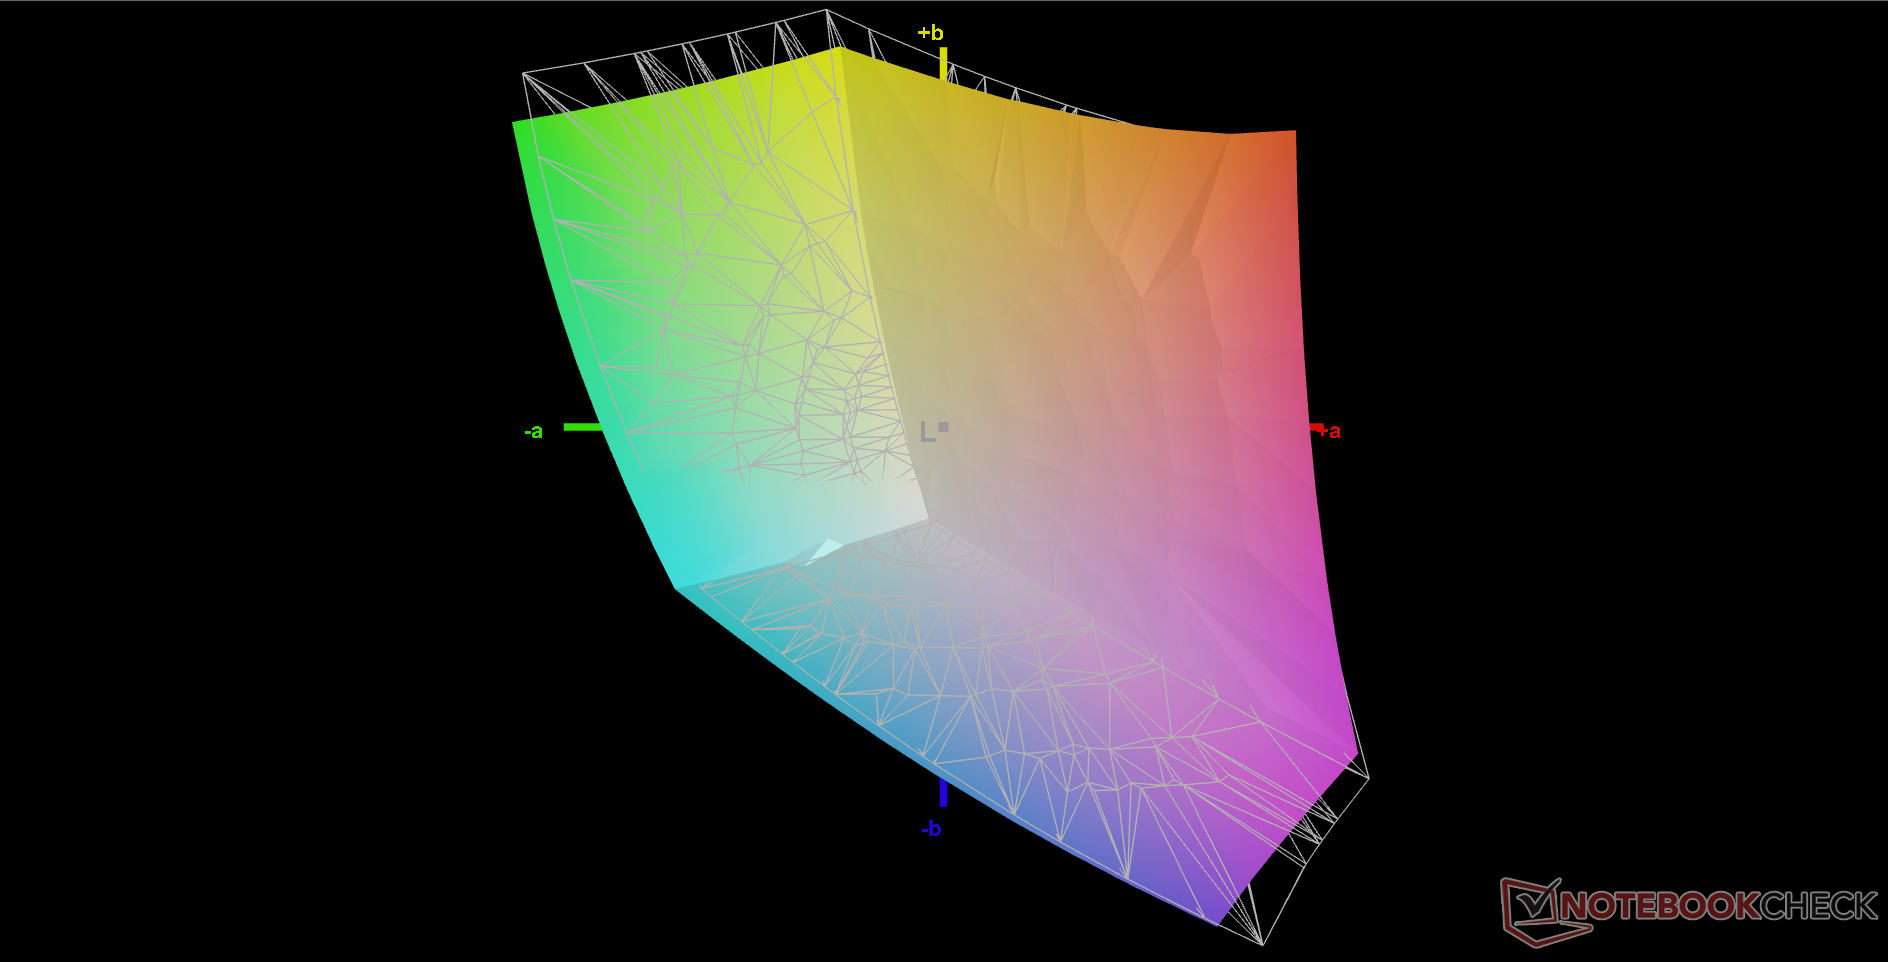
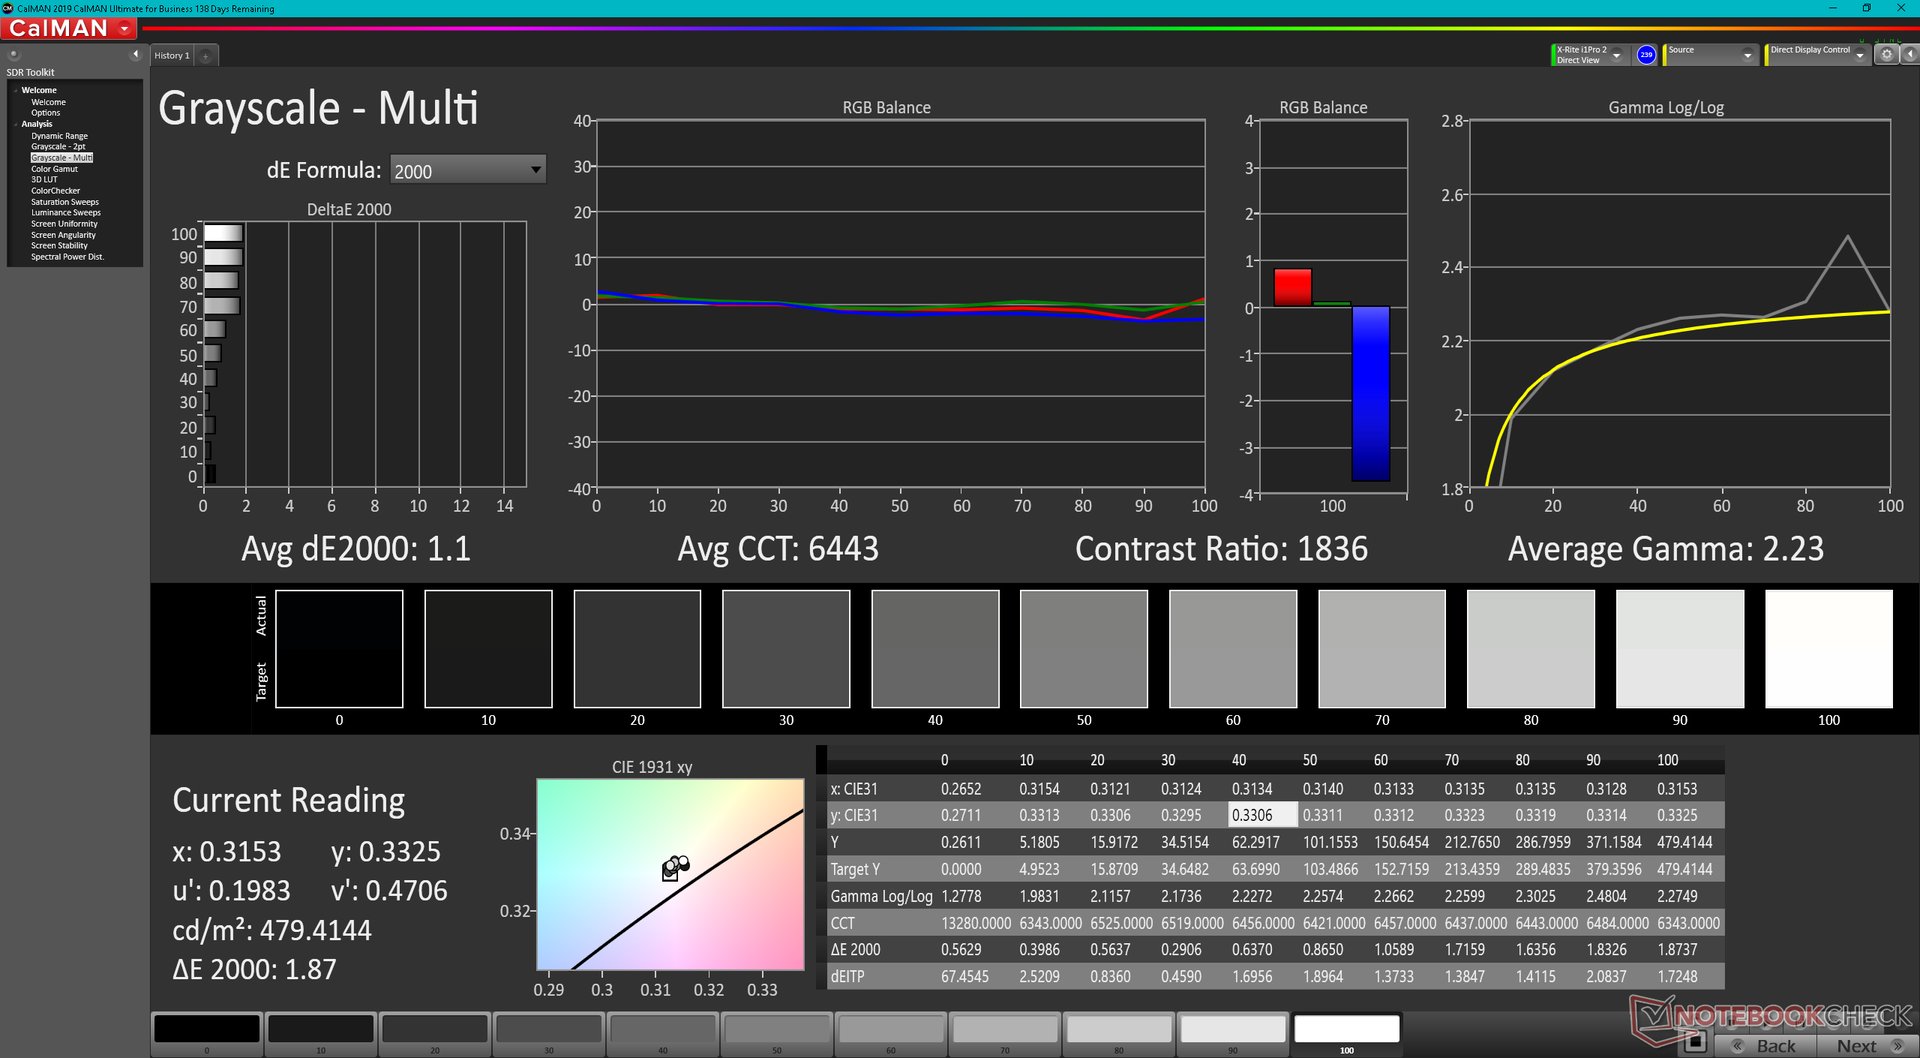
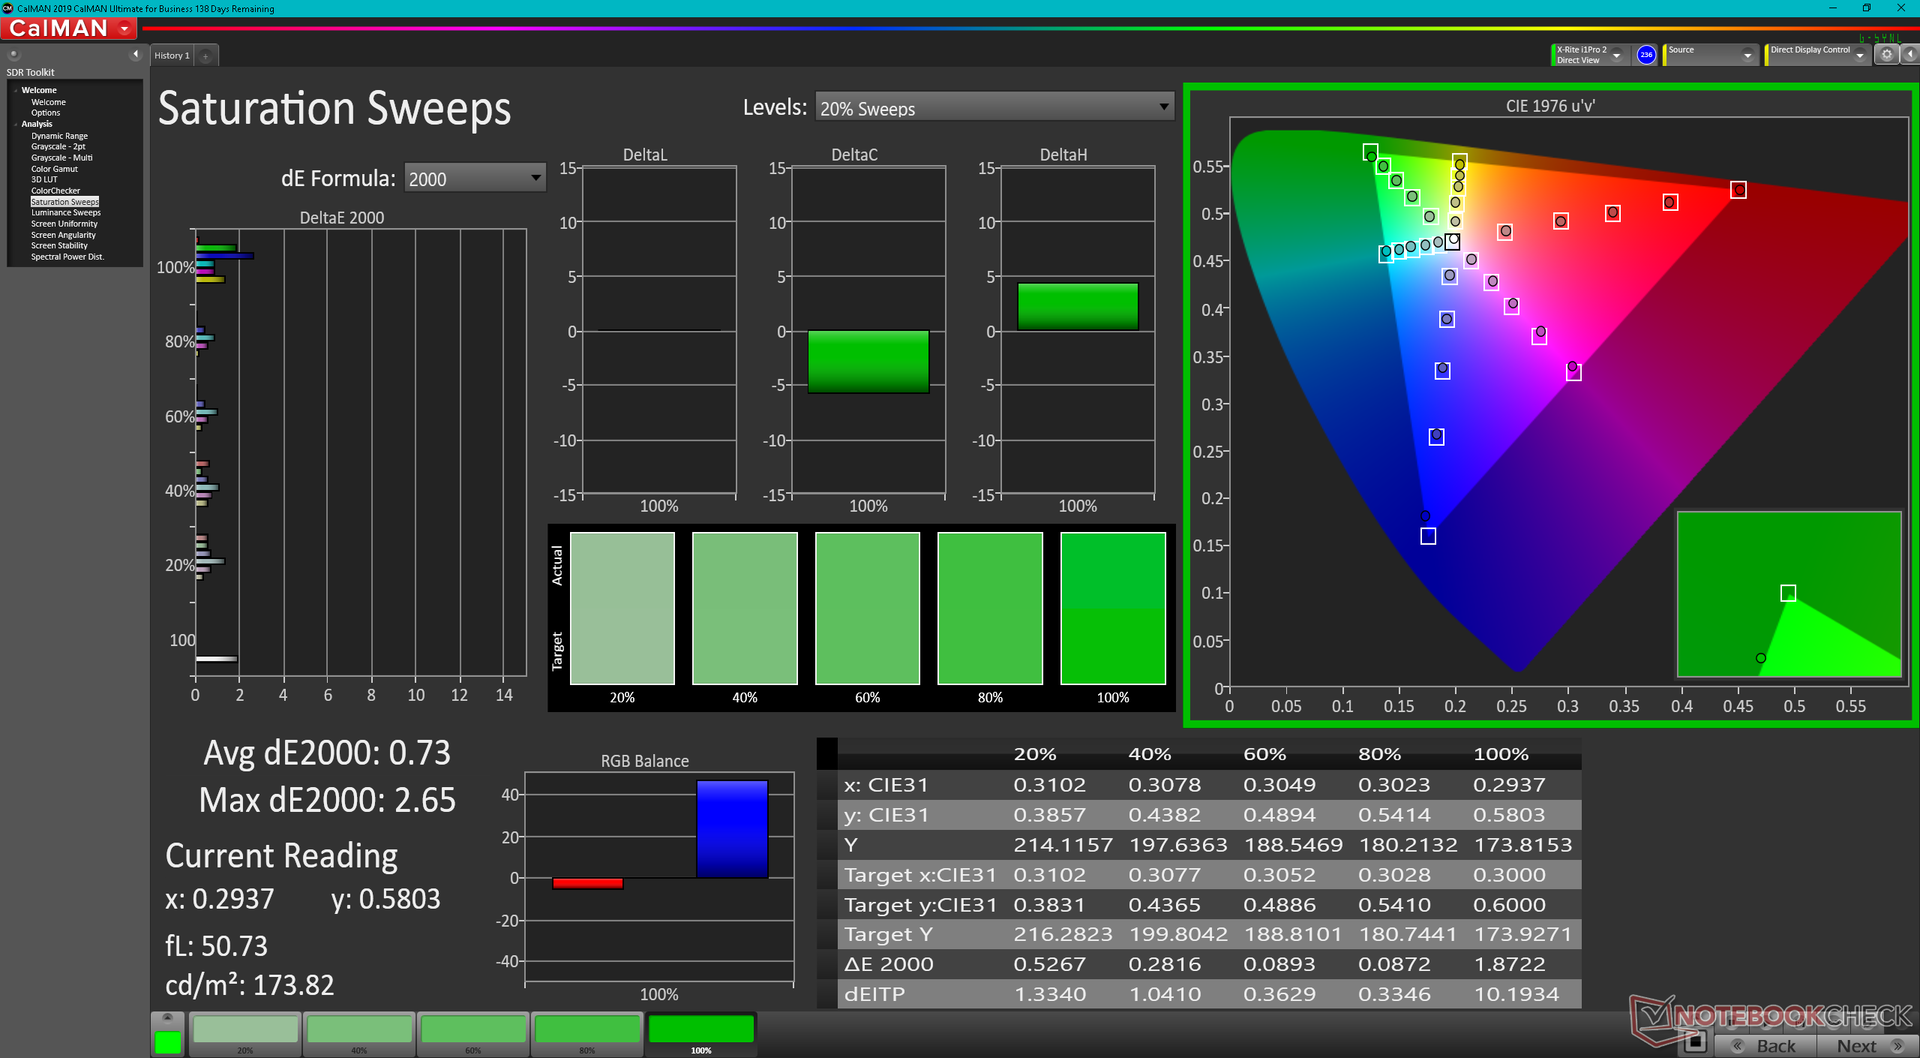
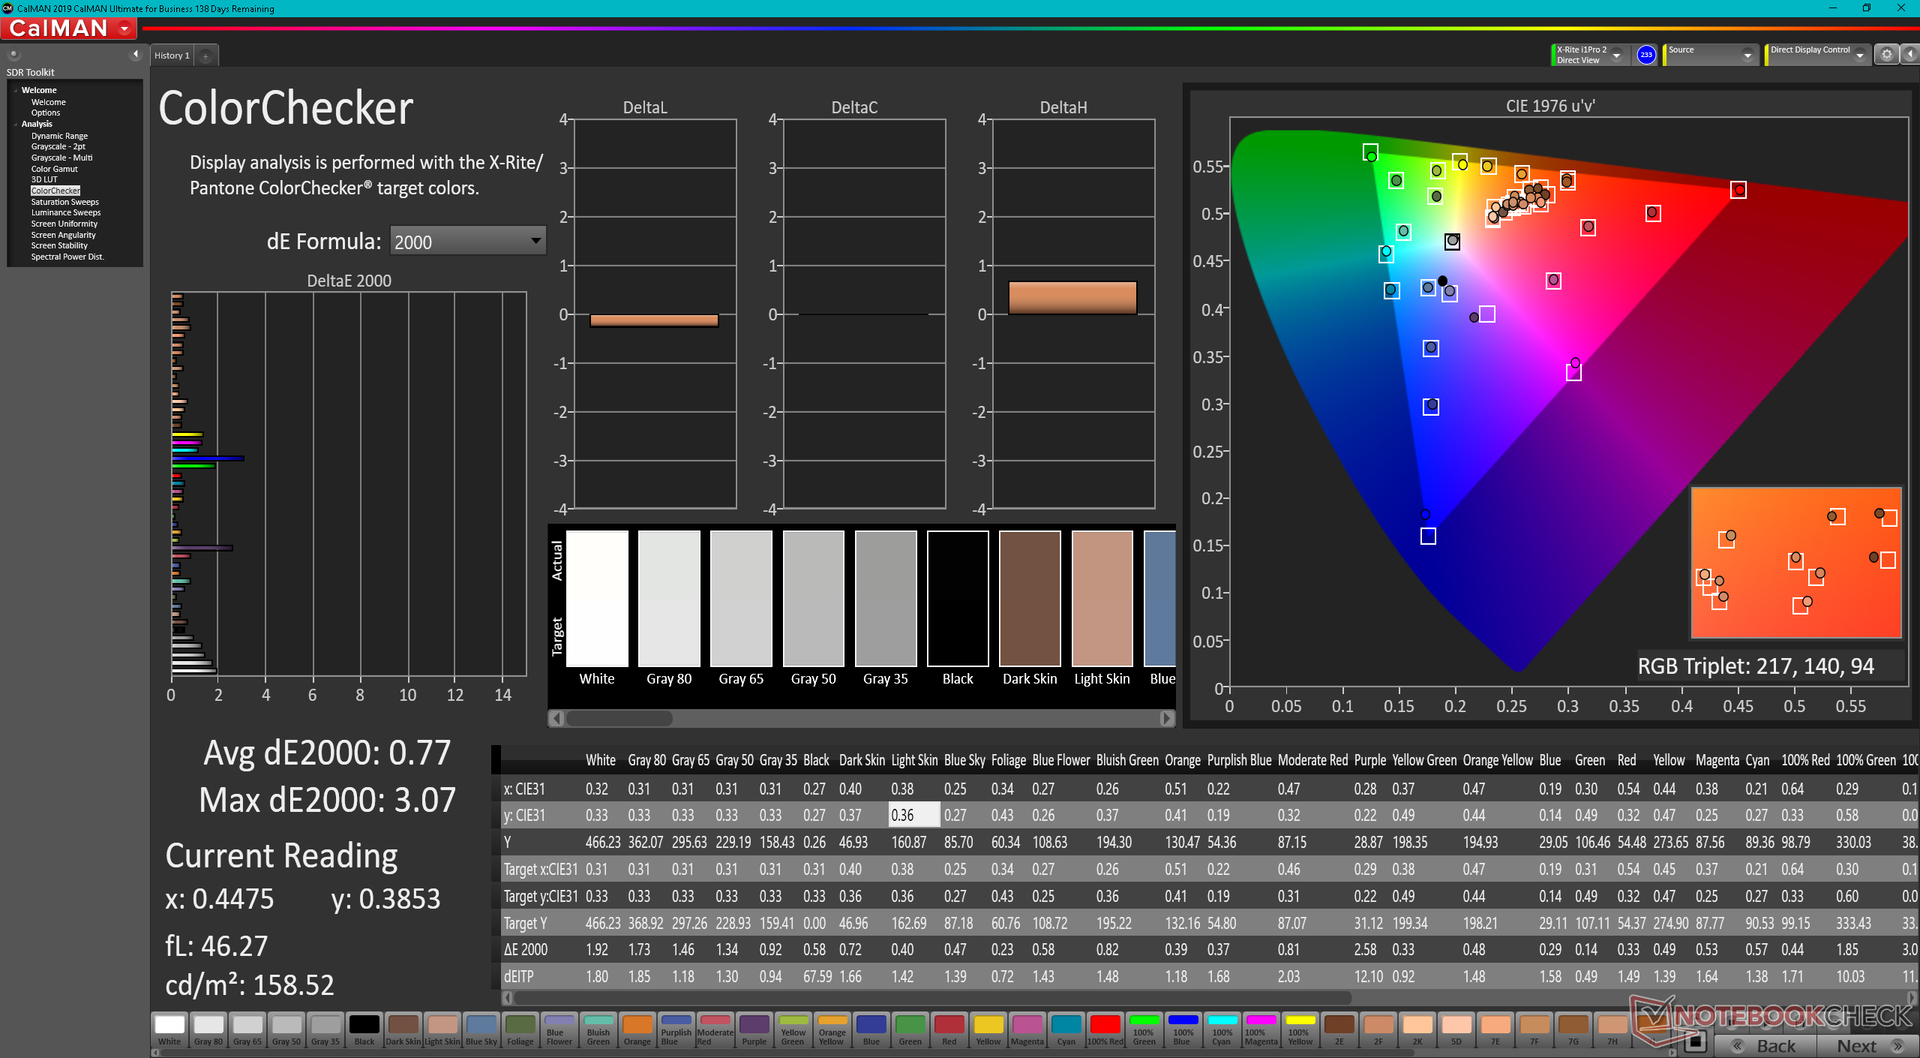
Nos mesures indépendantes montrent une couverture sRGB légèrement inférieure de 93 %, mais une luminosité maximale moyenne légèrement plus élevée de 445 nits. Il s'agit toujours d'un écran de qualité compte tenu de son taux de contraste élevé de plus de 1000:1, mais nous espérons que les futurs modèles comprendront des OLED pour des temps de réponse plus rapides en noir-blanc et en gris-gris ou au moins des panneaux à taux de rafraîchissement plus élevé pour une interface utilisateur plus fluide.
| |||||||||||||||||||||||||
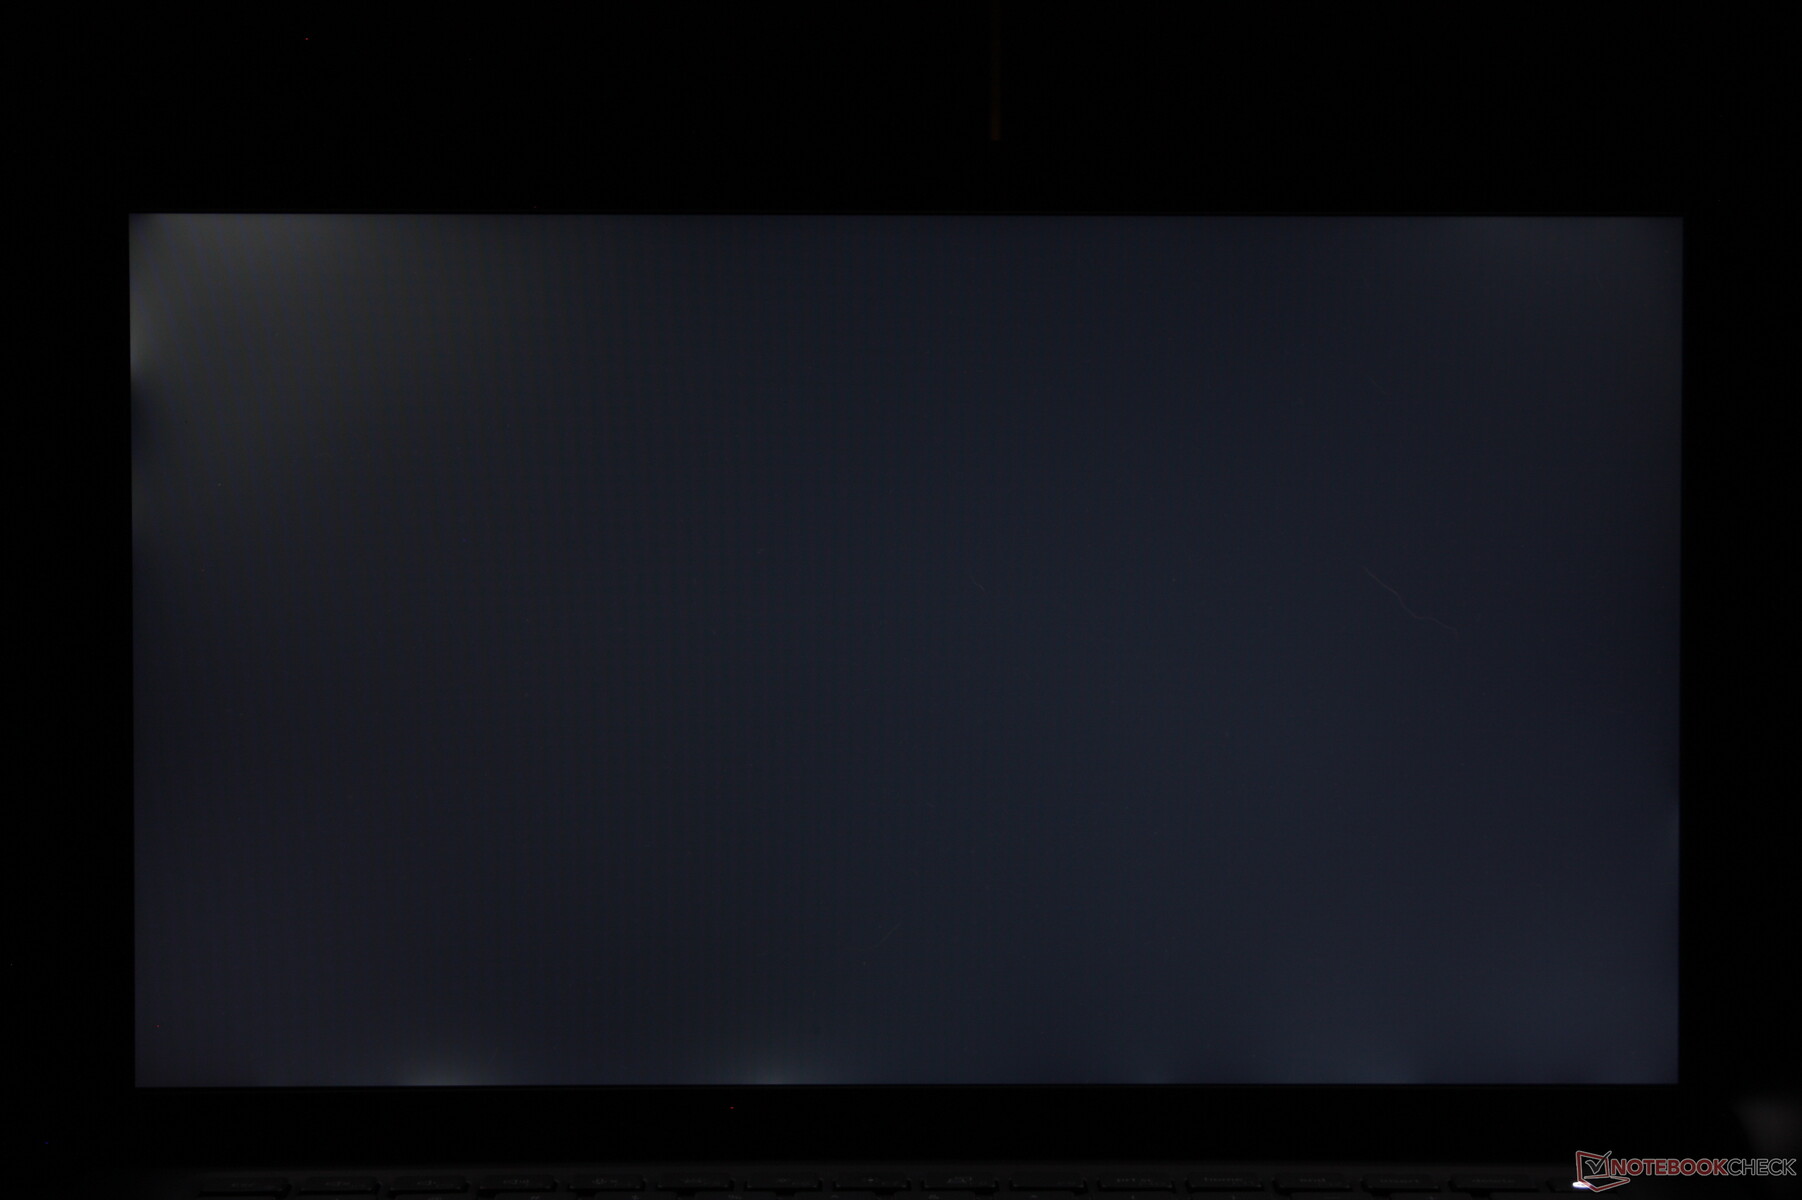
Homogénéité de la luminosité: 89 %
Valeur mesurée au centre, sur batterie: 460.1 cd/m²
Contraste: 1484:1 (Valeurs des noirs: 0.31 cd/m²)
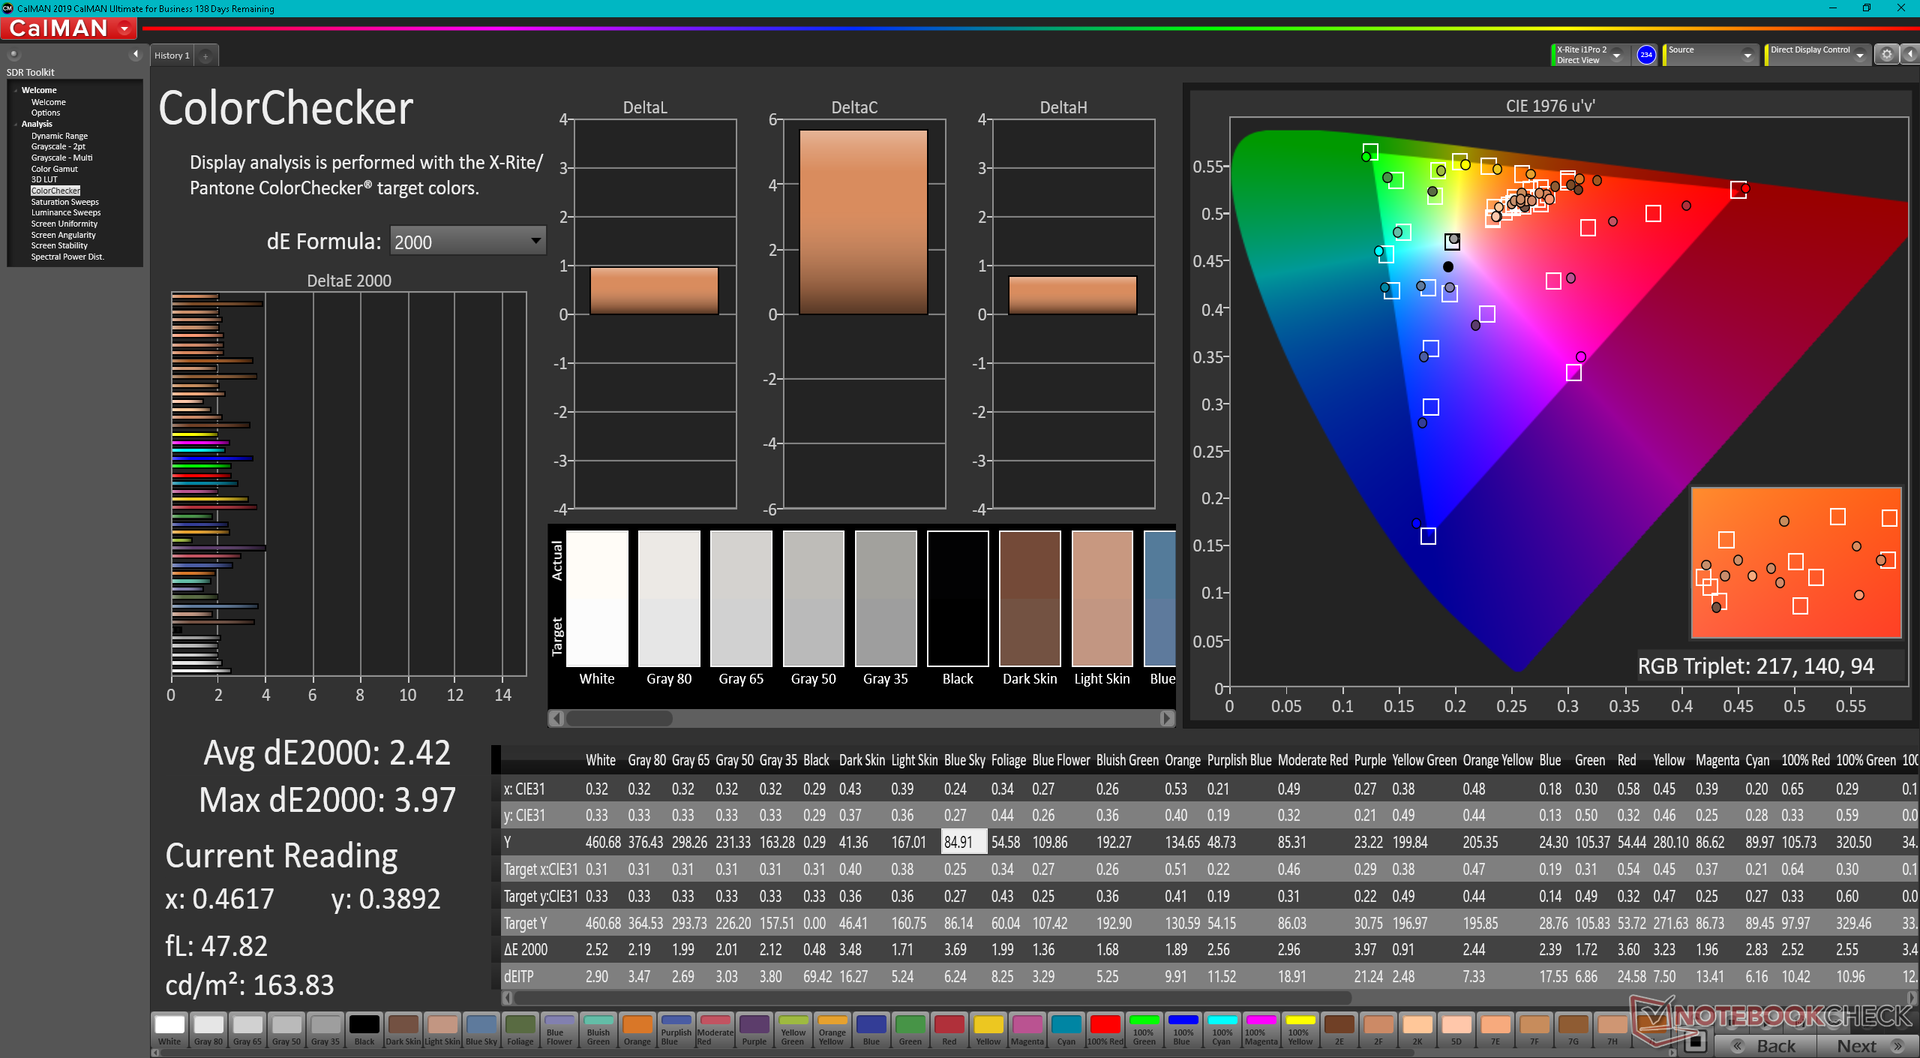
ΔE ColorChecker Calman: 2.42 | ∀{0.5-29.43 Ø4.74}
calibrated: 0.77
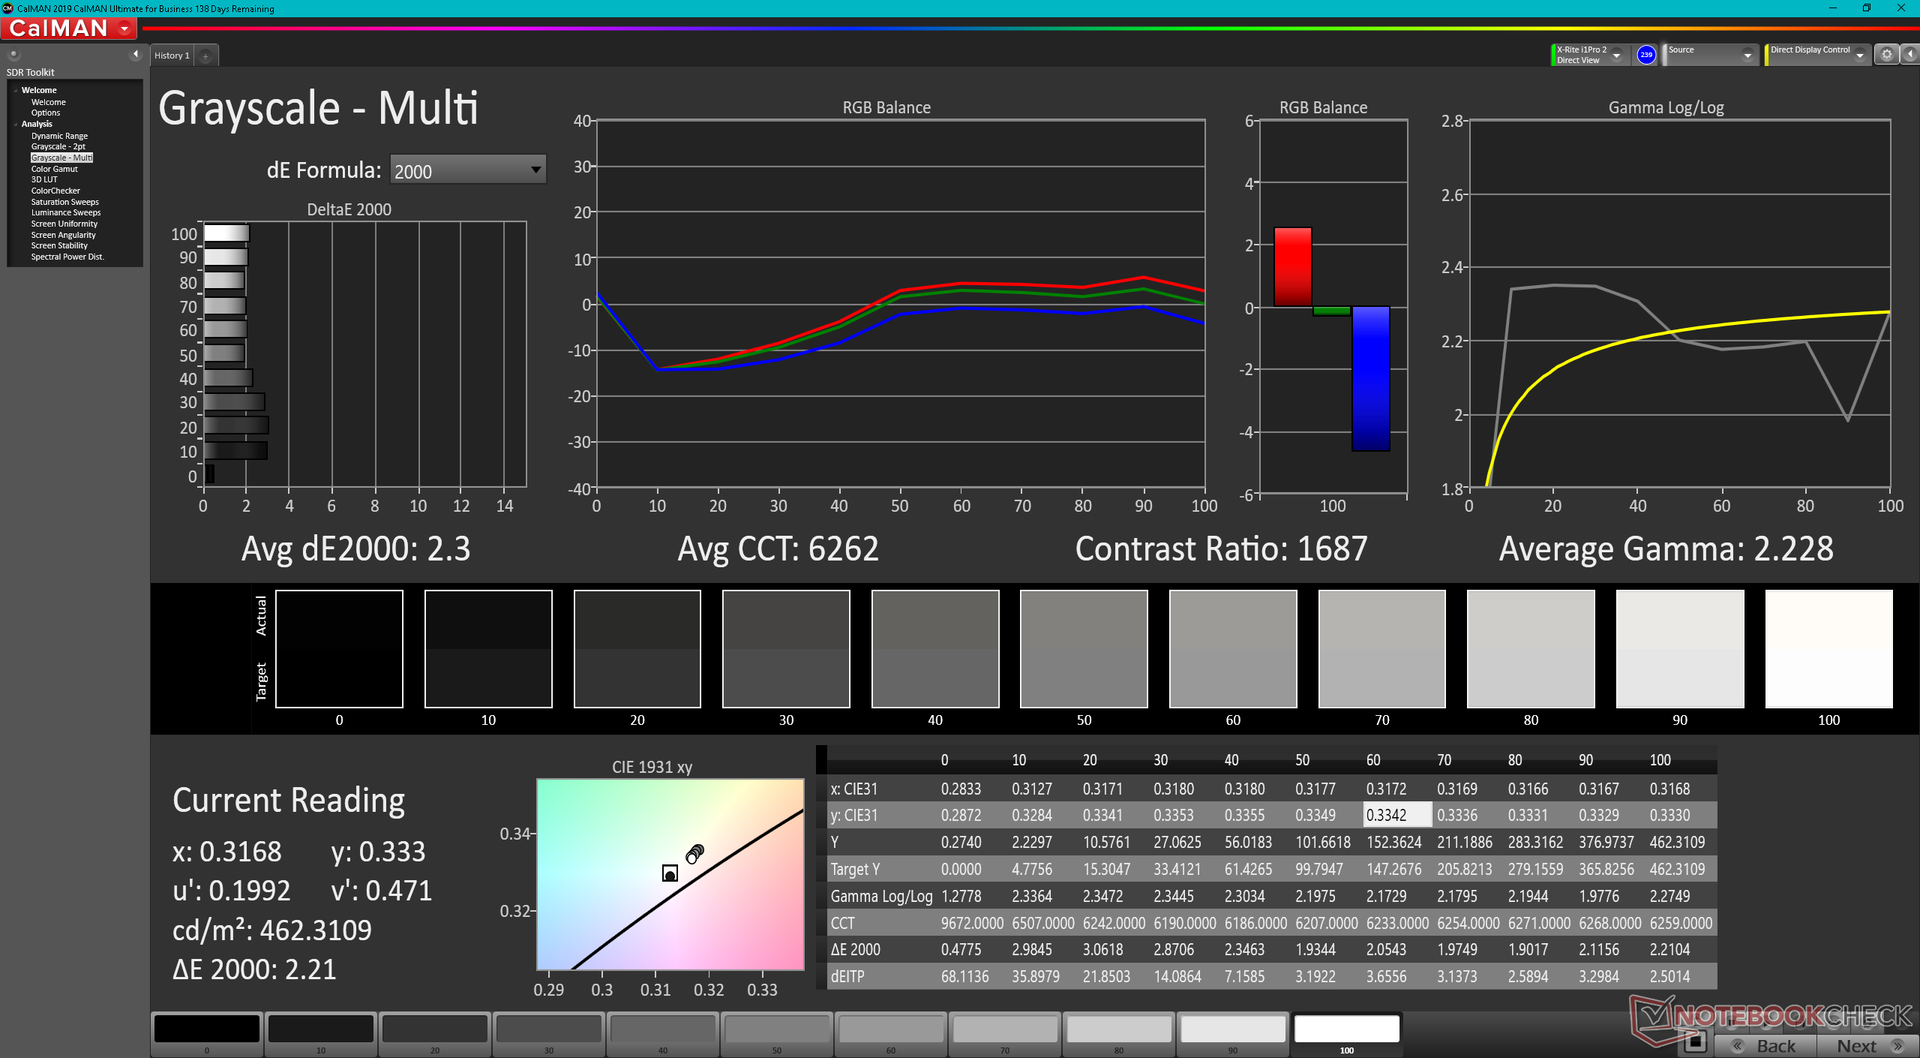
ΔE Greyscale Calman: 2.3 | ∀{0.09-98 Ø4.99}
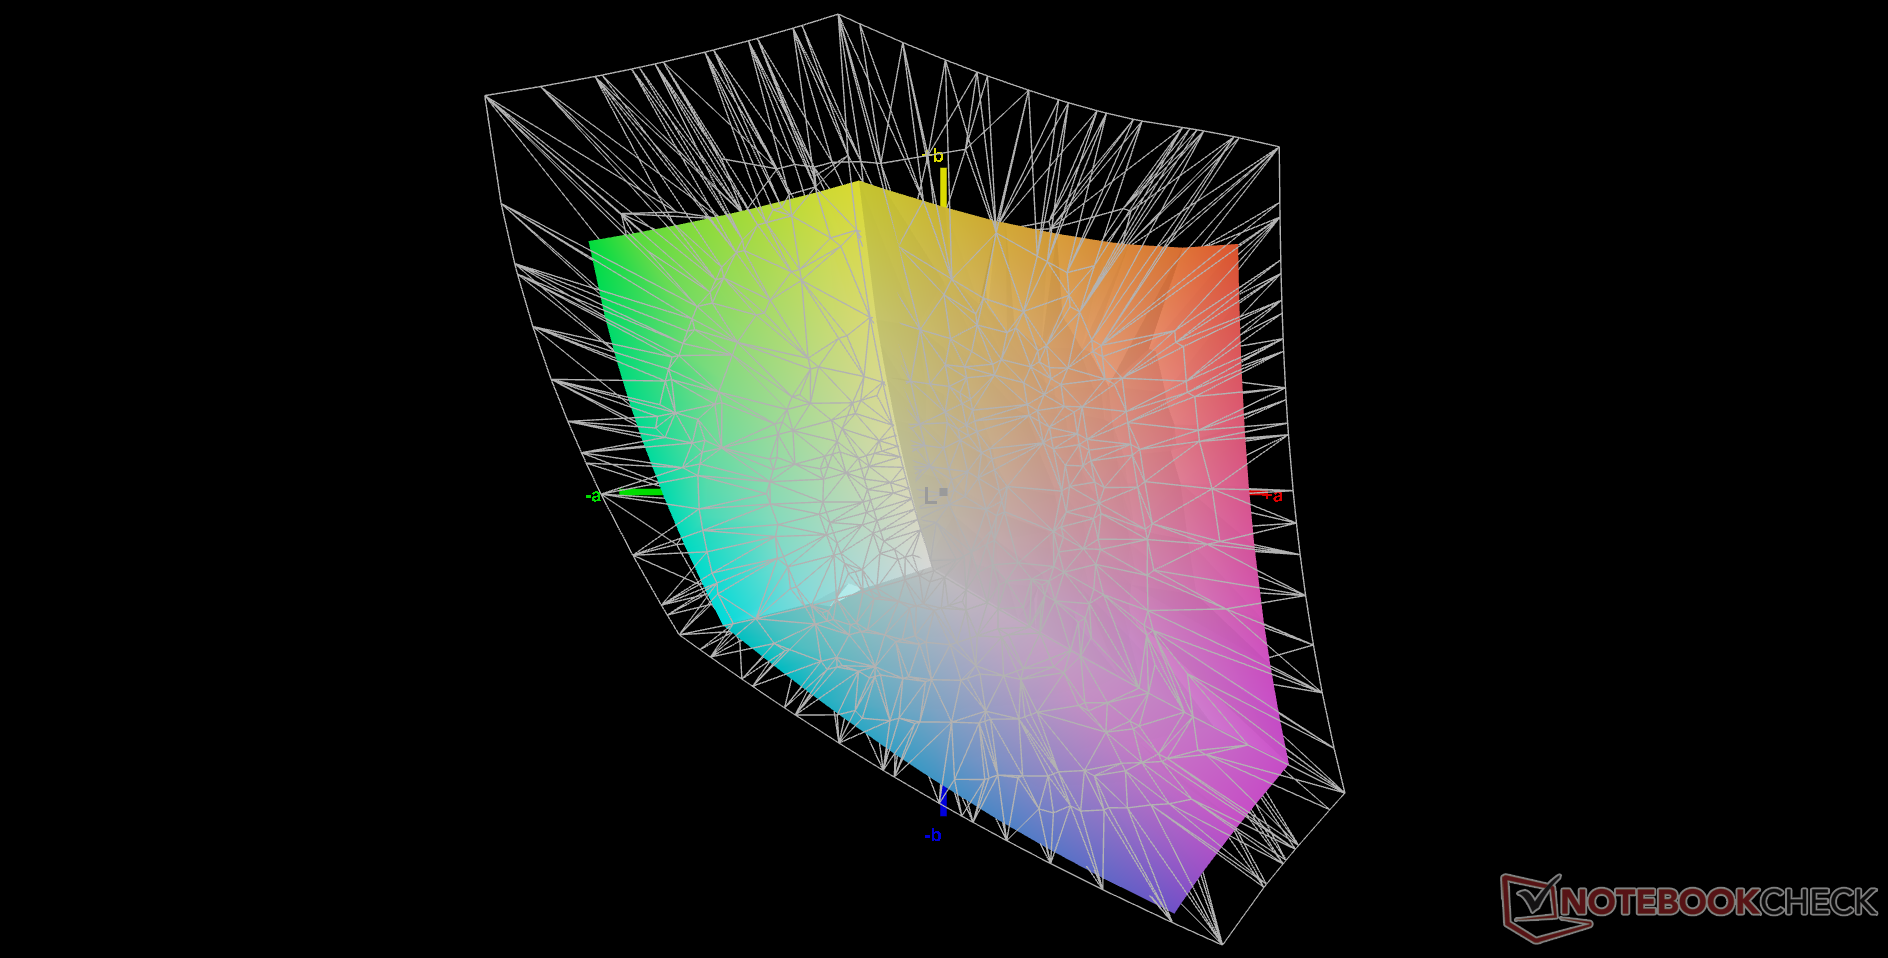
68.2% AdobeRGB 1998 (Argyll 3D)
93.5% sRGB (Argyll 3D)
66.1% Display P3 (Argyll 3D)
Gamma: 2.23
CCT: 6262 K
| Dell Latitude 13 7330 LG Philips 133WF9, IPS, 1920x1080, 13.3" | Lenovo ThinkPad X13 Yoga 20SX0004GE N133HCG-GR3, IPS, 1920x1080, 13.3" | Framework Laptop 13.5 12th Gen Intel BOE CQ NE135FBM-N41, IPS, 2256x1504, 13.5" | Razer Book 13 FHD Sharp LQ134N1JW48, IPS, 1920x1200, 13.4" | Dell Latitude 7310 AU Optronics B133HAN, IPS, 1920x1080, 13.3" | Microsoft Surface Laptop 4 13 i7 LQ135P1JX51, IPS, 2256x1504, 13.5" | |
|---|---|---|---|---|---|---|
| Display | 3% | 5% | 6% | 7% | 0% | |
| Display P3 Coverage (%) | 66.1 | 67.2 2% | 69.9 6% | 70.1 6% | 71.8 9% | 64.7 -2% |
| sRGB Coverage (%) | 93.5 | 98.1 5% | 99.4 6% | 99.3 6% | 99.3 6% | 97.2 4% |
| AdobeRGB 1998 Coverage (%) | 68.2 | 69 1% | 71.1 4% | 71.6 5% | 72.4 6% | 66.9 -2% |
| Response Times | -6% | 18% | -24% | 10% | -32% | |
| Response Time Grey 50% / Grey 80% * (ms) | 48.4 ? | 56 ? -16% | 34.7 ? 28% | 56.8 ? -17% | 40.8 ? 16% | 62.8 ? -30% |
| Response Time Black / White * (ms) | 29.6 ? | 28 ? 5% | 27.5 ? 7% | 38.8 ? -31% | 28.8 ? 3% | 39.8 ? -34% |
| PWM Frequency (Hz) | 2475 ? | 21930 ? | ||||
| Screen | 2% | -25% | -9% | -9% | -11% | |
| Brightness middle (cd/m²) | 460.1 | 401 -13% | 449.6 -2% | 545.3 19% | 332.7 -28% | 413 -10% |
| Brightness (cd/m²) | 445 | 383 -14% | 431 -3% | 507 14% | 329 -26% | 400 -10% |
| Brightness Distribution (%) | 89 | 91 2% | 90 1% | 88 -1% | 89 0% | 94 6% |
| Black Level * (cd/m²) | 0.31 | 0.16 48% | 0.31 -0% | 0.31 -0% | 0.25 19% | 0.29 6% |
| Contrast (:1) | 1484 | 2506 69% | 1450 -2% | 1759 19% | 1331 -10% | 1424 -4% |
| Colorchecker dE 2000 * | 2.42 | 2.6 -7% | 2.76 -14% | 1.39 43% | 2.15 11% | 2.8 -16% |
| Colorchecker dE 2000 max. * | 3.97 | 4.2 -6% | 7.96 -101% | 2.61 34% | 3.89 2% | 7.2 -81% |
| Colorchecker dE 2000 calibrated * | 0.77 | 0.9 -17% | 0.58 25% | 2.72 -253% | 1.09 -42% | 0.8 -4% |
| Greyscale dE 2000 * | 2.3 | 3.3 -43% | 5.2 -126% | 1.3 43% | 2.5 -9% | 1.9 17% |
| Gamma | 2.23 99% | 2.01 109% | 2.23 99% | 2.2 100% | 2.3 96% | 2.12 104% |
| CCT | 6262 104% | 6076 107% | 6475 100% | 6476 100% | 6347 102% | 6510 100% |
| Color Space (Percent of AdobeRGB 1998) (%) | 62.7 | 65.9 | 64.1 | 61.6 | ||
| Color Space (Percent of sRGB) (%) | 98.1 | 99.6 | 99.4 | 97.2 | ||
| Moyenne finale (programmes/paramètres) | -0% /
1% | -1% /
-12% | -9% /
-8% | 3% /
-3% | -14% /
-11% |
* ... Moindre est la valeur, meilleures sont les performances
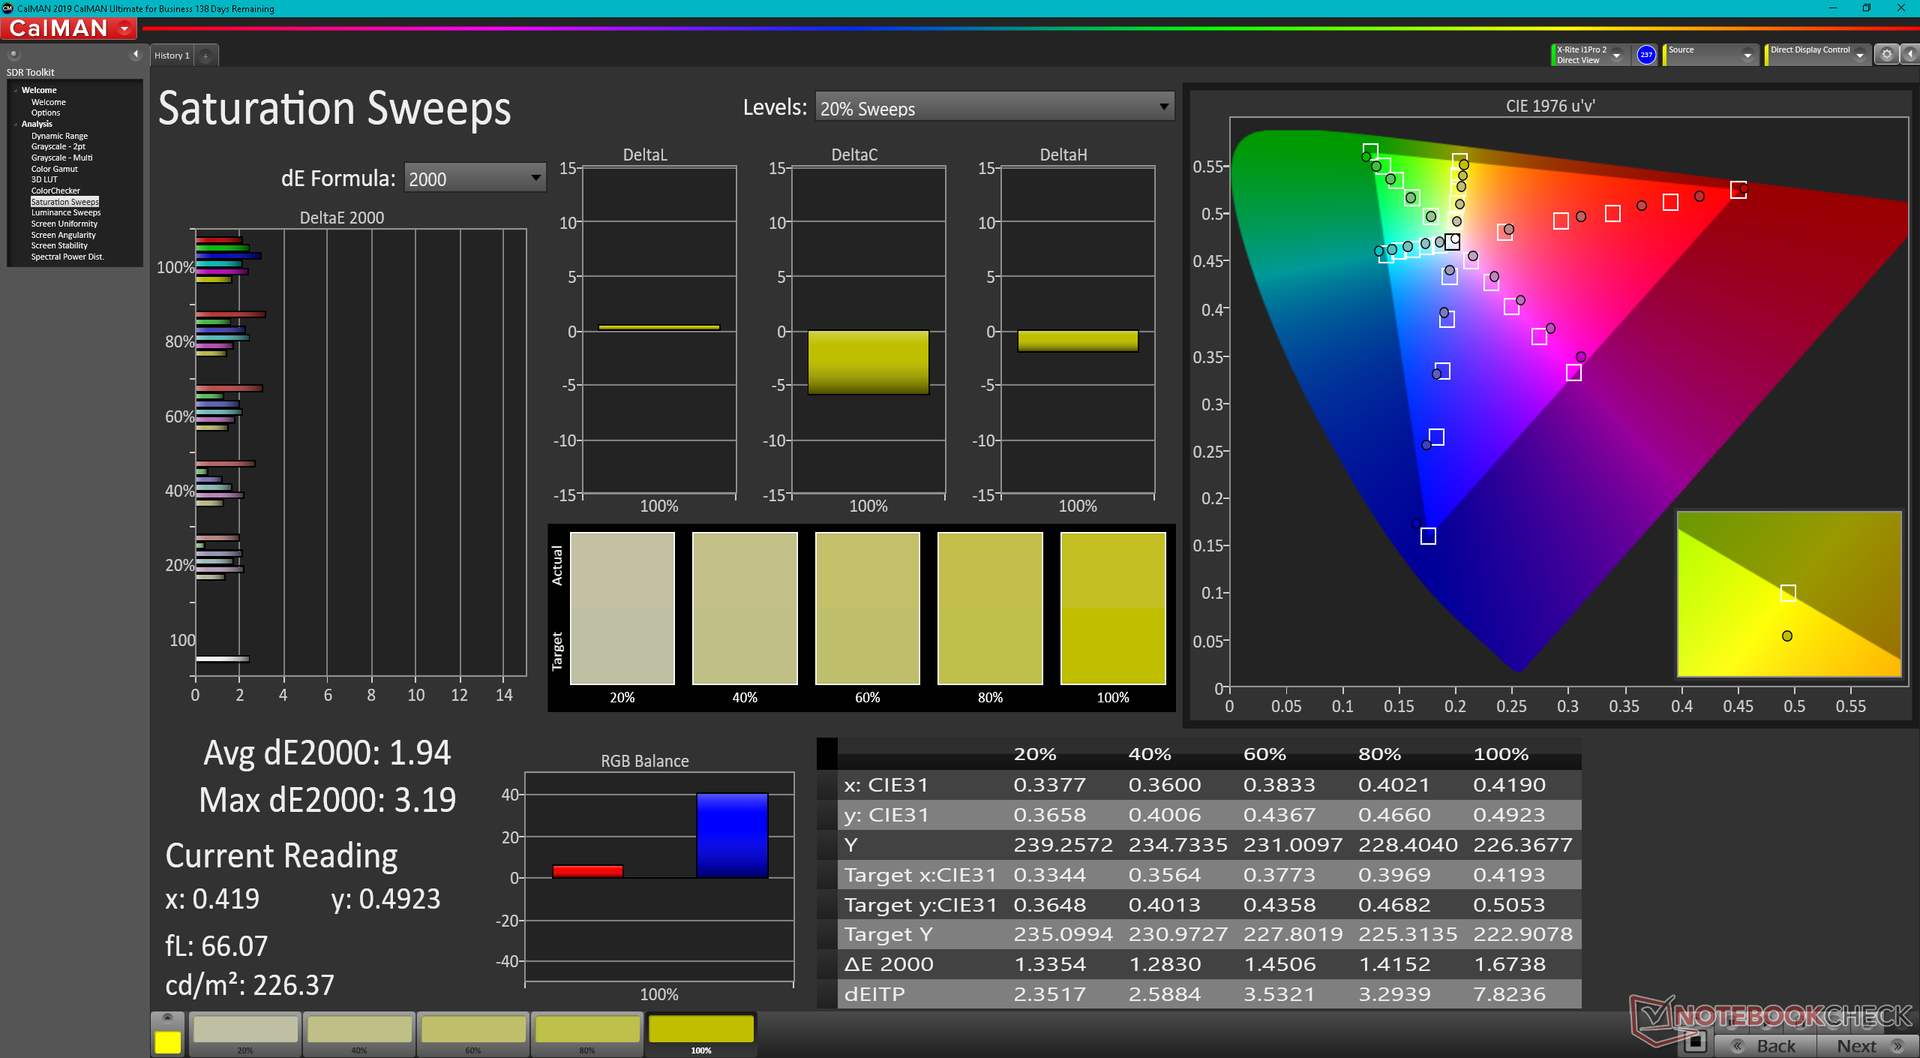
L'écran est bien calibré dès sa sortie de l'emballage avec des valeurs moyennes de niveaux de gris et de deltaE de seulement 2,3 et 2,42, respectivement, comme le montrent nos résultats CalMAN ci-dessous. En le calibrant encore plus avec un colorimètre X-Rite, les valeurs DeltaE moyennes seraient inférieures à 1.
Temps de réponse de l'écran
| ↔ Temps de réponse noir à blanc | ||
|---|---|---|
| 29.6 ms ... hausse ↗ et chute ↘ combinées | ↗ 14.8 ms hausse | 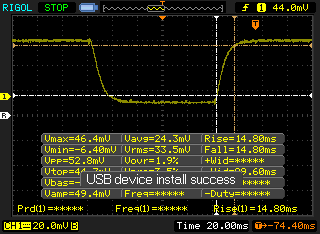 |
| ↘ 14.8 ms chute | ||
| L'écran souffre de latences relativement élevées, insuffisant pour le jeu. En comparaison, tous les appareils testés affichent entre 0.1 (minimum) et 240 (maximum) ms. » 79 % des appareils testés affichent de meilleures performances. Cela signifie que les latences relevées sont moins bonnes que la moyenne (20 ms) de tous les appareils testés. | ||
| ↔ Temps de réponse gris 50% à gris 80% | ||
| 48.4 ms ... hausse ↗ et chute ↘ combinées | ↗ 23.6 ms hausse | 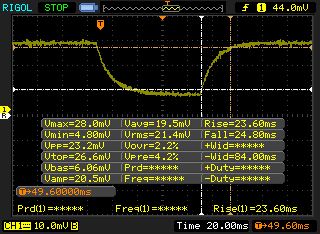 |
| ↘ 24.8 ms chute | ||
| L'écran souffre de latences très élevées, à éviter pour le jeu. En comparaison, tous les appareils testés affichent entre 0.165 (minimum) et 636 (maximum) ms. » 84 % des appareils testés affichent de meilleures performances. Cela signifie que les latences relevées sont moins bonnes que la moyenne (31.2 ms) de tous les appareils testés. | ||
Scintillement / MLI (Modulation de largeur d'impulsion)
| Scintillement / MLI (Modulation de largeur d'impulsion) non décelé | 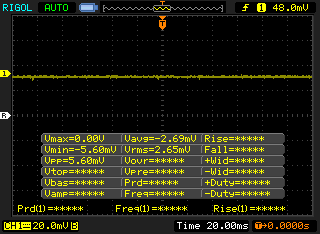 | ||
En comparaison, 52 % des appareils testés n'emploient pas MDI pour assombrir leur écran. Nous avons relevé une moyenne à 7904 (minimum : 5 - maximum : 343500) Hz dans le cas où une MDI était active. | |||
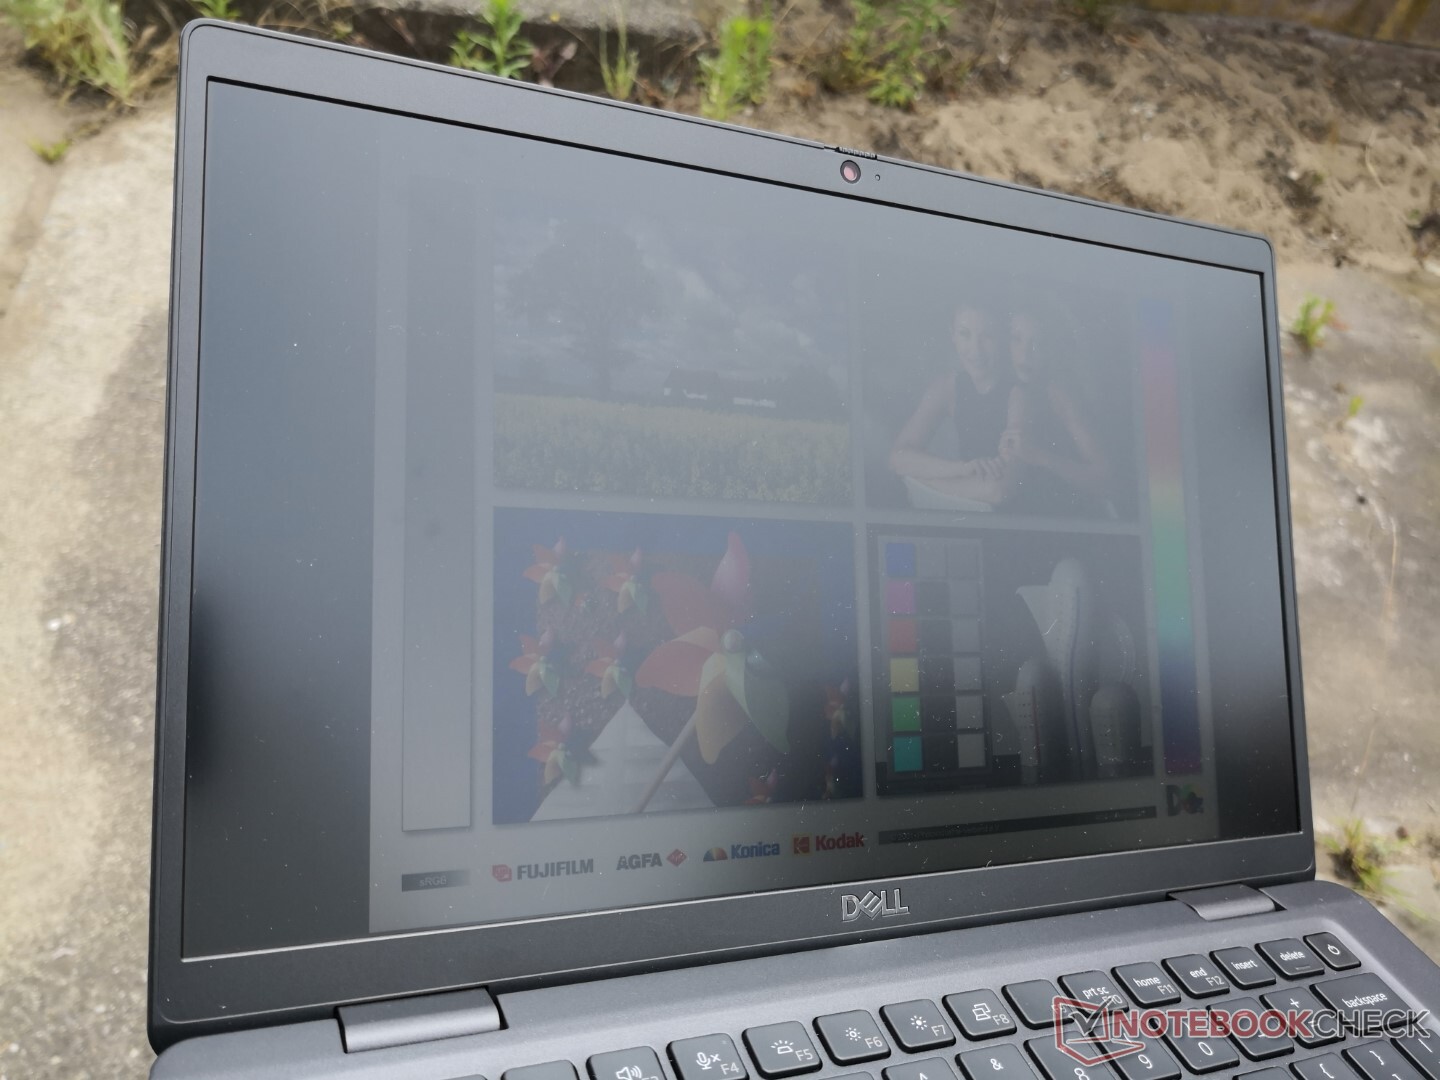
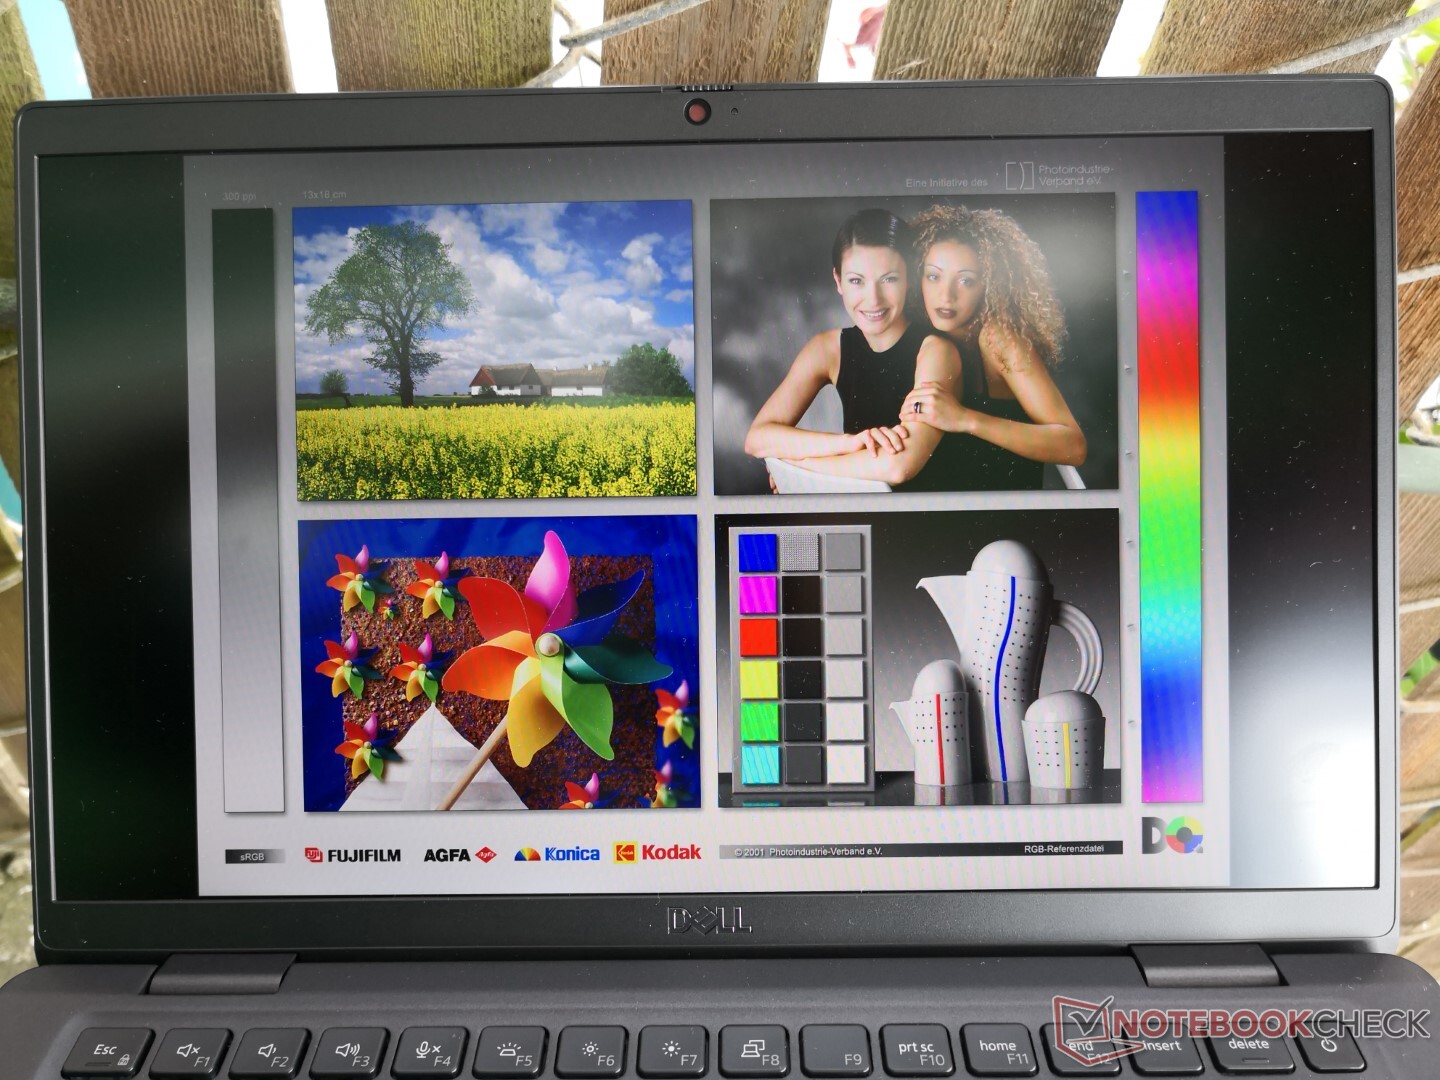
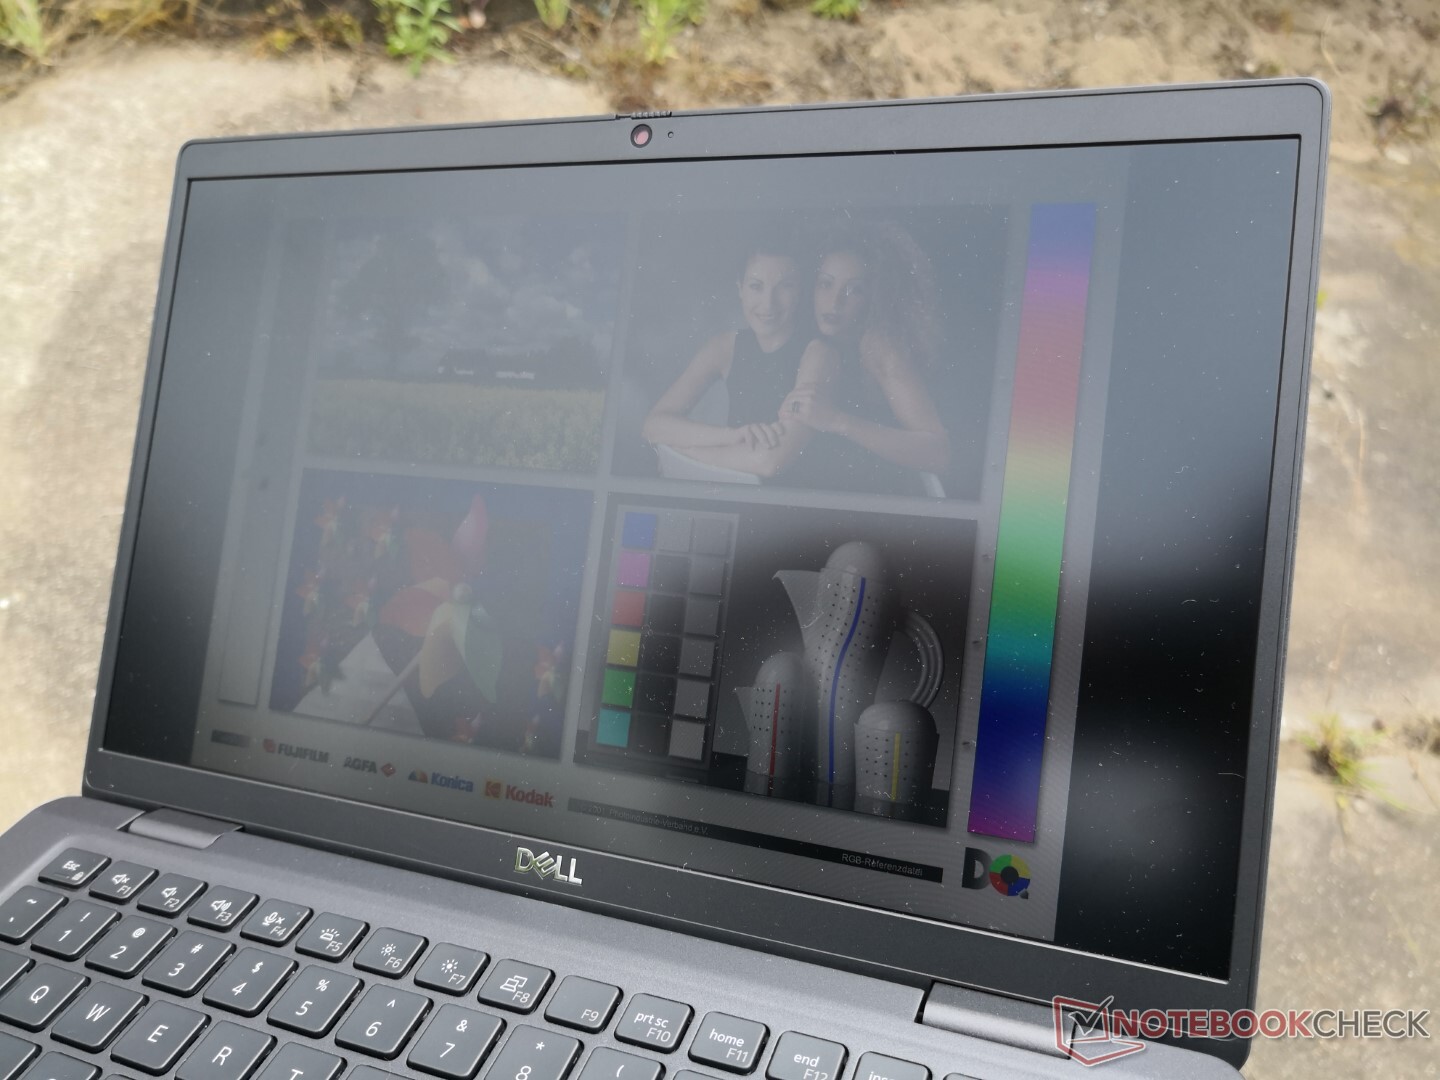
La visibilité en extérieur est assez bonne si vous travaillez à l'ombre, grâce à l'écran relativement lumineux d'environ 450 lumens et au revêtement mat qui réduit les reflets. Cependant, il n'est pas encore assez lumineux pour être vu confortablement par temps ensoleillé ou par temps clair et nuageux.
Performance - Le Core i7-1265U impressionne
Conditions d'essai
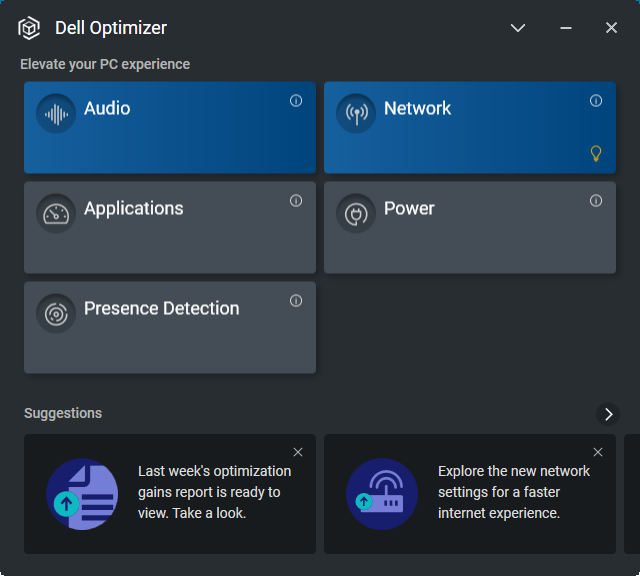
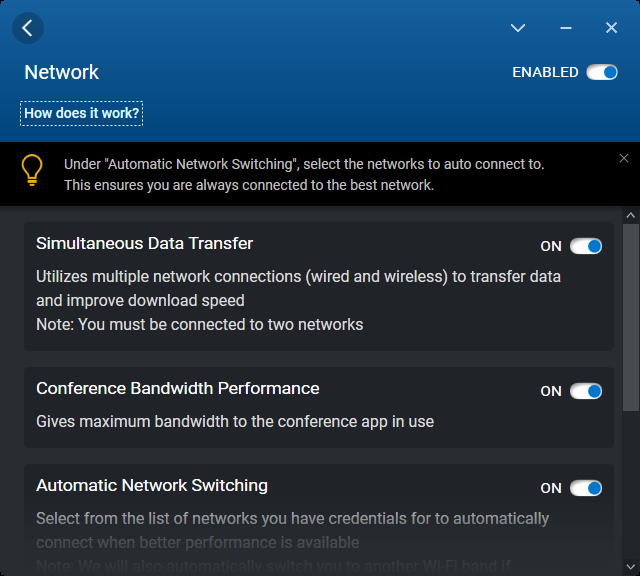
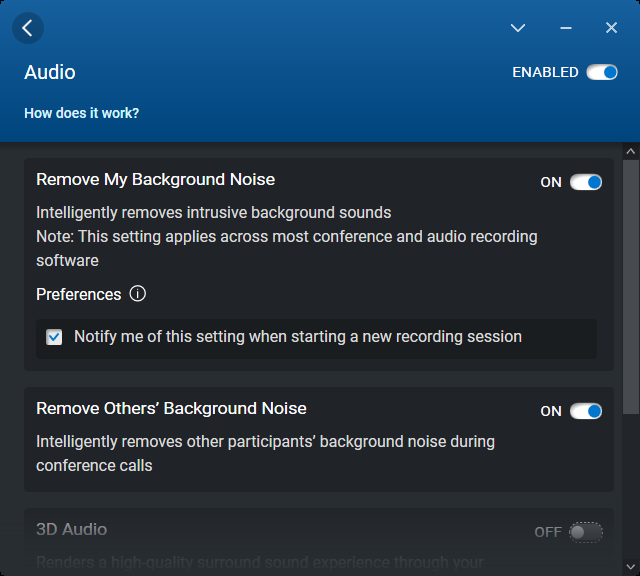
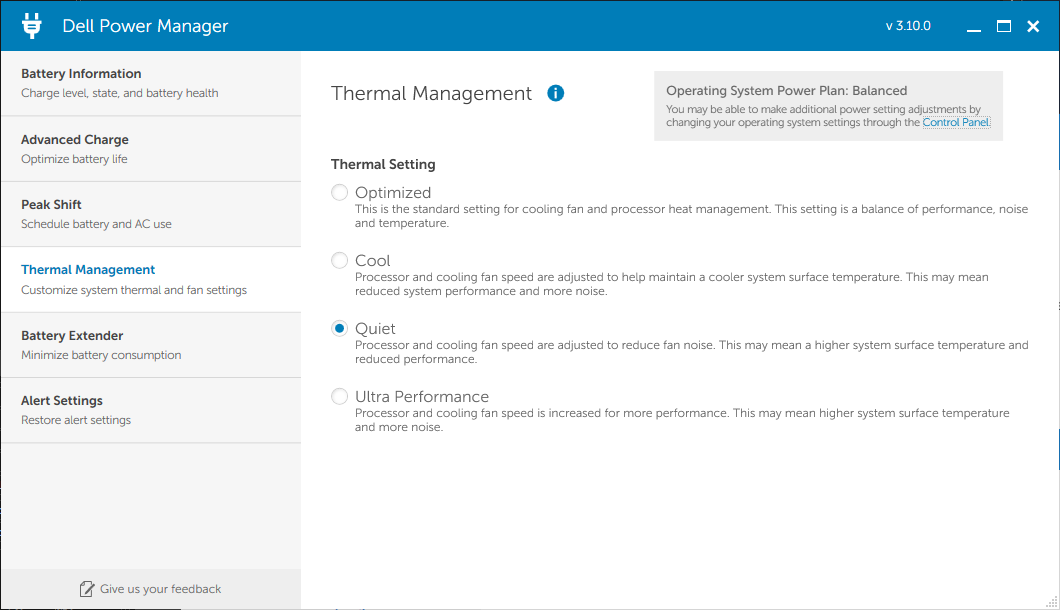
Nous avons configuré notre appareil en mode Performance et en mode Ultra Performance pour Windows et le logiciel Dell Power Manager, respectivement, avant d'effectuer les tests de référence ci-dessous. Il est recommandé aux propriétaires de se familiariser avec les applications préinstallées Dell Power Manager, Optimizer et Command, car elles servent de plaques tournantes pour les mises à jour et les fonctions spécifiques au modèle.
Processeur
Après avoir été déçu avec le Core i5-1235Unos espoirs n'étaient pas très élevés pour le Core i7-1265U. Heureusement, le i7-1265U se révèle être un véritable démon de la vitesse malgré son appartenance à la famille U-series. Les performances brutes monofil et multifil sont supérieures de 20 % et de 60 % à celles de l'ordinateur portable moyen de notre base de données équipé de la dernière génération du Core i7-1165G7. En fait, le processeur n'est qu'à environ 10 à 25 % derrière le plus exigeant Core i7-1260P. Certains processeurs AMD haut de gamme, comme le Ryzen 7 5700U ou5800U peuvent égaler ou surpasser le Core i7-1265U dans les charges de travail multithreadées, mais ils restent à la traîne dans les opérations monofilaires
La durabilité des performances est bonne, mais elle pourrait certainement être meilleure. L'exécution de CineBench R15 xT en boucle montre un score initial de 1379 points avant de baisser régulièrement et de se stabiliser à environ 1000 points, ce qui représente une baisse de performance d'environ 27%. Le potentiel de refroidissement limité de la petite solution de refroidissement empêche probablement le CPU de fonctionner à des fréquences d'horloge plus élevées pendant de plus longues périodes.
Cinebench R15 Multi Loop
Cinebench R23: Multi Core | Single Core
Cinebench R15: CPU Multi 64Bit | CPU Single 64Bit
Blender: v2.79 BMW27 CPU
7-Zip 18.03: 7z b 4 | 7z b 4 -mmt1
Geekbench 5.5: Multi-Core | Single-Core
HWBOT x265 Benchmark v2.2: 4k Preset
LibreOffice : 20 Documents To PDF
R Benchmark 2.5: Overall mean
| Cinebench R23 / Multi Core | |
| Framework Laptop 13.5 12th Gen Intel | |
| MSI Summit E14 Flip Evo A12MT | |
| Dell Latitude 13 7330 | |
| HP Pavilion Aero 13 be0097nr | |
| Asus ZenBook 13 OLED UM325UA | |
| Moyenne Intel Core i7-1265U (4332 - 9219, n=10) | |
| Microsoft Surface Laptop 4 13 Ryzen 5 | |
| Razer Book 13 FHD | |
| Samsung Galaxy Book2 Pro 13 NP930XED-KA1DE | |
| Moyenne Intel Core i7-1165G7 (2525 - 6862, n=64) | |
| Gateway Ultra Slim 14.1 GWTC51427 | |
| Dell Latitude 5320-TM4V2 | |
| Cinebench R23 / Single Core | |
| MSI Summit E14 Flip Evo A12MT | |
| Dell Latitude 13 7330 | |
| Framework Laptop 13.5 12th Gen Intel | |
| Moyenne Intel Core i7-1265U (1144 - 1820, n=10) | |
| Gateway Ultra Slim 14.1 GWTC51427 | |
| Moyenne Intel Core i7-1165G7 (1110 - 1539, n=59) | |
| HP Pavilion Aero 13 be0097nr | |
| Dell Latitude 5320-TM4V2 | |
| Asus ZenBook 13 OLED UM325UA | |
| Microsoft Surface Laptop 4 13 Ryzen 5 | |
| Samsung Galaxy Book2 Pro 13 NP930XED-KA1DE | |
Cinebench R23: Multi Core | Single Core
Cinebench R15: CPU Multi 64Bit | CPU Single 64Bit
Blender: v2.79 BMW27 CPU
7-Zip 18.03: 7z b 4 | 7z b 4 -mmt1
Geekbench 5.5: Multi-Core | Single-Core
HWBOT x265 Benchmark v2.2: 4k Preset
LibreOffice : 20 Documents To PDF
R Benchmark 2.5: Overall mean
* ... Moindre est la valeur, meilleures sont les performances
AIDA64: FP32 Ray-Trace | FPU Julia | CPU SHA3 | CPU Queen | FPU SinJulia | FPU Mandel | CPU AES | CPU ZLib | FP64 Ray-Trace | CPU PhotoWorxx
| Performance rating | |
| Microsoft Surface Laptop 4 13 Ryzen 5 | |
| Framework Laptop 13.5 12th Gen Intel | |
| Dell Latitude 13 7330 | |
| Dell Latitude 7310 | |
| Lenovo ThinkPad X13 Yoga 20SX0004GE | |
| AIDA64 / FP32 Ray-Trace | |
| Microsoft Surface Laptop 4 13 Ryzen 5 | |
| Dell Latitude 13 7330 | |
| Framework Laptop 13.5 12th Gen Intel | |
| Dell Latitude 7310 | |
| Lenovo ThinkPad X13 Yoga 20SX0004GE | |
| AIDA64 / FPU Julia | |
| Microsoft Surface Laptop 4 13 Ryzen 5 | |
| Dell Latitude 13 7330 | |
| Framework Laptop 13.5 12th Gen Intel | |
| Dell Latitude 7310 | |
| Lenovo ThinkPad X13 Yoga 20SX0004GE | |
| AIDA64 / CPU SHA3 | |
| Dell Latitude 13 7330 | |
| Framework Laptop 13.5 12th Gen Intel | |
| Microsoft Surface Laptop 4 13 Ryzen 5 | |
| Lenovo ThinkPad X13 Yoga 20SX0004GE | |
| Dell Latitude 7310 | |
| AIDA64 / CPU Queen | |
| Framework Laptop 13.5 12th Gen Intel | |
| Microsoft Surface Laptop 4 13 Ryzen 5 | |
| Dell Latitude 13 7330 | |
| Dell Latitude 7310 | |
| Lenovo ThinkPad X13 Yoga 20SX0004GE | |
| AIDA64 / FPU SinJulia | |
| Microsoft Surface Laptop 4 13 Ryzen 5 | |
| Framework Laptop 13.5 12th Gen Intel | |
| Dell Latitude 13 7330 | |
| Dell Latitude 7310 | |
| Lenovo ThinkPad X13 Yoga 20SX0004GE | |
| AIDA64 / FPU Mandel | |
| Microsoft Surface Laptop 4 13 Ryzen 5 | |
| Dell Latitude 13 7330 | |
| Framework Laptop 13.5 12th Gen Intel | |
| Dell Latitude 7310 | |
| Lenovo ThinkPad X13 Yoga 20SX0004GE | |
| AIDA64 / CPU AES | |
| Framework Laptop 13.5 12th Gen Intel | |
| Dell Latitude 13 7330 | |
| Microsoft Surface Laptop 4 13 Ryzen 5 | |
| Lenovo ThinkPad X13 Yoga 20SX0004GE | |
| Dell Latitude 7310 | |
| AIDA64 / CPU ZLib | |
| Framework Laptop 13.5 12th Gen Intel | |
| Microsoft Surface Laptop 4 13 Ryzen 5 | |
| Dell Latitude 13 7330 | |
| Lenovo ThinkPad X13 Yoga 20SX0004GE | |
| Dell Latitude 7310 | |
| AIDA64 / FP64 Ray-Trace | |
| Microsoft Surface Laptop 4 13 Ryzen 5 | |
| Dell Latitude 13 7330 | |
| Framework Laptop 13.5 12th Gen Intel | |
| Dell Latitude 7310 | |
| Lenovo ThinkPad X13 Yoga 20SX0004GE | |
| AIDA64 / CPU PhotoWorxx | |
| Framework Laptop 13.5 12th Gen Intel | |
| Dell Latitude 13 7330 | |
| Dell Latitude 7310 | |
| Microsoft Surface Laptop 4 13 Ryzen 5 | |
| Lenovo ThinkPad X13 Yoga 20SX0004GE | |
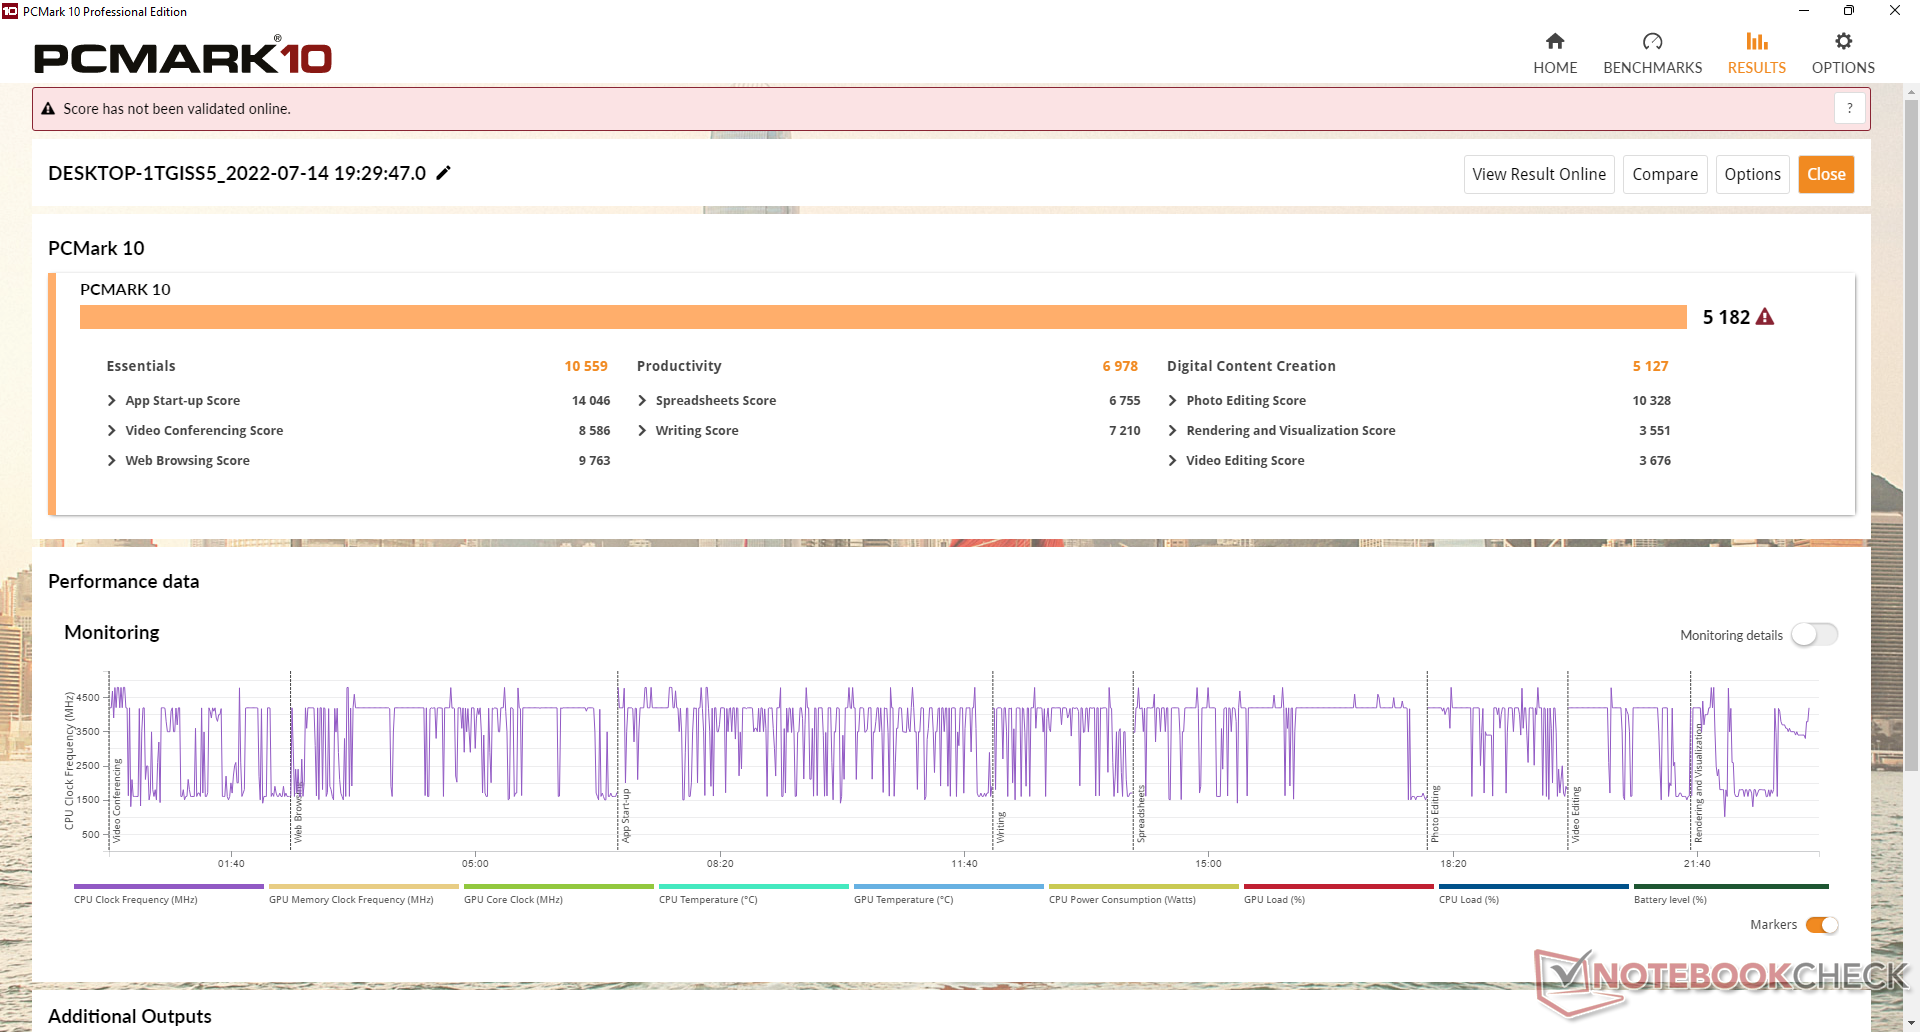
Performance du système
Les scores PCMark sont plus élevés que ceux de nombreux autres ordinateurs portables professionnels équipés de processeurs de dernière génération ou plus anciens, tels que l'ordinateur portable Surface 4 de Microsoft.Microsoft Surface Laptop 4 ou encore le Latitude 7310. LeRazer Book 13 est très proche grâce à son SSD plus rapide et à ses performances graphiques intégrées.
CrossMark: Overall | Productivity | Creativity | Responsiveness
| PCMark 10 / Score | |
| Framework Laptop 13.5 12th Gen Intel | |
| Moyenne Intel Core i7-1265U, Intel Iris Xe Graphics G7 96EUs (4753 - 5766, n=7) | |
| Dell Latitude 13 7330 | |
| Razer Book 13 FHD | |
| Microsoft Surface Laptop 4 13 Ryzen 5 | |
| Dell Latitude 7310 | |
| Lenovo ThinkPad X13 Yoga 20SX0004GE | |
| PCMark 10 / Essentials | |
| Framework Laptop 13.5 12th Gen Intel | |
| Dell Latitude 13 7330 | |
| Moyenne Intel Core i7-1265U, Intel Iris Xe Graphics G7 96EUs (9278 - 11418, n=7) | |
| Razer Book 13 FHD | |
| Lenovo ThinkPad X13 Yoga 20SX0004GE | |
| Dell Latitude 7310 | |
| Microsoft Surface Laptop 4 13 Ryzen 5 | |
| PCMark 10 / Productivity | |
| Dell Latitude 7310 | |
| Framework Laptop 13.5 12th Gen Intel | |
| Dell Latitude 13 7330 | |
| Lenovo ThinkPad X13 Yoga 20SX0004GE | |
| Razer Book 13 FHD | |
| Moyenne Intel Core i7-1265U, Intel Iris Xe Graphics G7 96EUs (5828 - 7311, n=7) | |
| Microsoft Surface Laptop 4 13 Ryzen 5 | |
| PCMark 10 / Digital Content Creation | |
| Framework Laptop 13.5 12th Gen Intel | |
| Moyenne Intel Core i7-1265U, Intel Iris Xe Graphics G7 96EUs (5127 - 6330, n=7) | |
| Razer Book 13 FHD | |
| Dell Latitude 13 7330 | |
| Microsoft Surface Laptop 4 13 Ryzen 5 | |
| Dell Latitude 7310 | |
| Lenovo ThinkPad X13 Yoga 20SX0004GE | |
| CrossMark / Overall | |
| Framework Laptop 13.5 12th Gen Intel | |
| Moyenne Intel Core i7-1265U, Intel Iris Xe Graphics G7 96EUs (1301 - 1615, n=7) | |
| Dell Latitude 13 7330 | |
| CrossMark / Productivity | |
| Framework Laptop 13.5 12th Gen Intel | |
| Dell Latitude 13 7330 | |
| Moyenne Intel Core i7-1265U, Intel Iris Xe Graphics G7 96EUs (1230 - 1586, n=7) | |
| CrossMark / Creativity | |
| Framework Laptop 13.5 12th Gen Intel | |
| Moyenne Intel Core i7-1265U, Intel Iris Xe Graphics G7 96EUs (1413 - 1706, n=7) | |
| Dell Latitude 13 7330 | |
| CrossMark / Responsiveness | |
| Framework Laptop 13.5 12th Gen Intel | |
| Moyenne Intel Core i7-1265U, Intel Iris Xe Graphics G7 96EUs (1193 - 1521, n=7) | |
| Dell Latitude 13 7330 | |
| PCMark 10 Score | 5182 points | |
Aide | ||
| AIDA64 / Memory Copy | |
| Moyenne Intel Core i7-1265U (40212 - 72204, n=10) | |
| Framework Laptop 13.5 12th Gen Intel | |
| Dell Latitude 13 7330 | |
| Microsoft Surface Laptop 4 13 Ryzen 5 | |
| Dell Latitude 7310 | |
| Lenovo ThinkPad X13 Yoga 20SX0004GE | |
| AIDA64 / Memory Read | |
| Moyenne Intel Core i7-1265U (41808 - 69493, n=10) | |
| Framework Laptop 13.5 12th Gen Intel | |
| Microsoft Surface Laptop 4 13 Ryzen 5 | |
| Dell Latitude 13 7330 | |
| Dell Latitude 7310 | |
| Lenovo ThinkPad X13 Yoga 20SX0004GE | |
| AIDA64 / Memory Write | |
| Moyenne Intel Core i7-1265U (41382 - 76027, n=10) | |
| Framework Laptop 13.5 12th Gen Intel | |
| Dell Latitude 13 7330 | |
| Microsoft Surface Laptop 4 13 Ryzen 5 | |
| Dell Latitude 7310 | |
| Lenovo ThinkPad X13 Yoga 20SX0004GE | |
| AIDA64 / Memory Latency | |
| Microsoft Surface Laptop 4 13 Ryzen 5 | |
| Moyenne Intel Core i7-1265U (74.6 - 112.4, n=10) | |
| Lenovo ThinkPad X13 Yoga 20SX0004GE | |
| Dell Latitude 7310 | |
| Framework Laptop 13.5 12th Gen Intel | |
| Dell Latitude 13 7330 | |
* ... Moindre est la valeur, meilleures sont les performances
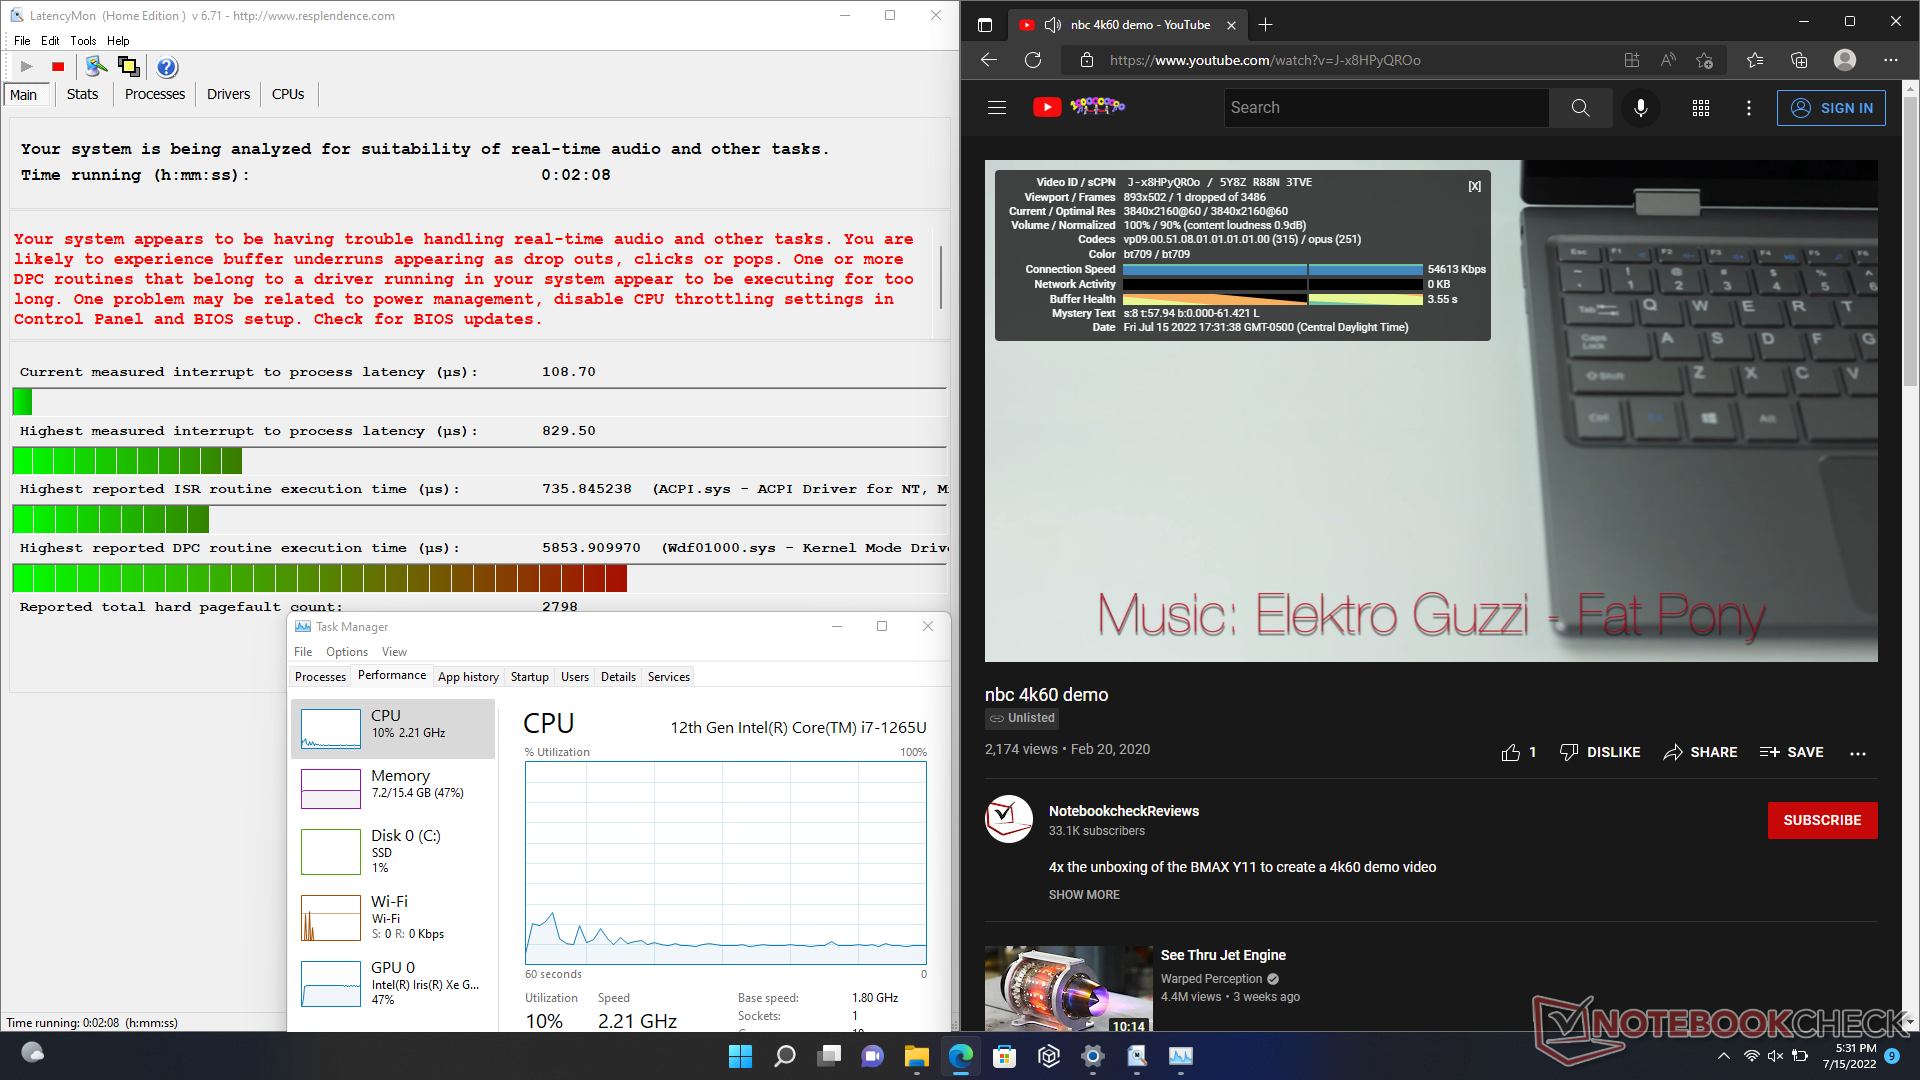
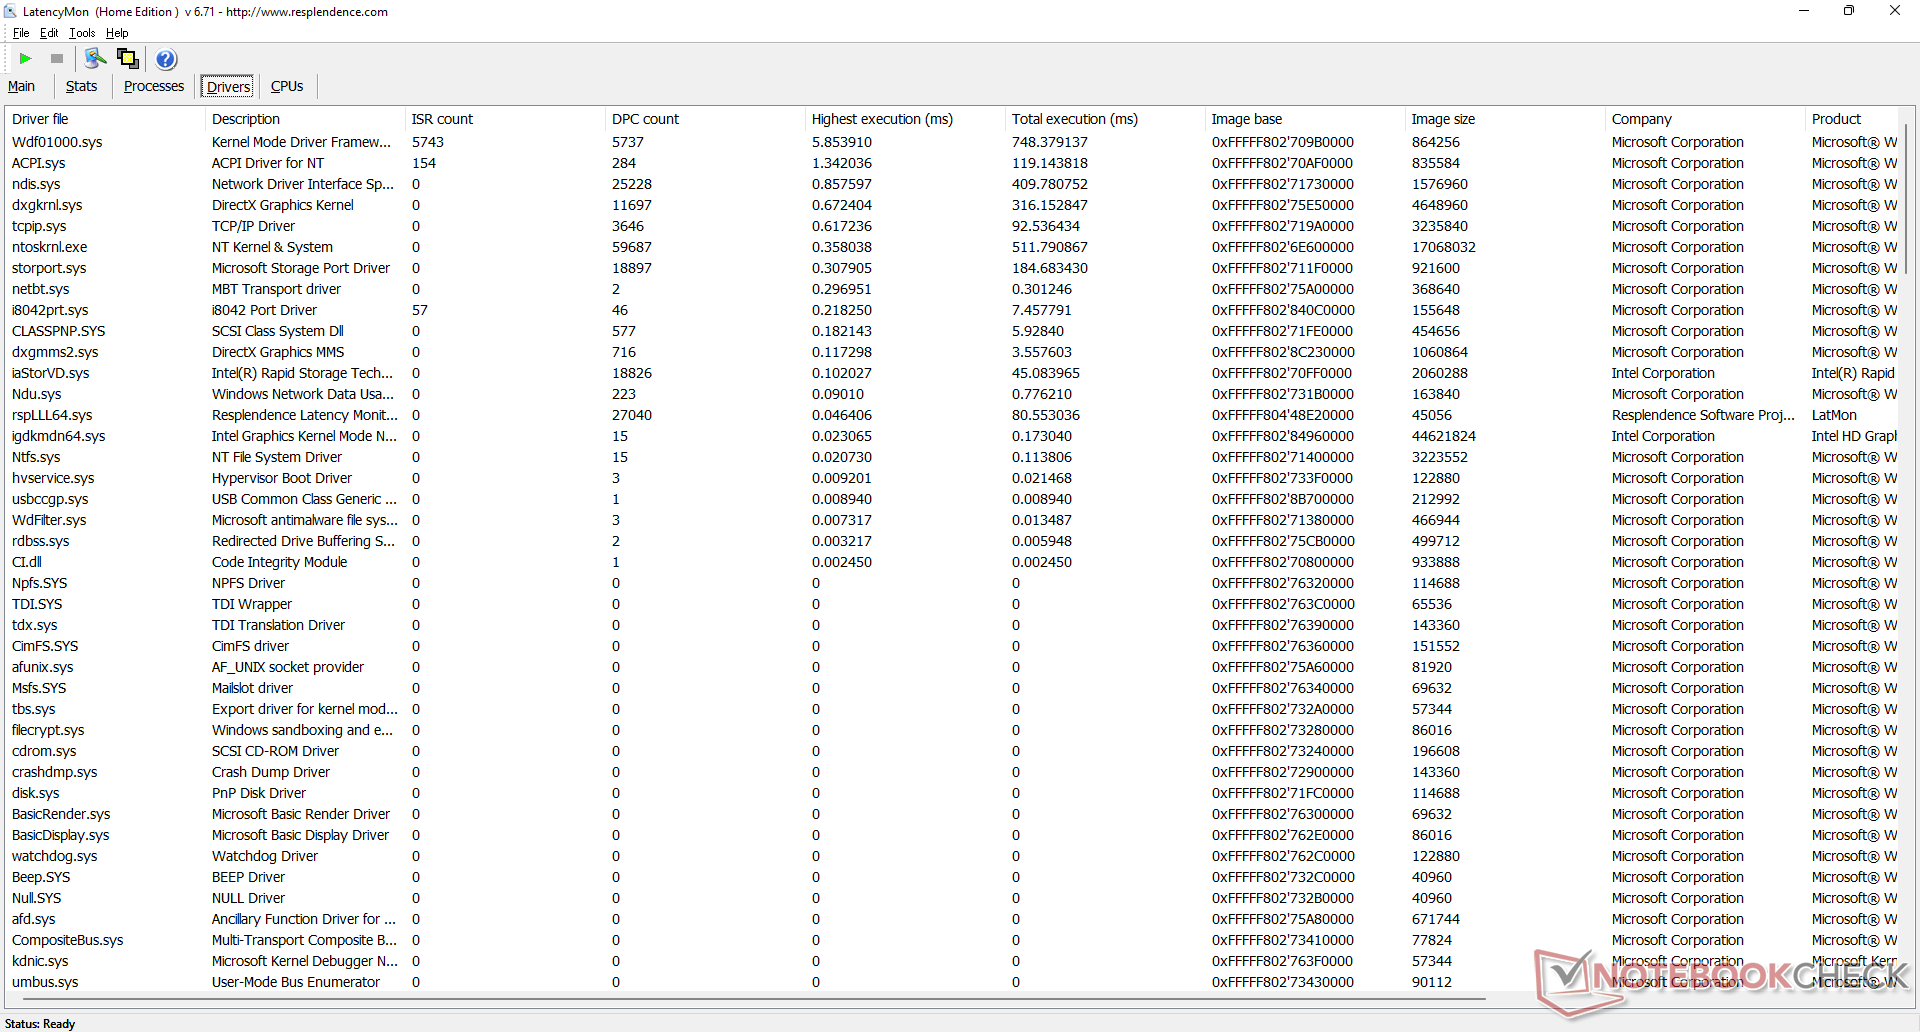
Latence DPC
LatencyMon révèle des problèmes de DPC lors de l'ouverture de plusieurs onglets de navigateur sur notre page d'accueil. la lecture de vidéos 4K à 60 FPS est par ailleurs parfaite, avec une seule image perdue pendant notre vidéo de test de 60 secondes.
| DPC Latencies / LatencyMon - interrupt to process latency (max), Web, Youtube, Prime95 | |
| Razer Book 13 FHD | |
| Framework Laptop 13.5 12th Gen Intel | |
| Lenovo ThinkPad X13 Yoga 20SX0004GE | |
| Microsoft Surface Laptop 4 13 Ryzen 5 | |
| Dell Latitude 13 7330 | |
| Dell Latitude 7310 | |
* ... Moindre est la valeur, meilleures sont les performances
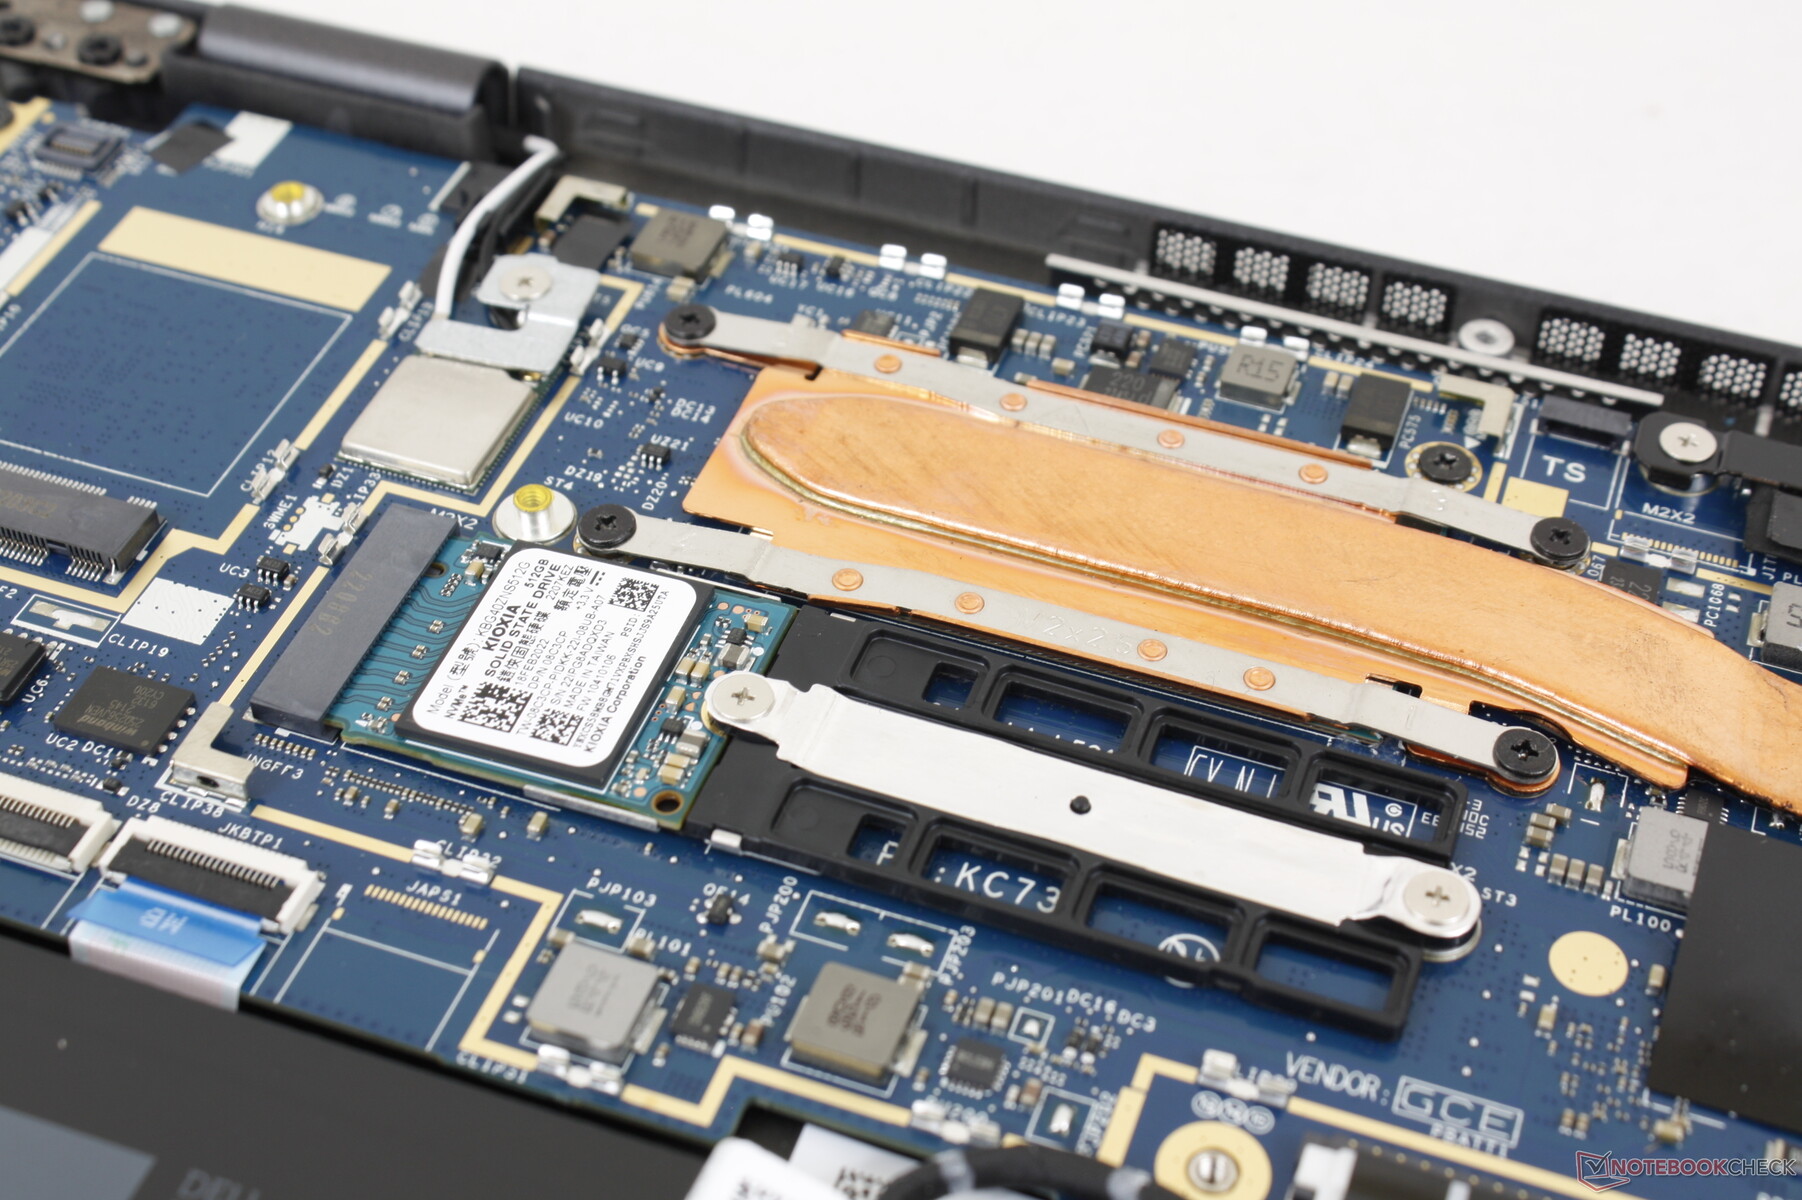
Périphériques de stockage - Un seul disque interne
Dell aime livrer la plupart de ses ordinateurs portables avec des disques SSD M.2 2230 plus courts que les disques 2280 plus longs de la plupart des autres ordinateurs portables. Le site 512 Go Kioxia PCIe3 x4 de notre unité de test atteignait 2400 Mo/s pendant une courte période avant que l'étranglement n'intervienne pour réduire les taux de transfert à seulement 1200 Mo/s, comme le montrent les résultats de notre test en boucle DiskSpd ci-dessous. Le disque est probablement confronté à des limites de température lorsqu'il est sollicité. En comparaison, leHP EliteBook 845 G9 est capable de maintenir des taux de transfert beaucoup plus rapides pendant de plus longues périodes avec son lecteur PCIe4 x4 inclus lorsqu'il est soumis aux mêmes conditions de test.

| Drive Performance rating - Percent | |
| Lenovo ThinkPad X13 Yoga 20SX0004GE | |
| Framework Laptop 13.5 12th Gen Intel | |
| Dell Latitude 7310 | |
| Razer Book 13 FHD | |
| Dell Latitude 13 7330 | |
| Microsoft Surface Laptop 4 13 Ryzen 5 | |
* ... Moindre est la valeur, meilleures sont les performances
Disk Throttling: DiskSpd Read Loop, Queue Depth 8
Performances du GPU - L'Iris Xe fait des siennes
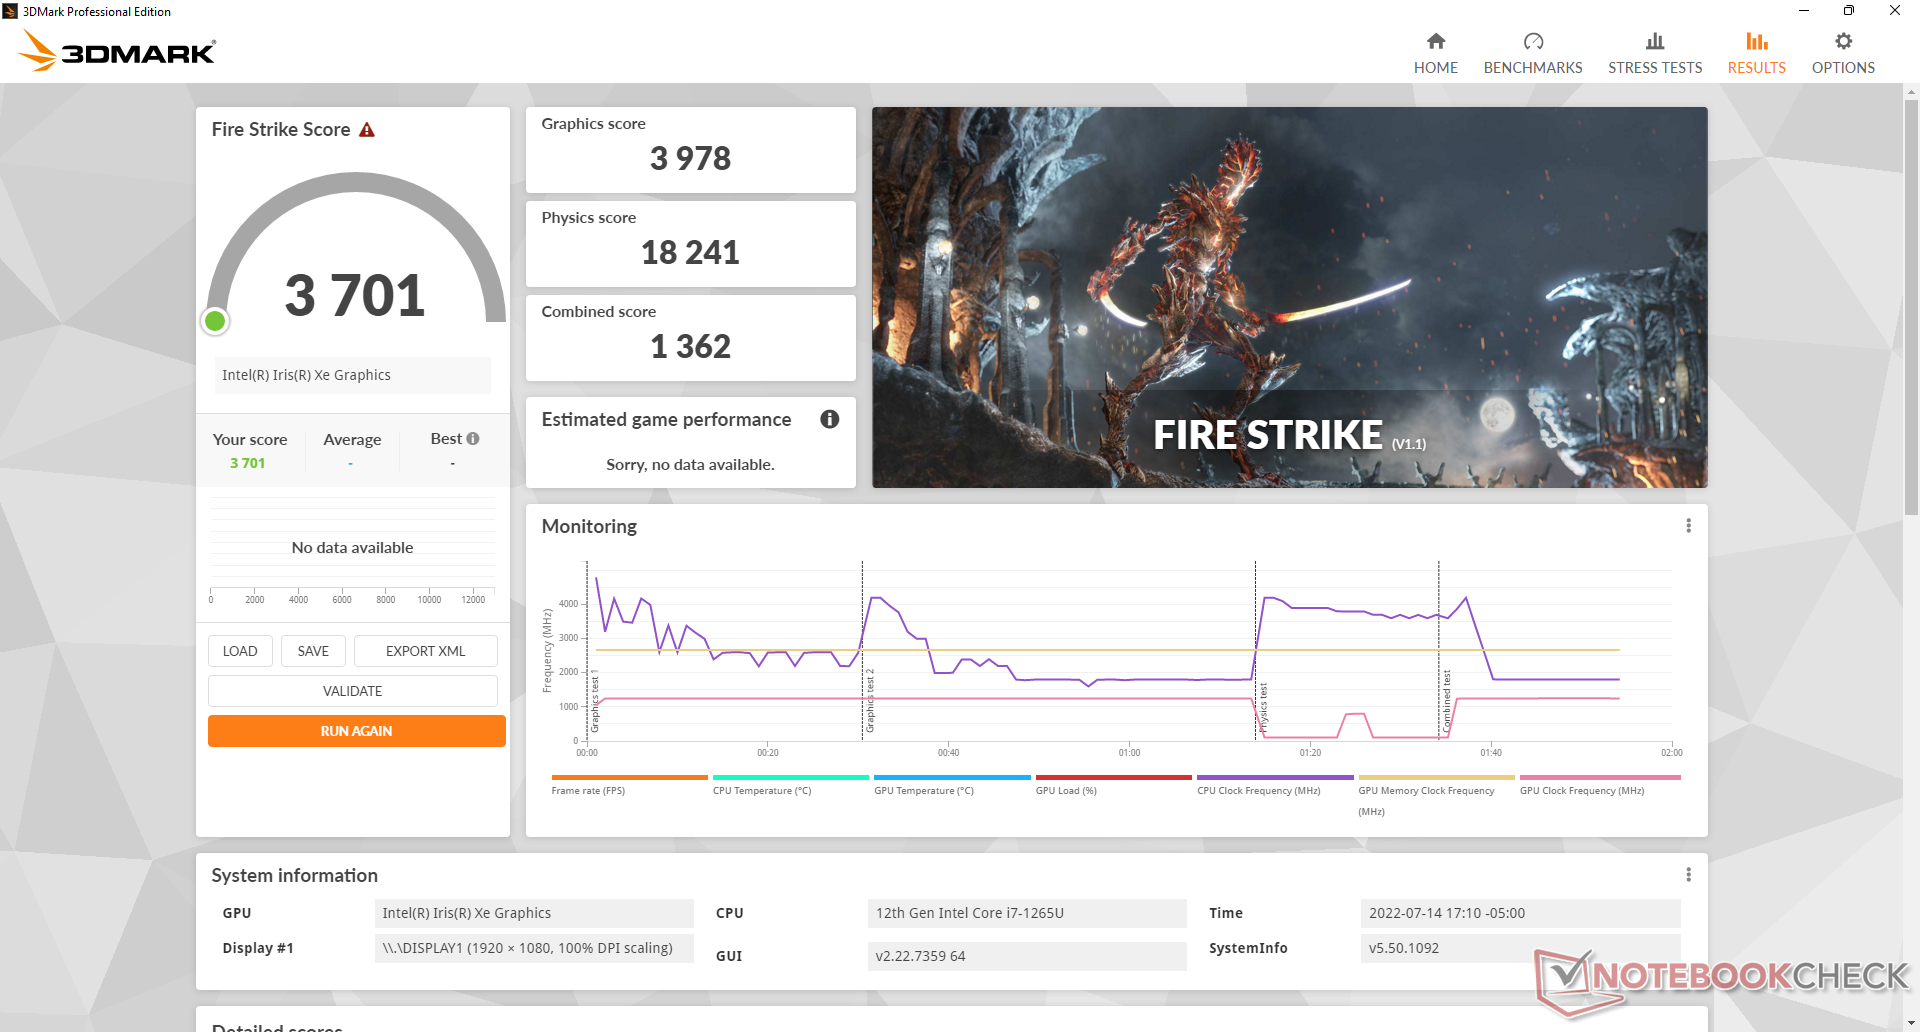
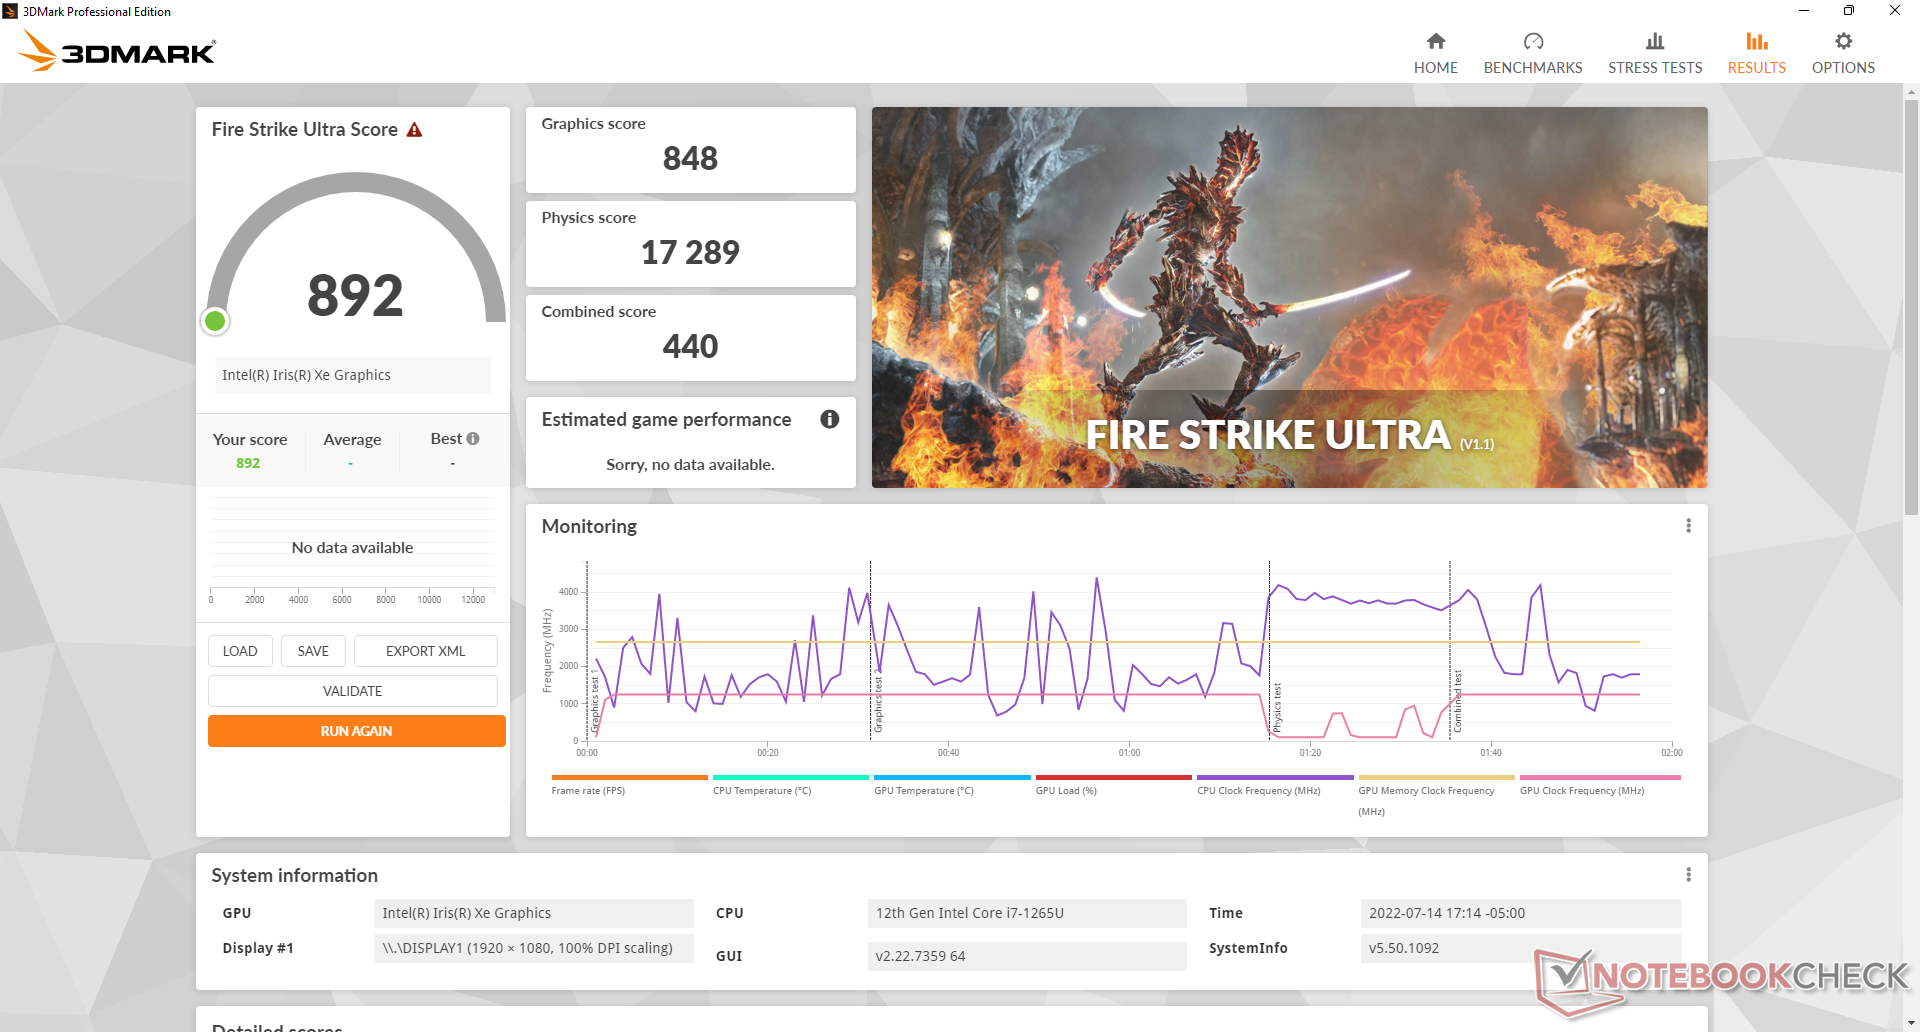
Les performances graphiques sont environ 5 à 20 % plus faibles que celles de l'ordinateur portable moyen de notre base de données équipé de la même technologie Intel Iris Xe G7 96EUs GPU. C'est encore rapide pour une puce graphique intégrée, mais il existe certainement des options plus rapides, comme le Razer Book 13 ou Asus Zenbook S 13 alimenté par AMD si l'optimisation des performances du GPU est une priorité.
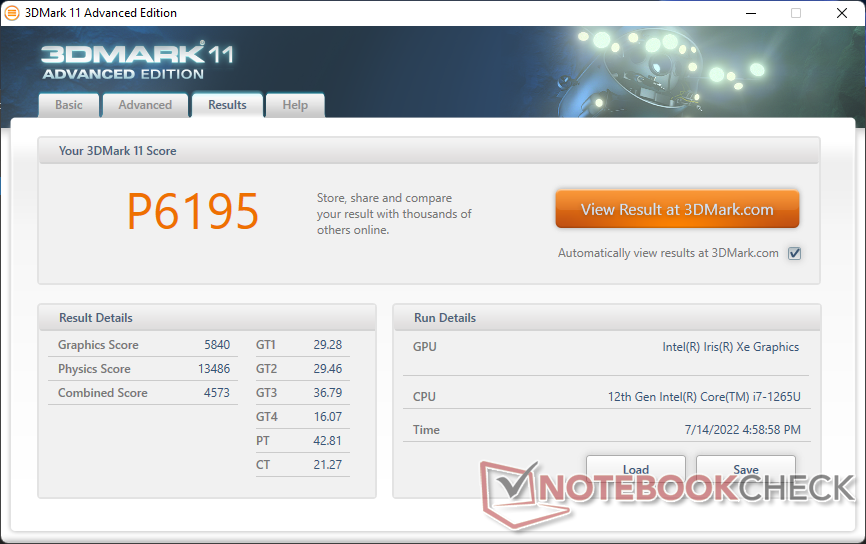

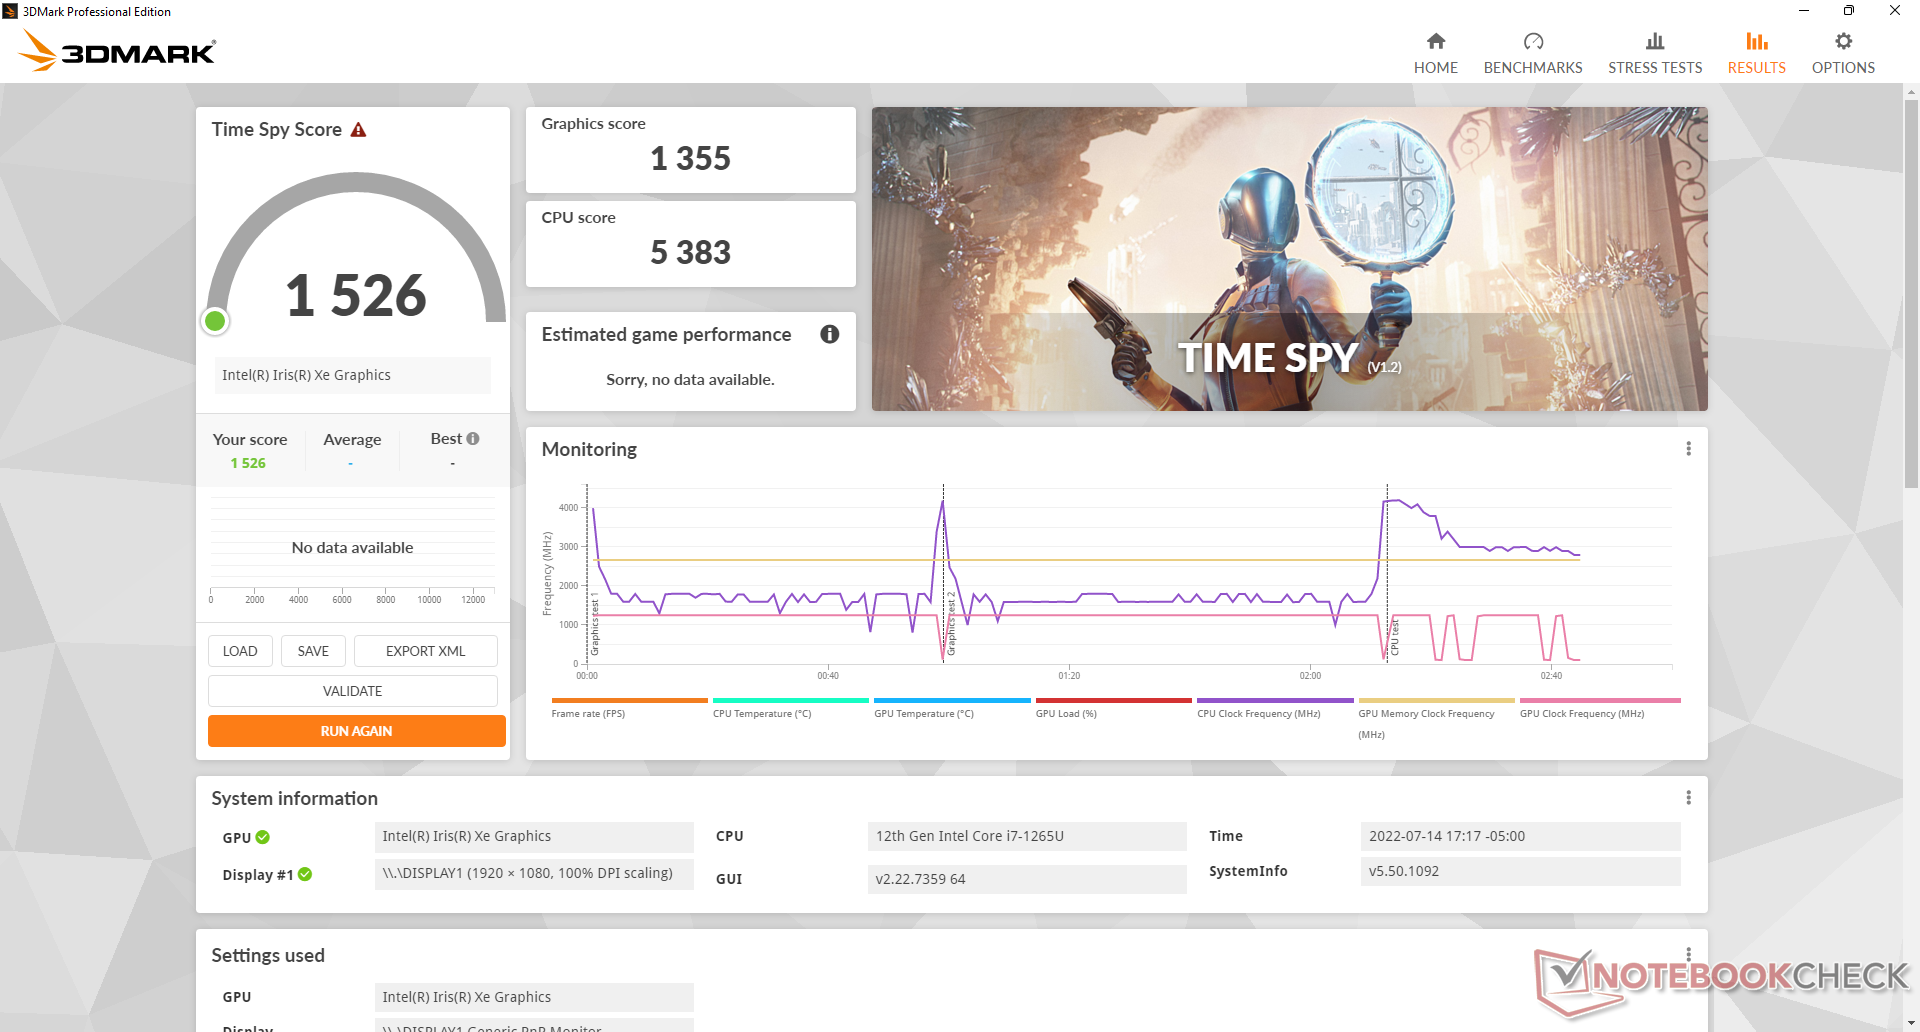
| 3DMark 11 Performance | 6195 points | |
| 3DMark Cloud Gate Standard Score | 20034 points | |
| 3DMark Fire Strike Score | 3701 points | |
| 3DMark Time Spy Score | 1526 points | |
Aide | ||
| Cyberpunk 2077 1.6 | |
| 1920x1080 Low Preset | |
| Framework Laptop 13.5 12th Gen Intel | |
| Moyenne Intel Iris Xe Graphics G7 96EUs (13 - 25.9, n=42) | |
| Dell Latitude 13 7330 | |
| 1920x1080 Medium Preset | |
| Framework Laptop 13.5 12th Gen Intel | |
| Moyenne Intel Iris Xe Graphics G7 96EUs (10.8 - 21.7, n=37) | |
| Dell Latitude 13 7330 | |
| 1920x1080 High Preset | |
| Framework Laptop 13.5 12th Gen Intel | |
| Moyenne Intel Iris Xe Graphics G7 96EUs (9.8 - 16.9, n=34) | |
| Dell Latitude 13 7330 | |
Witcher 3 FPS Chart
| Bas | Moyen | Élevé | Ultra | |
|---|---|---|---|---|
| GTA V (2015) | 84.5 | 64.7 | 13.9 | 6.15 |
| The Witcher 3 (2015) | 71.6 | 47.3 | 23.6 | 11.9 |
| Dota 2 Reborn (2015) | 109.7 | 79.6 | 50.6 | 44.9 |
| Final Fantasy XV Benchmark (2018) | 32.9 | 17.5 | 12.9 | |
| X-Plane 11.11 (2018) | 47.3 | 33.8 | 30.3 | |
| Strange Brigade (2018) | 75.8 | 29.8 | 24.9 | 20 |
| Cyberpunk 2077 1.6 (2022) | 18.7 | 15.4 | 11.2 |
Émissions
Bruit du système - Assez silencieux
Le bruit du ventilateur a tendance à osciller entre un bruit de fond silencieux de 23,4 dB(A) et 25,3 dB(A) lors de la navigation web ou du traitement de texte pour être presque inaudible dans la plupart des environnements. Cependant, il commence à s'intensifier rapidement lors de l'exécution de charges plus exigeantes comme 3DMark 06, où le bruit du ventilateur peut atteindre 38 dB(A), ce qui est plus fort que ce que nous avons enregistré sur le ThinkPad X13 Yogarazer Book 13, ou l'ancien Latitude 7310. Le bruit du ventilateur oscillait entre 37 et 39 dB(A) en fonctionnement Witcher 3 au lieu de rester stable, ce qui aurait été préférable.
Lors de l'utilisation de Prime95, le bruit du ventilateur atteignait 43 dB(A) pendant une courte période avant de retomber rapidement dans la gamme des 39 dB(A).
Degré de la nuisance sonore
| Au repos |
| 23.4 / 23.4 / 23.4 dB(A) |
| Fortement sollicité |
| 37.8 / 43 dB(A) |
 | ||
30 dB silencieux 40 dB(A) audible 50 dB(A) bruyant |
||
min: | ||
| Dell Latitude 13 7330 Iris Xe G7 96EUs, i7-1265U, Toshiba KBG40ZNS512G NVMe | Lenovo ThinkPad X13 Yoga 20SX0004GE UHD Graphics 620, i7-10510U, Samsung SSD PM981a MZVLB512HBJQ | Framework Laptop 13.5 12th Gen Intel Iris Xe G7 96EUs, i7-1260P, WDC PC SN730 SDBPNTY-512G | Razer Book 13 FHD Iris Xe G7 96EUs, i7-1165G7, Samsung SSD PM981a MZVLB256HBHQ | Dell Latitude 7310 UHD Graphics 620, i7-10610U, Samsung SSD PM981a MZVLB512HBJQ | Microsoft Surface Laptop 4 13 Ryzen 5 Vega 7, R5 4680U, Samsung PM991 MZ9LQ256HBJQ | |
|---|---|---|---|---|---|---|
| Noise | -13% | -8% | -4% | -12% | -3% | |
| arrêt / environnement * (dB) | 23.4 | 29.3 -25% | 22.8 3% | 27 -15% | 29 -24% | 24.6 -5% |
| Idle Minimum * (dB) | 23.4 | 29.3 -25% | 23 2% | 27 -15% | 29 -24% | 24.6 -5% |
| Idle Average * (dB) | 23.4 | 29.3 -25% | 23 2% | 27 -15% | 29 -24% | 24.6 -5% |
| Idle Maximum * (dB) | 23.4 | 31.4 -34% | 23 2% | 27.1 -16% | 29 -24% | 24.6 -5% |
| Load Average * (dB) | 37.8 | 33 13% | 47.3 -25% | 29 23% | 30.1 20% | 39.5 -4% |
| Witcher 3 ultra * (dB) | 39.2 | 47.3 -21% | 33.3 15% | |||
| Load Maximum * (dB) | 43 | 34.9 19% | 49.8 -16% | 44.8 -4% | 41.3 4% | 39.5 8% |
* ... Moindre est la valeur, meilleures sont les performances
Température
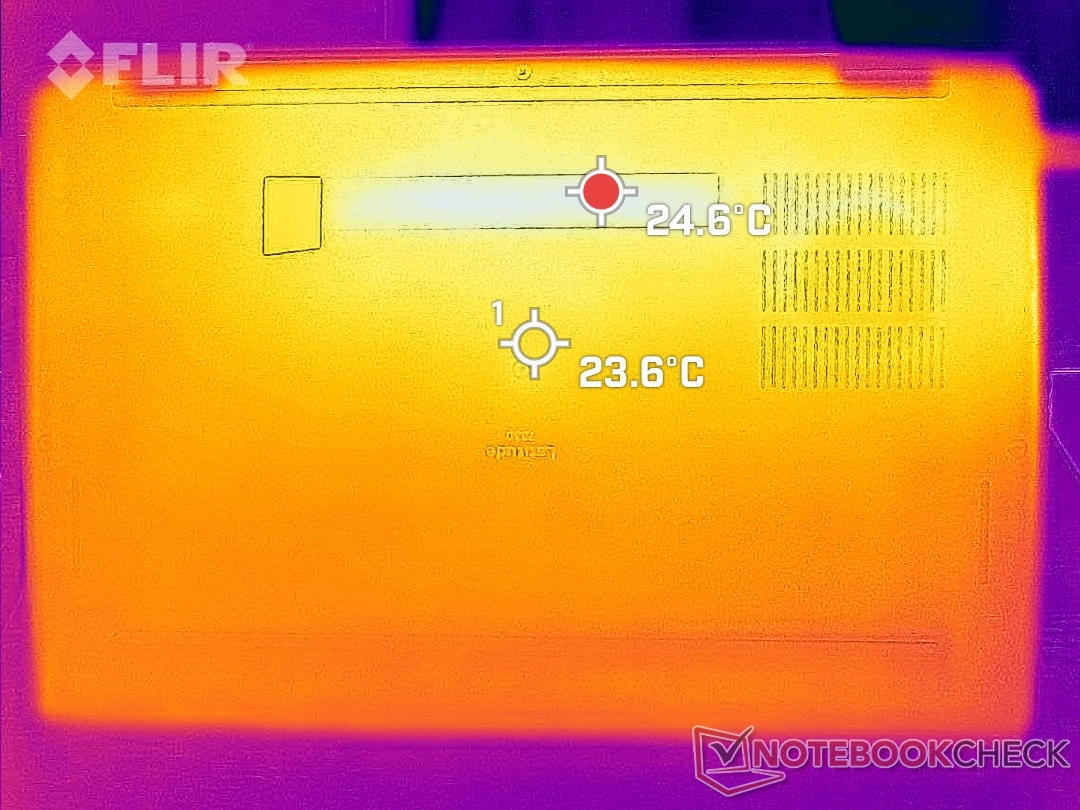
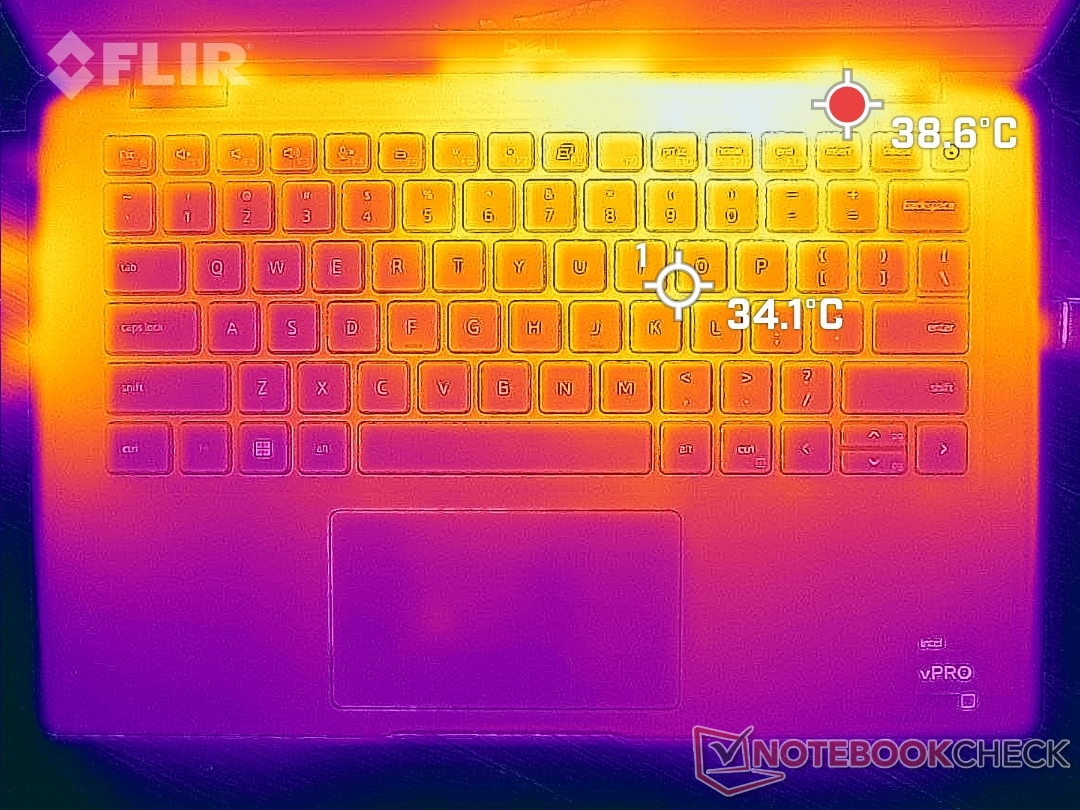
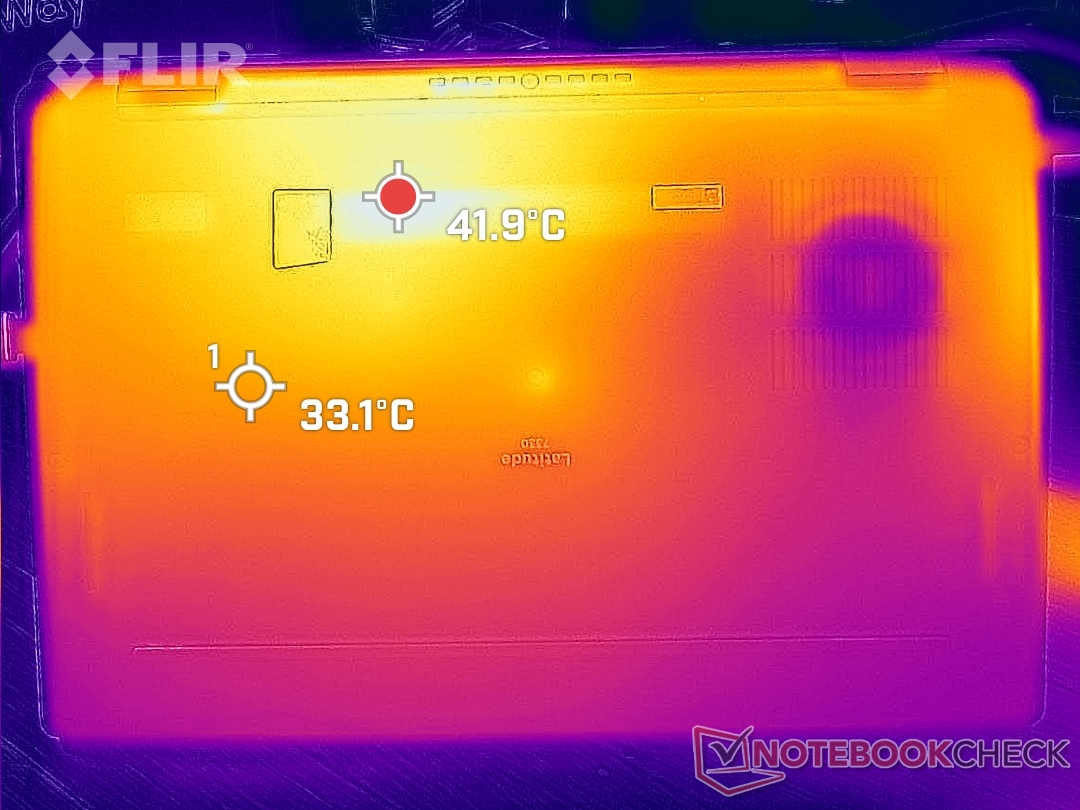
Les températures de surface ne sont pas un problème sur le Latitude 7330. Au pire, nous sommes capables d'enregistrer des points chauds de 39 C et 42 C sur les surfaces supérieure et inférieure, respectivement, pour être plus frais que les 46 C et 53 C que nous avons enregistrés sur l'ancien Latitude 7310. Ces points chauds se trouvent également vers l'arrière du châssis, loin des touches du clavier et des repose-poignets.
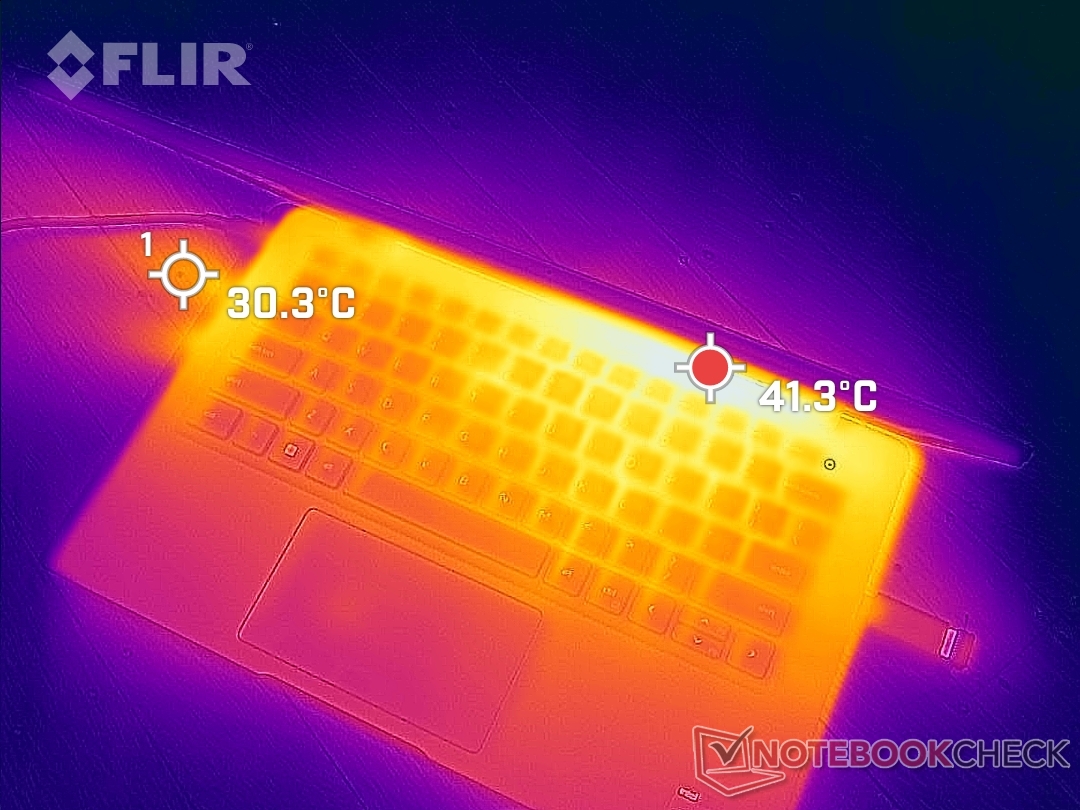
(+) La température maximale du côté supérieur est de 38.6 °C / 101 F, par rapport à la moyenne de 34.3 °C / 94 F, allant de 21.2 à 62.5 °C pour la classe Office.
(±) Le fond chauffe jusqu'à un maximum de 42 °C / 108 F, contre une moyenne de 36.8 °C / 98 F
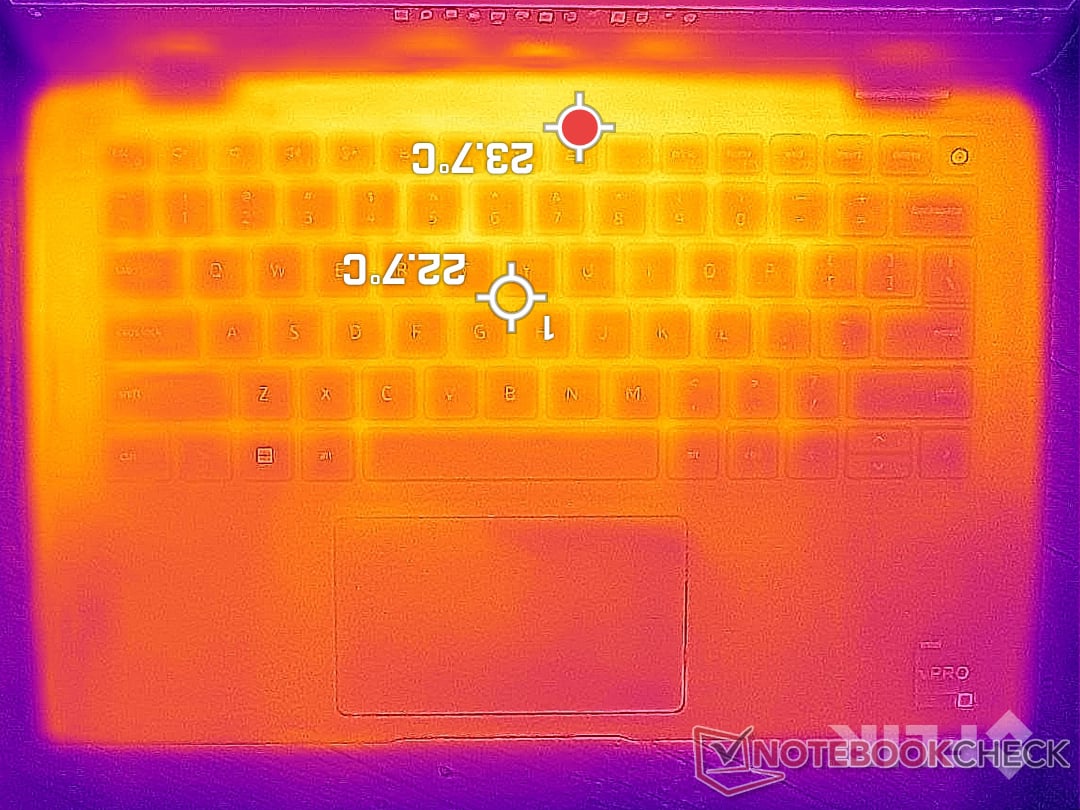
(+) En utilisation inactive, la température moyenne du côté supérieur est de 22.2 °C / 72 F, par rapport à la moyenne du dispositif de 29.5 °C / 85 F.
(+) Les repose-poignets et le pavé tactile sont plus froids que la température de la peau avec un maximum de 23.2 °C / 73.8 F et sont donc froids au toucher.
(+) La température moyenne de la zone de l'appui-paume de dispositifs similaires était de 27.5 °C / 81.5 F (+4.3 °C / #7.7 F).
| Dell Latitude 13 7330 Intel Core i7-1265U, Intel Iris Xe Graphics G7 96EUs | Lenovo ThinkPad X13 Yoga 20SX0004GE Intel Core i7-10510U, Intel UHD Graphics 620 | Framework Laptop 13.5 12th Gen Intel Intel Core i7-1260P, Intel Iris Xe Graphics G7 96EUs | Razer Book 13 FHD Intel Core i7-1165G7, Intel Iris Xe Graphics G7 96EUs | Dell Latitude 7310 Intel Core i7-10610U, Intel UHD Graphics 620 | Microsoft Surface Laptop 4 13 Ryzen 5 AMD Ryzen 5 4680U, AMD Radeon RX Vega 7 | |
|---|---|---|---|---|---|---|
| Heat | -31% | -4% | -3% | -22% | -9% | |
| Maximum Upper Side * (°C) | 38.6 | 43.8 -13% | 36.8 5% | 39.2 -2% | 45.2 -17% | 45.8 -19% |
| Maximum Bottom * (°C) | 42 | 65 -55% | 42.4 -1% | 44 -5% | 52.8 -26% | 45.5 -8% |
| Idle Upper Side * (°C) | 23.8 | 29.2 -23% | 24.2 -2% | 23 3% | 28.2 -18% | 24.9 -5% |
| Idle Bottom * (°C) | 24.6 | 32.7 -33% | 29 -18% | 26.8 -9% | 31.6 -28% | 25.7 -4% |
* ... Moindre est la valeur, meilleures sont les performances
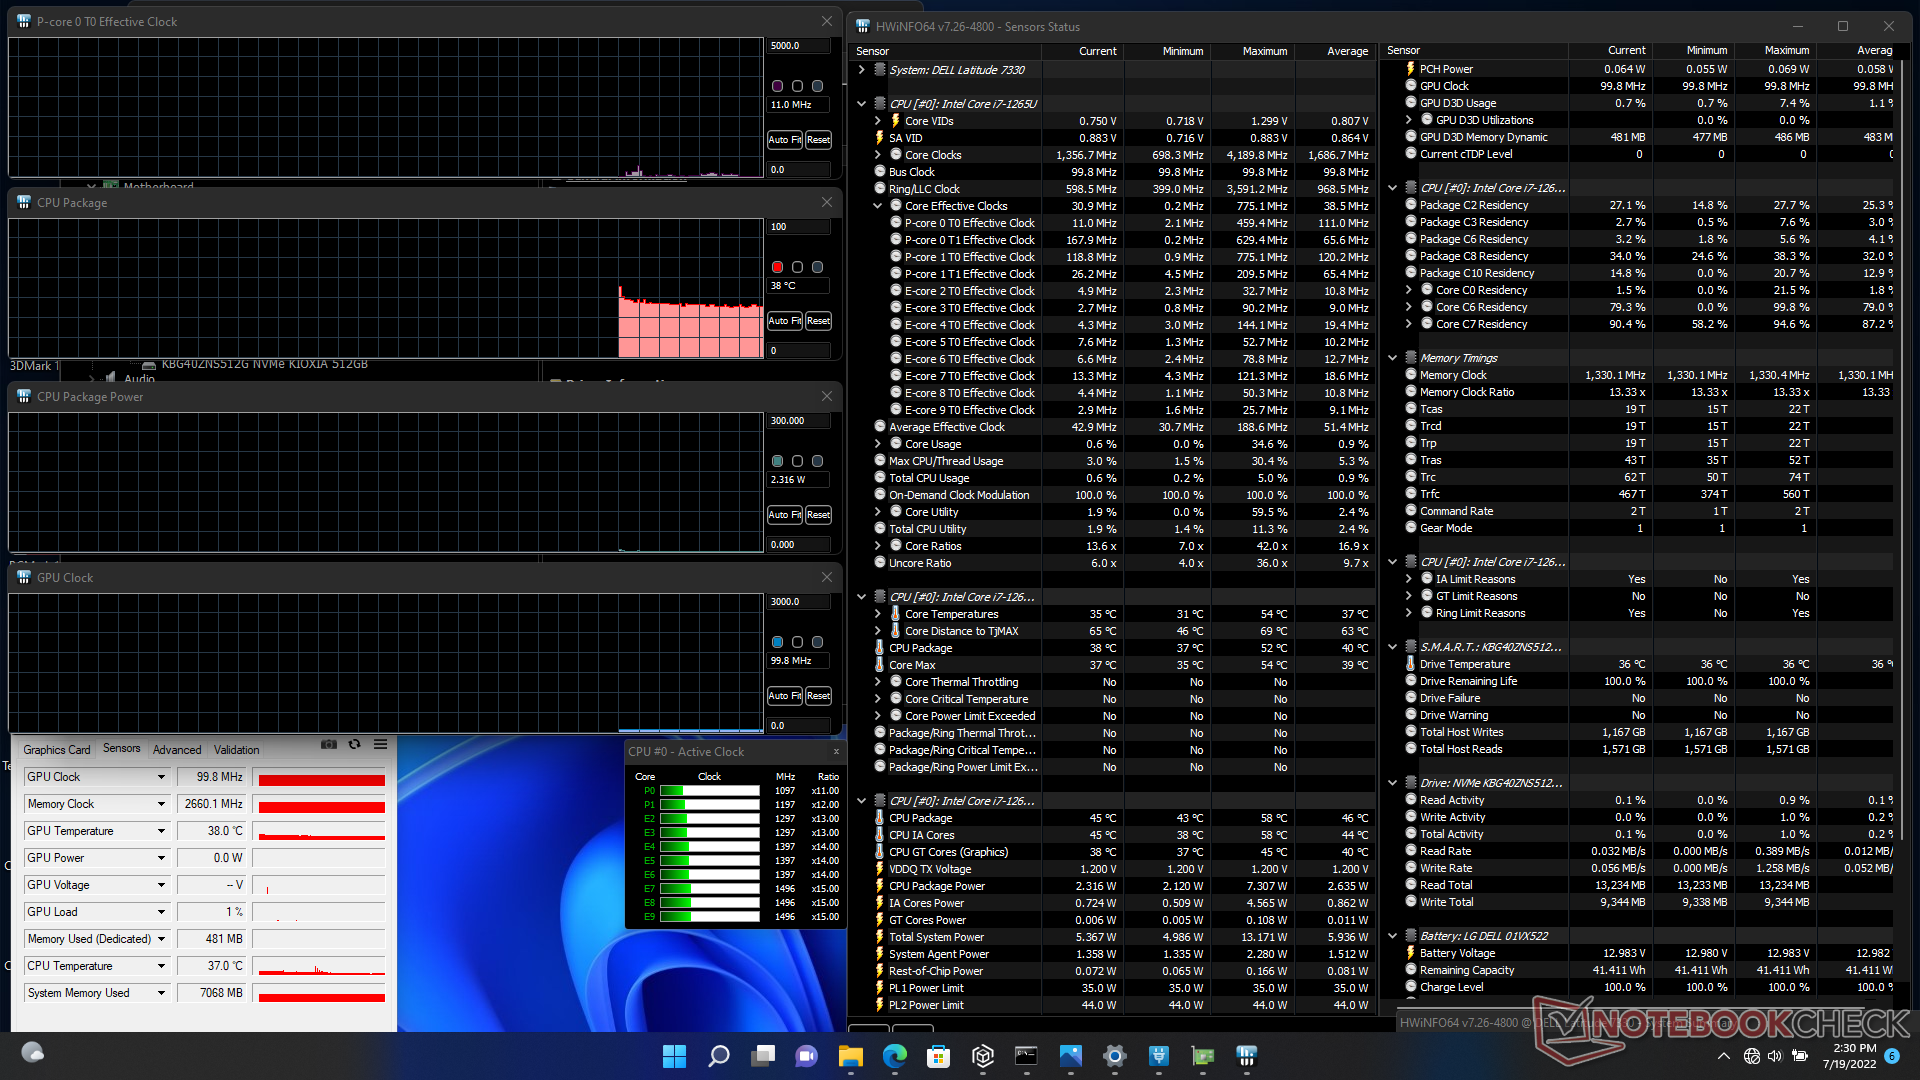
Test de stress
Lors de l'exécution de Prime95, la fréquence d'horloge du processeur augmente jusqu'à 3,8 GHz pendant les premières secondes, avec une consommation d'énergie et une température du cœur de 44 W et 97 C, respectivement. Après quelques secondes, cependant, les fréquences d'horloge ont commencé à baisser régulièrement avant de se stabiliser entre 2,1 et 2,5 GHz et entre 72 et 85 °C. La consommation d'énergie de la carte chuterait également entre 23 et 25 W, car les fréquences d'horloge élevées de Turbo Boost ne sont pas viables. Ces résultats sont en corrélation avec nos observations de la boucle CineBench R15 ci-dessus. En répétant ce test sur le Razer Book 13 se traduirait par une température centrale beaucoup plus froide de 60°C.
L'exécution de Witcher 3 pour représenter des charges élevées se traduirait par une fréquence d'horloge et une température stables du GPU de 1247 MHz et 83 C, respectivement, contre 1300 MHz et seulement 59 C sur le Razer susmentionné. Le processeur du Latitude doit fonctionner à une température plus élevée pour compenser la solution de refroidissement plus petite.
Le fonctionnement sur batterie limite les performances. Un test 3DMark 11 sur batterie donne des scores de physique et de graphisme de 8511 et 4764 points, respectivement, contre 13486 et 5840 points sur le secteur.
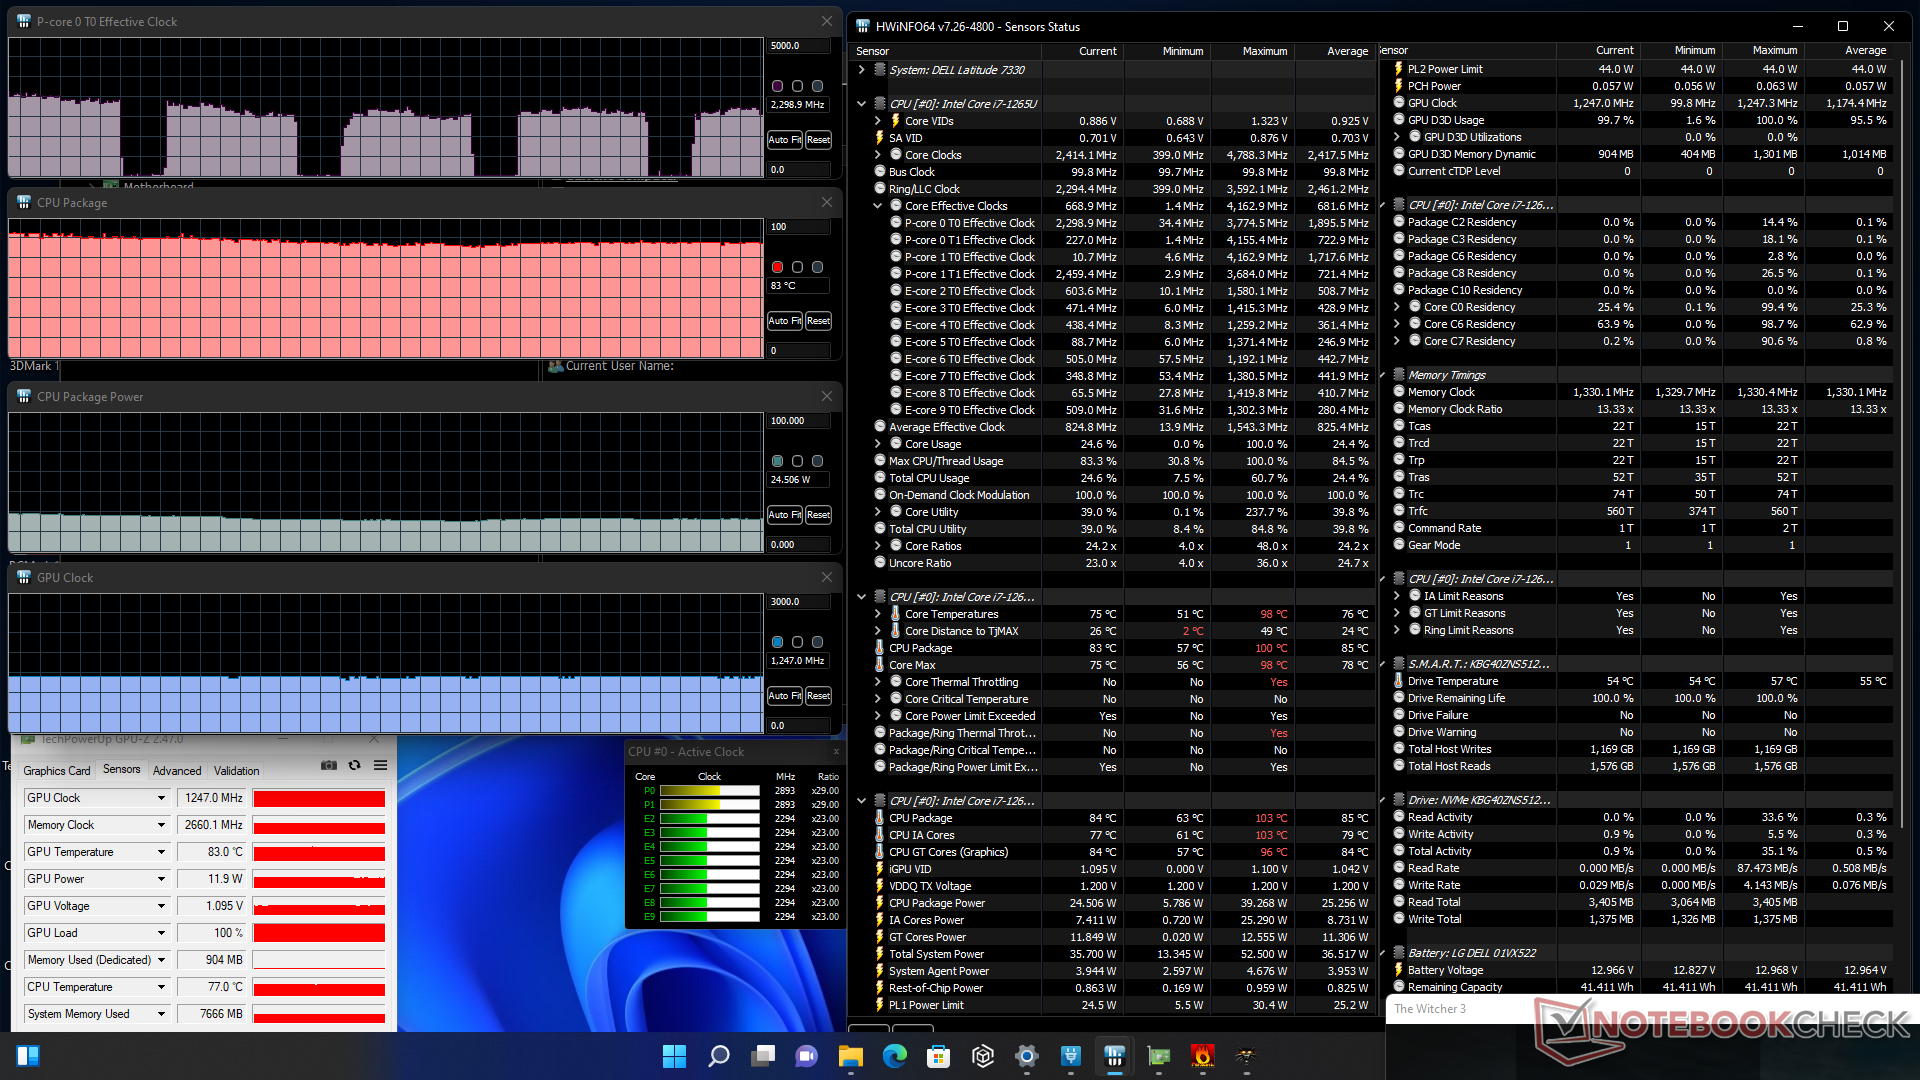
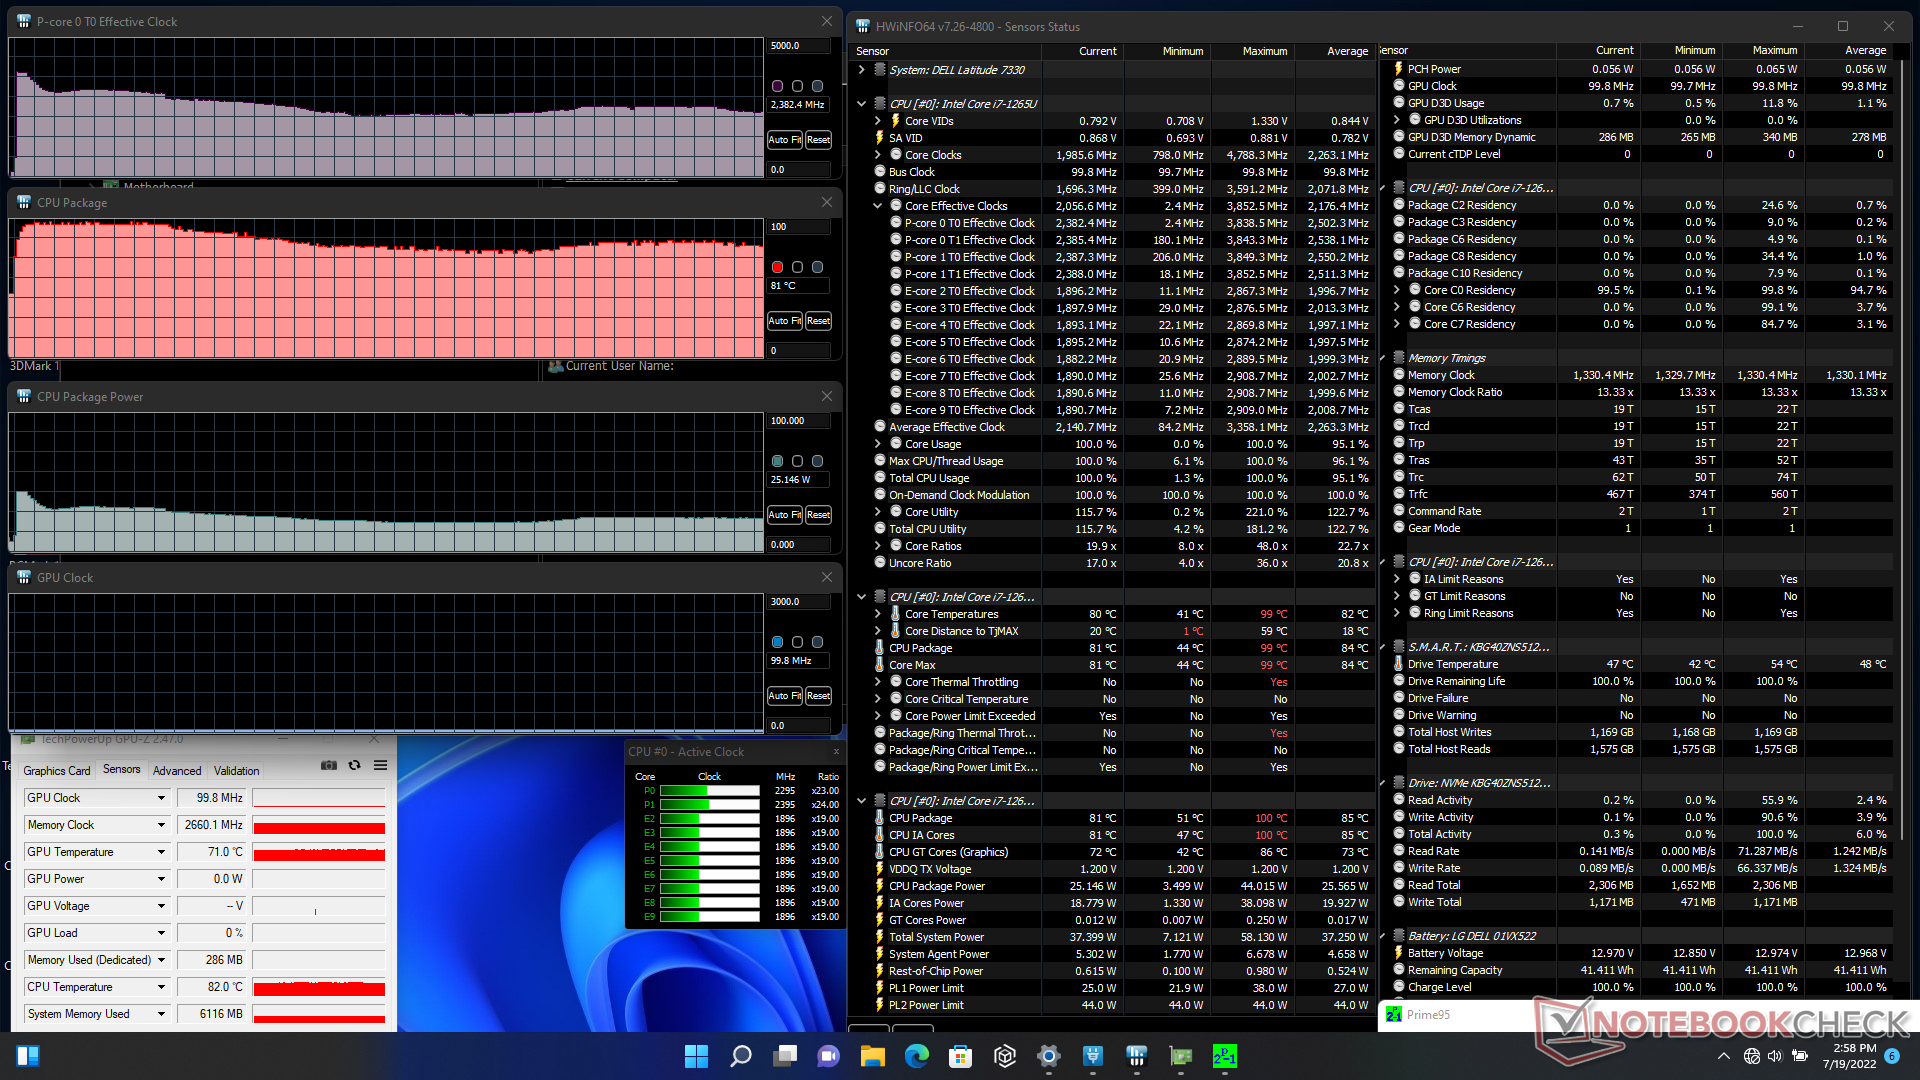
| Fréquence du CPU (GHz) | Fréquence du GPU (MHz) | Température moyenne du CPU (°C) | |
| Système au repos | -- | -- | 38 |
| Prime95 Stress | 2.1 - 2.5 | -- | 72 - 85 |
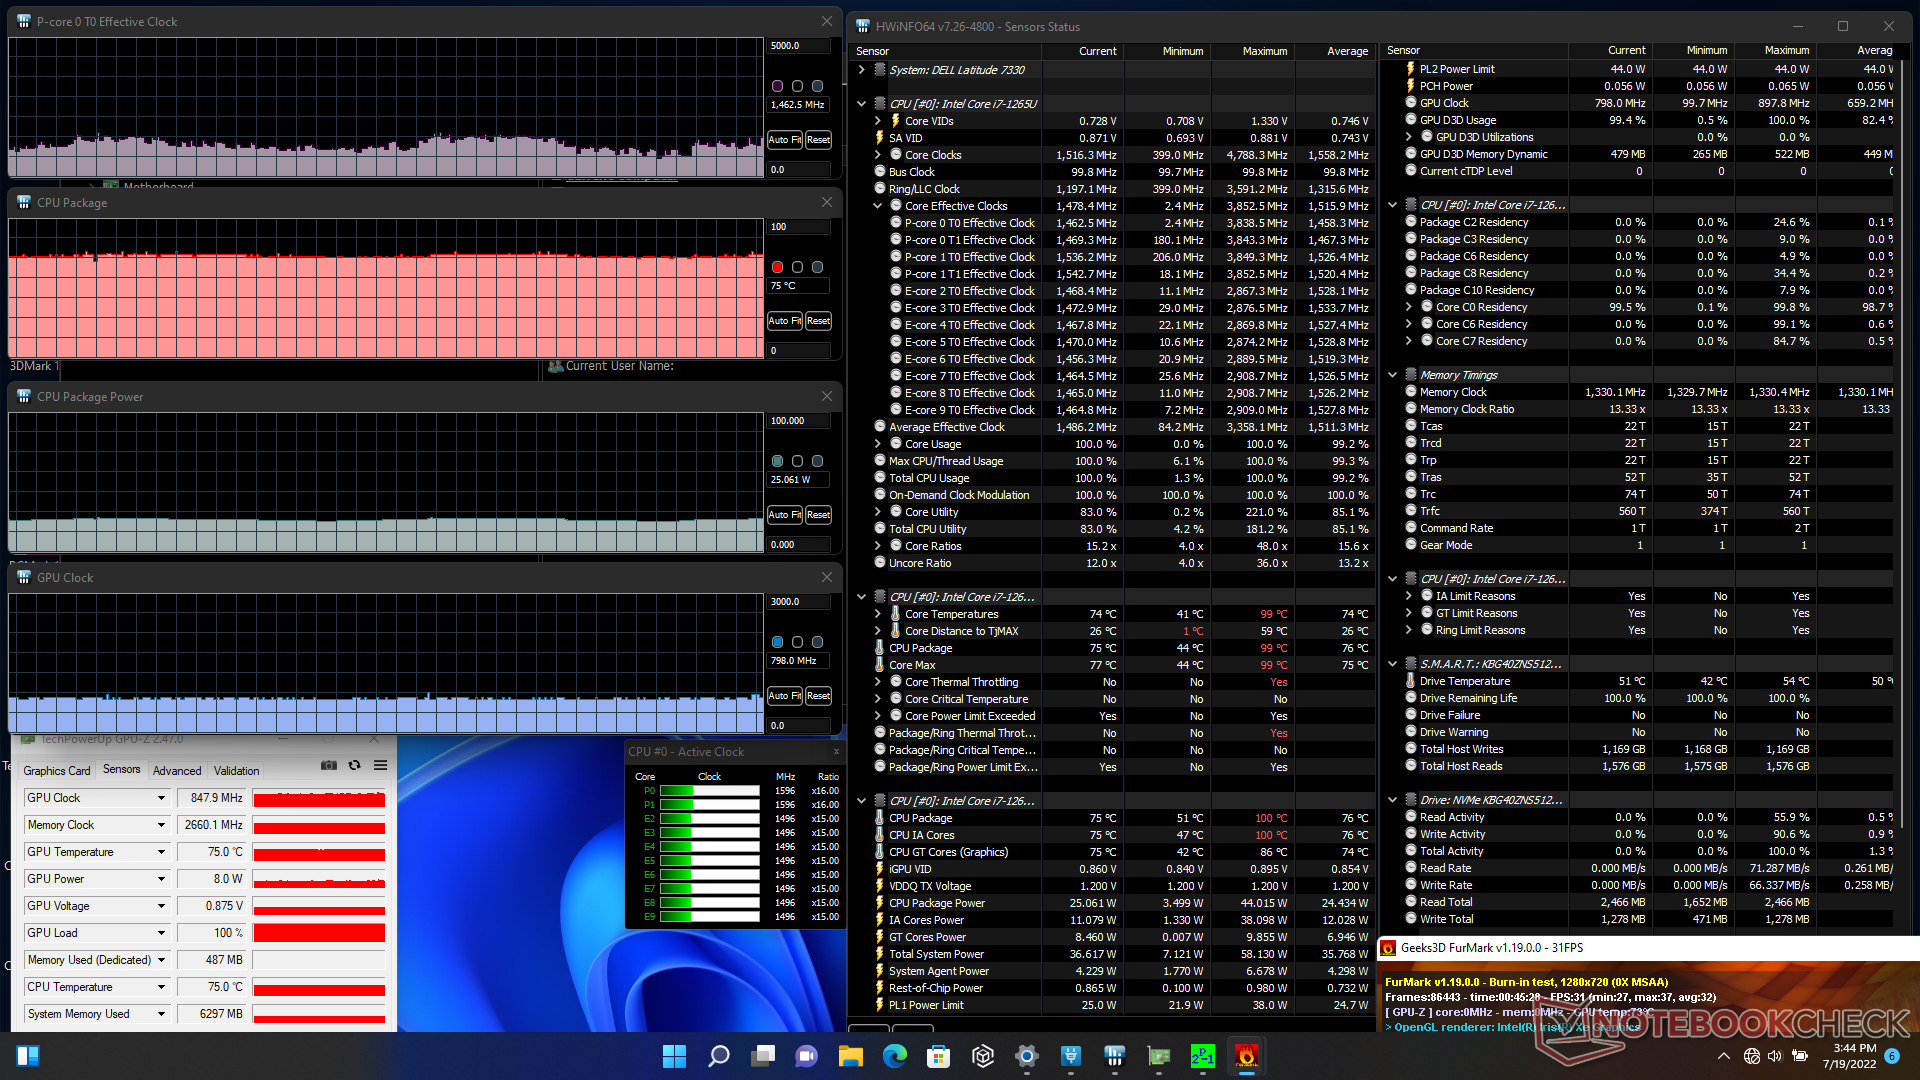
| Prime95 + FurMark Stress | ~1.4 | 848 | 75 |
| Witcher 3 Stress | ~2.3 | 1247 | 83 |
Haut-parleurs
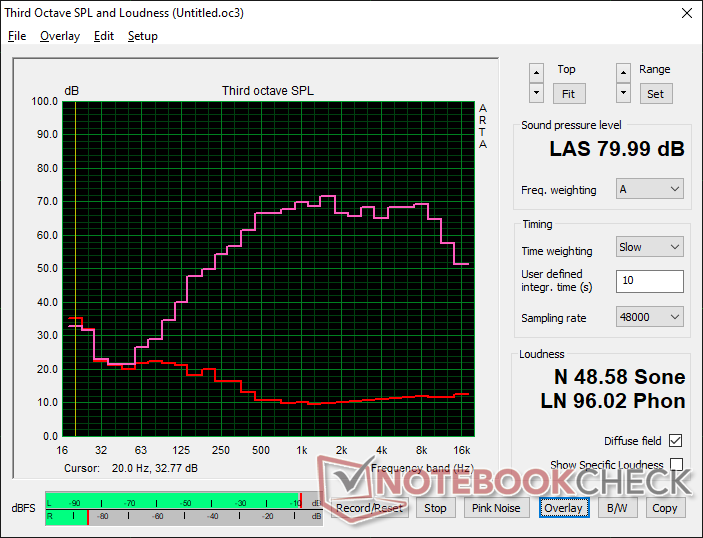
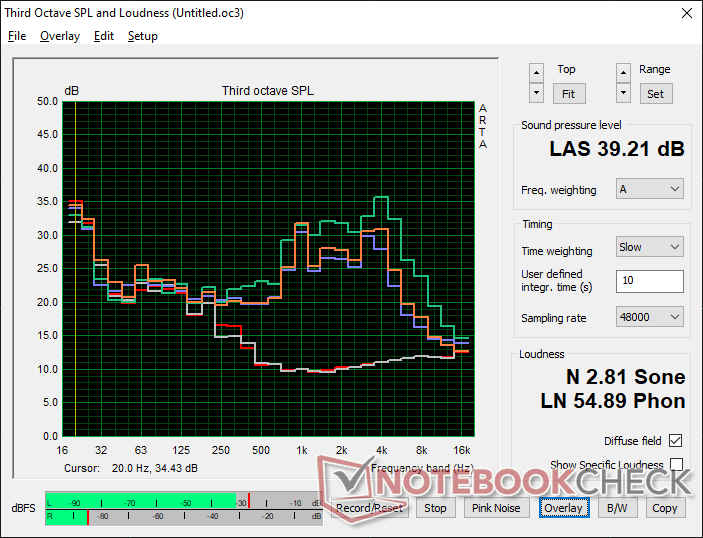
Dell Latitude 13 7330 analyse audio
(±) | le niveau sonore du haut-parleur est moyen mais bon (80# dB)
Basses 100 - 315 Hz
(-) | presque aucune basse - en moyenne 18.6% plus bas que la médiane
(±) | la linéarité des basses est moyenne (8.6% delta à la fréquence précédente)
Médiums 400 - 2000 Hz
(+) | médiane équilibrée - seulement 2.7% de la médiane
(+) | les médiums sont linéaires (5.1% delta à la fréquence précédente)
Aiguës 2 - 16 kHz
(+) | des sommets équilibrés - à seulement 1.9% de la médiane
(+) | les aigus sont linéaires (4.1% delta à la fréquence précédente)
Globalement 100 - 16 000 Hz
(+) | le son global est linéaire (14.8% différence à la médiane)
Par rapport à la même classe
» 13% de tous les appareils testés de cette catégorie étaient meilleurs, 4% similaires, 84% pires
» Le meilleur avait un delta de 7%, la moyenne était de 21%, le pire était de 53%.
Par rapport à tous les appareils testés
» 19% de tous les appareils testés étaient meilleurs, 4% similaires, 76% pires
» Le meilleur avait un delta de 4%, la moyenne était de 24%, le pire était de 134%.
Apple MacBook Pro 16 2021 M1 Pro analyse audio
(+) | les haut-parleurs peuvent jouer relativement fort (84.7# dB)
Basses 100 - 315 Hz
(+) | bonne basse - seulement 3.8% loin de la médiane
(+) | les basses sont linéaires (5.2% delta à la fréquence précédente)
Médiums 400 - 2000 Hz
(+) | médiane équilibrée - seulement 1.3% de la médiane
(+) | les médiums sont linéaires (2.1% delta à la fréquence précédente)
Aiguës 2 - 16 kHz
(+) | des sommets équilibrés - à seulement 1.9% de la médiane
(+) | les aigus sont linéaires (2.7% delta à la fréquence précédente)
Globalement 100 - 16 000 Hz
(+) | le son global est linéaire (4.6% différence à la médiane)
Par rapport à la même classe
» 0% de tous les appareils testés de cette catégorie étaient meilleurs, 0% similaires, 100% pires
» Le meilleur avait un delta de 5%, la moyenne était de 17%, le pire était de 45%.
Par rapport à tous les appareils testés
» 0% de tous les appareils testés étaient meilleurs, 0% similaires, 100% pires
» Le meilleur avait un delta de 4%, la moyenne était de 24%, le pire était de 134%.
Gestion de l'énergie
Consommation d'énergie - plus exigeante
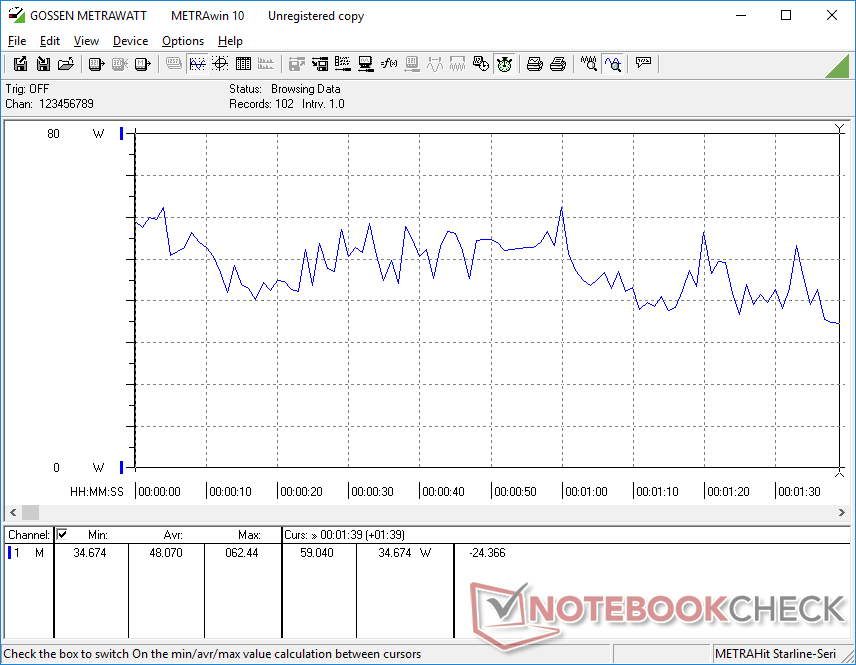
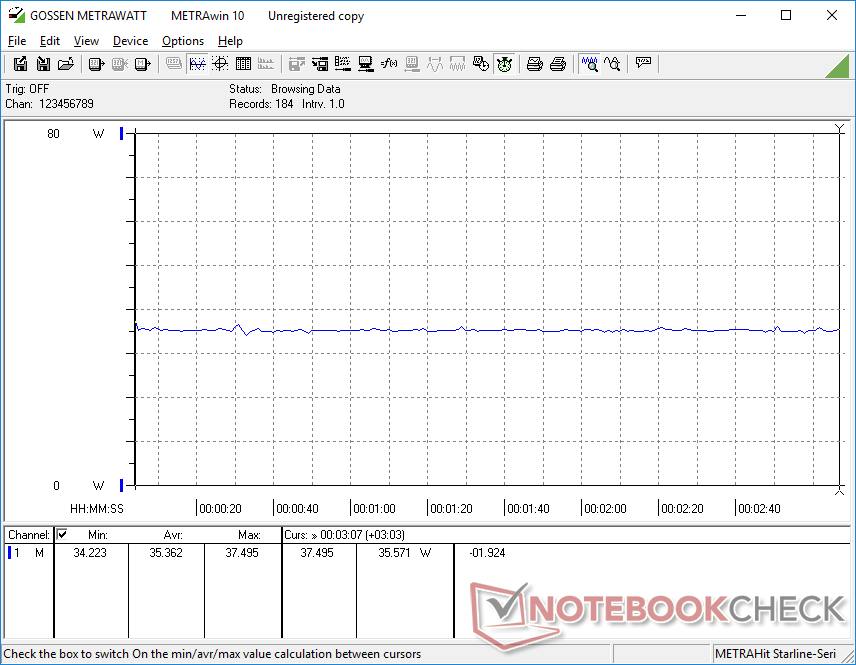
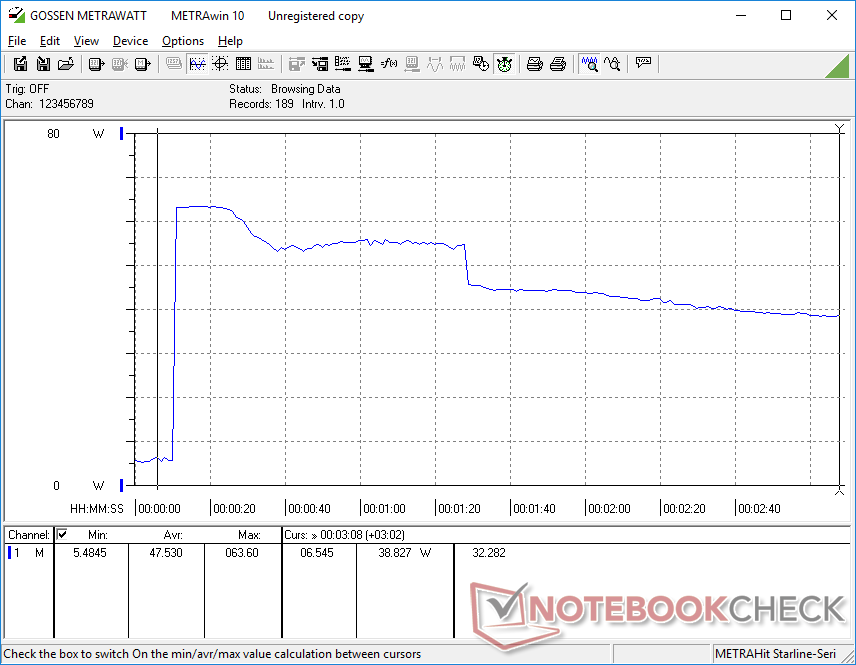
La consommation d'énergie est généralement plus élevée sur les ordinateurs portables fonctionnant avec du matériel de génération précédente, ce qui correspond à nos observations sur la plateforme Alder Lake dans son ensemble. L'exécution de 3DMark06 et Prime95, par exemple, consommerait respectivement 30 % et 21 % d'énergie en plus que sur le Core i7-1165G7 du Razer Book 13. Les performances sont peut-être plus élevées, mais le rendement par watt n'est pas aussi élevé que nous l'avions espéré.
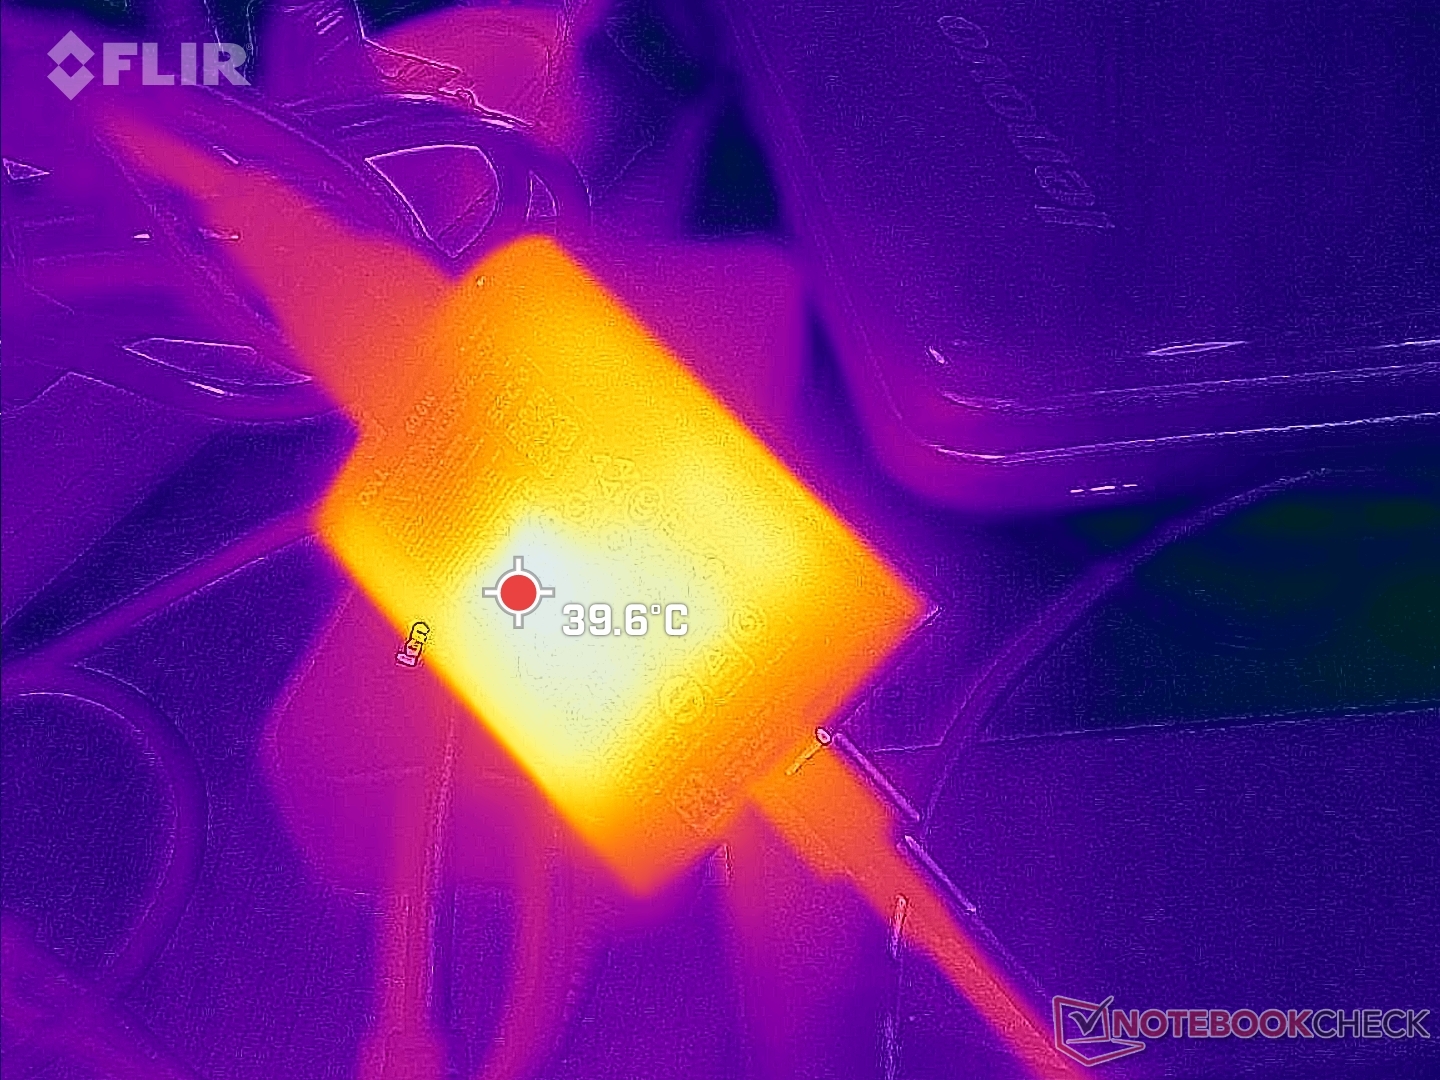
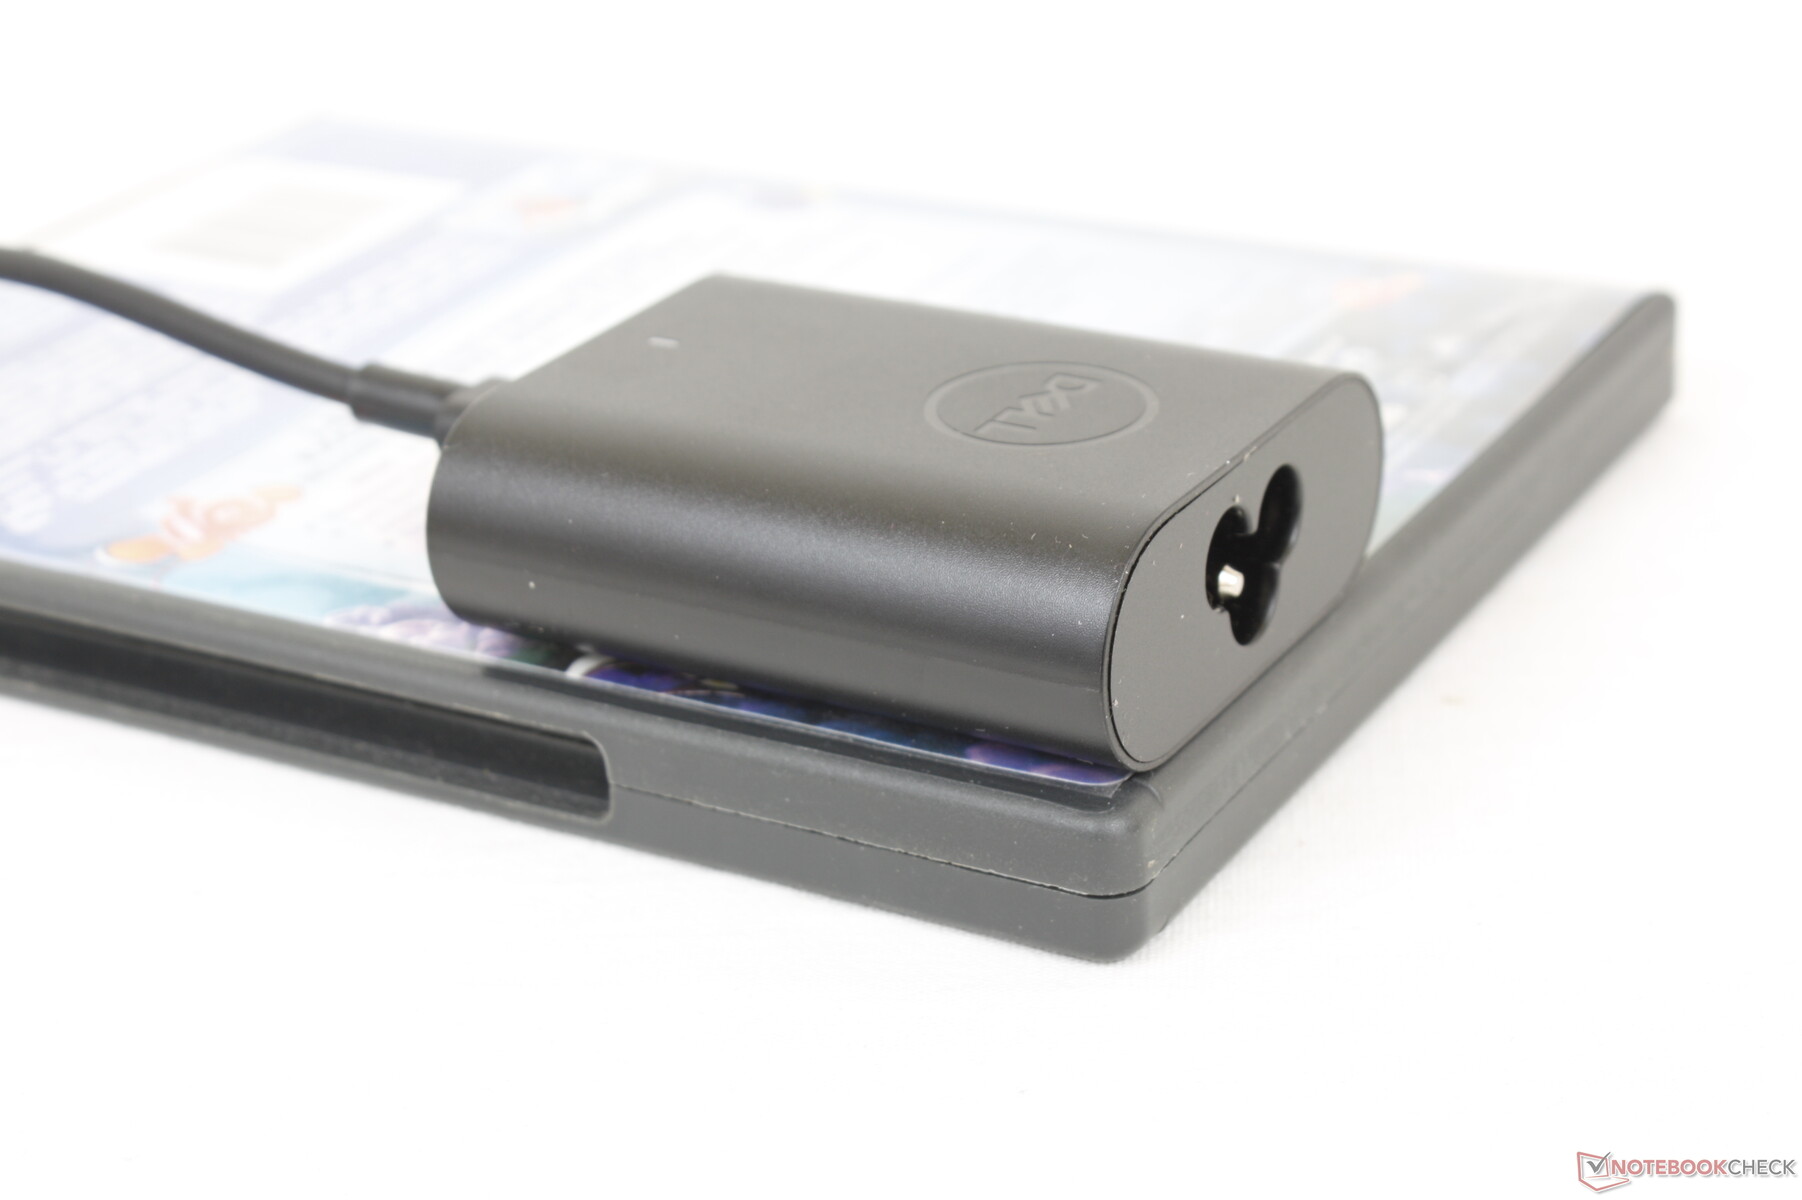
Nous sommes en mesure d'enregistrer un prélèvement maximal de 63,6 W sur le très petit (~6,6 x 5,5 x 2,2 cm) adaptateur secteur USB-C de 60 W. Ce taux n'est que temporaire comme le montre la capture d'écran ci-dessous en raison des limites thermiques de la solution de refroidissement du CPU. Le système se rechargera toujours à un rythme décent lorsqu'il est soumis à un stress de traitement important.
Des adaptateurs secteur plus grands de 65 W ou 90 W sont également des options en fonction de la configuration.

| Éteint/en veille | |
| Au repos | |
| Fortement sollicité |
|
Légende:
min: | |
| Dell Latitude 13 7330 i7-1265U, Iris Xe G7 96EUs, Toshiba KBG40ZNS512G NVMe, IPS, 1920x1080, 13.3" | Lenovo ThinkPad X13 Yoga 20SX0004GE i7-10510U, UHD Graphics 620, Samsung SSD PM981a MZVLB512HBJQ, IPS, 1920x1080, 13.3" | Framework Laptop 13.5 12th Gen Intel i7-1260P, Iris Xe G7 96EUs, WDC PC SN730 SDBPNTY-512G, IPS, 2256x1504, 13.5" | Razer Book 13 FHD i7-1165G7, Iris Xe G7 96EUs, Samsung SSD PM981a MZVLB256HBHQ, IPS, 1920x1200, 13.4" | Dell Latitude 7310 i7-10610U, UHD Graphics 620, Samsung SSD PM981a MZVLB512HBJQ, IPS, 1920x1080, 13.3" | Microsoft Surface Laptop 4 13 Ryzen 5 R5 4680U, Vega 7, Samsung PM991 MZ9LQ256HBJQ, IPS, 2256x1504, 13.5" | |
|---|---|---|---|---|---|---|
| Power Consumption | -3% | -44% | -2% | 13% | -8% | |
| Idle Minimum * (Watt) | 2.8 | 3.4 -21% | 5.3 -89% | 3.3 -18% | 2.7 4% | 3.4 -21% |
| Idle Average * (Watt) | 4.8 | 4.98 -4% | 8.4 -75% | 6.4 -33% | 4.4 8% | 6.3 -31% |
| Idle Maximum * (Watt) | 7.3 | 8.1 -11% | 11.2 -53% | 7 4% | 4.8 34% | 8.1 -11% |
| Load Average * (Watt) | 48.1 | 37.2 23% | 57.4 -19% | 37.3 22% | 33.4 31% | 36.2 25% |
| Witcher 3 ultra * (Watt) | 35.4 | 46.7 -32% | 36.4 -3% | |||
| Load Maximum * (Watt) | 63.6 | 63.3 -0% | 61.2 4% | 53.7 16% | 69.7 -10% | 64.1 -1% |
* ... Moindre est la valeur, meilleures sont les performances
Power Consumption Witcher 3 / Stresstest
Power Consumption external Monitor
Autonomie de la batterie
Les utilisateurs ont la possibilité de configurer soit une batterie plus légère de 41 Wh, soit une batterie plus lourde mais plus durable de 58 Wh. Nous avons pu tirer un peu plus de 8 heures d'utilisation du réseau local sans fil dans le monde réel de notre unité de test de 41 Wh, ce qui devrait être plus que suffisant pour la plupart des utilisateurs.
Le chargement de la batterie vide à pleine capacité avec l'adaptateur secteur USB-C inclus prend entre 2 et 2,5 heures.
| Dell Latitude 13 7330 i7-1265U, Iris Xe G7 96EUs, 41 Wh | Lenovo ThinkPad X13 Yoga 20SX0004GE i7-10510U, UHD Graphics 620, 50 Wh | Framework Laptop 13.5 12th Gen Intel i7-1260P, Iris Xe G7 96EUs, 55 Wh | Razer Book 13 FHD i7-1165G7, Iris Xe G7 96EUs, 55 Wh | Dell Latitude 7310 i7-10610U, UHD Graphics 620, 52 Wh | Microsoft Surface Laptop 4 13 Ryzen 5 R5 4680U, Vega 7, 47.4 Wh | |
|---|---|---|---|---|---|---|
| Autonomie de la batterie | 53% | -10% | 65% | 51% | 31% | |
| Reader / Idle (h) | 21.9 | 36.8 68% | 37.4 71% | |||
| WiFi v1.3 (h) | 8.3 | 8.2 -1% | 7.5 -10% | 14.8 78% | 12.6 52% | 10.9 31% |
| Load (h) | 1.4 | 2.9 107% | 2.1 50% | 1.8 29% |
Points positifs
Points négatifs
Verdict - Options, Options, Options
Le haut niveau de configurations permet de différencier le Latitude 7330 des autres subnotebooks professionnels. Des caractéristiques telles que le lecteur MicroSD, la connectivité 4G LTE, la webcam 1080p, le facteur de forme 2-en-1, la fibre de carbone, la taille de la batterie et même l'adaptateur secteur sont toutes optionnelles en fonction des besoins de l'acheteur. Si vos charges de travail quotidiennes ne nécessitent pas certaines fonctionnalités, alors elles peuvent simplement être omises à la caisse pour un poids global plus léger. D'autres ordinateurs portables ultralégers comme le LG Gram 13 ou la série Toshiba X30 ont beaucoup moins d'options configurables, notamment en raison de leur échelle de production plus petite que celle de la série Dell Latitude.
La série Latitude 7330 fait la part belle aux options configurables et aux personnalisations pour mieux répondre aux besoins spécifiques de l'utilisateur. Son format 16:9 commence toutefois à montrer son âge.
Les alternatives les plus proches du Latitude 7330 sont les suivantes HP EliteBook 830 G8 et G9, qui offrent des caractéristiques telles qu'un format d'image 16:10 plus grand, une webcam de 5 mégapixels plus nette, des modules de mémoire vive amovibles et des options d'écran 1000 nits nettement plus lumineux, toutes ces caractéristiques n'étant pas disponibles sur le Latitude 7330. Ils sont cependant légèrement plus lourds que notre Dell, mais ses attributs plus forts peuvent valoir cette augmentation de poids pour certains utilisateurs.
Prix et disponibilité
Le site Latitude 7330 n'est pas encore largement disponible sur Amazon ou Best Buy. L'achat de directement auprès de Dell où les prix tournent actuellement autour de 2 000 USD.
Dell Latitude 13 7330
- 07/22/2022 v7 (old)
Allen Ngo
Price comparison

