Verdict - Le XMG Apex 17 en vaut-il la peine ?
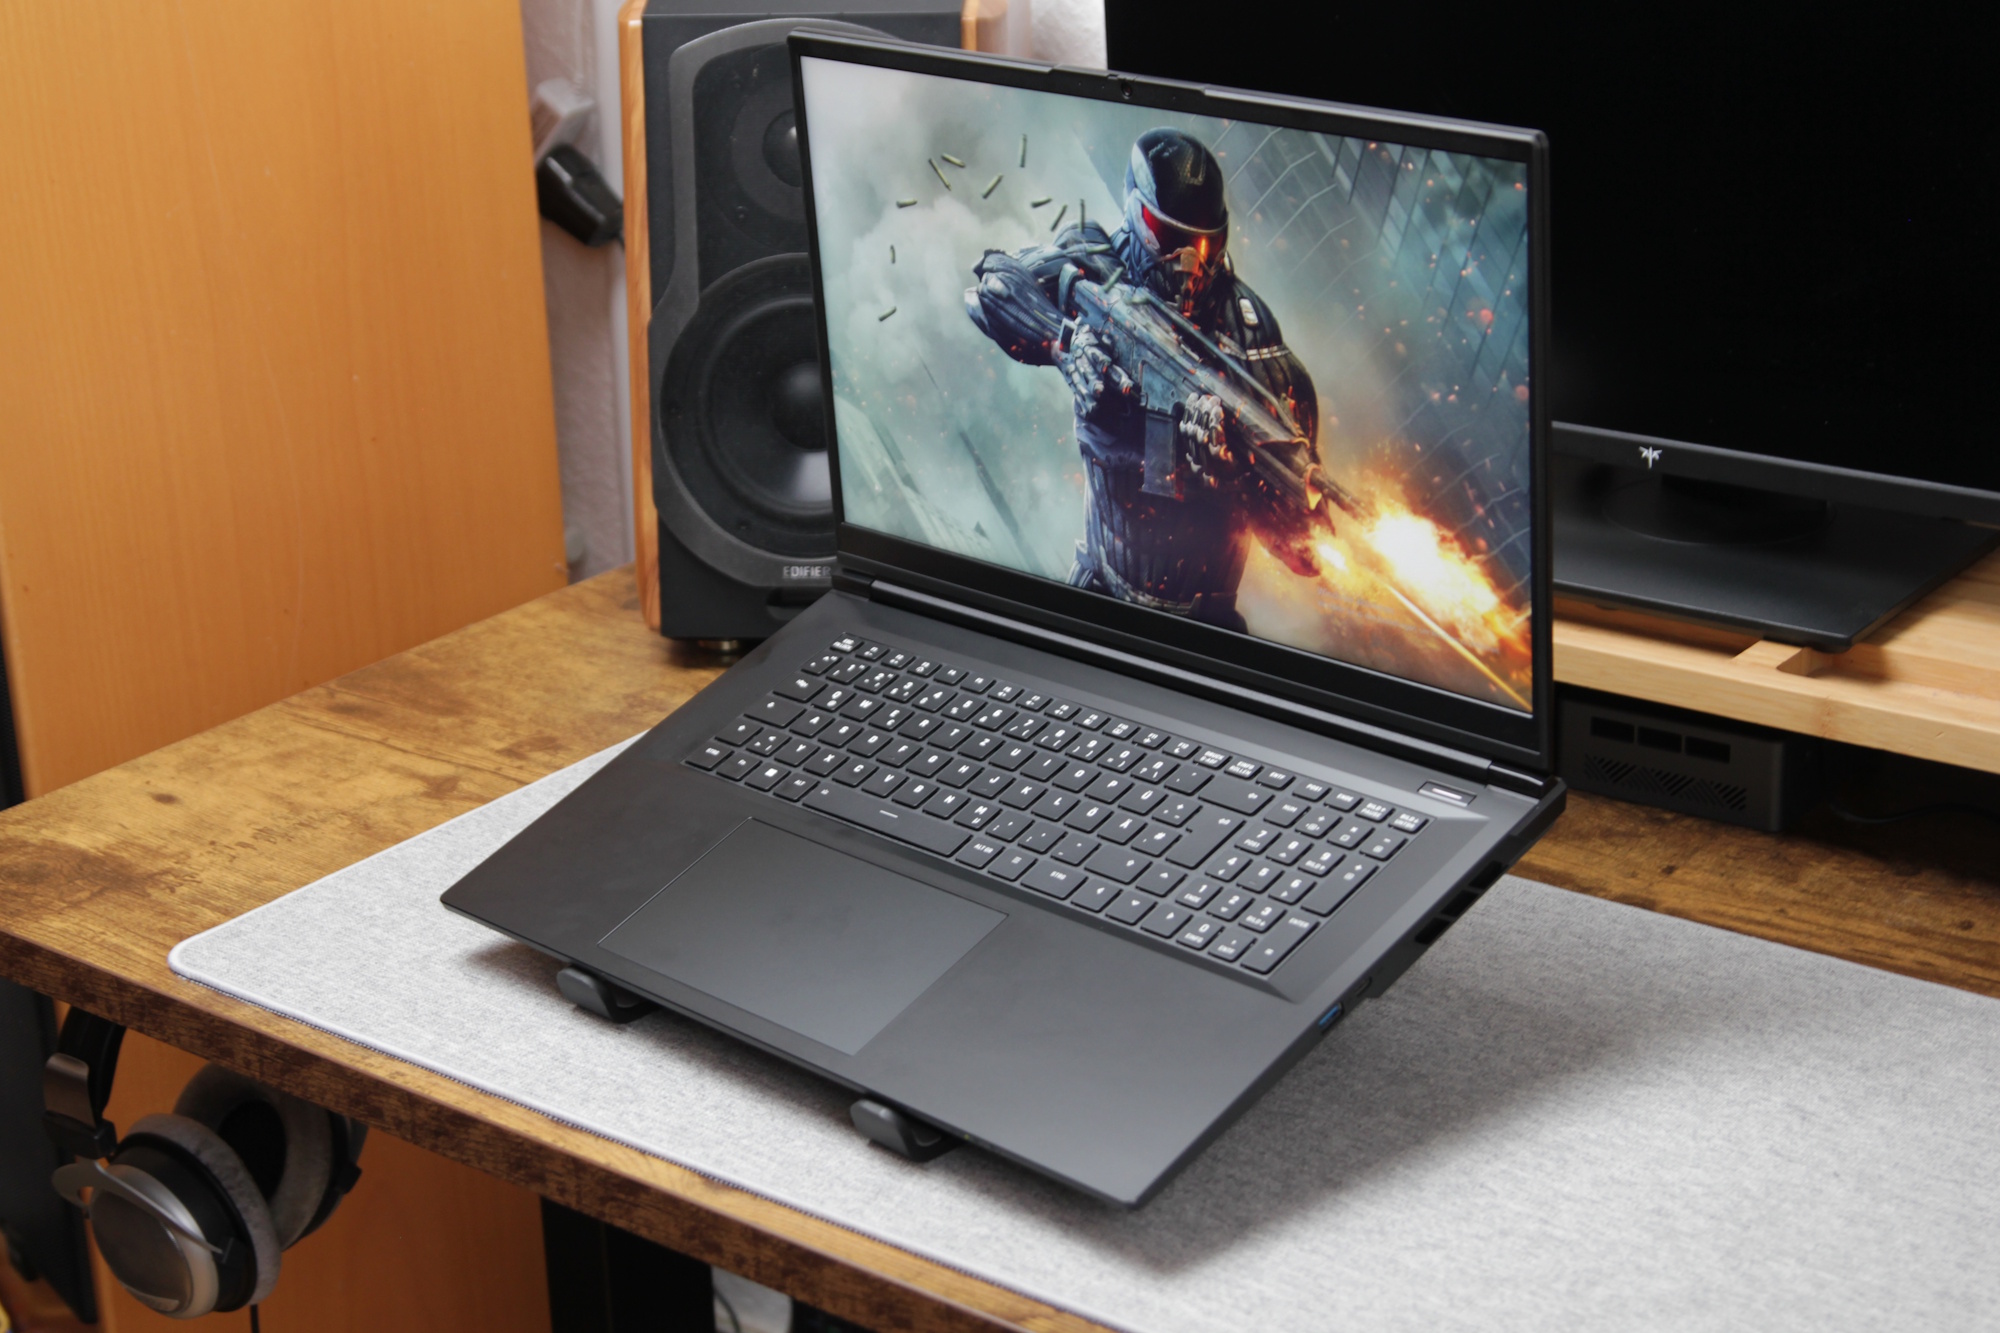
Avec l'Apex 17, Schenker/XMG offre une fois de plus des performances illimitées dans un châssis propre et discret. La combinaison d'une Ryzen 9 9955HX très rapide, d'une RTX 5060 déchaînée, d'un solide écran 1440p, d'un Wi-Fi rapide et d'un SSD rapide constitue un ensemble convaincant.
L'Apex 17 est destiné aux joueurs qui veulent le portable RTX 5060 le plus rapide possible à un prix raisonnable. Même en mode Divertissement, nettement plus silencieux, les performances ne sont pas en reste par rapport à la concurrence.
L'inconvénient de ces performances élevées est un niveau de bruit et une consommation d'énergie tout aussi élevés en mode Performance. La sélection des ports pourrait également être plus moderne.
Points positifs
Points négatifs
Prix et disponibilité
Le prix commence à 1 899 € via bestware (environ 2 251 $). Notre configuration de test, équipée du plus gros SSD, est proposée à 2 084 euros.
Table des matières
- Verdict - Le XMG Apex 17 en vaut-il la peine ?
- Spécifications - Ryzen 9 9955HX & RTX 5060
- Châssis et connectivité - Un design épuré de 17 pouces avec quelques limitations de ports
- Dispositifs de saisie - Faible course des touches, grand pavé tactile de 15 cm
- Affichage - Quelle est la qualité de l'écran QHD 240 Hz ?
- Performance - Quelle est la vitesse réelle de l'Apex 17 ?
- Émissions et puissance - Quel est le niveau sonore de l'Apex 17 lorsqu'il est soumis à une charge de jeu ?
- Comparaison des alternatives possibles
Nous avons récemment examiné le Apex 16 Maxqui offre des performances de jeu optimales et un écran Mini-LED. Mais à 2 800 euros, il n'est pas à la portée de tout le monde. C'est pourquoi nous nous intéressons de plus près à l'Apex 17, proposé à 1 899 euros. Offre-t-il un niveau de performance et d'expérience similaire pour un prix nettement inférieur ? Nous allons le découvrir.
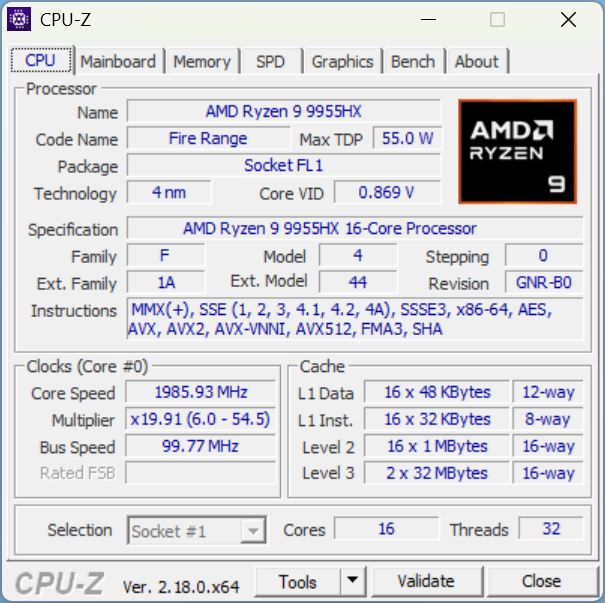
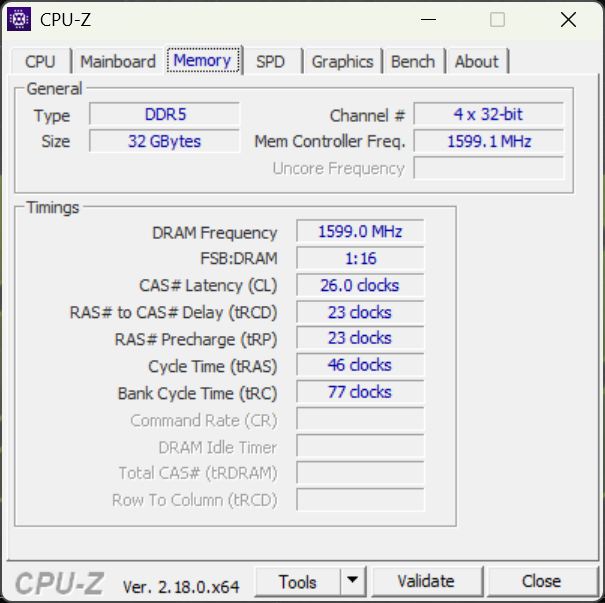
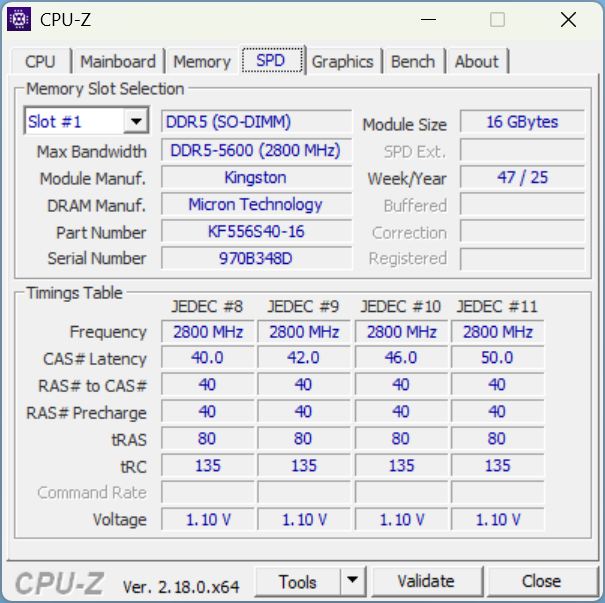
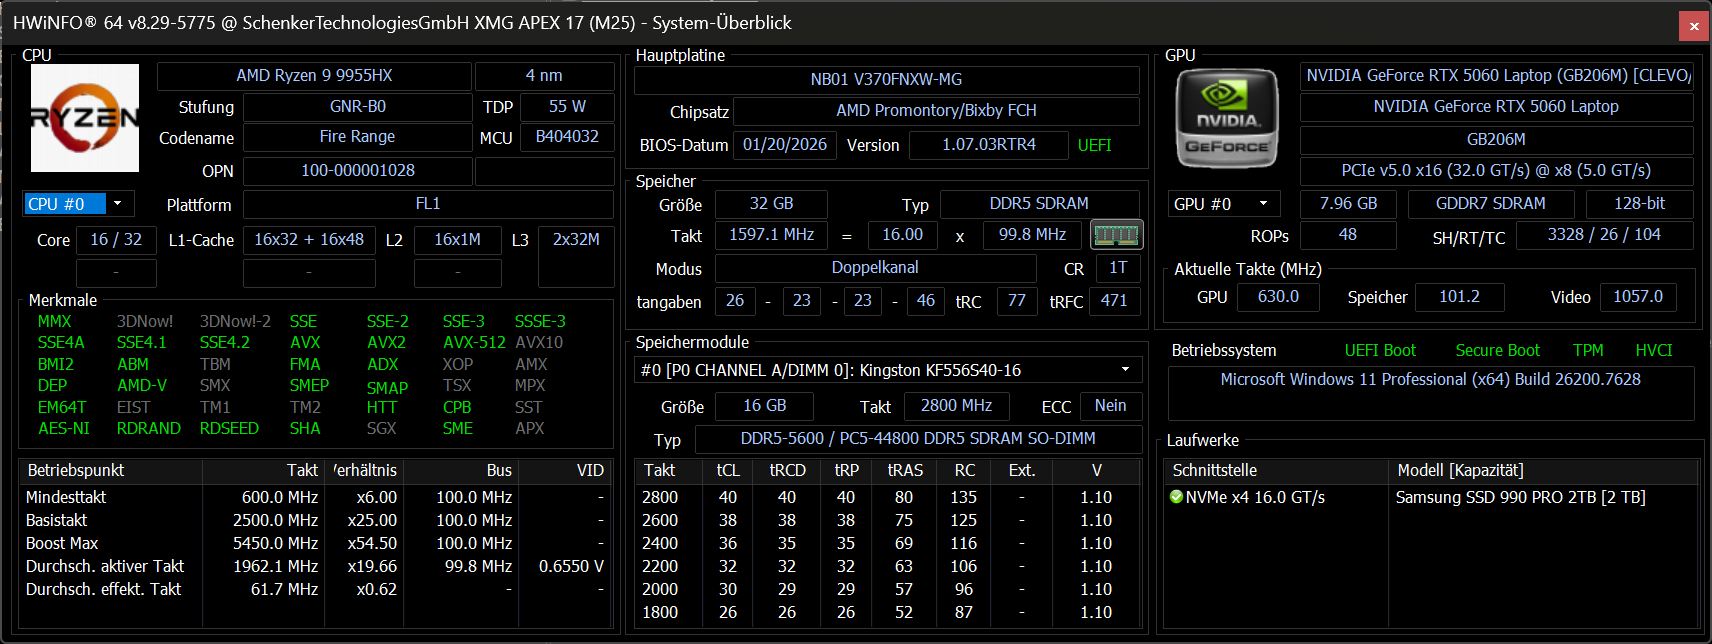
Spécifications - Ryzen 9 9955HX & RTX 5060
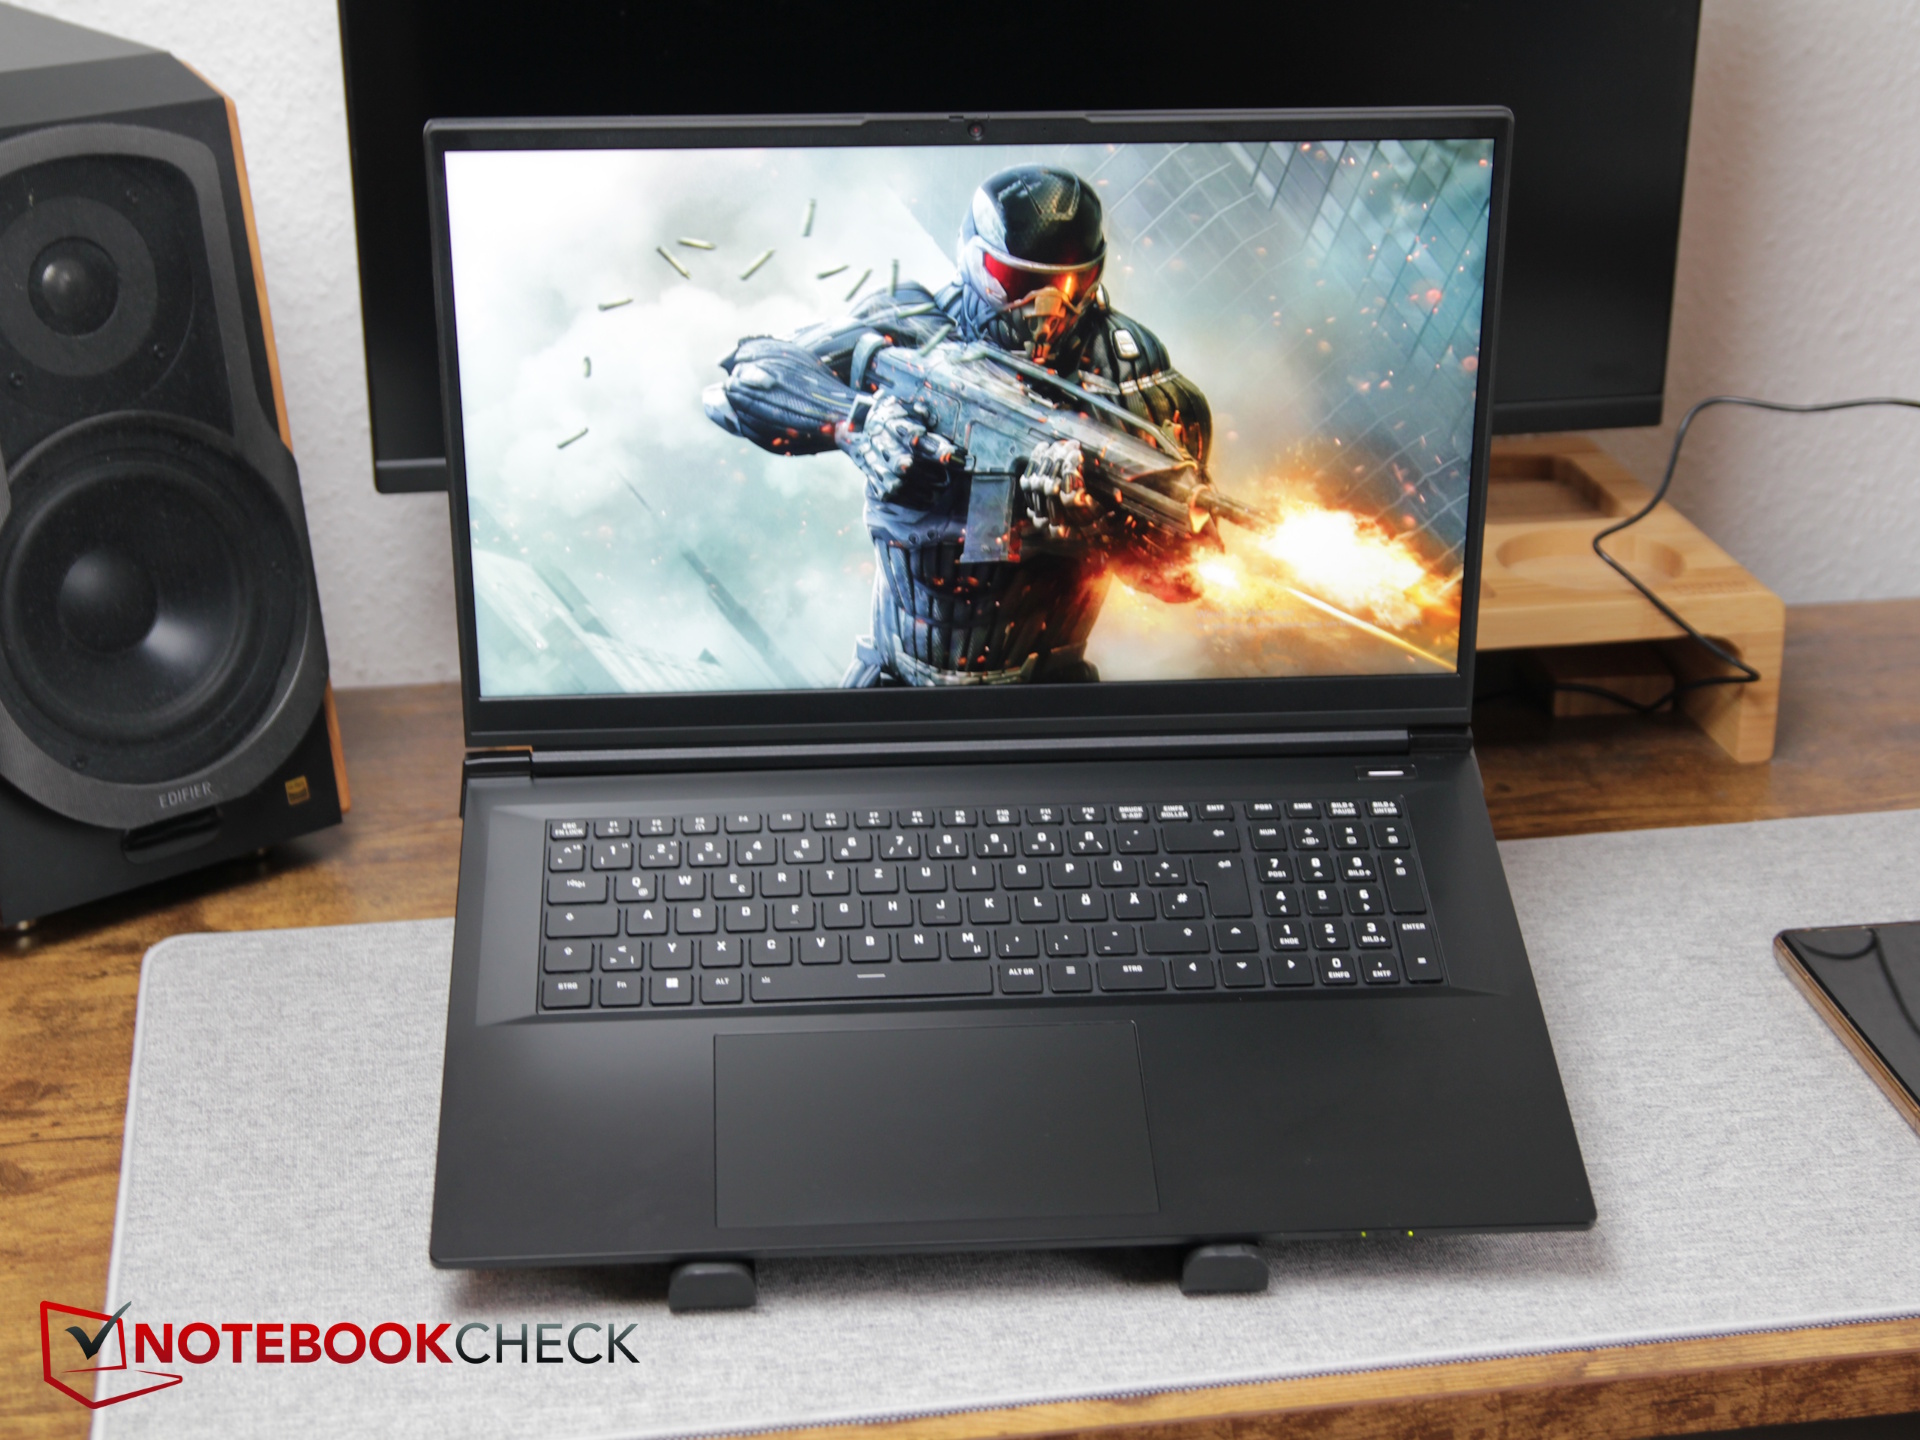
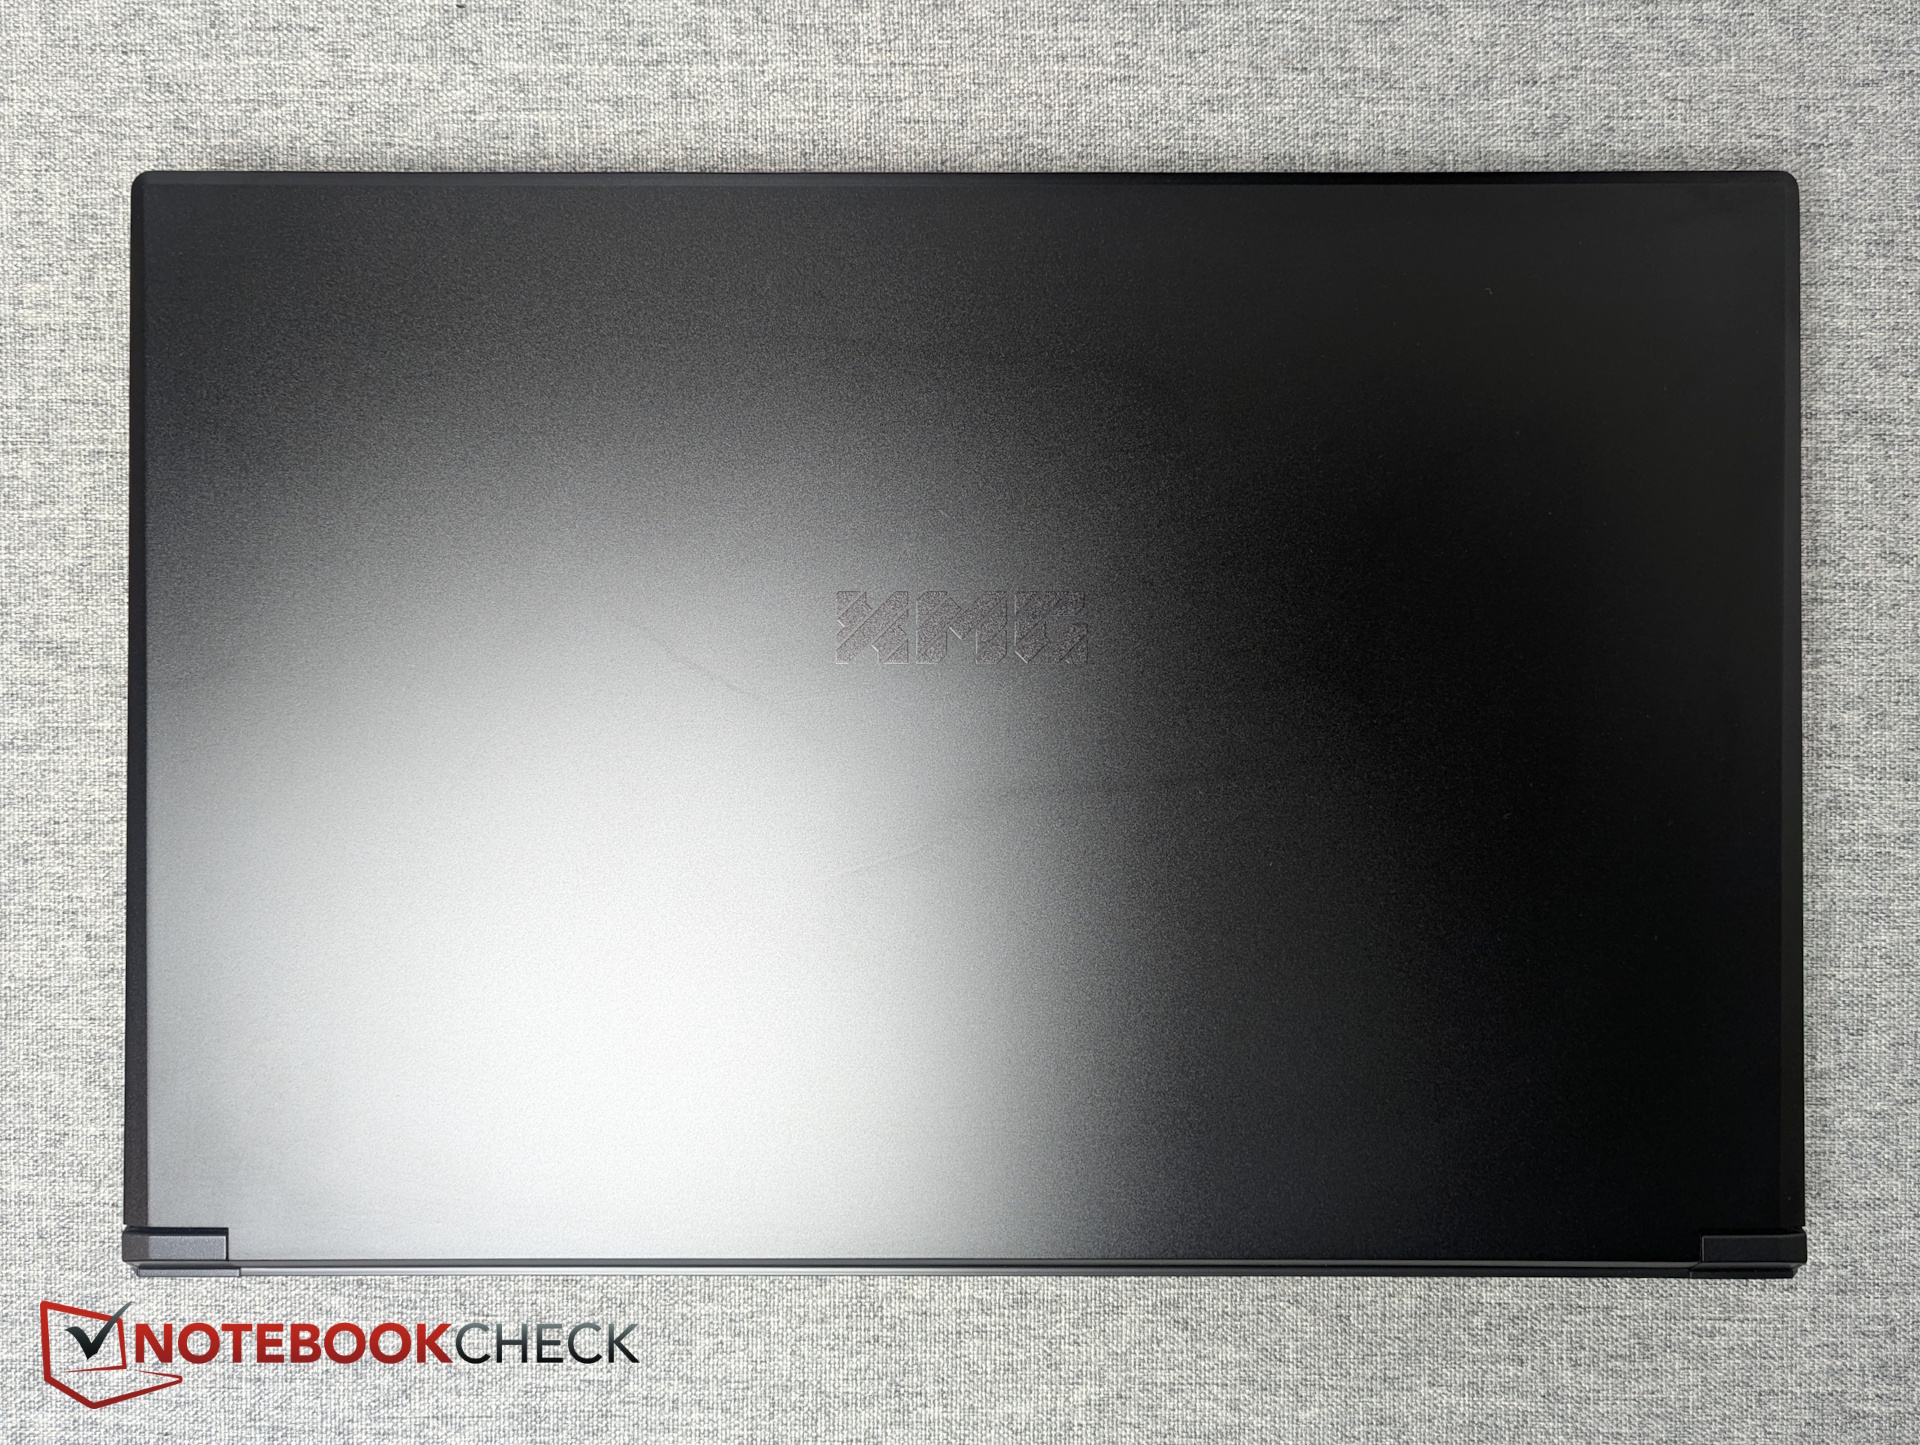
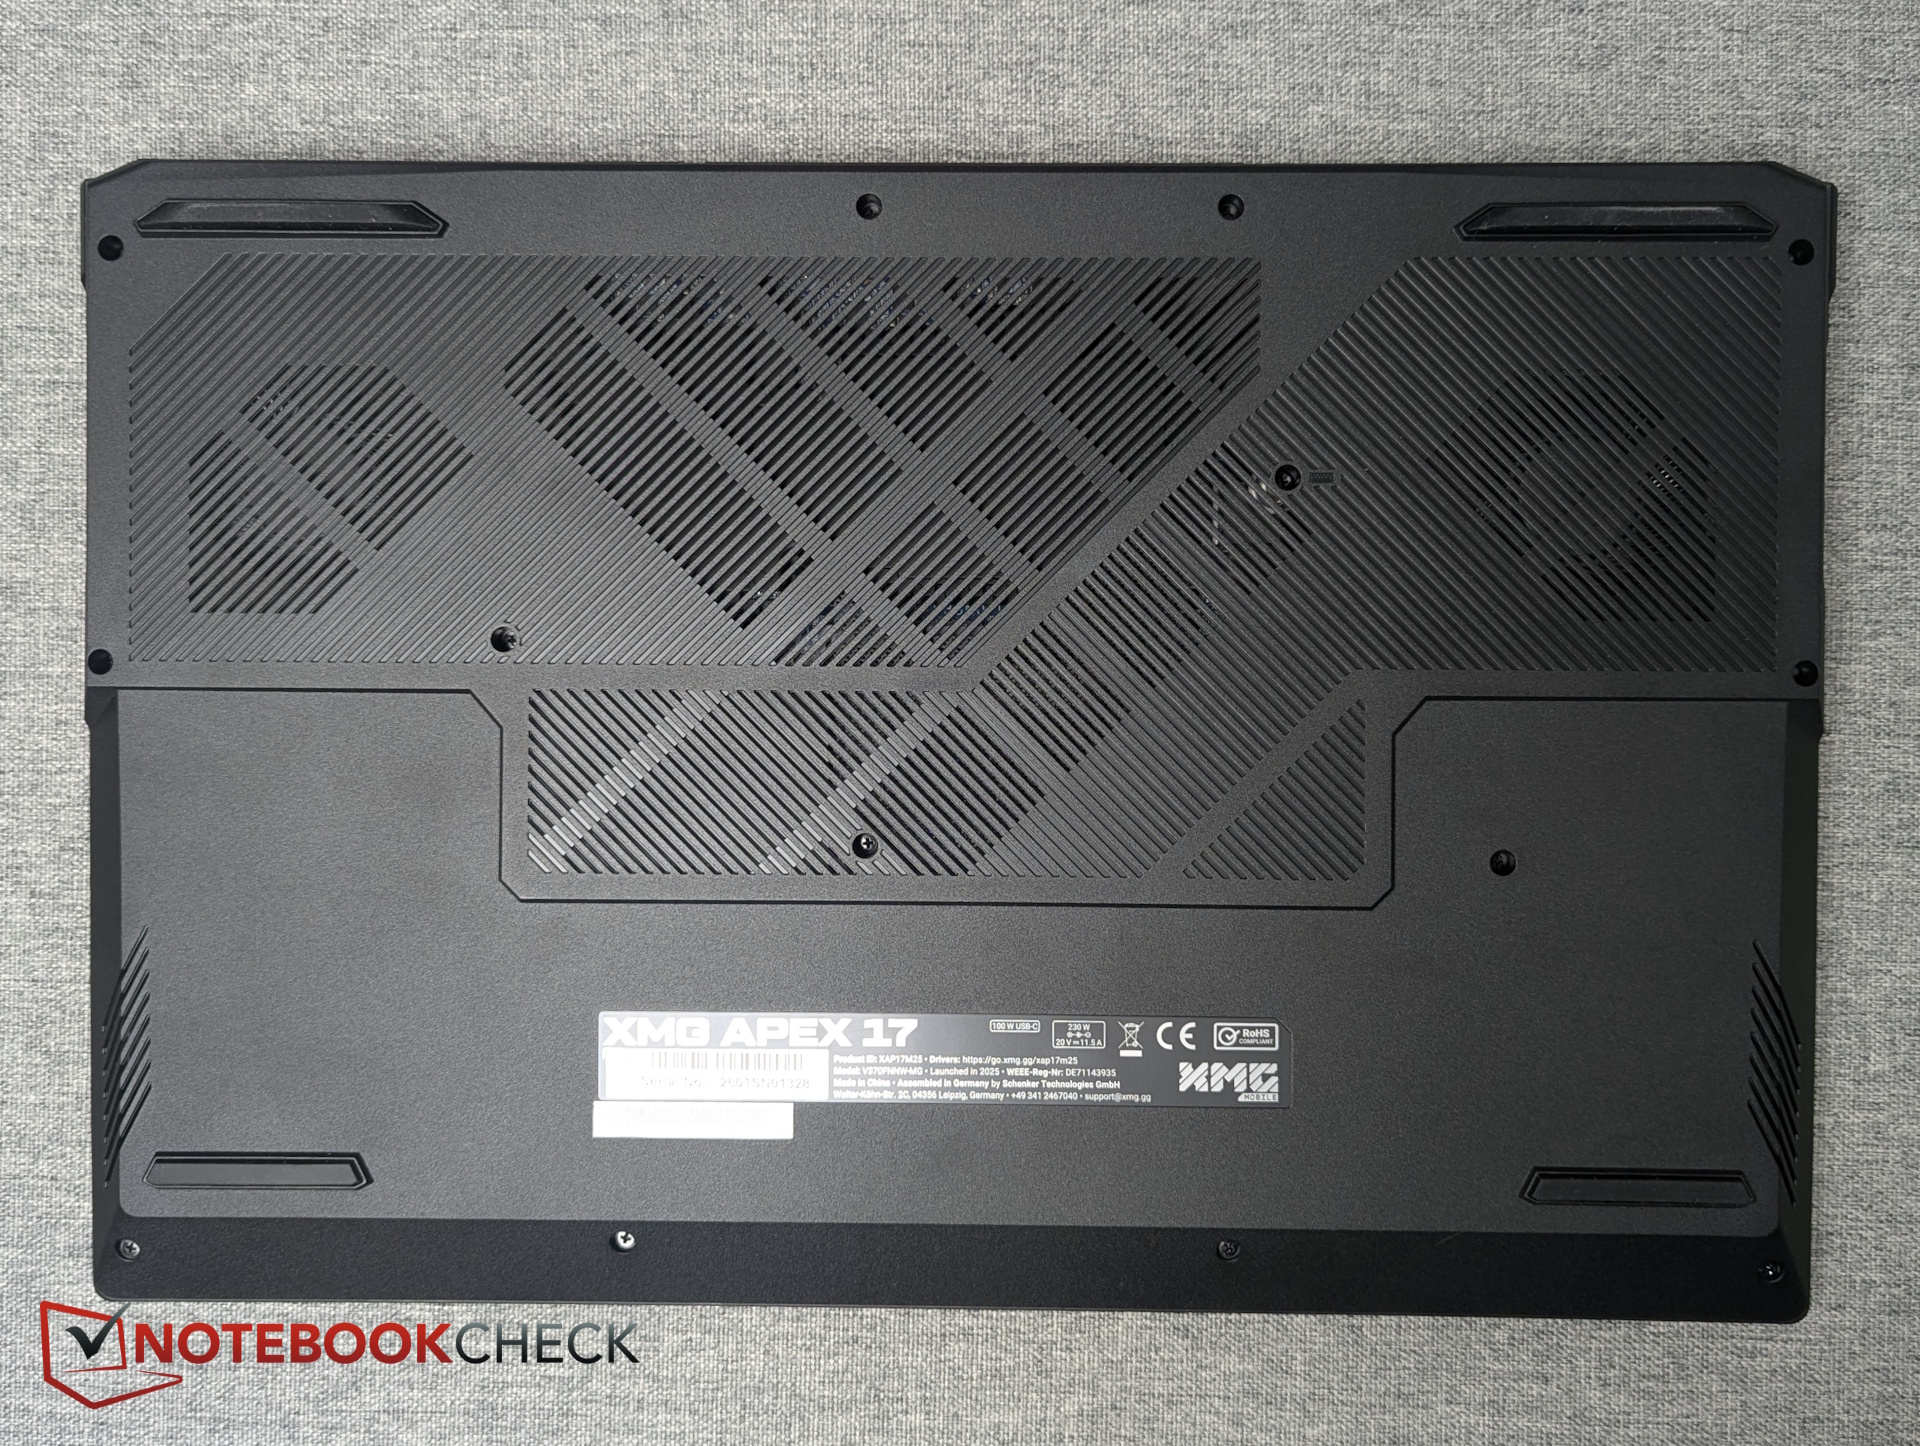
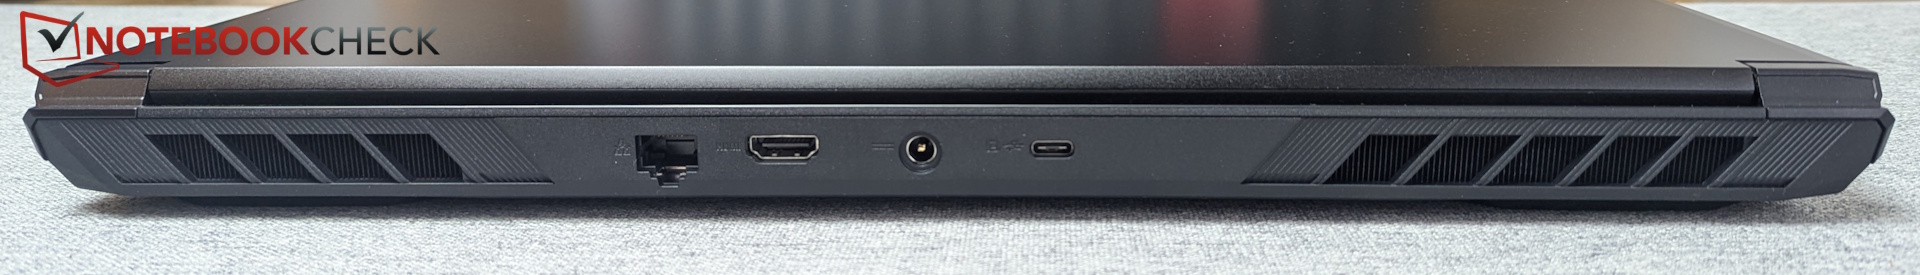
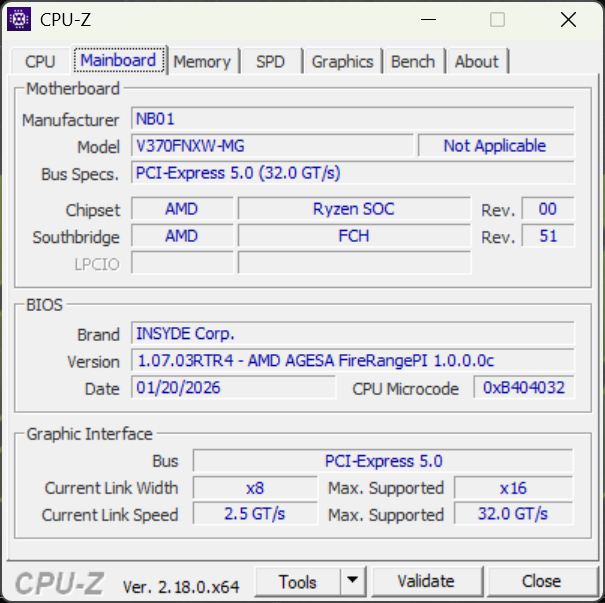
Châssis et connectivité - Un design épuré de 17 pouces avec quelques limitations de ports
Visuellement, le châssis noir, robuste et sobre, est plus proche du Focus 17 M25 que de l'Apex 16 Max. Le couvercle est en métal (et donc sujet aux traces de doigts), tandis que le reste du châssis est en plastique rigide. À l'intérieur, vous trouverez deux emplacements SO-DIMM et deux emplacements PCIe 4.0 M.2.
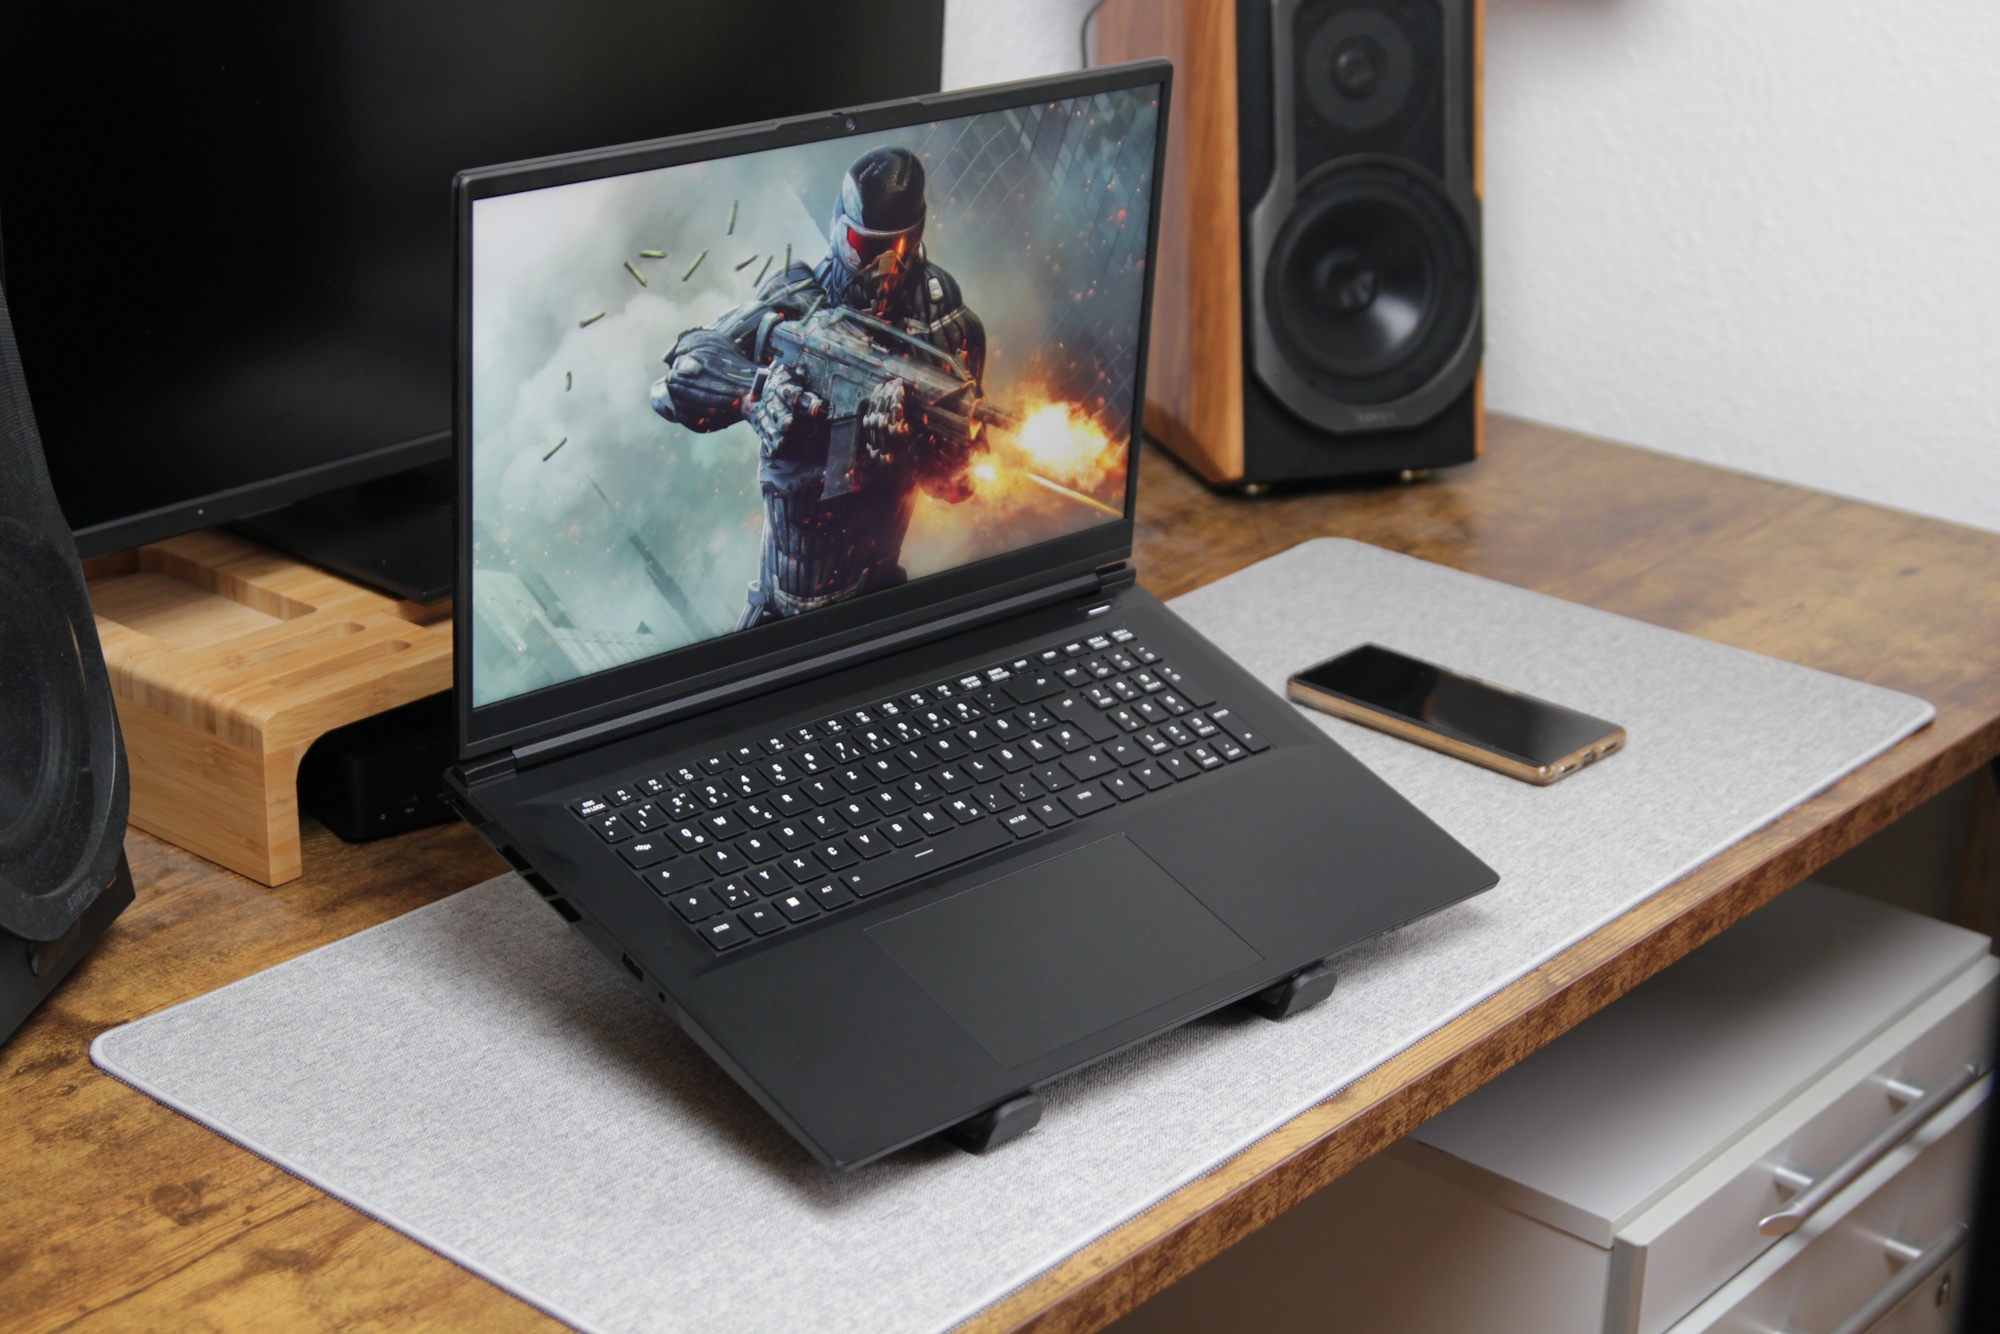
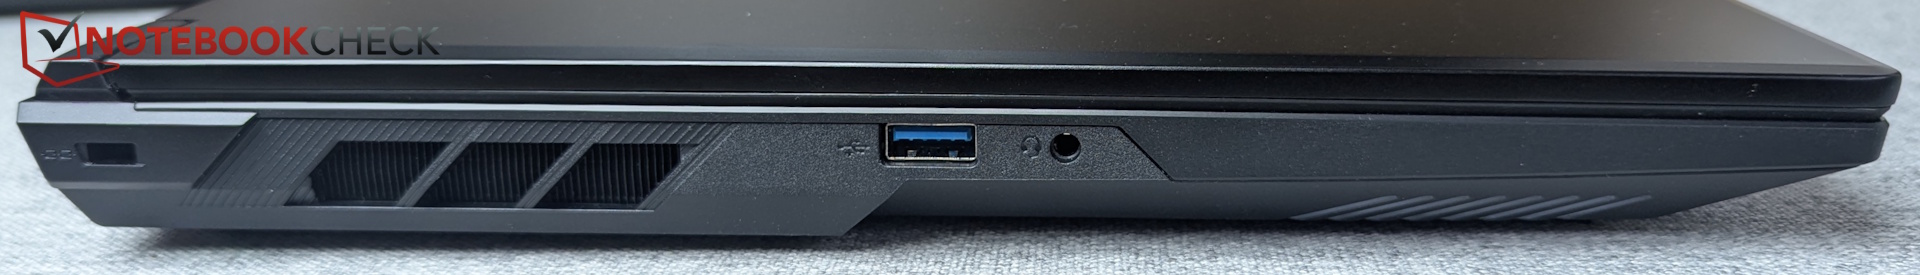
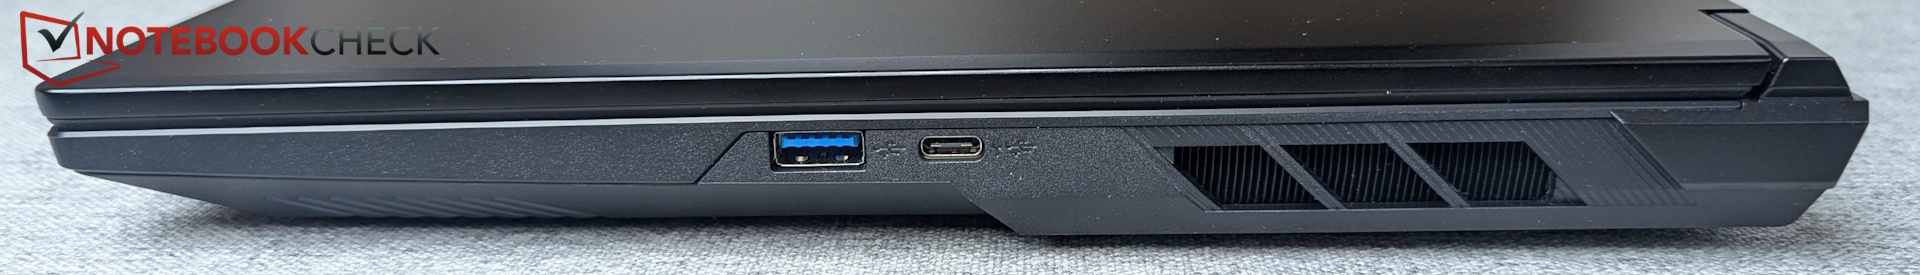
La sélection de ports ne comprend pas de lecteur de carte SD, ni d'USB4 et de Thunderbolt, ce qui signifie que vous êtes limité à un maximum de 10 Gb/s. En termes de taille et de poids, il se situe à peu près au milieu du segment des 17 pouces. Grâce à son écran 16:9, il est souvent plus étroit que les modèles concurrents de 17 pouces.

Webcam
La webcam IR Full HD est dotée d'un obturateur physique. La reproduction des couleurs est acceptable, mais la netteté de l'image pourrait être meilleure.


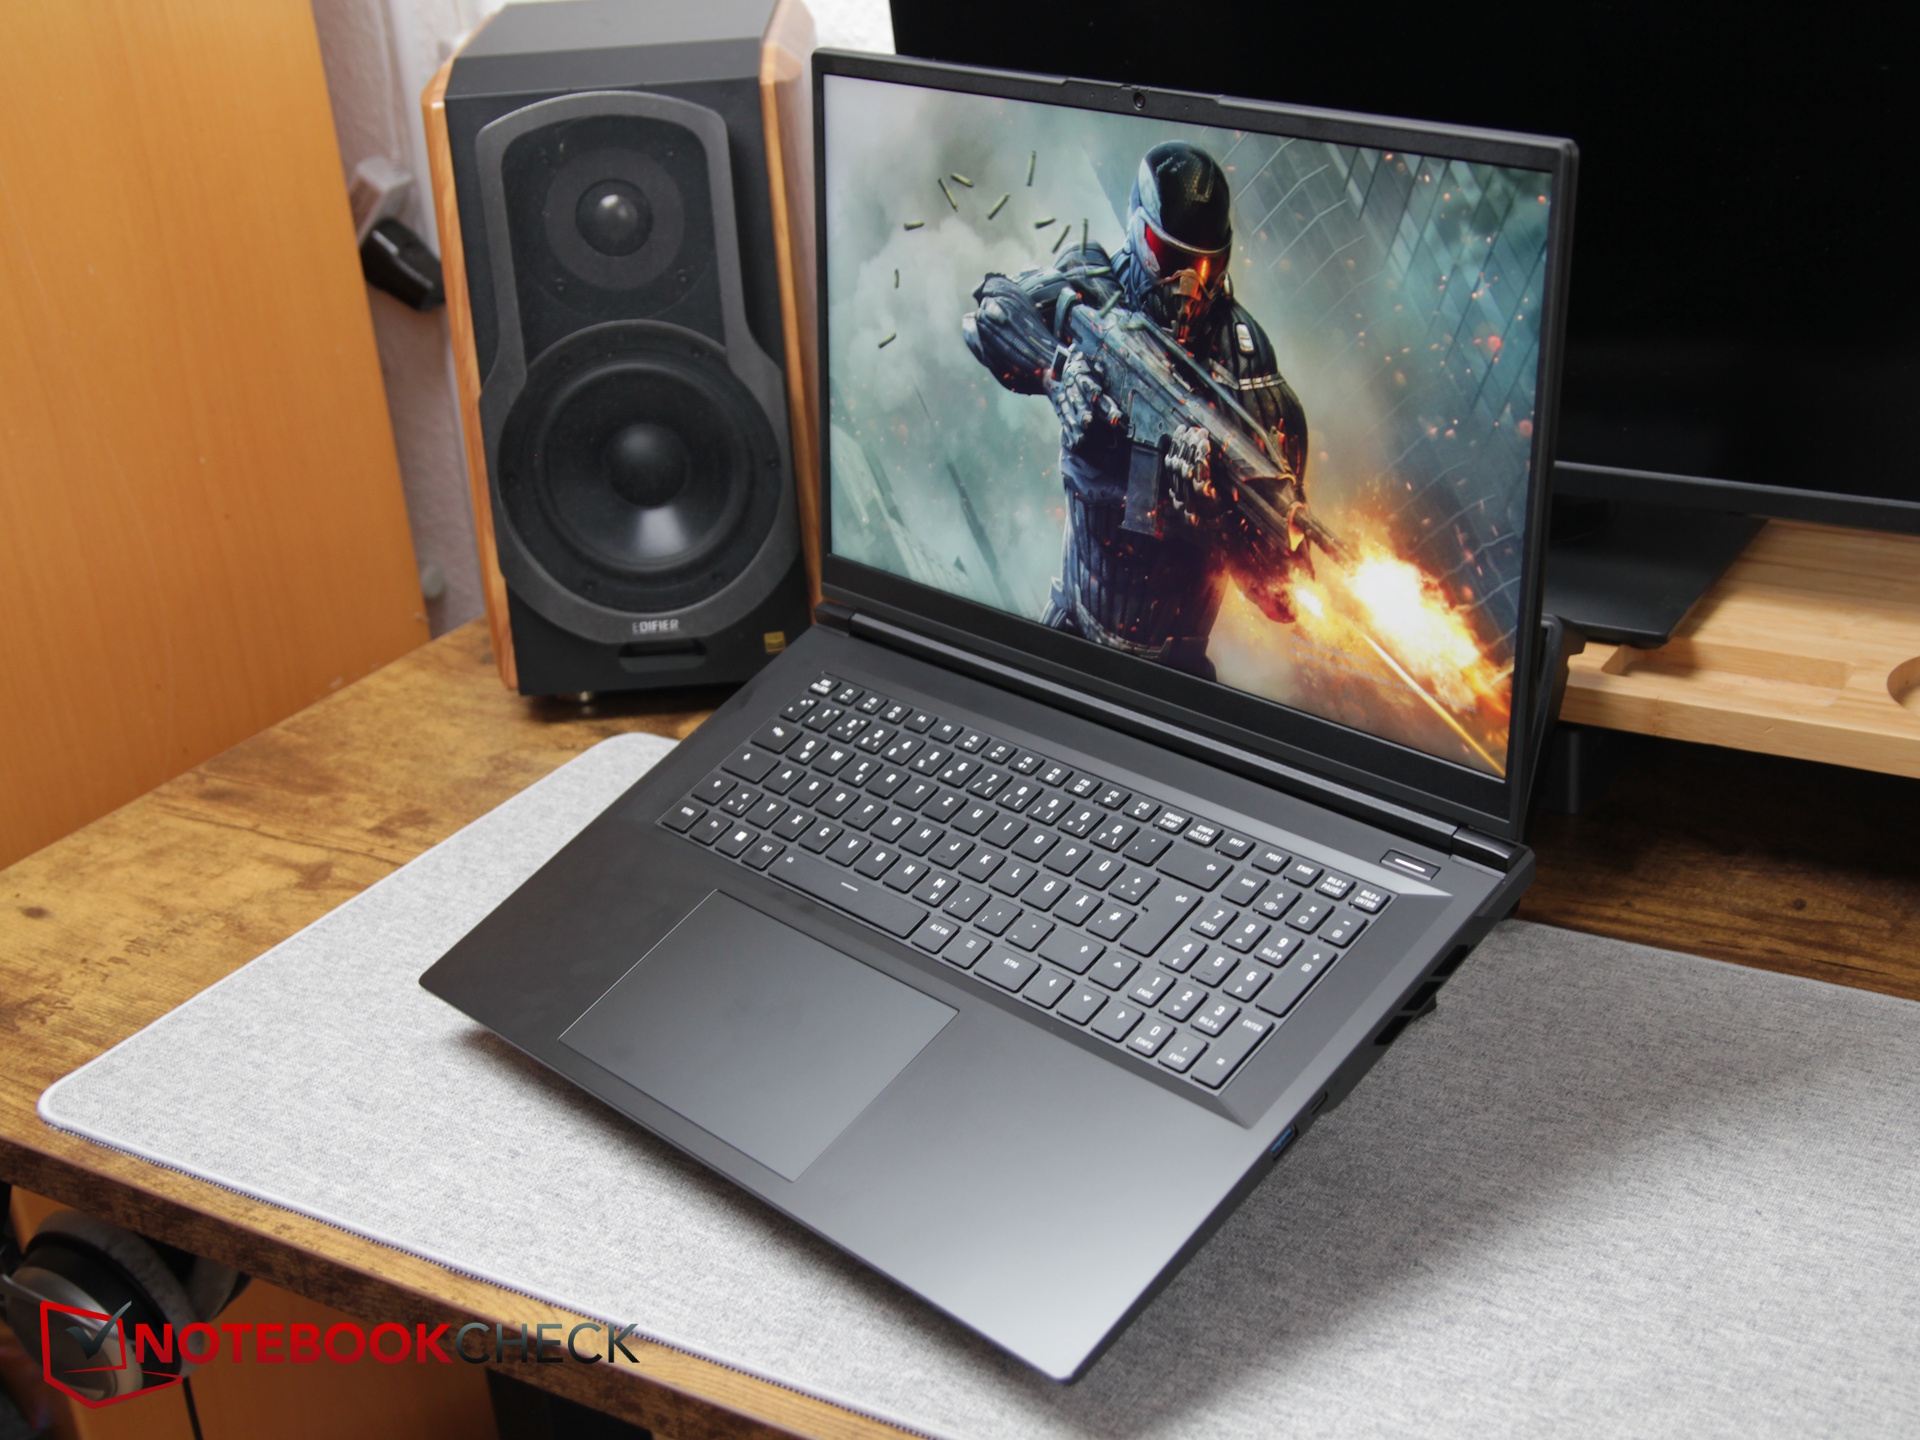
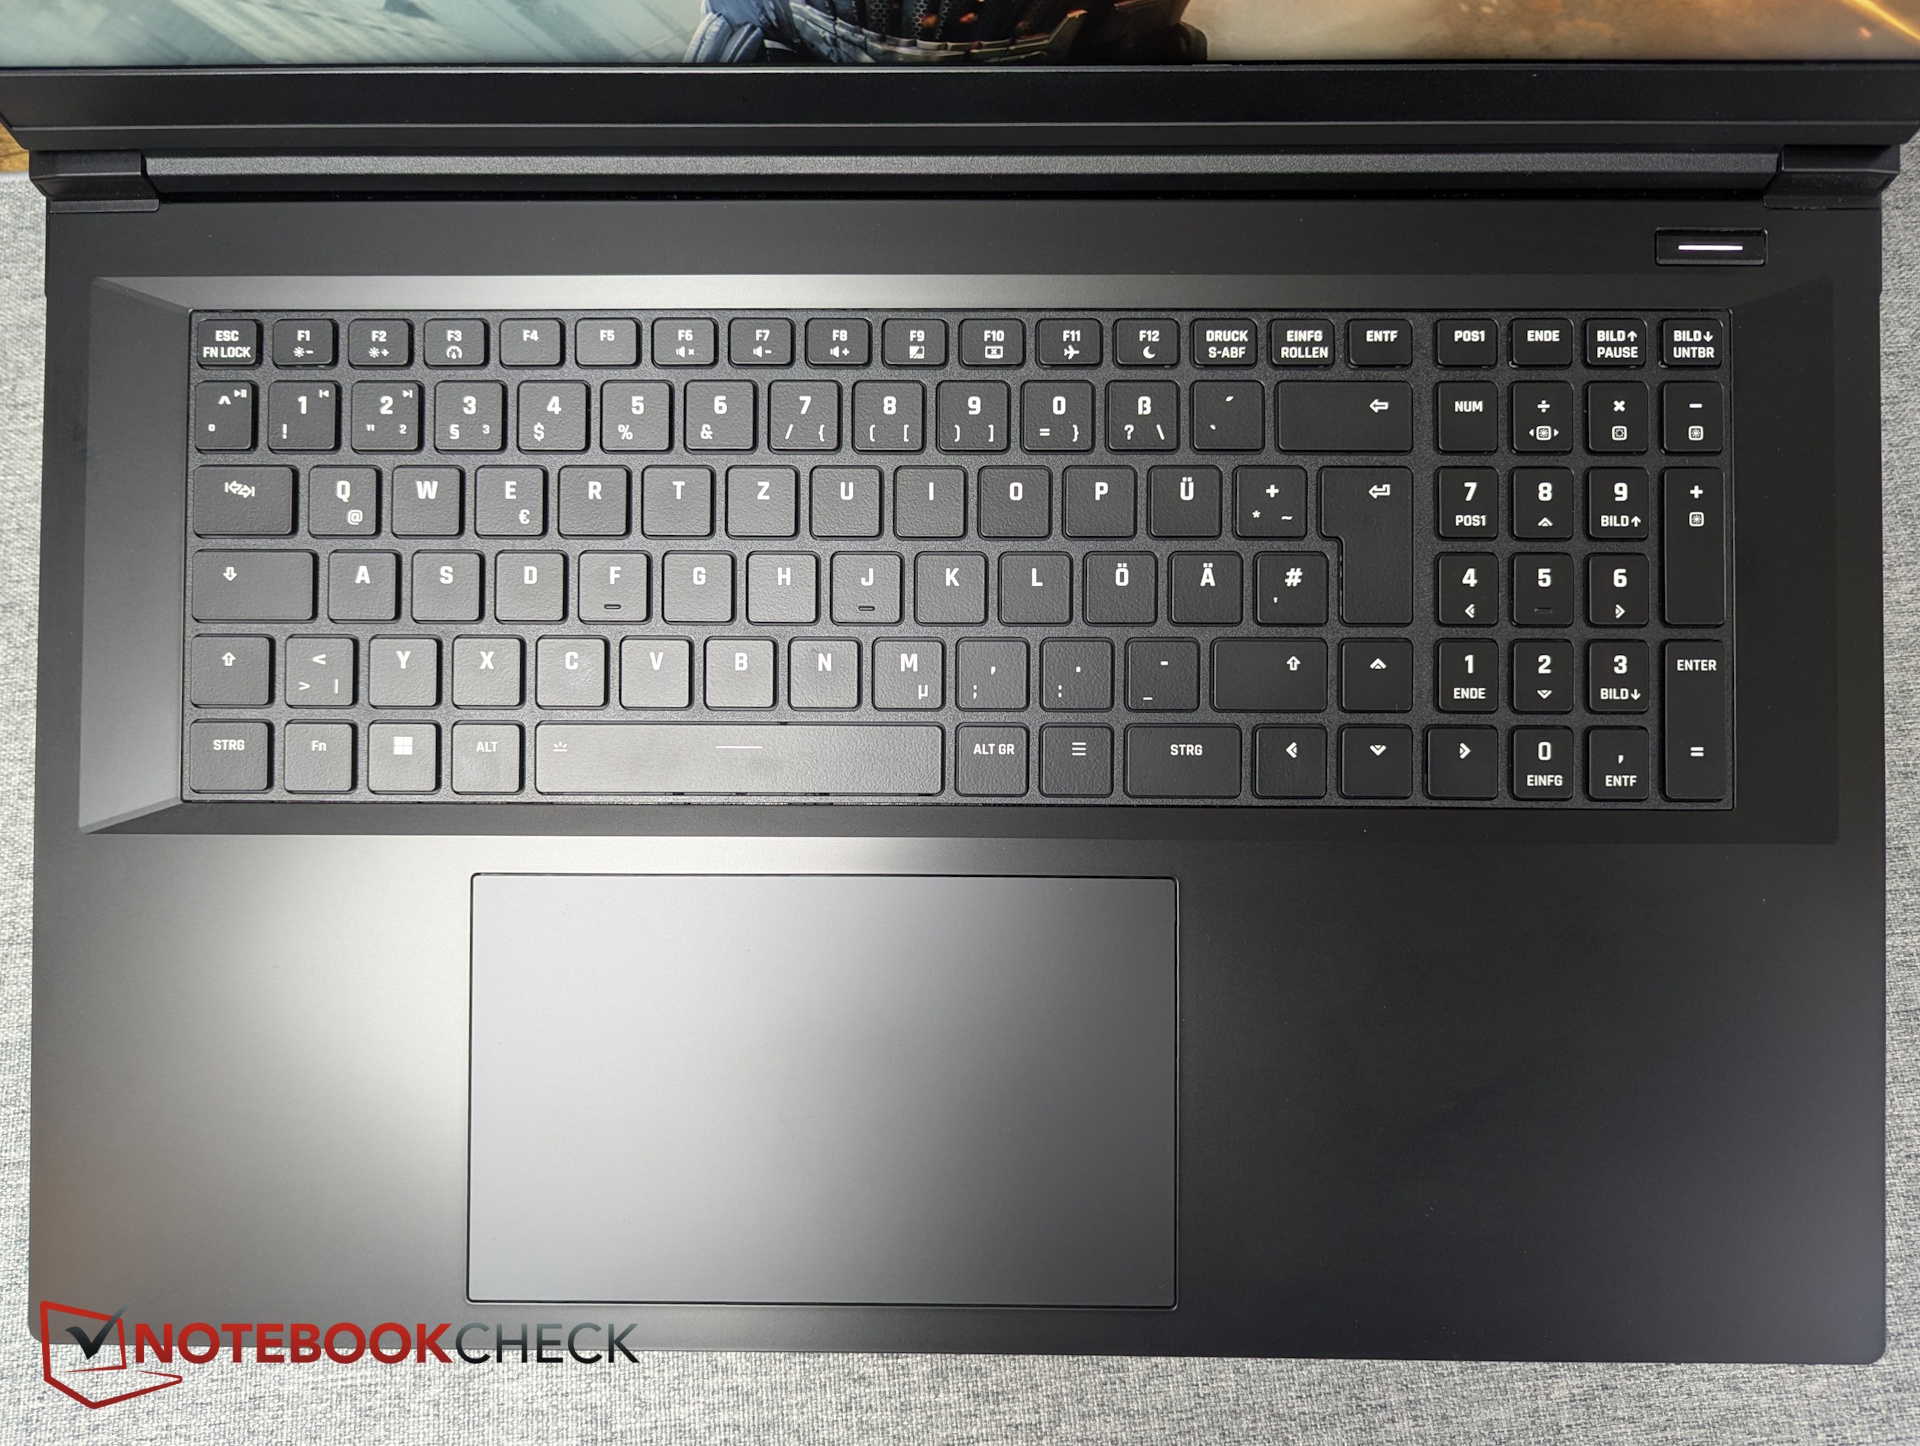
Dispositifs de saisie - Faible course des touches, grand pavé tactile de 15 cm
Contrairement à la plupart des ordinateurs portables XMG, les touches fléchées ne sont pas séparées du groupe de touches principal, comme sur le Focus 17. Sinon, la disposition est claire et comprend un pavé numérique dédié sur la droite.
La course des touches est très faible et, bien que le point de pression soit perceptible, le retour d'information pourrait être plus prononcé. Néanmoins, la frappe reste rapide et confortable.
Le grand pavé tactile de 15 x 9 cm offre de bonnes propriétés de glisse. Ses boutons intégrés répondent de manière fiable avec des niveaux de bruit modérés, et il n'y a pas de cliquetis lorsque vous tapez.
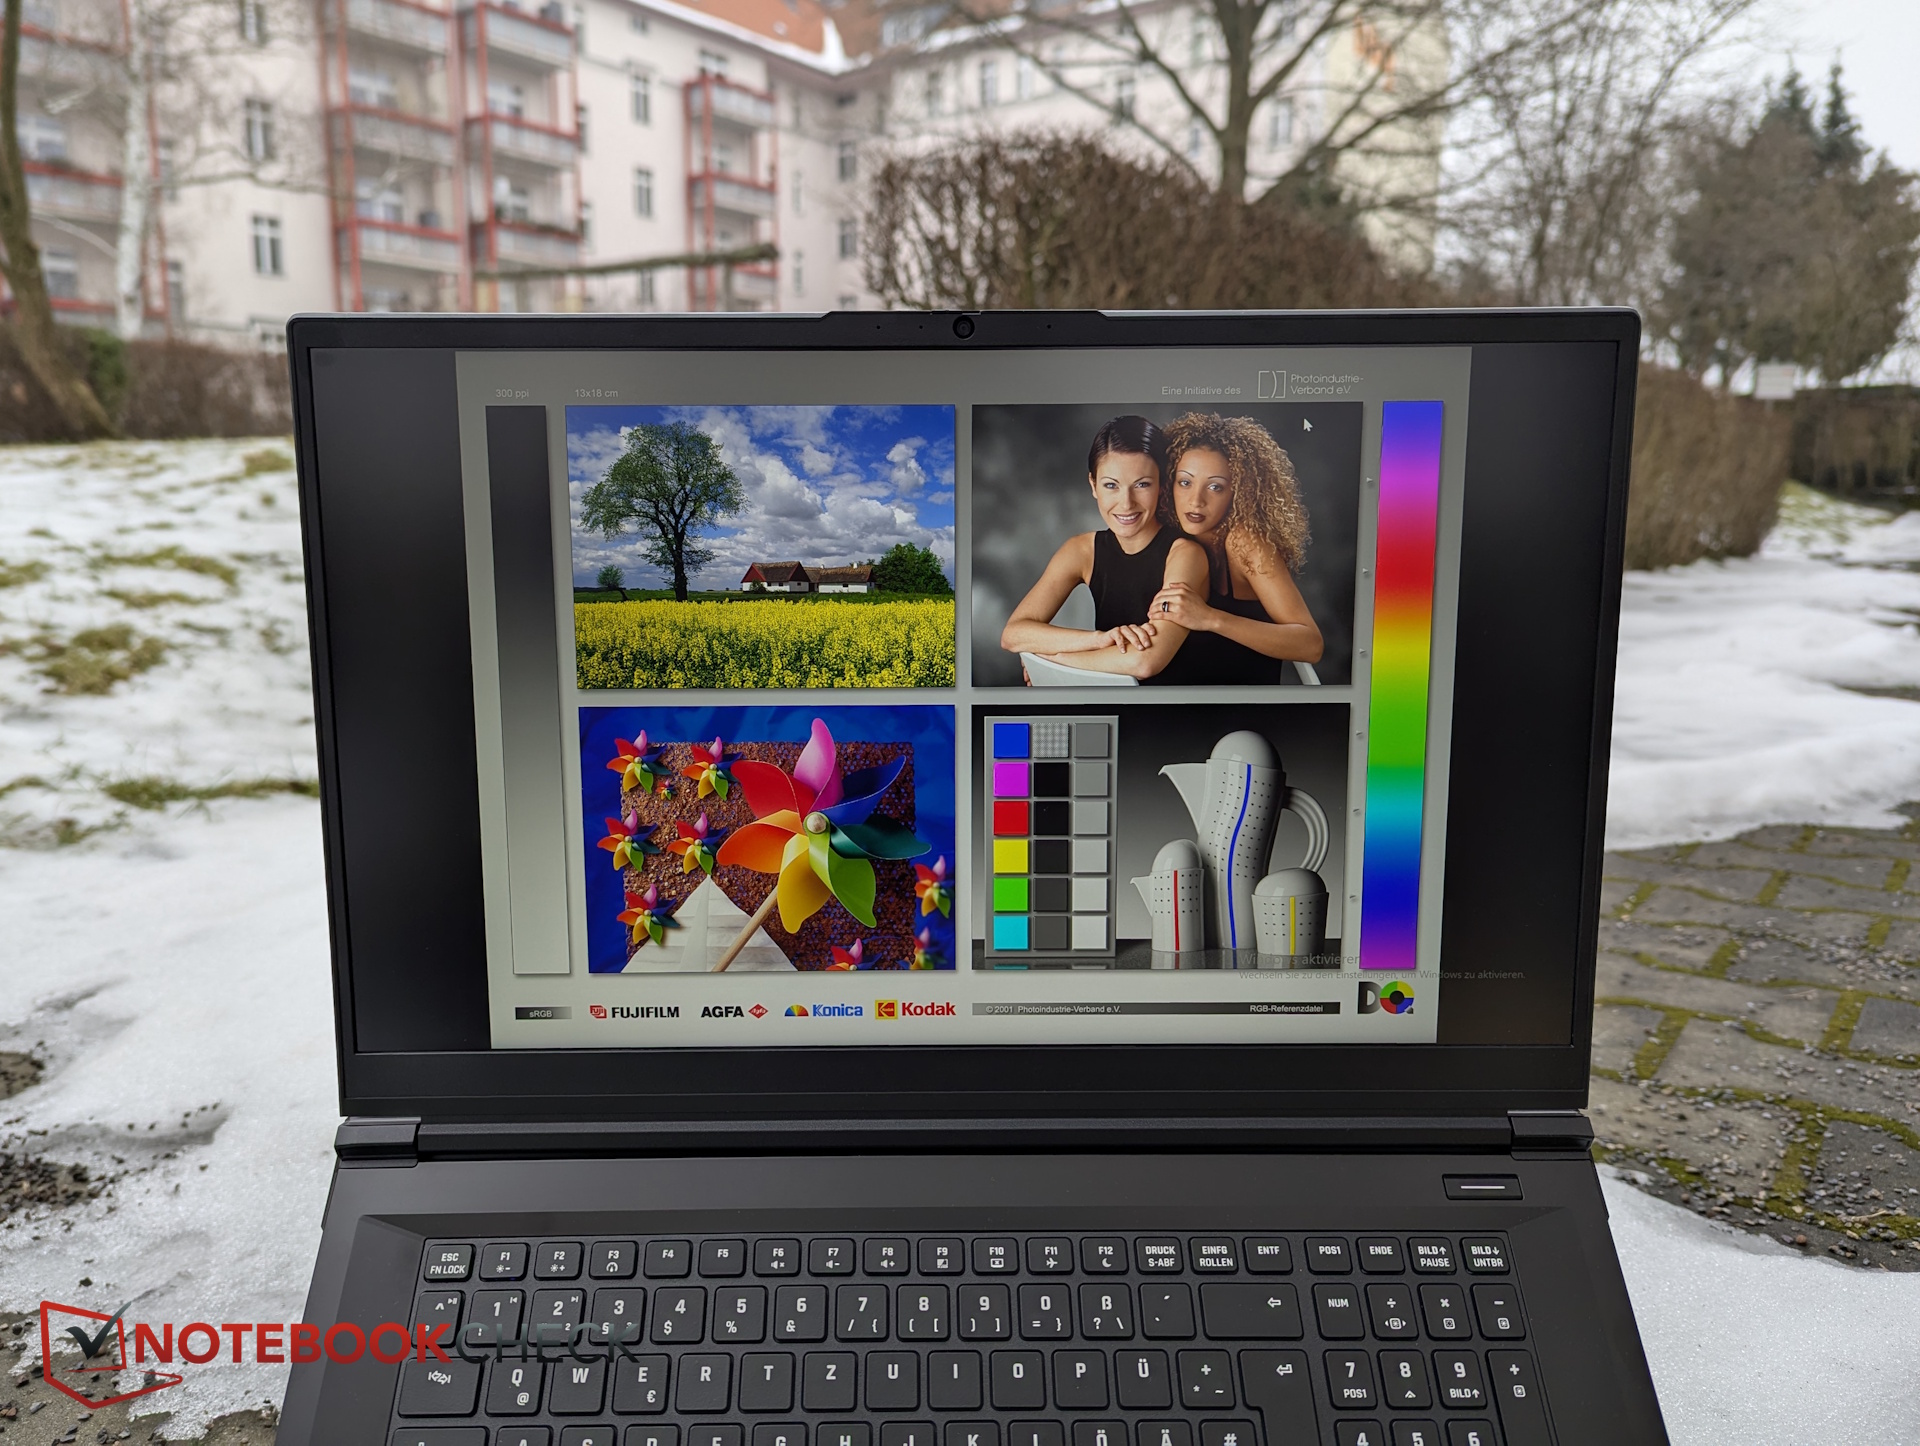
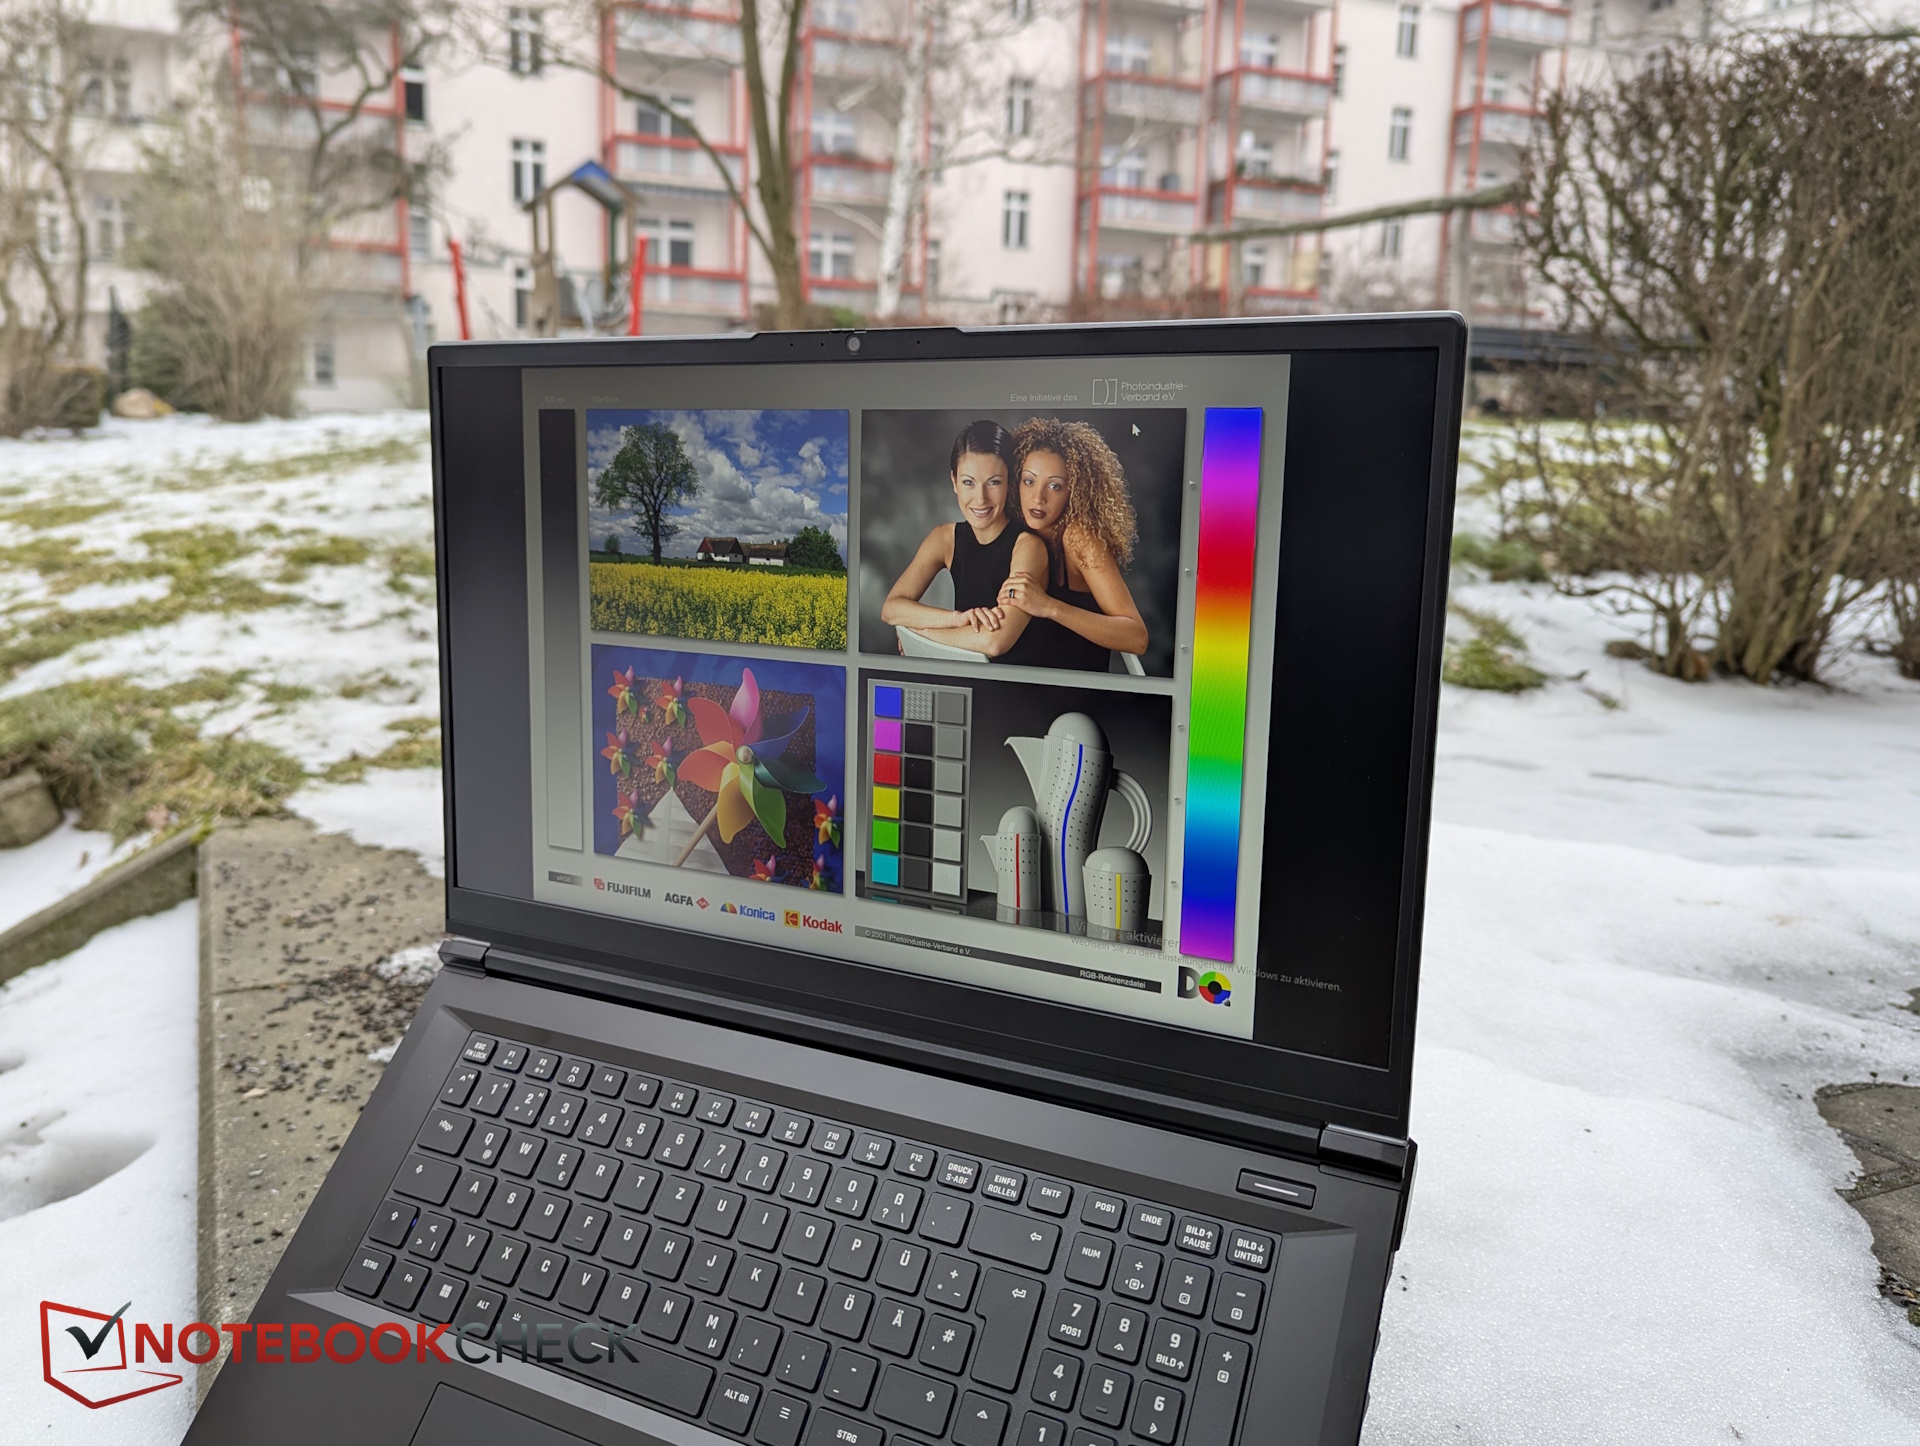
Affichage - Quelle est la qualité de l'écran QHD 240 Hz ?
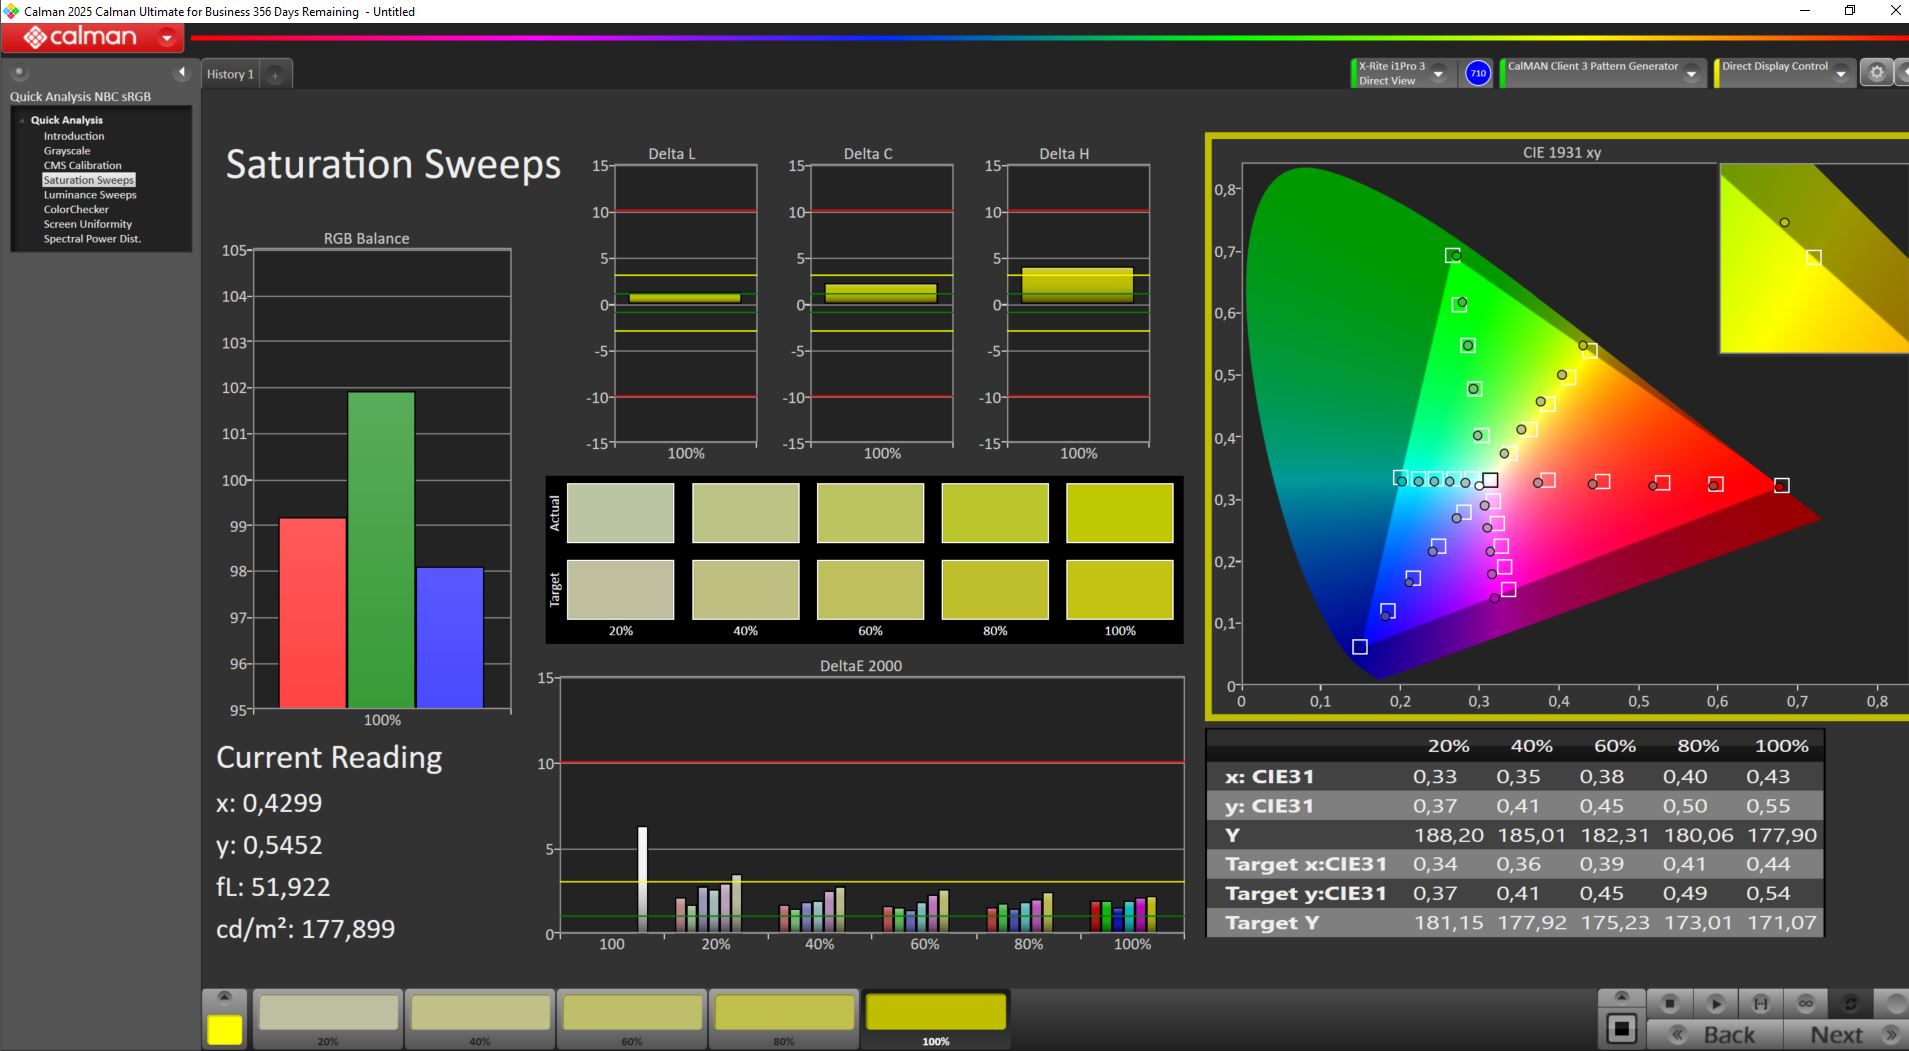
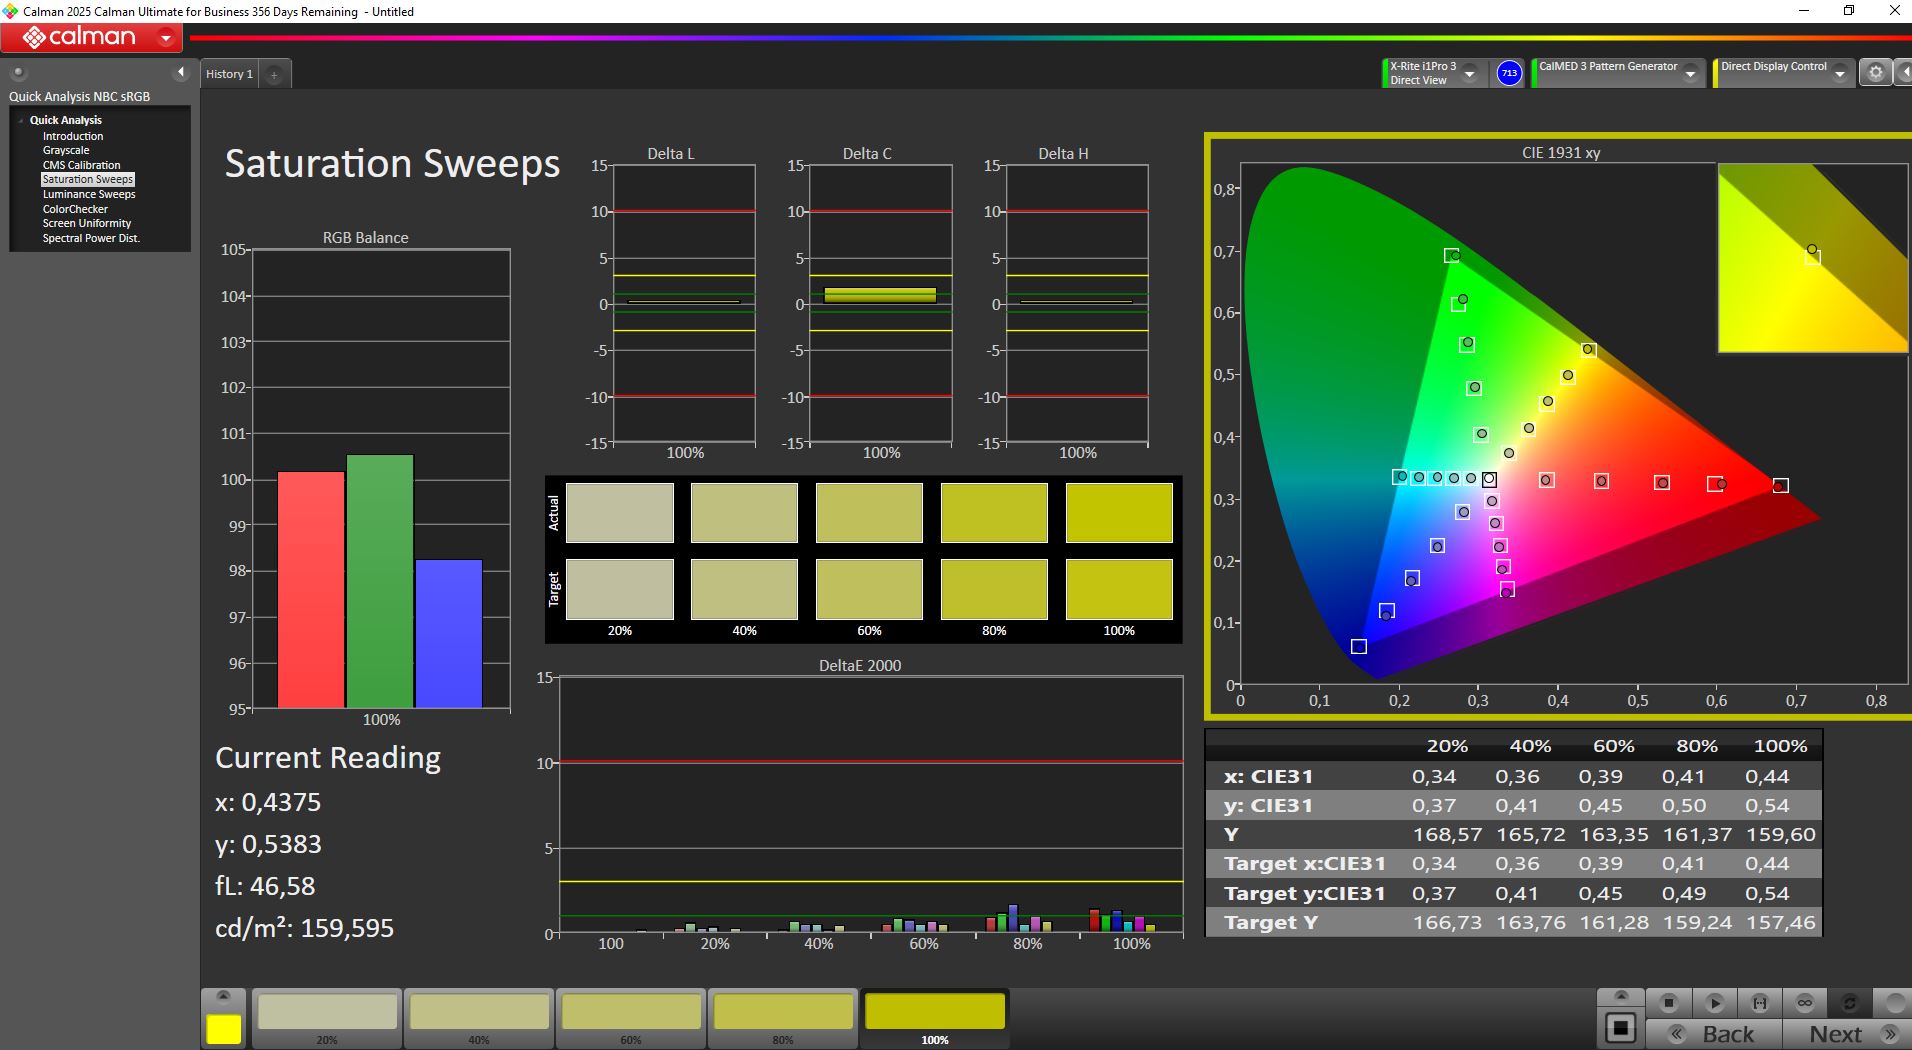
L'écran mat de 17,3 pouces (240 Hz) offre une résolution de 2 560 x 1 440 et couvre à la fois sRGB et DCI-P3.
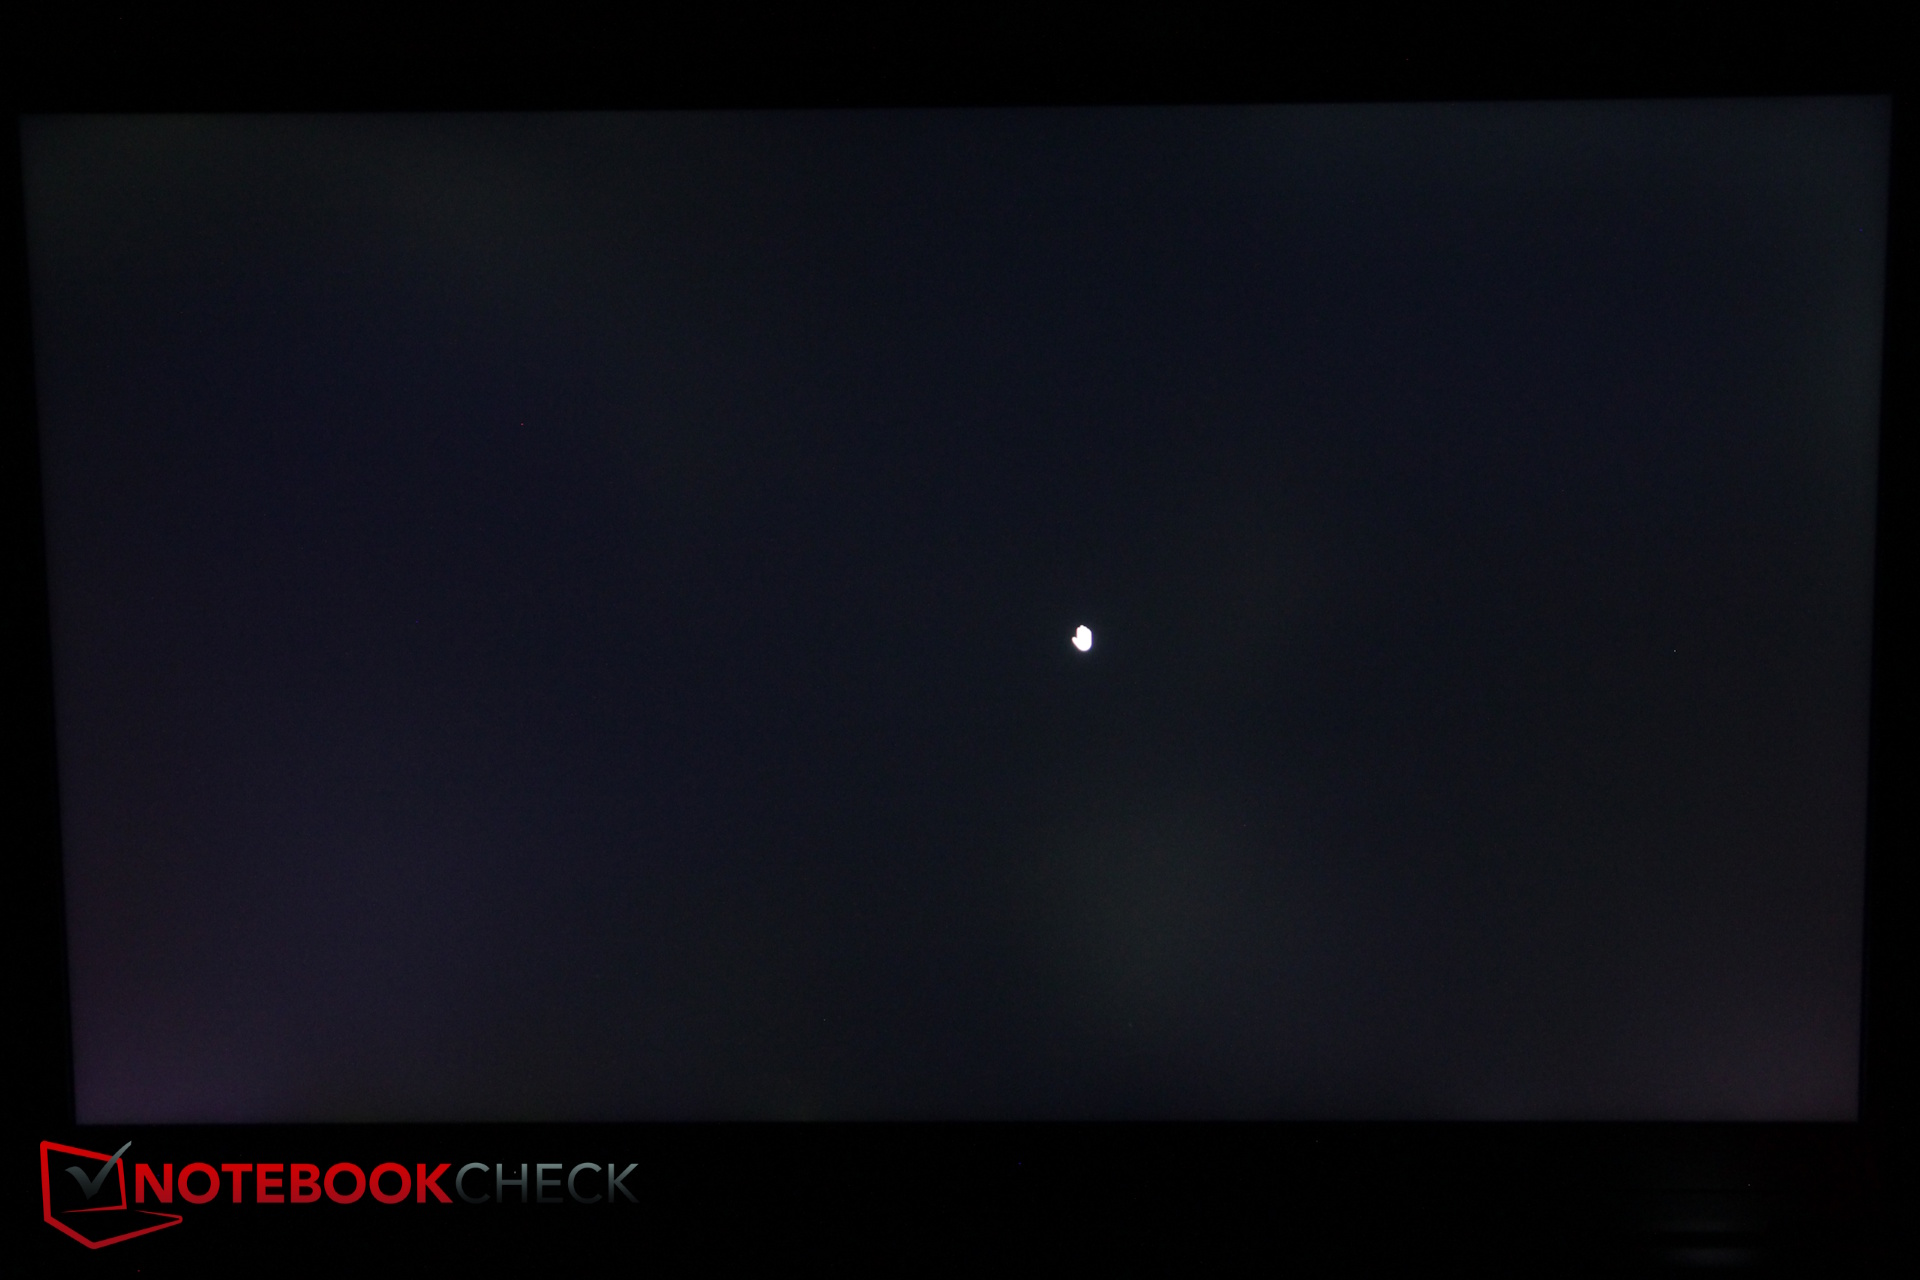
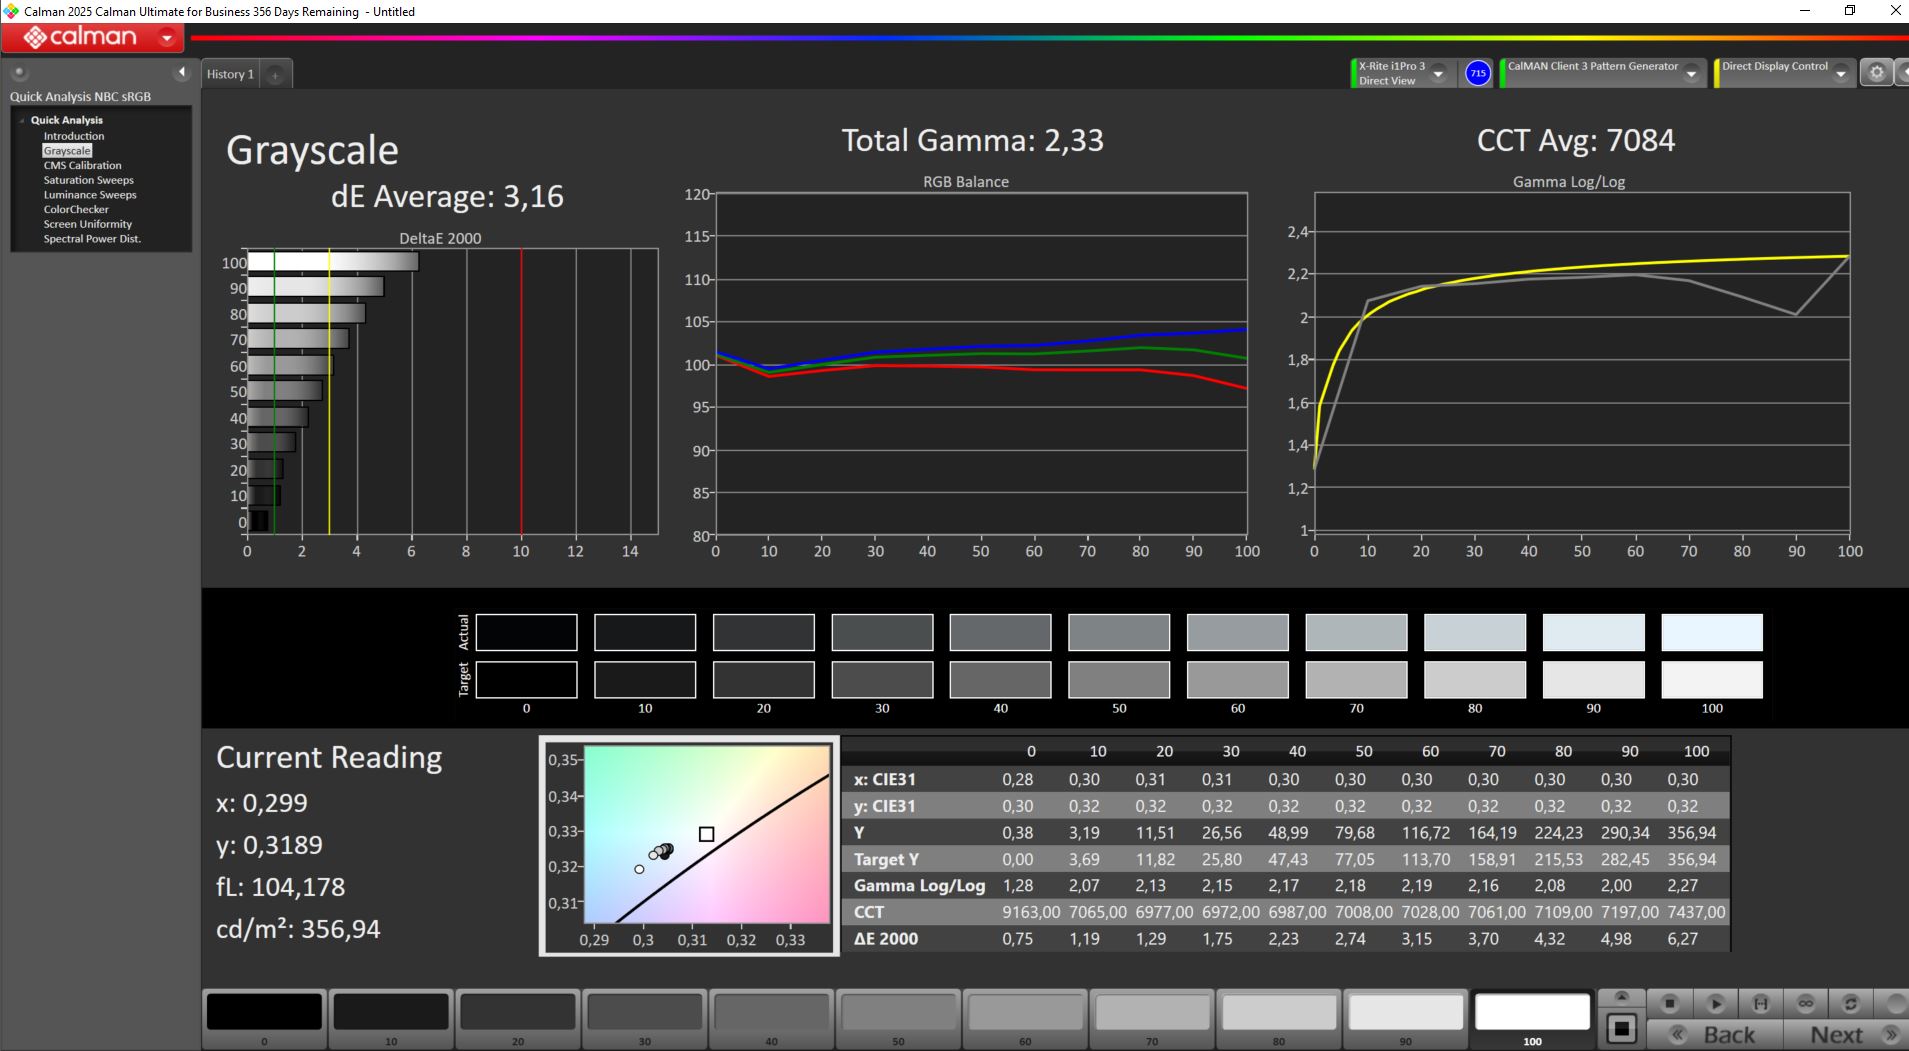
Nous avons mesuré une luminosité moyenne de 325 nits. Les niveaux de noir sont un peu élevés, ce qui réduit légèrement le contraste. Le PWM n'est pas utilisé et les temps de réponse sont assez rapides.

| |||||||||||||||||||||||||
Homogénéité de la luminosité: 85 %
Valeur mesurée au centre, sur batterie: 355 cd/m²
Contraste: 890:1 (Valeurs des noirs: 0.4 cd/m²)
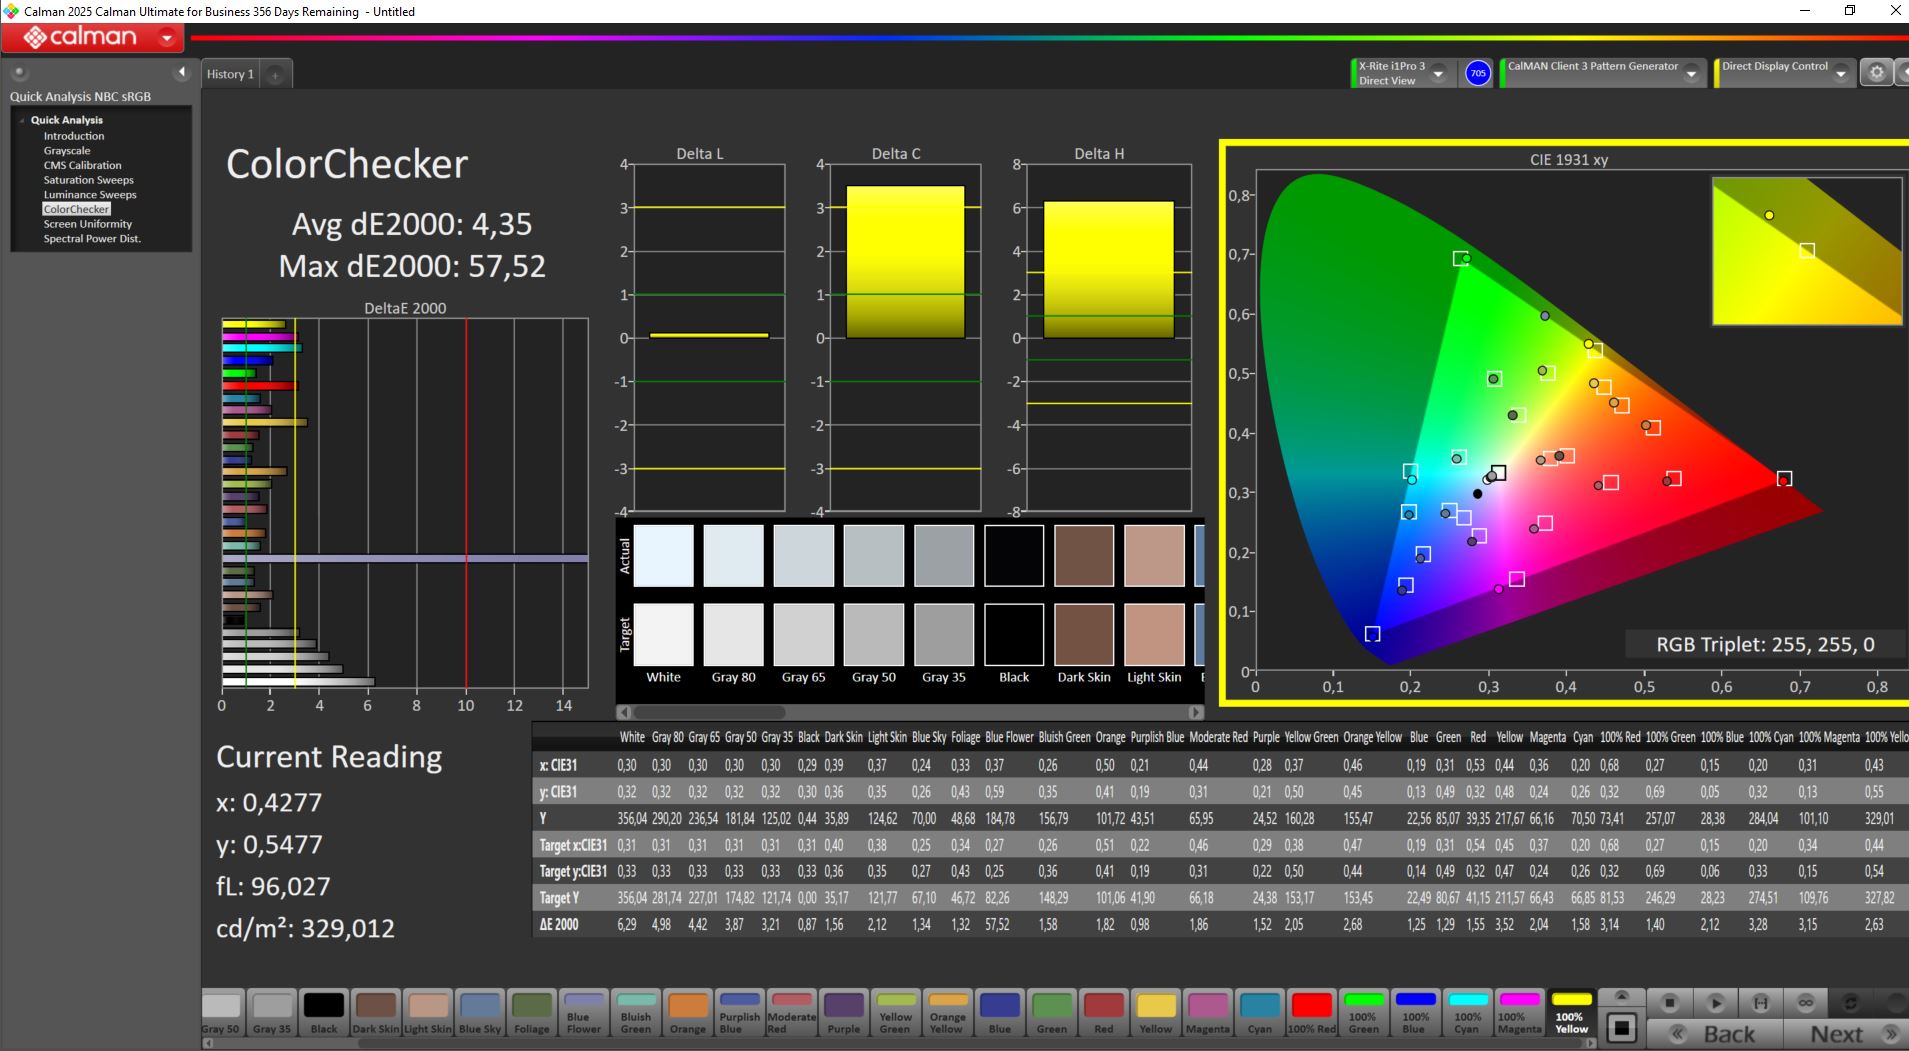
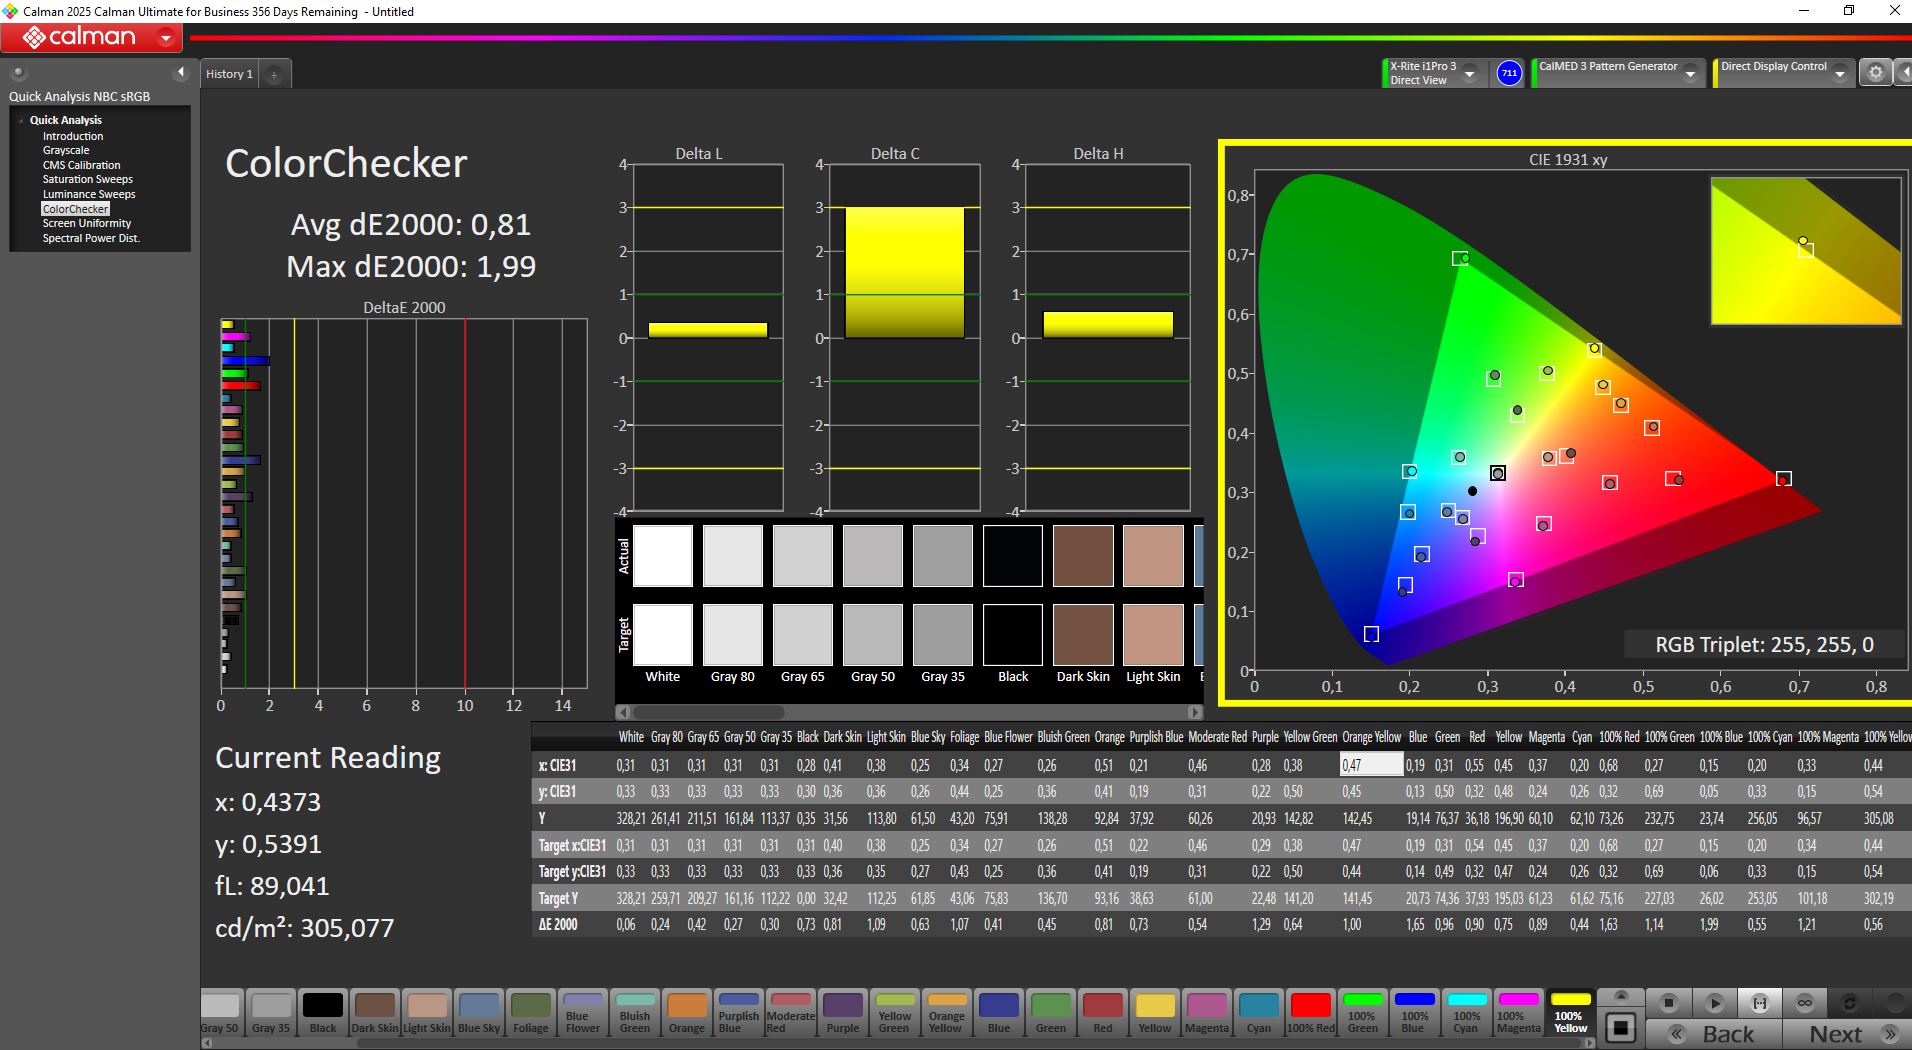
ΔE ColorChecker Calman: 4.35 | ∀{0.5-29.43 Ø4.75}
calibrated: 0.81
ΔE Greyscale Calman: 3.16 | ∀{0.09-98 Ø5}
85.1% AdobeRGB 1998 (Argyll 3D)
99.9% sRGB (Argyll 3D)
97.4% Display P3 (Argyll 3D)
Gamma: 2.33
CCT: 7084 K
| Schenker XMG Apex 17 M25 BOE09F9 (NE173QHM-NZ1), IPS, 2560x1440, 17.3", 240 Hz | HP Omen 17z-db100 BOE0B67, IPS, 2560x1440, 17.3", 240 Hz | Acer Nitro v 17 (ANV17-41-R4CJ) AUOB39E (B173HAN04.9), IPS, 1920x1080, 17.3", 144 Hz | MSI Crosshair A17 HX D8WGKG B170QAN01.2, IPS, 2560x1600, 17", 240 Hz | MSI Katana 17 HX B14WGK CSOT MNH301CA3-1, IPS, 2560x1440, 17.3", 240 Hz | |
|---|---|---|---|---|---|
| Display | -18% | -49% | 0% | 2% | |
| Display P3 Coverage (%) | 97.4 | 66.6 -32% | 42.2 -57% | 97.1 0% | 97.3 0% |
| sRGB Coverage (%) | 99.9 | 96.8 -3% | 60.9 -39% | 99.9 0% | 99.6 0% |
| AdobeRGB 1998 Coverage (%) | 85.1 | 68.6 -19% | 40.8 -52% | 84.9 0% | 89 5% |
| Response Times | -18% | -218% | 20% | 29% | |
| Response Time Grey 50% / Grey 80% * (ms) | 14 ? | 15.1 ? -8% | 42 ? -200% | 13.3 ? 5% | 5.2 ? 63% |
| Response Time Black / White * (ms) | 8.8 ? | 11.3 ? -28% | 29.6 ? -236% | 5.7 ? 35% | 9.2 ? -5% |
| PWM Frequency (Hz) | |||||
| PWM Amplitude * (%) | |||||
| Screen | -5% | -66% | 23% | 23% | |
| Brightness middle (cd/m²) | 356 | 373.2 5% | 258 -28% | 471 32% | 296 -17% |
| Brightness (cd/m²) | 325 | 341 5% | 238 -27% | 468 44% | 272 -16% |
| Brightness Distribution (%) | 85 | 84 -1% | 82 -4% | 96 13% | 87 2% |
| Black Level * (cd/m²) | 0.4 | 0.62 -55% | 0.19 52% | 0.4 -0% | 0.27 32% |
| Contrast (:1) | 890 | 602 -32% | 1358 53% | 1178 32% | 1096 23% |
| Colorchecker dE 2000 * | 4.35 | 2.53 42% | 7.4 -70% | 2.72 37% | 1.35 69% |
| Colorchecker dE 2000 max. * | 57.52 | 5.03 91% | 19.59 66% | 5.49 90% | 4.76 92% |
| Colorchecker dE 2000 calibrated * | 0.81 | 1.39 -72% | 5.88 -626% | 1.12 -38% | 0.78 4% |
| Greyscale dE 2000 * | 3.16 | 4.1 -30% | 3.54 -12% | 3.2 -1% | 2.7 15% |
| Gamma | 2.33 94% | 2.23 99% | 2.1 105% | 2.227 99% | 2.201 100% |
| CCT | 7084 92% | 6257 104% | 6836 95% | 6925 94% | 6770 96% |
| Moyenne finale (programmes/paramètres) | -14% /
-10% | -111% /
-84% | 14% /
18% | 18% /
19% |
* ... Moindre est la valeur, meilleures sont les performances
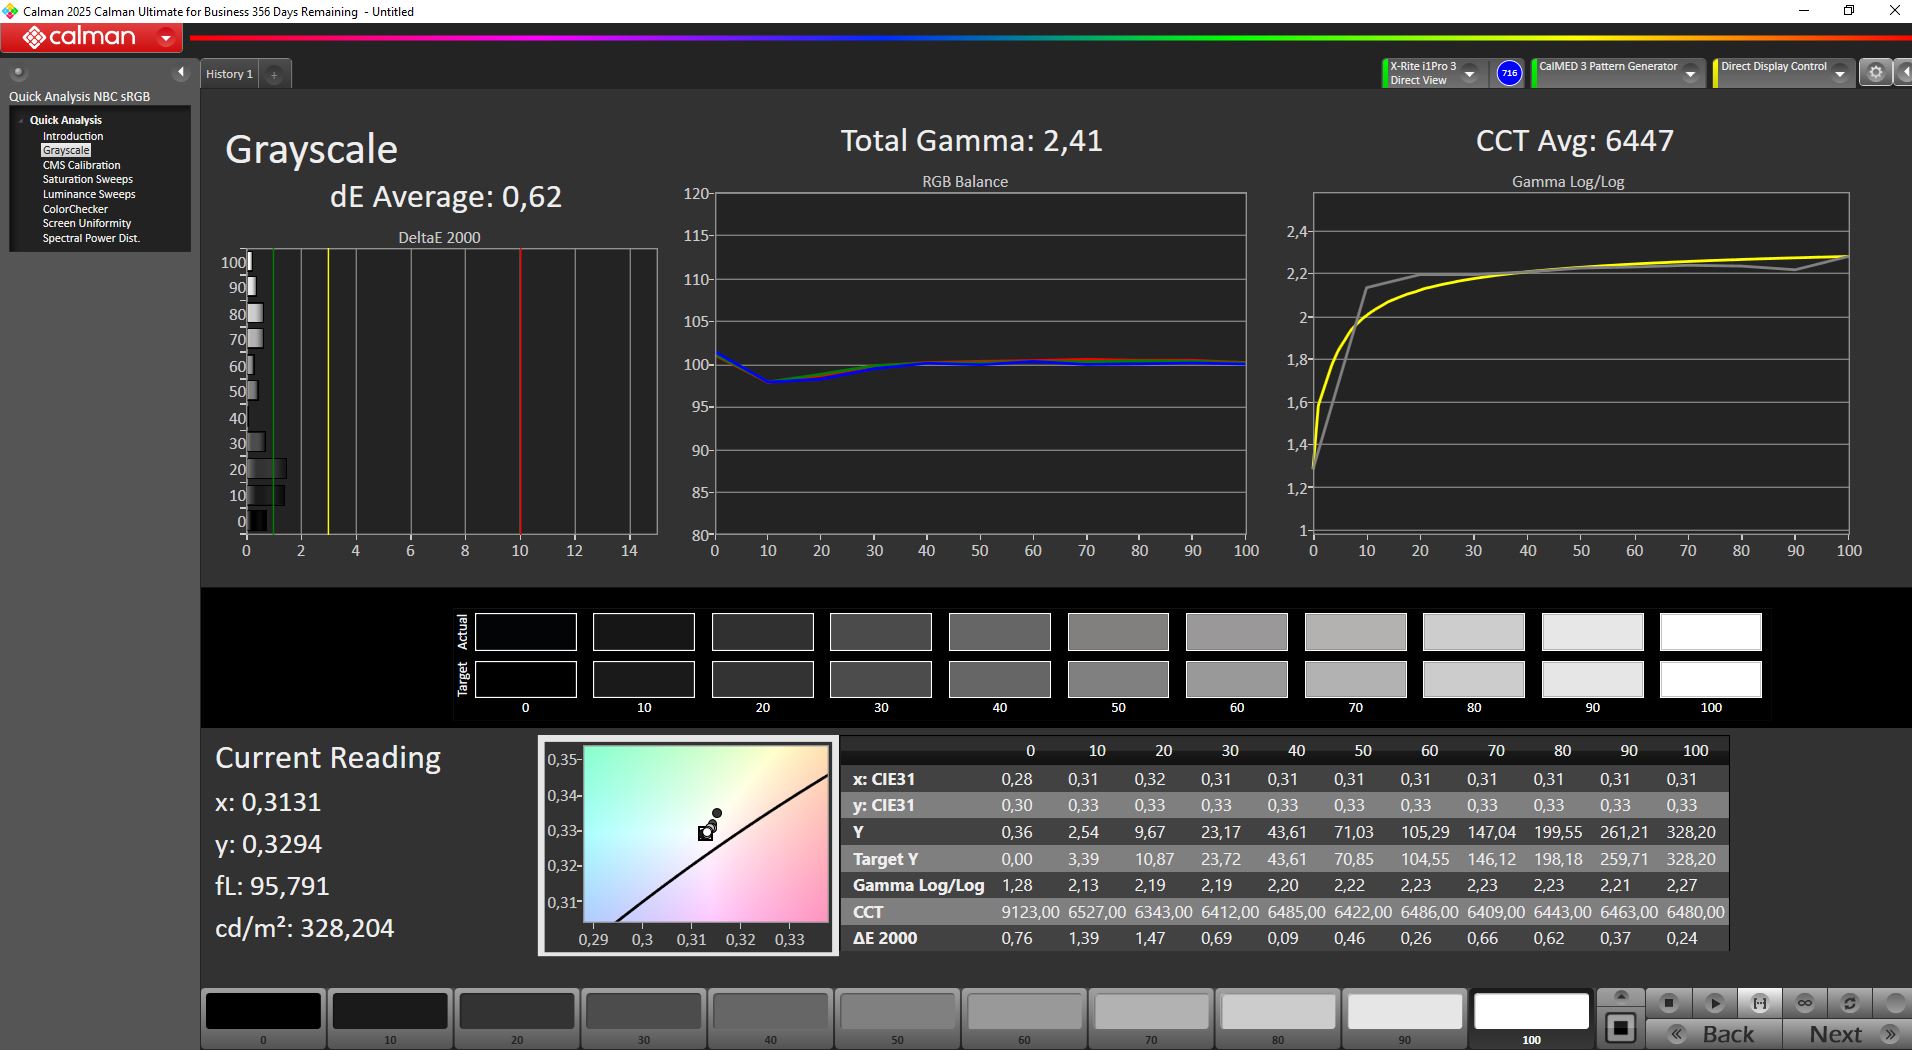
À la sortie de l'emballage, l'étalonnage est médiocre, avec des écarts DeltaE élevés. Après un recalibrage manuel, nous avons réduit les écarts de niveaux de gris et de couleurs à moins de 1, ce qui donne d'excellents résultats. Notre profil ICC calibré peut être téléchargé ci-dessus.
Temps de réponse de l'écran
| ↔ Temps de réponse noir à blanc | ||
|---|---|---|
| 8.8 ms ... hausse ↗ et chute ↘ combinées | ↗ 3.4 ms hausse | 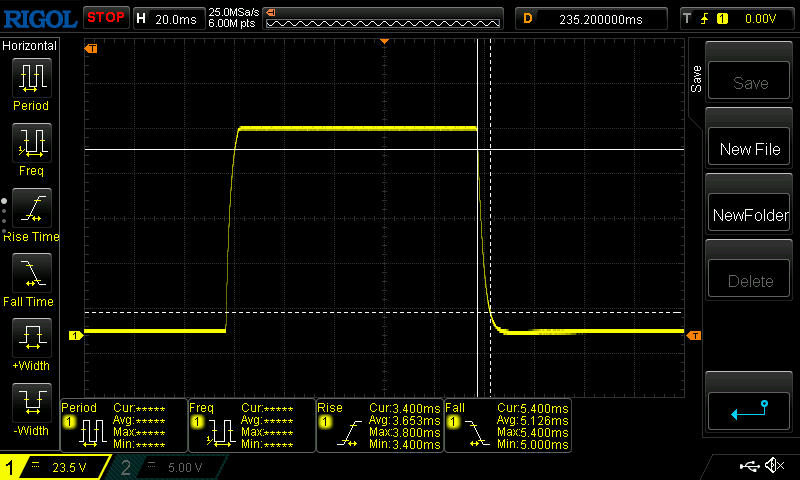 |
| ↘ 5.4 ms chute | ||
| L'écran montre de faibles temps de réponse, un bon écran pour jouer. En comparaison, tous les appareils testés affichent entre 0.1 (minimum) et 240 (maximum) ms. » 24 % des appareils testés affichent de meilleures performances. Cela signifie que les latences relevées sont meilleures que la moyenne (20 ms) de tous les appareils testés. | ||
| ↔ Temps de réponse gris 50% à gris 80% | ||
| 14 ms ... hausse ↗ et chute ↘ combinées | ↗ 6.6 ms hausse | 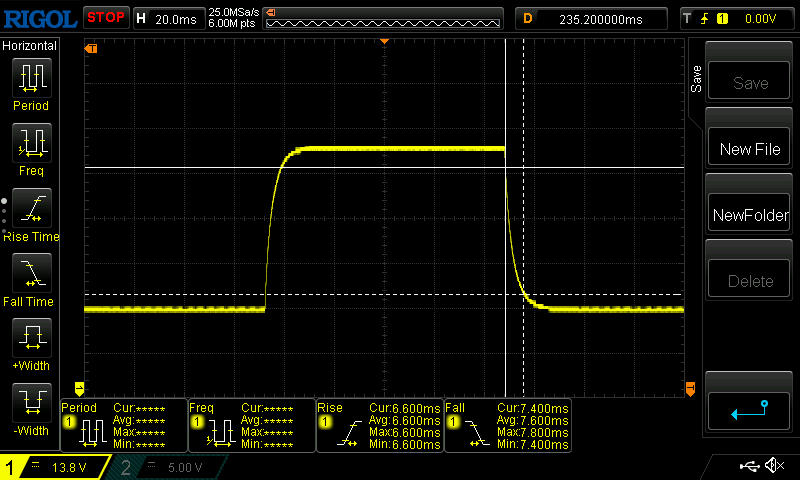 |
| ↘ 7.4 ms chute | ||
| L'écran montre de bons temps de réponse, mais insuffisant pour du jeu compétitif. En comparaison, tous les appareils testés affichent entre 0.165 (minimum) et 636 (maximum) ms. » 27 % des appareils testés affichent de meilleures performances. Cela signifie que les latences relevées sont meilleures que la moyenne (31.3 ms) de tous les appareils testés. | ||
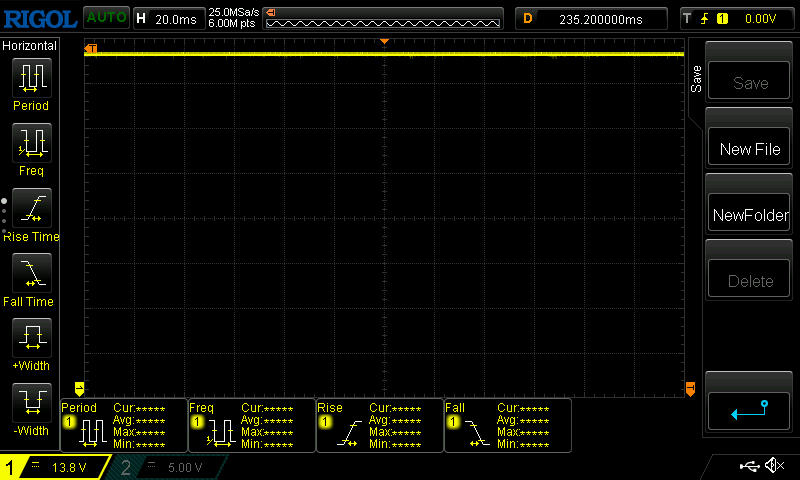
Scintillement / MLI (Modulation de largeur d'impulsion)
| Scintillement / MLI (Modulation de largeur d'impulsion) non décelé |  | ||
En comparaison, 53 % des appareils testés n'emploient pas MDI pour assombrir leur écran. Nous avons relevé une moyenne à 7959 (minimum : 5 - maximum : 343500) Hz dans le cas où une MDI était active. | |||
Grâce à la finition mate et à une luminosité supérieure à 300 nits, le contenu reste facilement visible dans des conditions extérieures ombragées.


Performance - Quelle est la vitesse réelle de l'Apex 17 ?
Équipé du processeur AMD Ryzen 9 9955HX, RTX 5060et de 32 Go de RAM, l'Apex est bien adapté aux jeux en Full HD. Son design sobre et son écran QHD bien calibré pourraient également séduire les créateurs de contenu.
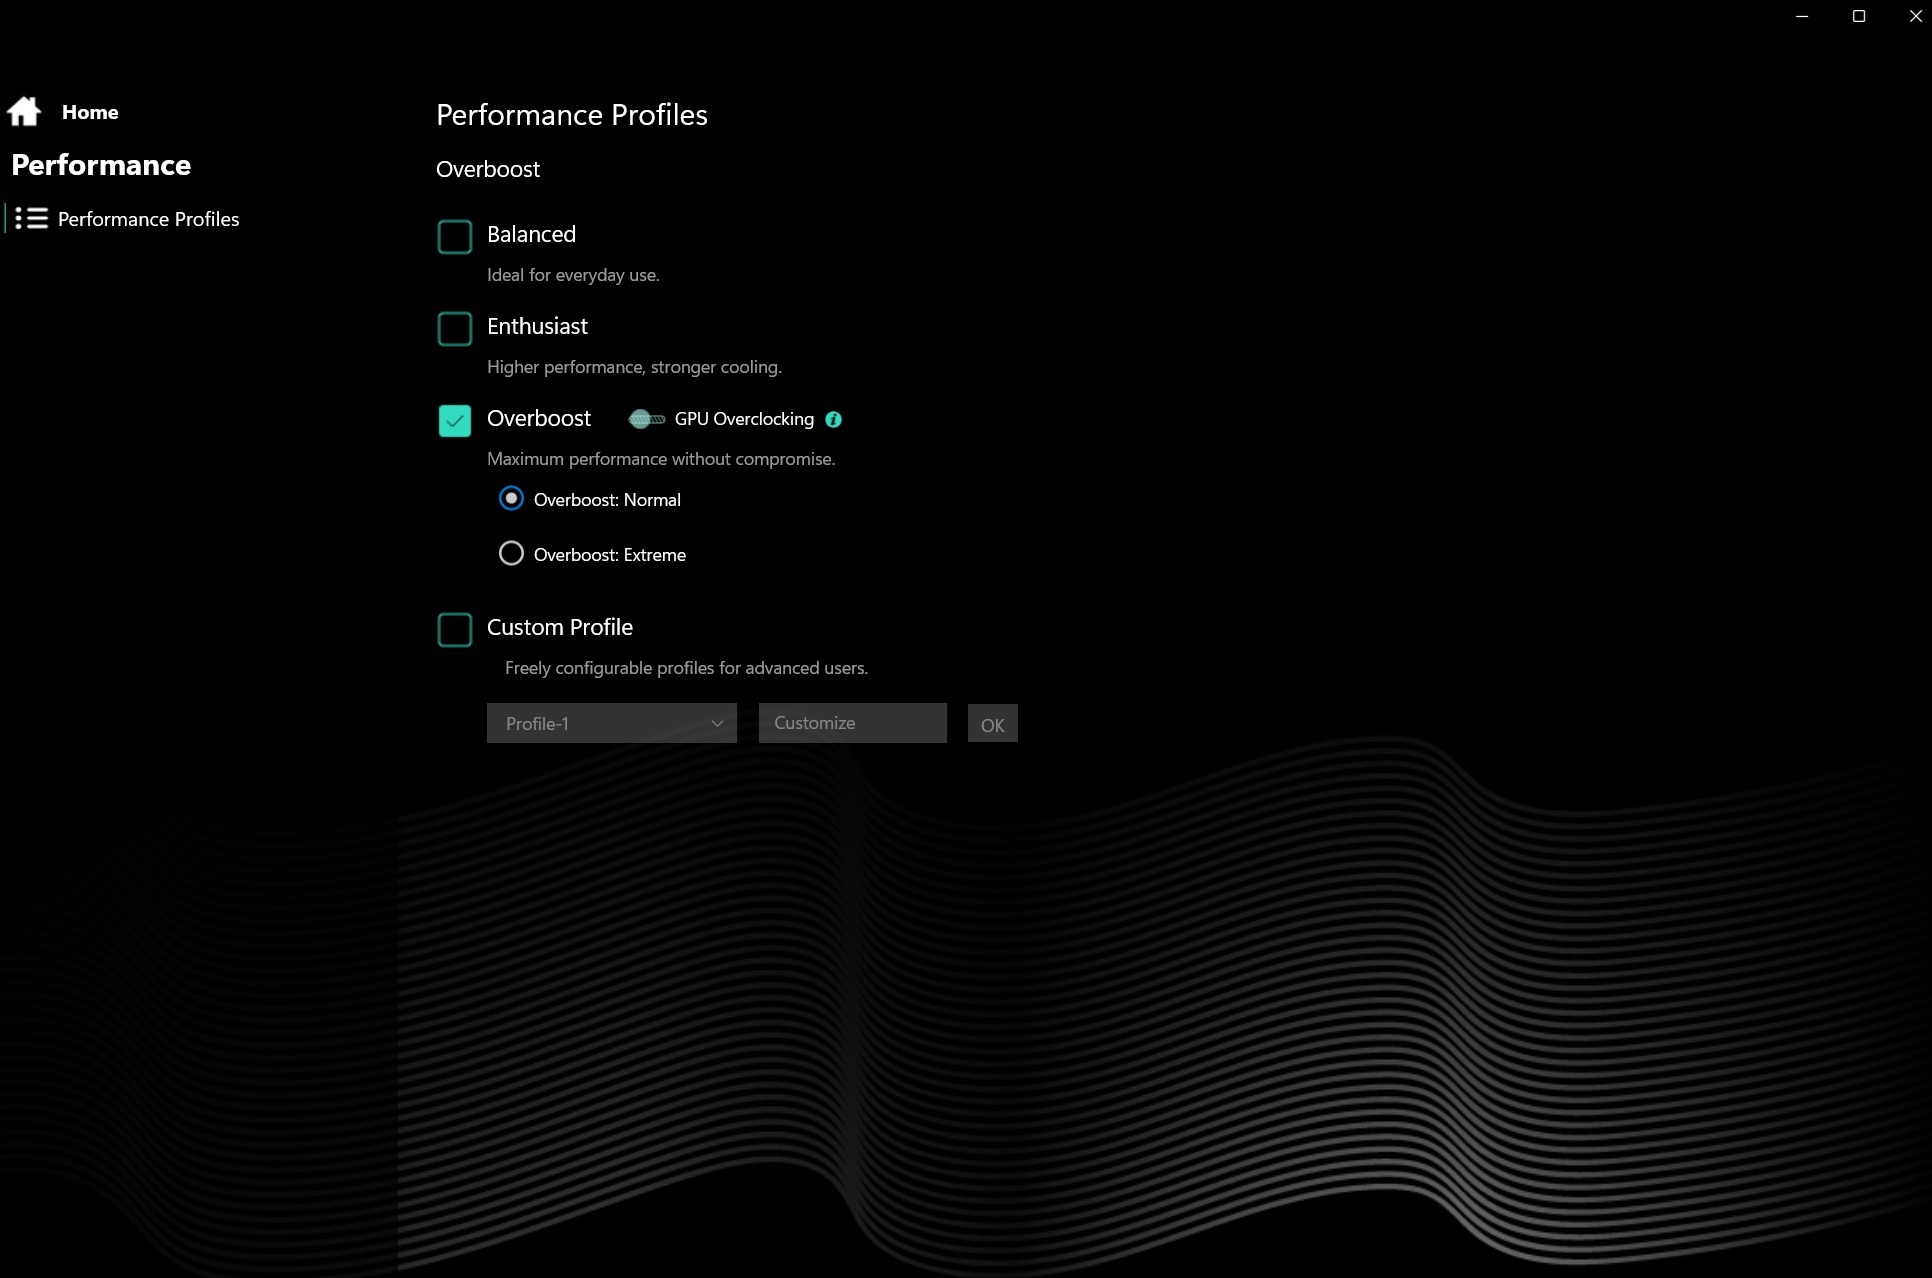
Conditions d'essai
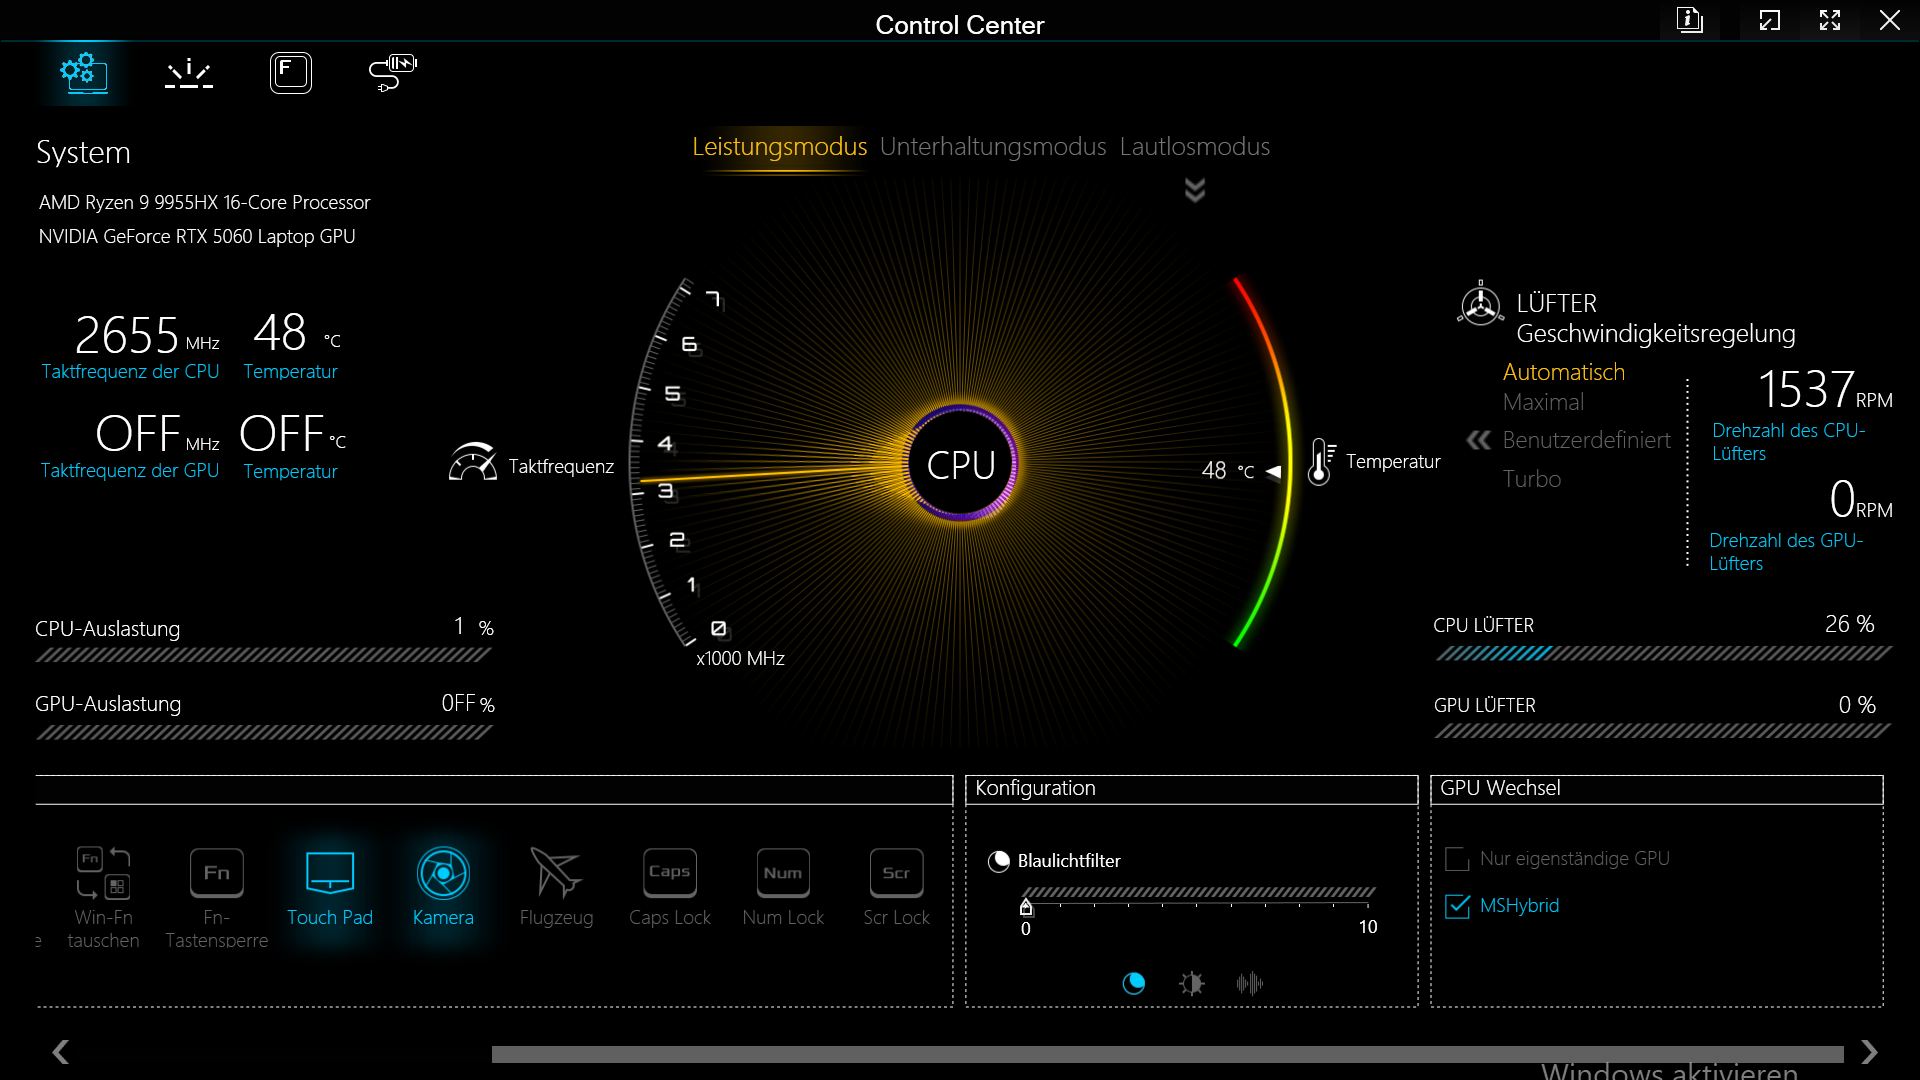
Pour l'analyse comparative, nous avons utilisé le mode Performance (Performance, Divertissement, Silencieux) dans le centre de contrôle.
| Mode Performance | Cinebench R15 Multi | Fire Strike Graphique | Cyberpunk 2077 FHD Ultra (fps) | Bruit du ventilateur Cyberpunk (dB) | Consommation électrique Cyberpunk (W) |
|---|---|---|---|---|---|
| Performances | 5739 | 33011 | 84.4 | 55.05 | 220 |
| Divertissement | 4921 | 29792 | 74,4 | 40,5 - 43,5 | 170 |
| Silence | 1227 | 23364 | 34,9 | 29 | 100 |
| Batterie (performance) | 2759 | 2578 | 30 | 23,5 - 33,5 |
Processeur - Première place dans la boucle Cinebench
Le AMD Ryzen 9 9955HX avec 16 cœurs Zen 5 offre des performances extrêmement constantes dans la boucle Cinebench - et les scores de CPU les plus élevés dans le domaine de la comparaison.
En mode divertissement, plus silencieux, les performances de Cinebench R15 égalent encore celles de l'ordinateur de bureau de Legion 7. Sur batterie, les performances du processeur chutent de plus de 50 %, mais restent comparables à celles d'une Katana 17 ou d'un Omen 17z.
Cinebench R15 Multi Loop
Cinebench R23: Multi Core | Single Core
Cinebench R20: CPU (Multi Core) | CPU (Single Core)
Cinebench R15: CPU Multi 64Bit | CPU Single 64Bit
Blender: v2.79 BMW27 CPU
7-Zip 18.03: 7z b 4 | 7z b 4 -mmt1
Geekbench 6.6: Multi-Core | Single-Core
Geekbench 5.5: Multi-Core | Single-Core
HWBOT x265 Benchmark v2.2: 4k Preset
LibreOffice : 20 Documents To PDF
R Benchmark 2.5: Overall mean
| CPU Performance rating | |
| Moyenne AMD Ryzen 9 9955HX | |
| Schenker XMG Apex 17 M25 | |
| Lenovo Legion 7 16IAX10 | |
| MSI Crosshair A17 HX D8WGKG | |
| Moyenne de la classe Gaming | |
| MSI Katana 17 HX B14WGK | |
| HP Omen 17z-db100 | |
| Acer Nitro v 17 (ANV17-41-R4CJ) | |
| Cinebench R23 / Multi Core | |
| Moyenne AMD Ryzen 9 9955HX (35960 - 39690, n=9) | |
| Schenker XMG Apex 17 M25 | |
| Lenovo Legion 7 16IAX10 | |
| MSI Crosshair A17 HX D8WGKG | |
| Moyenne de la classe Gaming (10488 - 40970, n=125, 2 dernières années) | |
| HP Omen 17z-db100 | |
| MSI Katana 17 HX B14WGK | |
| Acer Nitro v 17 (ANV17-41-R4CJ) | |
| Cinebench R23 / Single Core | |
| Schenker XMG Apex 17 M25 | |
| Lenovo Legion 7 16IAX10 | |
| Moyenne AMD Ryzen 9 9955HX (1828 - 2183, n=9) | |
| Moyenne de la classe Gaming (1166 - 2267, n=125, 2 dernières années) | |
| MSI Katana 17 HX B14WGK | |
| HP Omen 17z-db100 | |
| MSI Crosshair A17 HX D8WGKG | |
| Acer Nitro v 17 (ANV17-41-R4CJ) | |
| Cinebench R20 / CPU (Multi Core) | |
| Moyenne AMD Ryzen 9 9955HX (13963 - 15524, n=9) | |
| Schenker XMG Apex 17 M25 | |
| Lenovo Legion 7 16IAX10 | |
| MSI Crosshair A17 HX D8WGKG | |
| Moyenne de la classe Gaming (4029 - 16108, n=124, 2 dernières années) | |
| HP Omen 17z-db100 | |
| Acer Nitro v 17 (ANV17-41-R4CJ) | |
| MSI Katana 17 HX B14WGK | |
| Cinebench R20 / CPU (Single Core) | |
| Schenker XMG Apex 17 M25 | |
| Moyenne AMD Ryzen 9 9955HX (819 - 856, n=9) | |
| Lenovo Legion 7 16IAX10 | |
| HP Omen 17z-db100 | |
| Moyenne de la classe Gaming (442 - 870, n=124, 2 dernières années) | |
| MSI Katana 17 HX B14WGK | |
| MSI Crosshair A17 HX D8WGKG | |
| Acer Nitro v 17 (ANV17-41-R4CJ) | |
| Cinebench R15 / CPU Multi 64Bit | |
| Moyenne AMD Ryzen 9 9955HX (5624 - 6103, n=9) | |
| Schenker XMG Apex 17 M25 | |
| MSI Crosshair A17 HX D8WGKG | |
| Lenovo Legion 7 16IAX10 | |
| Moyenne de la classe Gaming (1578 - 6271, n=125, 2 dernières années) | |
| MSI Katana 17 HX B14WGK | |
| HP Omen 17z-db100 | |
| Acer Nitro v 17 (ANV17-41-R4CJ) | |
| Cinebench R15 / CPU Single 64Bit | |
| Schenker XMG Apex 17 M25 | |
| Moyenne AMD Ryzen 9 9955HX (320 - 338, n=9) | |
| Lenovo Legion 7 16IAX10 | |
| HP Omen 17z-db100 | |
| Moyenne de la classe Gaming (188.8 - 343, n=124, 2 dernières années) | |
| MSI Crosshair A17 HX D8WGKG | |
| MSI Katana 17 HX B14WGK | |
| Acer Nitro v 17 (ANV17-41-R4CJ) | |
| Blender / v2.79 BMW27 CPU | |
| MSI Katana 17 HX B14WGK | |
| Acer Nitro v 17 (ANV17-41-R4CJ) | |
| HP Omen 17z-db100 | |
| Moyenne de la classe Gaming (80 - 330, n=121, 2 dernières années) | |
| Lenovo Legion 7 16IAX10 | |
| MSI Crosshair A17 HX D8WGKG | |
| Schenker XMG Apex 17 M25 | |
| Moyenne AMD Ryzen 9 9955HX (80 - 91, n=9) | |
| 7-Zip 18.03 / 7z b 4 | |
| Moyenne AMD Ryzen 9 9955HX (132435 - 144064, n=9) | |
| MSI Crosshair A17 HX D8WGKG | |
| Schenker XMG Apex 17 M25 | |
| Lenovo Legion 7 16IAX10 | |
| Moyenne de la classe Gaming (33491 - 148086, n=122, 2 dernières années) | |
| MSI Katana 17 HX B14WGK | |
| Acer Nitro v 17 (ANV17-41-R4CJ) | |
| HP Omen 17z-db100 | |
| 7-Zip 18.03 / 7z b 4 -mmt1 | |
| Schenker XMG Apex 17 M25 | |
| MSI Crosshair A17 HX D8WGKG | |
| Moyenne AMD Ryzen 9 9955HX (7061 - 7462, n=9) | |
| Acer Nitro v 17 (ANV17-41-R4CJ) | |
| Lenovo Legion 7 16IAX10 | |
| Moyenne de la classe Gaming (4199 - 7508, n=122, 2 dernières années) | |
| MSI Katana 17 HX B14WGK | |
| HP Omen 17z-db100 | |
| Geekbench 6.6 / Multi-Core | |
| Schenker XMG Apex 17 M25 | |
| Moyenne AMD Ryzen 9 9955HX (16313 - 19725, n=9) | |
| Lenovo Legion 7 16IAX10 | |
| MSI Crosshair A17 HX D8WGKG | |
| Moyenne de la classe Gaming (6625 - 22104, n=123, 2 dernières années) | |
| MSI Katana 17 HX B14WGK | |
| HP Omen 17z-db100 | |
| Acer Nitro v 17 (ANV17-41-R4CJ) | |
| Geekbench 6.6 / Single-Core | |
| Schenker XMG Apex 17 M25 | |
| Moyenne AMD Ryzen 9 9955HX (3156 - 3259, n=9) | |
| Lenovo Legion 7 16IAX10 | |
| MSI Crosshair A17 HX D8WGKG | |
| Moyenne de la classe Gaming (1490 - 3259, n=123, 2 dernières années) | |
| MSI Katana 17 HX B14WGK | |
| Acer Nitro v 17 (ANV17-41-R4CJ) | |
| HP Omen 17z-db100 | |
| Geekbench 5.5 / Multi-Core | |
| Moyenne AMD Ryzen 9 9955HX (20576 - 22716, n=9) | |
| Schenker XMG Apex 17 M25 | |
| MSI Crosshair A17 HX D8WGKG | |
| Lenovo Legion 7 16IAX10 | |
| Moyenne de la classe Gaming (6460 - 27010, n=122, 2 dernières années) | |
| MSI Katana 17 HX B14WGK | |
| HP Omen 17z-db100 | |
| Acer Nitro v 17 (ANV17-41-R4CJ) | |
| Geekbench 5.5 / Single-Core | |
| Schenker XMG Apex 17 M25 | |
| Moyenne AMD Ryzen 9 9955HX (2307 - 2474, n=9) | |
| Lenovo Legion 7 16IAX10 | |
| Moyenne de la classe Gaming (986 - 2474, n=122, 2 dernières années) | |
| MSI Katana 17 HX B14WGK | |
| MSI Crosshair A17 HX D8WGKG | |
| Acer Nitro v 17 (ANV17-41-R4CJ) | |
| HP Omen 17z-db100 | |
| HWBOT x265 Benchmark v2.2 / 4k Preset | |
| Moyenne AMD Ryzen 9 9955HX (38.9 - 43, n=9) | |
| Schenker XMG Apex 17 M25 | |
| MSI Crosshair A17 HX D8WGKG | |
| Lenovo Legion 7 16IAX10 | |
| Moyenne de la classe Gaming (11.5 - 44.3, n=122, 2 dernières années) | |
| HP Omen 17z-db100 | |
| Acer Nitro v 17 (ANV17-41-R4CJ) | |
| MSI Katana 17 HX B14WGK | |
| LibreOffice / 20 Documents To PDF | |
| Acer Nitro v 17 (ANV17-41-R4CJ) | |
| MSI Katana 17 HX B14WGK | |
| Schenker XMG Apex 17 M25 | |
| HP Omen 17z-db100 | |
| Moyenne de la classe Gaming (19 - 88.8, n=122, 2 dernières années) | |
| Moyenne AMD Ryzen 9 9955HX (42.2 - 52.4, n=9) | |
| MSI Crosshair A17 HX D8WGKG | |
| Lenovo Legion 7 16IAX10 | |
| R Benchmark 2.5 / Overall mean | |
| Acer Nitro v 17 (ANV17-41-R4CJ) | |
| MSI Crosshair A17 HX D8WGKG | |
| Moyenne de la classe Gaming (0.3439 - 0.759, n=123, 2 dernières années) | |
| Lenovo Legion 7 16IAX10 | |
| MSI Katana 17 HX B14WGK | |
| HP Omen 17z-db100 | |
| Schenker XMG Apex 17 M25 | |
| Moyenne AMD Ryzen 9 9955HX (0.3439 - 0.3737, n=9) | |
* ... Moindre est la valeur, meilleures sont les performances
AIDA64: FP32 Ray-Trace | FPU Julia | CPU SHA3 | CPU Queen | FPU SinJulia | FPU Mandel | CPU AES | CPU ZLib | FP64 Ray-Trace | CPU PhotoWorxx
| Performance rating | |
| Moyenne AMD Ryzen 9 9955HX | |
| Schenker XMG Apex 17 M25 | |
| MSI Crosshair A17 HX D8WGKG | |
| Lenovo Legion 7 16IAX10 | |
| Moyenne de la classe Gaming | |
| HP Omen 17z-db100 | |
| Acer Nitro v 17 (ANV17-41-R4CJ) | |
| MSI Katana 17 HX B14WGK | |
| AIDA64 / FP32 Ray-Trace | |
| Moyenne AMD Ryzen 9 9955HX (66596 - 85542, n=9) | |
| Schenker XMG Apex 17 M25 | |
| MSI Crosshair A17 HX D8WGKG | |
| Moyenne de la classe Gaming (10227 - 85542, n=122, 2 dernières années) | |
| Lenovo Legion 7 16IAX10 | |
| HP Omen 17z-db100 | |
| Acer Nitro v 17 (ANV17-41-R4CJ) | |
| MSI Katana 17 HX B14WGK | |
| AIDA64 / FPU Julia | |
| Moyenne AMD Ryzen 9 9955HX (191535 - 232031, n=9) | |
| Schenker XMG Apex 17 M25 | |
| MSI Crosshair A17 HX D8WGKG | |
| Lenovo Legion 7 16IAX10 | |
| Moyenne de la classe Gaming (51376 - 238426, n=122, 2 dernières années) | |
| Acer Nitro v 17 (ANV17-41-R4CJ) | |
| HP Omen 17z-db100 | |
| MSI Katana 17 HX B14WGK | |
| AIDA64 / CPU SHA3 | |
| Moyenne AMD Ryzen 9 9955HX (8489 - 9780, n=9) | |
| MSI Crosshair A17 HX D8WGKG | |
| Schenker XMG Apex 17 M25 | |
| Lenovo Legion 7 16IAX10 | |
| Moyenne de la classe Gaming (2180 - 9817, n=122, 2 dernières années) | |
| Acer Nitro v 17 (ANV17-41-R4CJ) | |
| HP Omen 17z-db100 | |
| MSI Katana 17 HX B14WGK | |
| AIDA64 / CPU Queen | |
| MSI Crosshair A17 HX D8WGKG | |
| Moyenne AMD Ryzen 9 9955HX (153027 - 164154, n=9) | |
| Schenker XMG Apex 17 M25 | |
| Lenovo Legion 7 16IAX10 | |
| Moyenne de la classe Gaming (49785 - 173351, n=120, 2 dernières années) | |
| Acer Nitro v 17 (ANV17-41-R4CJ) | |
| MSI Katana 17 HX B14WGK | |
| HP Omen 17z-db100 | |
| AIDA64 / FPU SinJulia | |
| Moyenne AMD Ryzen 9 9955HX (29876 - 32647, n=9) | |
| Schenker XMG Apex 17 M25 | |
| MSI Crosshair A17 HX D8WGKG | |
| Acer Nitro v 17 (ANV17-41-R4CJ) | |
| Moyenne de la classe Gaming (4424 - 33636, n=122, 2 dernières années) | |
| HP Omen 17z-db100 | |
| Lenovo Legion 7 16IAX10 | |
| MSI Katana 17 HX B14WGK | |
| AIDA64 / FPU Mandel | |
| Moyenne AMD Ryzen 9 9955HX (101131 - 128721, n=9) | |
| MSI Crosshair A17 HX D8WGKG | |
| Schenker XMG Apex 17 M25 | |
| Lenovo Legion 7 16IAX10 | |
| Moyenne de la classe Gaming (25115 - 128721, n=122, 2 dernières années) | |
| HP Omen 17z-db100 | |
| Acer Nitro v 17 (ANV17-41-R4CJ) | |
| MSI Katana 17 HX B14WGK | |
| AIDA64 / CPU AES | |
| Moyenne AMD Ryzen 9 9955HX (146979 - 218385, n=9) | |
| MSI Crosshair A17 HX D8WGKG | |
| Schenker XMG Apex 17 M25 | |
| Lenovo Legion 7 16IAX10 | |
| Moyenne de la classe Gaming (39258 - 247074, n=122, 2 dernières années) | |
| HP Omen 17z-db100 | |
| Acer Nitro v 17 (ANV17-41-R4CJ) | |
| MSI Katana 17 HX B14WGK | |
| AIDA64 / CPU ZLib | |
| Moyenne AMD Ryzen 9 9955HX (2186 - 2531, n=9) | |
| Schenker XMG Apex 17 M25 | |
| MSI Crosshair A17 HX D8WGKG | |
| Lenovo Legion 7 16IAX10 | |
| Moyenne de la classe Gaming (574 - 2531, n=122, 2 dernières années) | |
| HP Omen 17z-db100 | |
| Acer Nitro v 17 (ANV17-41-R4CJ) | |
| MSI Katana 17 HX B14WGK | |
| AIDA64 / FP64 Ray-Trace | |
| Moyenne AMD Ryzen 9 9955HX (35252 - 45446, n=9) | |
| Schenker XMG Apex 17 M25 | |
| MSI Crosshair A17 HX D8WGKG | |
| Lenovo Legion 7 16IAX10 | |
| Moyenne de la classe Gaming (5509 - 45446, n=122, 2 dernières années) | |
| HP Omen 17z-db100 | |
| Acer Nitro v 17 (ANV17-41-R4CJ) | |
| MSI Katana 17 HX B14WGK | |
| AIDA64 / CPU PhotoWorxx | |
| Lenovo Legion 7 16IAX10 | |
| HP Omen 17z-db100 | |
| Moyenne de la classe Gaming (12271 - 62916, n=122, 2 dernières années) | |
| Schenker XMG Apex 17 M25 | |
| Moyenne AMD Ryzen 9 9955HX (35974 - 42495, n=9) | |
| MSI Crosshair A17 HX D8WGKG | |
| MSI Katana 17 HX B14WGK | |
| Acer Nitro v 17 (ANV17-41-R4CJ) | |
Performance du système
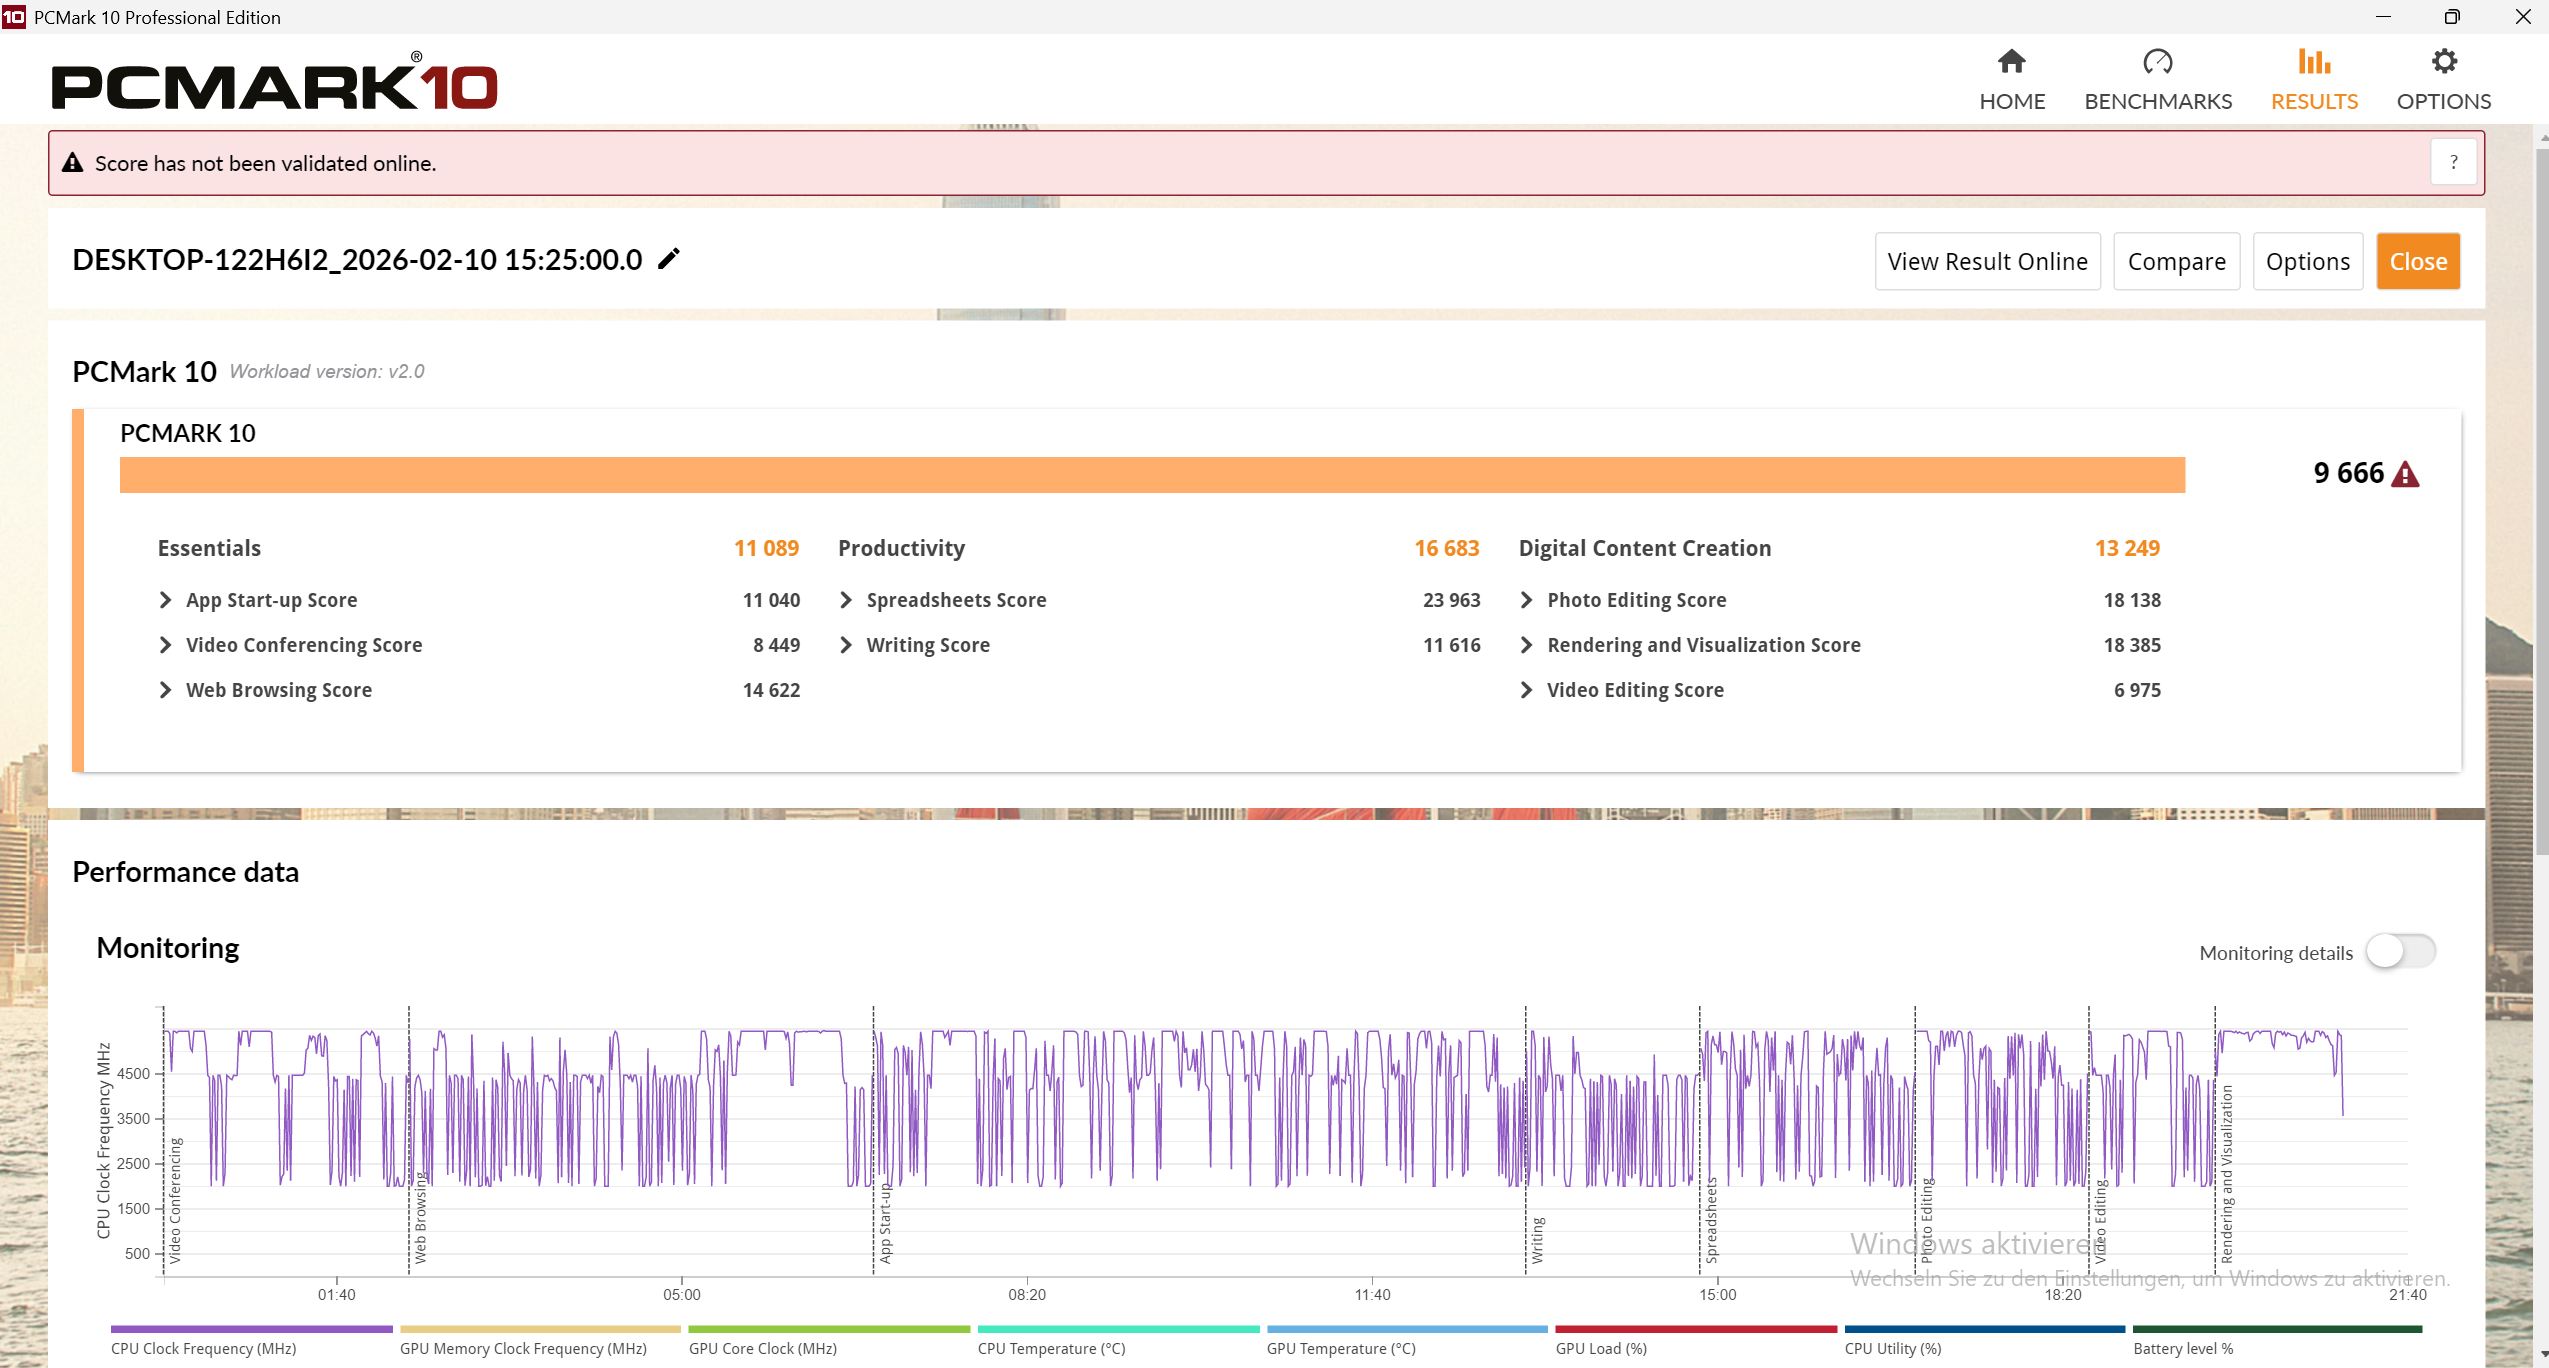
Dans PCMark 10 et CrossMark, l'Apex devance le groupe de comparaison. D'un point de vue subjectif, le système est très réactif. Les résultats des tests de mémoire AIDA sont moyens.
PCMark 10: Score | Essentials | Productivity | Digital Content Creation
CrossMark: Overall | Productivity | Creativity | Responsiveness
WebXPRT 3: Overall
WebXPRT 4: Overall
Mozilla Kraken 1.1: Total
| Performance rating | |
| Schenker XMG Apex 17 M25 | |
| Moyenne AMD Ryzen 9 9955HX, NVIDIA GeForce RTX 5060 Laptop | |
| Lenovo Legion 7 16IAX10 | |
| Moyenne de la classe Gaming | |
| MSI Crosshair A17 HX D8WGKG | |
| MSI Katana 17 HX B14WGK | |
| HP Omen 17z-db100 | |
| Acer Nitro v 17 (ANV17-41-R4CJ) | |
| PCMark 10 / Score | |
| Schenker XMG Apex 17 M25 | |
| Moyenne AMD Ryzen 9 9955HX, NVIDIA GeForce RTX 5060 Laptop (n=1) | |
| Moyenne de la classe Gaming (5828 - 10060, n=104, 2 dernières années) | |
| MSI Crosshair A17 HX D8WGKG | |
| Acer Nitro v 17 (ANV17-41-R4CJ) | |
| HP Omen 17z-db100 | |
| Lenovo Legion 7 16IAX10 | |
| MSI Katana 17 HX B14WGK | |
| PCMark 10 / Essentials | |
| HP Omen 17z-db100 | |
| Lenovo Legion 7 16IAX10 | |
| MSI Crosshair A17 HX D8WGKG | |
| Schenker XMG Apex 17 M25 | |
| Moyenne AMD Ryzen 9 9955HX, NVIDIA GeForce RTX 5060 Laptop (n=1) | |
| Moyenne de la classe Gaming (8810 - 12600, n=108, 2 dernières années) | |
| MSI Katana 17 HX B14WGK | |
| Acer Nitro v 17 (ANV17-41-R4CJ) | |
| PCMark 10 / Productivity | |
| Schenker XMG Apex 17 M25 | |
| Moyenne AMD Ryzen 9 9955HX, NVIDIA GeForce RTX 5060 Laptop (n=1) | |
| Acer Nitro v 17 (ANV17-41-R4CJ) | |
| HP Omen 17z-db100 | |
| Moyenne de la classe Gaming (6662 - 16716, n=106, 2 dernières années) | |
| Lenovo Legion 7 16IAX10 | |
| MSI Crosshair A17 HX D8WGKG | |
| MSI Katana 17 HX B14WGK | |
| PCMark 10 / Digital Content Creation | |
| Moyenne de la classe Gaming (7602 - 19351, n=106, 2 dernières années) | |
| MSI Crosshair A17 HX D8WGKG | |
| Schenker XMG Apex 17 M25 | |
| Moyenne AMD Ryzen 9 9955HX, NVIDIA GeForce RTX 5060 Laptop (n=1) | |
| MSI Katana 17 HX B14WGK | |
| Acer Nitro v 17 (ANV17-41-R4CJ) | |
| Lenovo Legion 7 16IAX10 | |
| HP Omen 17z-db100 | |
| CrossMark / Overall | |
| Schenker XMG Apex 17 M25 | |
| Moyenne AMD Ryzen 9 9955HX, NVIDIA GeForce RTX 5060 Laptop (n=1) | |
| Lenovo Legion 7 16IAX10 | |
| MSI Crosshair A17 HX D8WGKG | |
| Moyenne de la classe Gaming (1366 - 2344, n=106, 2 dernières années) | |
| MSI Katana 17 HX B14WGK | |
| HP Omen 17z-db100 | |
| Acer Nitro v 17 (ANV17-41-R4CJ) | |
| CrossMark / Productivity | |
| Schenker XMG Apex 17 M25 | |
| Moyenne AMD Ryzen 9 9955HX, NVIDIA GeForce RTX 5060 Laptop (n=1) | |
| Lenovo Legion 7 16IAX10 | |
| MSI Katana 17 HX B14WGK | |
| Moyenne de la classe Gaming (1386 - 2211, n=106, 2 dernières années) | |
| MSI Crosshair A17 HX D8WGKG | |
| HP Omen 17z-db100 | |
| Acer Nitro v 17 (ANV17-41-R4CJ) | |
| CrossMark / Creativity | |
| Schenker XMG Apex 17 M25 | |
| Moyenne AMD Ryzen 9 9955HX, NVIDIA GeForce RTX 5060 Laptop (n=1) | |
| Lenovo Legion 7 16IAX10 | |
| MSI Crosshair A17 HX D8WGKG | |
| Moyenne de la classe Gaming (1343 - 2729, n=106, 2 dernières années) | |
| HP Omen 17z-db100 | |
| MSI Katana 17 HX B14WGK | |
| Acer Nitro v 17 (ANV17-41-R4CJ) | |
| CrossMark / Responsiveness | |
| Schenker XMG Apex 17 M25 | |
| Moyenne AMD Ryzen 9 9955HX, NVIDIA GeForce RTX 5060 Laptop (n=1) | |
| MSI Katana 17 HX B14WGK | |
| Lenovo Legion 7 16IAX10 | |
| MSI Crosshair A17 HX D8WGKG | |
| Moyenne de la classe Gaming (1226 - 2330, n=106, 2 dernières années) | |
| HP Omen 17z-db100 | |
| Acer Nitro v 17 (ANV17-41-R4CJ) | |
| WebXPRT 3 / Overall | |
| Lenovo Legion 7 16IAX10 | |
| Moyenne de la classe Gaming (237 - 532, n=109, 2 dernières années) | |
| Schenker XMG Apex 17 M25 | |
| Moyenne AMD Ryzen 9 9955HX, NVIDIA GeForce RTX 5060 Laptop (n=1) | |
| MSI Katana 17 HX B14WGK | |
| HP Omen 17z-db100 | |
| Acer Nitro v 17 (ANV17-41-R4CJ) | |
| MSI Crosshair A17 HX D8WGKG | |
| WebXPRT 4 / Overall | |
| Lenovo Legion 7 16IAX10 | |
| Schenker XMG Apex 17 M25 | |
| Moyenne AMD Ryzen 9 9955HX, NVIDIA GeForce RTX 5060 Laptop (n=1) | |
| Moyenne de la classe Gaming (176.4 - 345, n=108, 2 dernières années) | |
| MSI Katana 17 HX B14WGK | |
| HP Omen 17z-db100 | |
| Acer Nitro v 17 (ANV17-41-R4CJ) | |
| MSI Crosshair A17 HX D8WGKG | |
| Mozilla Kraken 1.1 / Total | |
| Acer Nitro v 17 (ANV17-41-R4CJ) | |
| MSI Crosshair A17 HX D8WGKG | |
| MSI Katana 17 HX B14WGK | |
| HP Omen 17z-db100 | |
| Moyenne de la classe Gaming (397 - 594, n=115, 2 dernières années) | |
| Lenovo Legion 7 16IAX10 | |
| Schenker XMG Apex 17 M25 | |
| Moyenne AMD Ryzen 9 9955HX, NVIDIA GeForce RTX 5060 Laptop (n=1) | |
* ... Moindre est la valeur, meilleures sont les performances
| PCMark 10 Score | 9666 points | |
Aide | ||
| AIDA64 / Memory Copy | |
| Lenovo Legion 7 16IAX10 | |
| HP Omen 17z-db100 | |
| Moyenne de la classe Gaming (21750 - 108104, n=122, 2 dernières années) | |
| Schenker XMG Apex 17 M25 | |
| Moyenne AMD Ryzen 9 9955HX (53598 - 62777, n=9) | |
| MSI Katana 17 HX B14WGK | |
| MSI Crosshair A17 HX D8WGKG | |
| Acer Nitro v 17 (ANV17-41-R4CJ) | |
| AIDA64 / Memory Read | |
| Lenovo Legion 7 16IAX10 | |
| Moyenne de la classe Gaming (22956 - 104349, n=122, 2 dernières années) | |
| MSI Katana 17 HX B14WGK | |
| Schenker XMG Apex 17 M25 | |
| Moyenne AMD Ryzen 9 9955HX (63953 - 67256, n=9) | |
| HP Omen 17z-db100 | |
| MSI Crosshair A17 HX D8WGKG | |
| Acer Nitro v 17 (ANV17-41-R4CJ) | |
| AIDA64 / Memory Write | |
| HP Omen 17z-db100 | |
| Lenovo Legion 7 16IAX10 | |
| Moyenne de la classe Gaming (22297 - 133486, n=122, 2 dernières années) | |
| Schenker XMG Apex 17 M25 | |
| Moyenne AMD Ryzen 9 9955HX (65421 - 72060, n=9) | |
| MSI Crosshair A17 HX D8WGKG | |
| MSI Katana 17 HX B14WGK | |
| Acer Nitro v 17 (ANV17-41-R4CJ) | |
| AIDA64 / Memory Latency | |
| Lenovo Legion 7 16IAX10 | |
| Moyenne de la classe Gaming (75.3 - 259, n=122, 2 dernières années) | |
| HP Omen 17z-db100 | |
| Moyenne AMD Ryzen 9 9955HX (92.1 - 103.5, n=9) | |
| Schenker XMG Apex 17 M25 | |
| MSI Katana 17 HX B14WGK | |
| Acer Nitro v 17 (ANV17-41-R4CJ) | |
| MSI Crosshair A17 HX D8WGKG | |
* ... Moindre est la valeur, meilleures sont les performances
Latences DPC
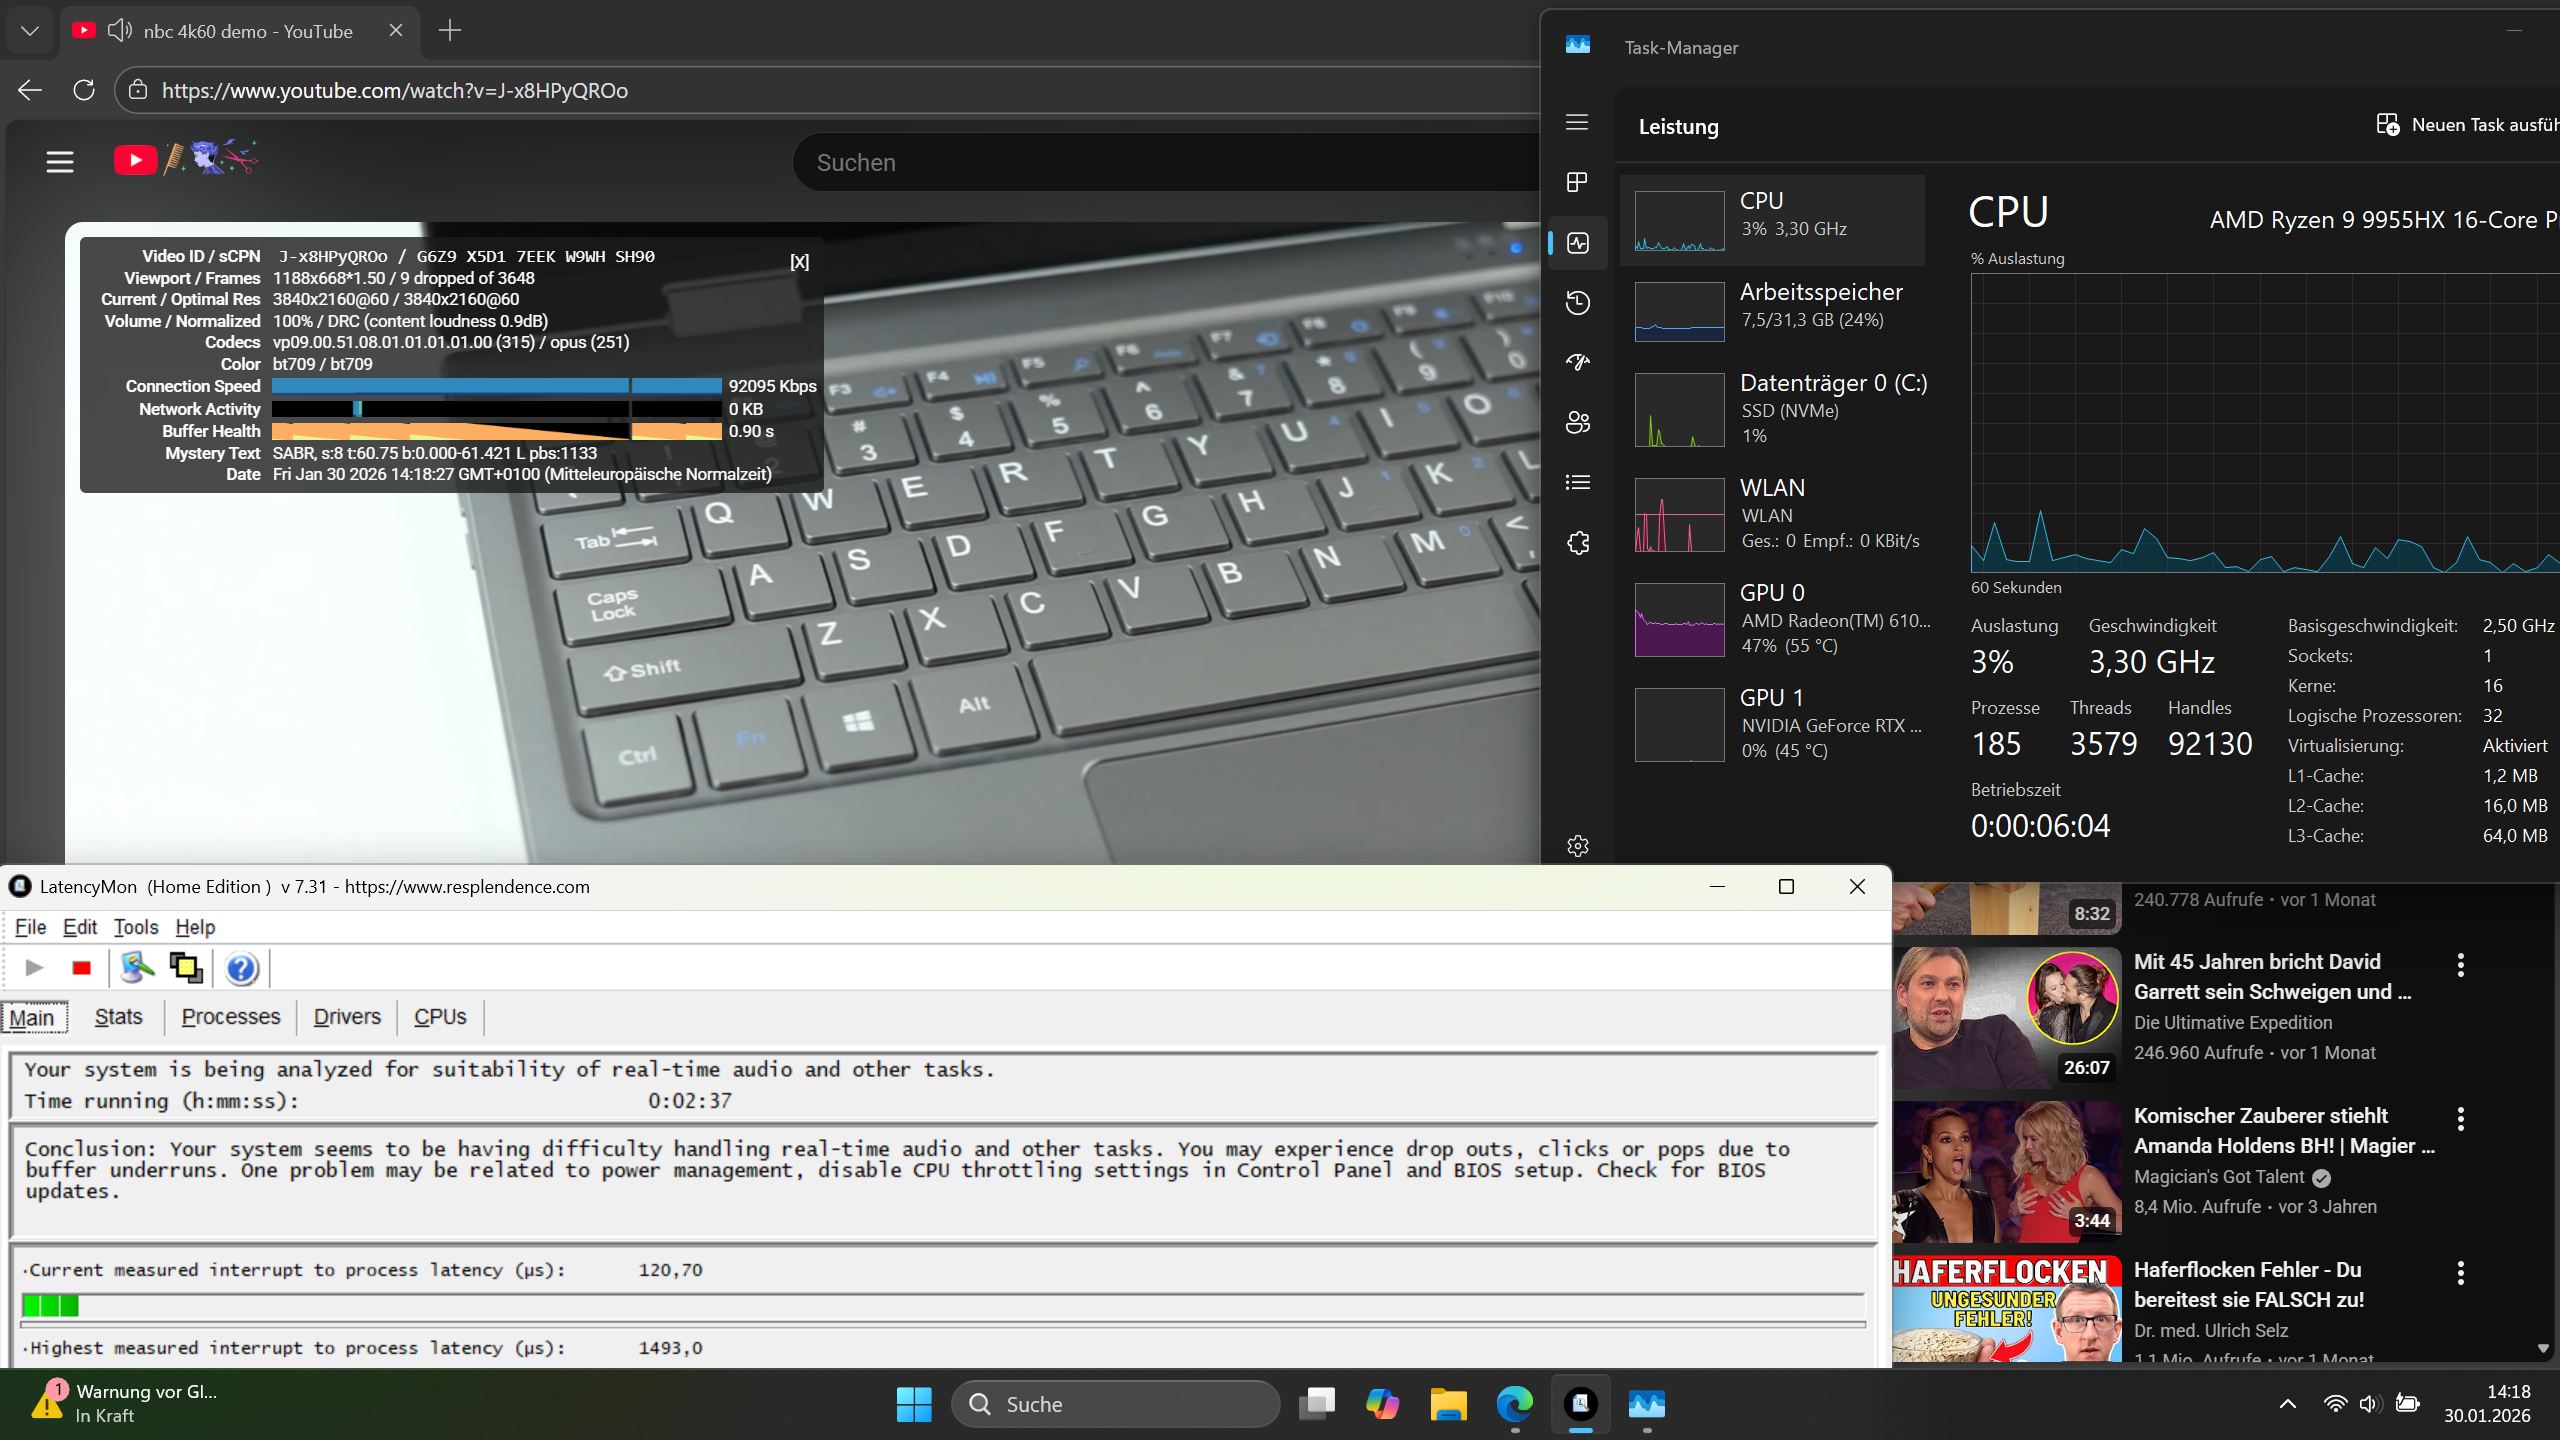
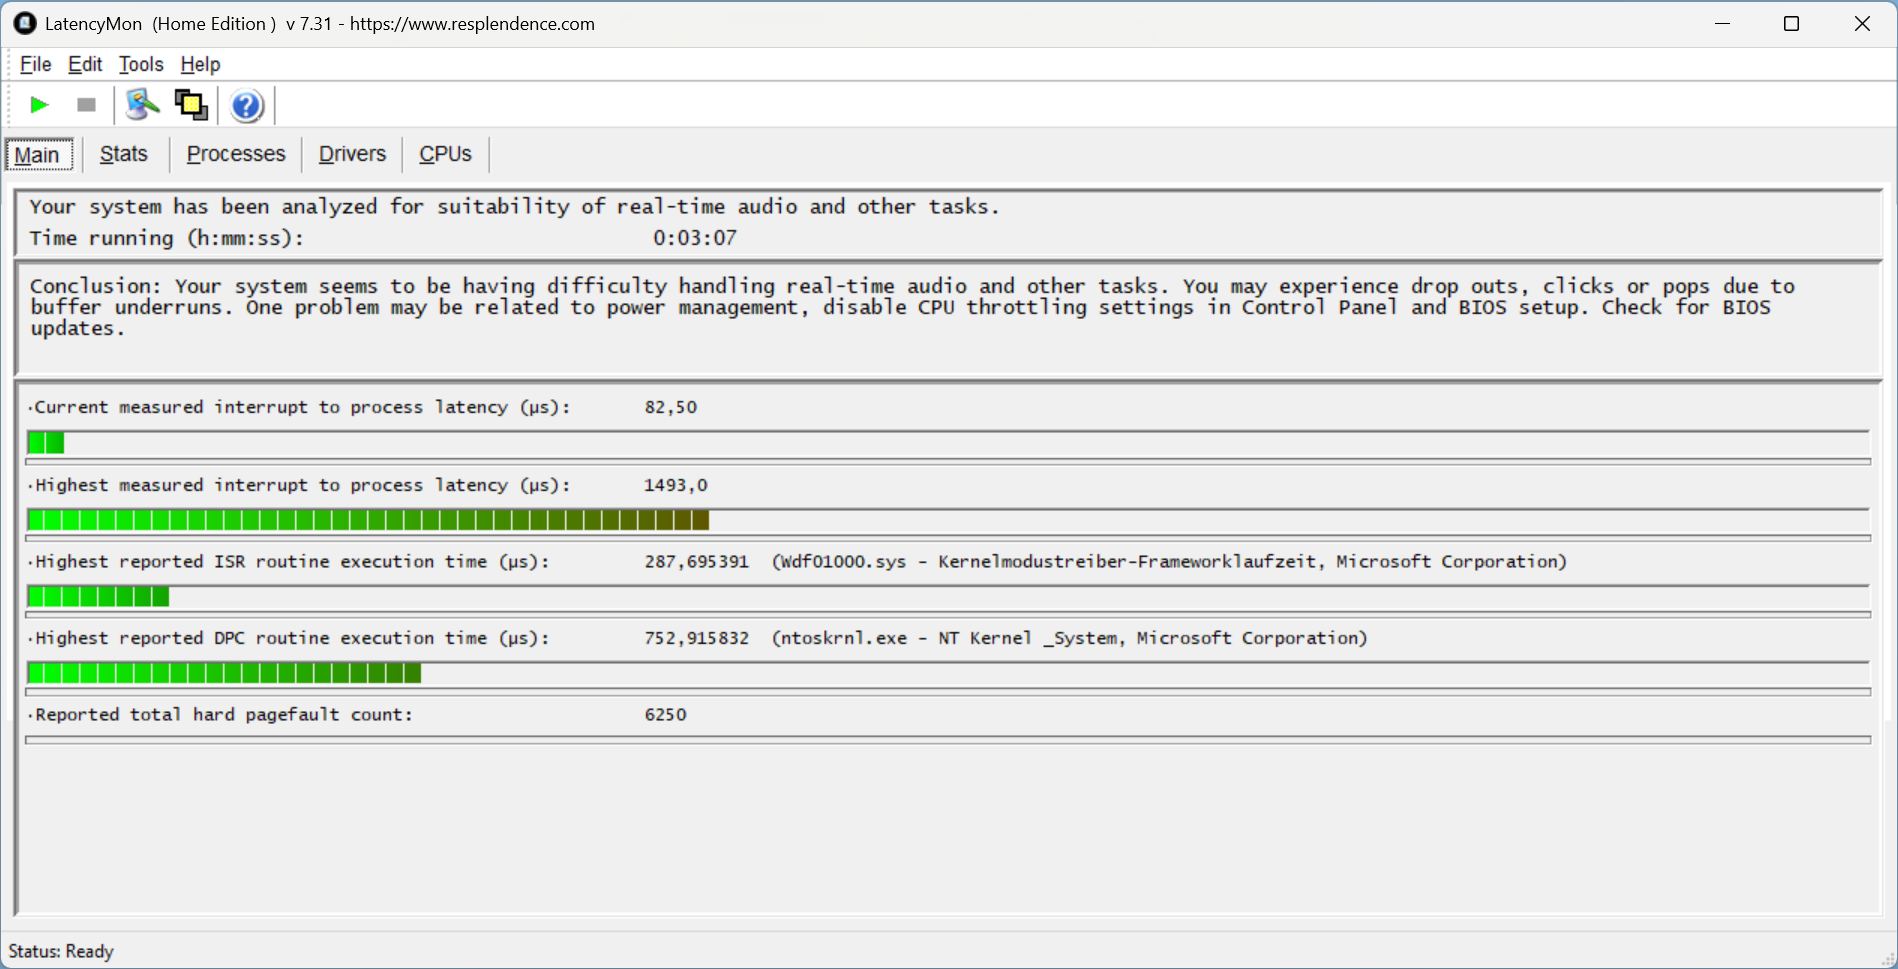
Des pics de latence se produisent lors de l'ouverture de plusieurs onglets du navigateur. Dans l'ensemble, les valeurs restent dans une fourchette acceptable, bien que neuf images aient été perdues lors de la lecture de YouTube.
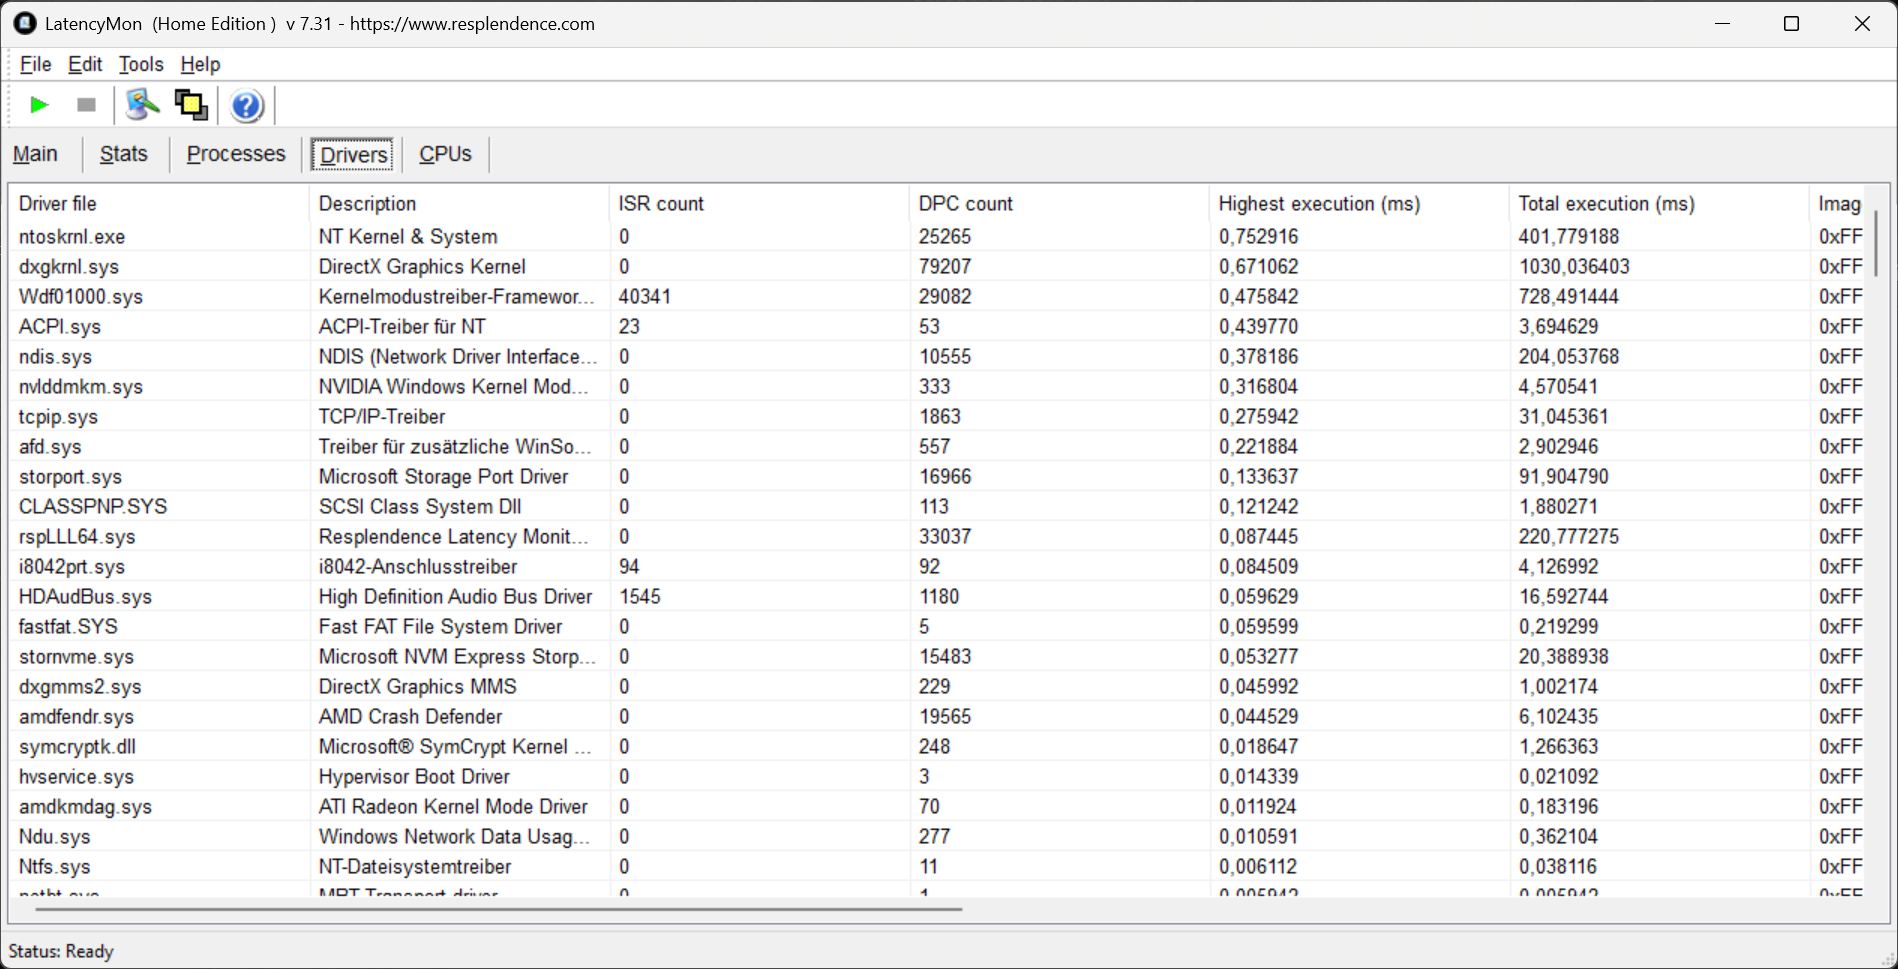
| DPC Latencies / LatencyMon - interrupt to process latency (max), Web, Youtube, Prime95 | |
| HP Omen 17z-db100 | |
| MSI Katana 17 HX B14WGK | |
| Acer Nitro v 17 (ANV17-41-R4CJ) | |
| Schenker XMG Apex 17 M25 | |
| HP Omen 16-ap0091ng | |
| Lenovo Legion 7 16IAX10 | |
| MSI Crosshair A17 HX D8WGKG | |
* ... Moindre est la valeur, meilleures sont les performances
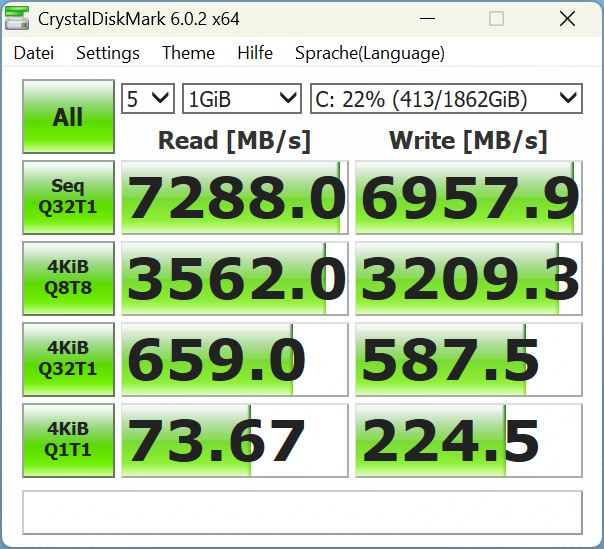
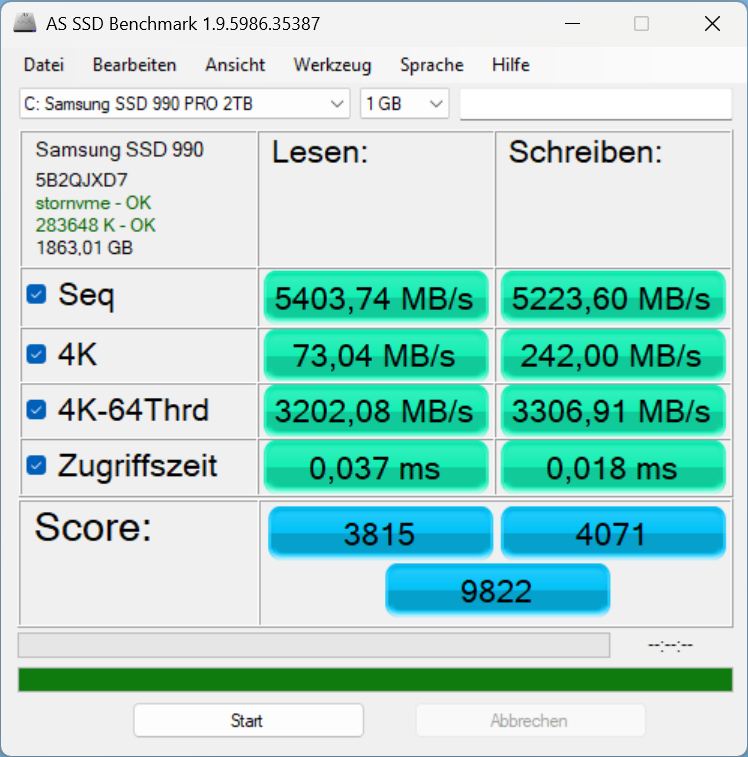
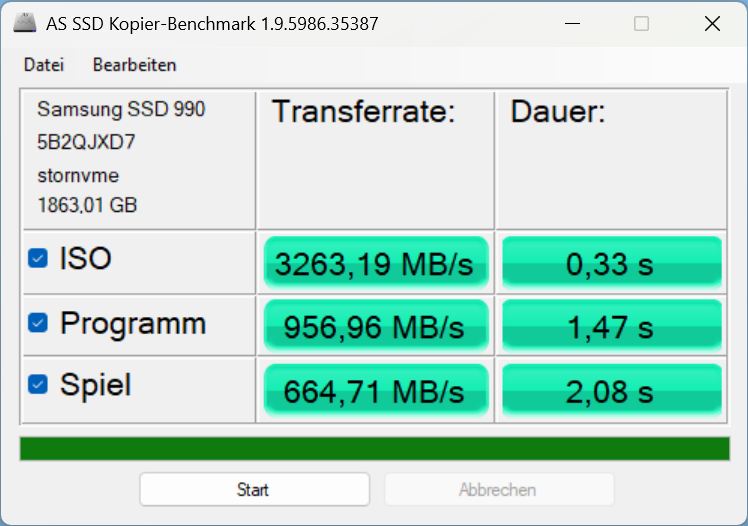
Mémoire de masse
Notre Samsung 990 Pro (2 TB) présente un surcoût de 146 € par rapport au WD Blue SN5100 standard de 1 TB. Les performances restent stables même en cas de charge soutenue et dépassent celles des systèmes concurrents.

* ... Moindre est la valeur, meilleures sont les performances
Lecture continue : Boucle de lecture DiskSpd, profondeur de la file d'attente 8
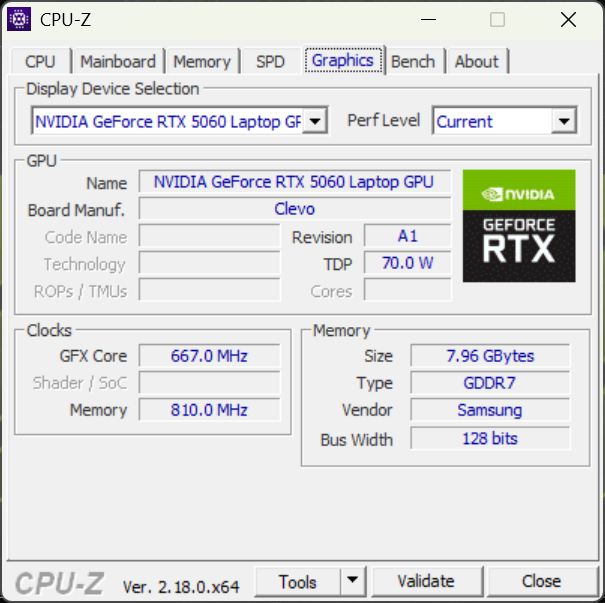
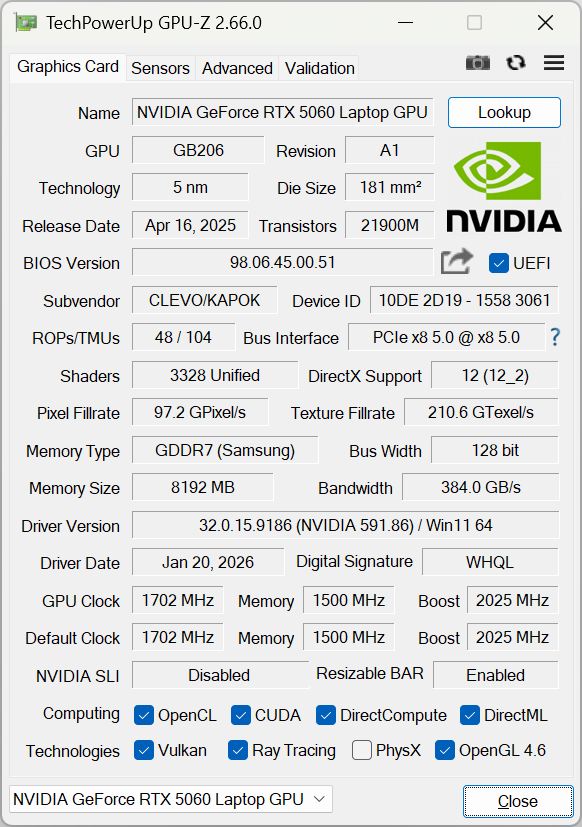
Performances du GPU - Comparaison de l'ordinateur portable RTX 5060 le plus rapide ?
Dans les tests synthétiques 3DMark, la RTX 5060 de l'Apex 17 surpasse clairement les autres RTX 5060 concurrentes. En mode divertissement, ses performances sont comparables à celles de la concurrence. Sur batterie, le GPU passe à 30 fps dans Cyberpunk.
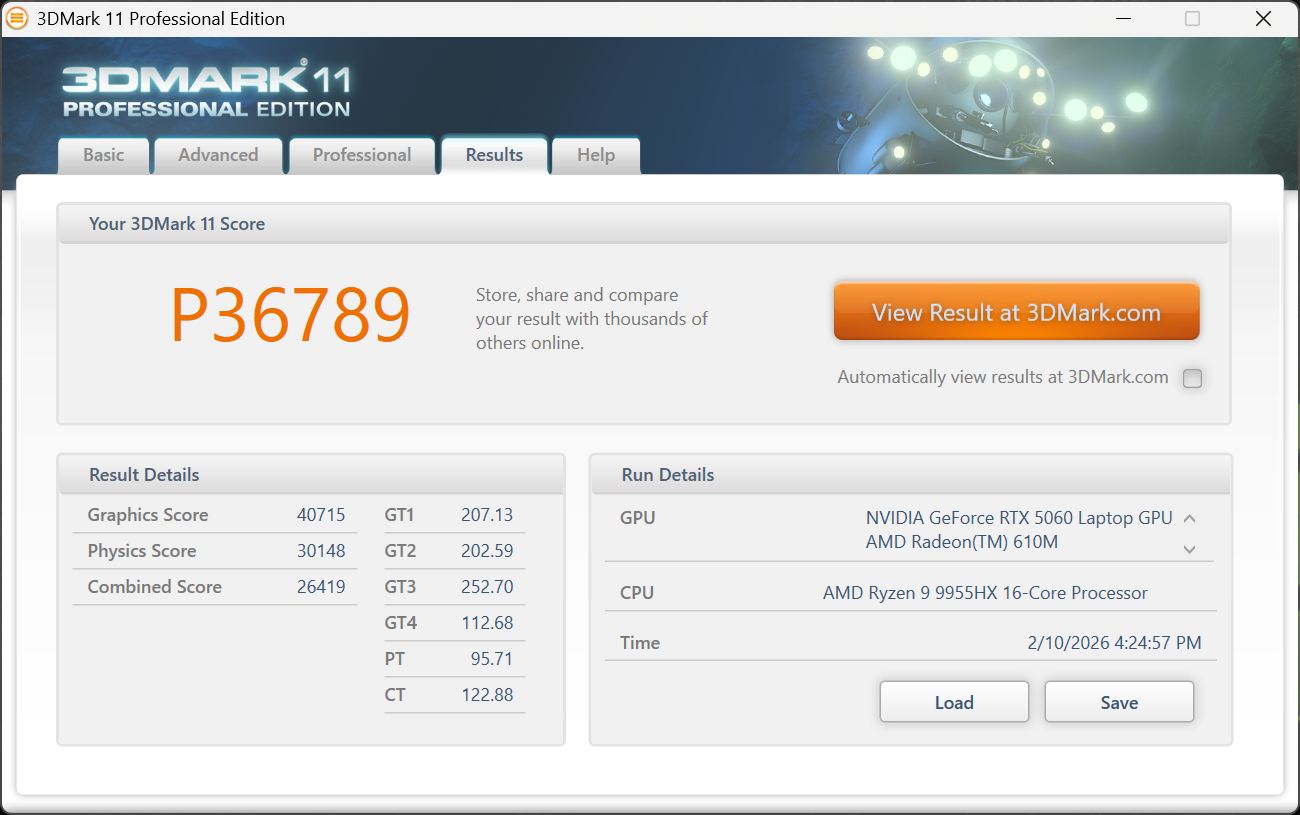
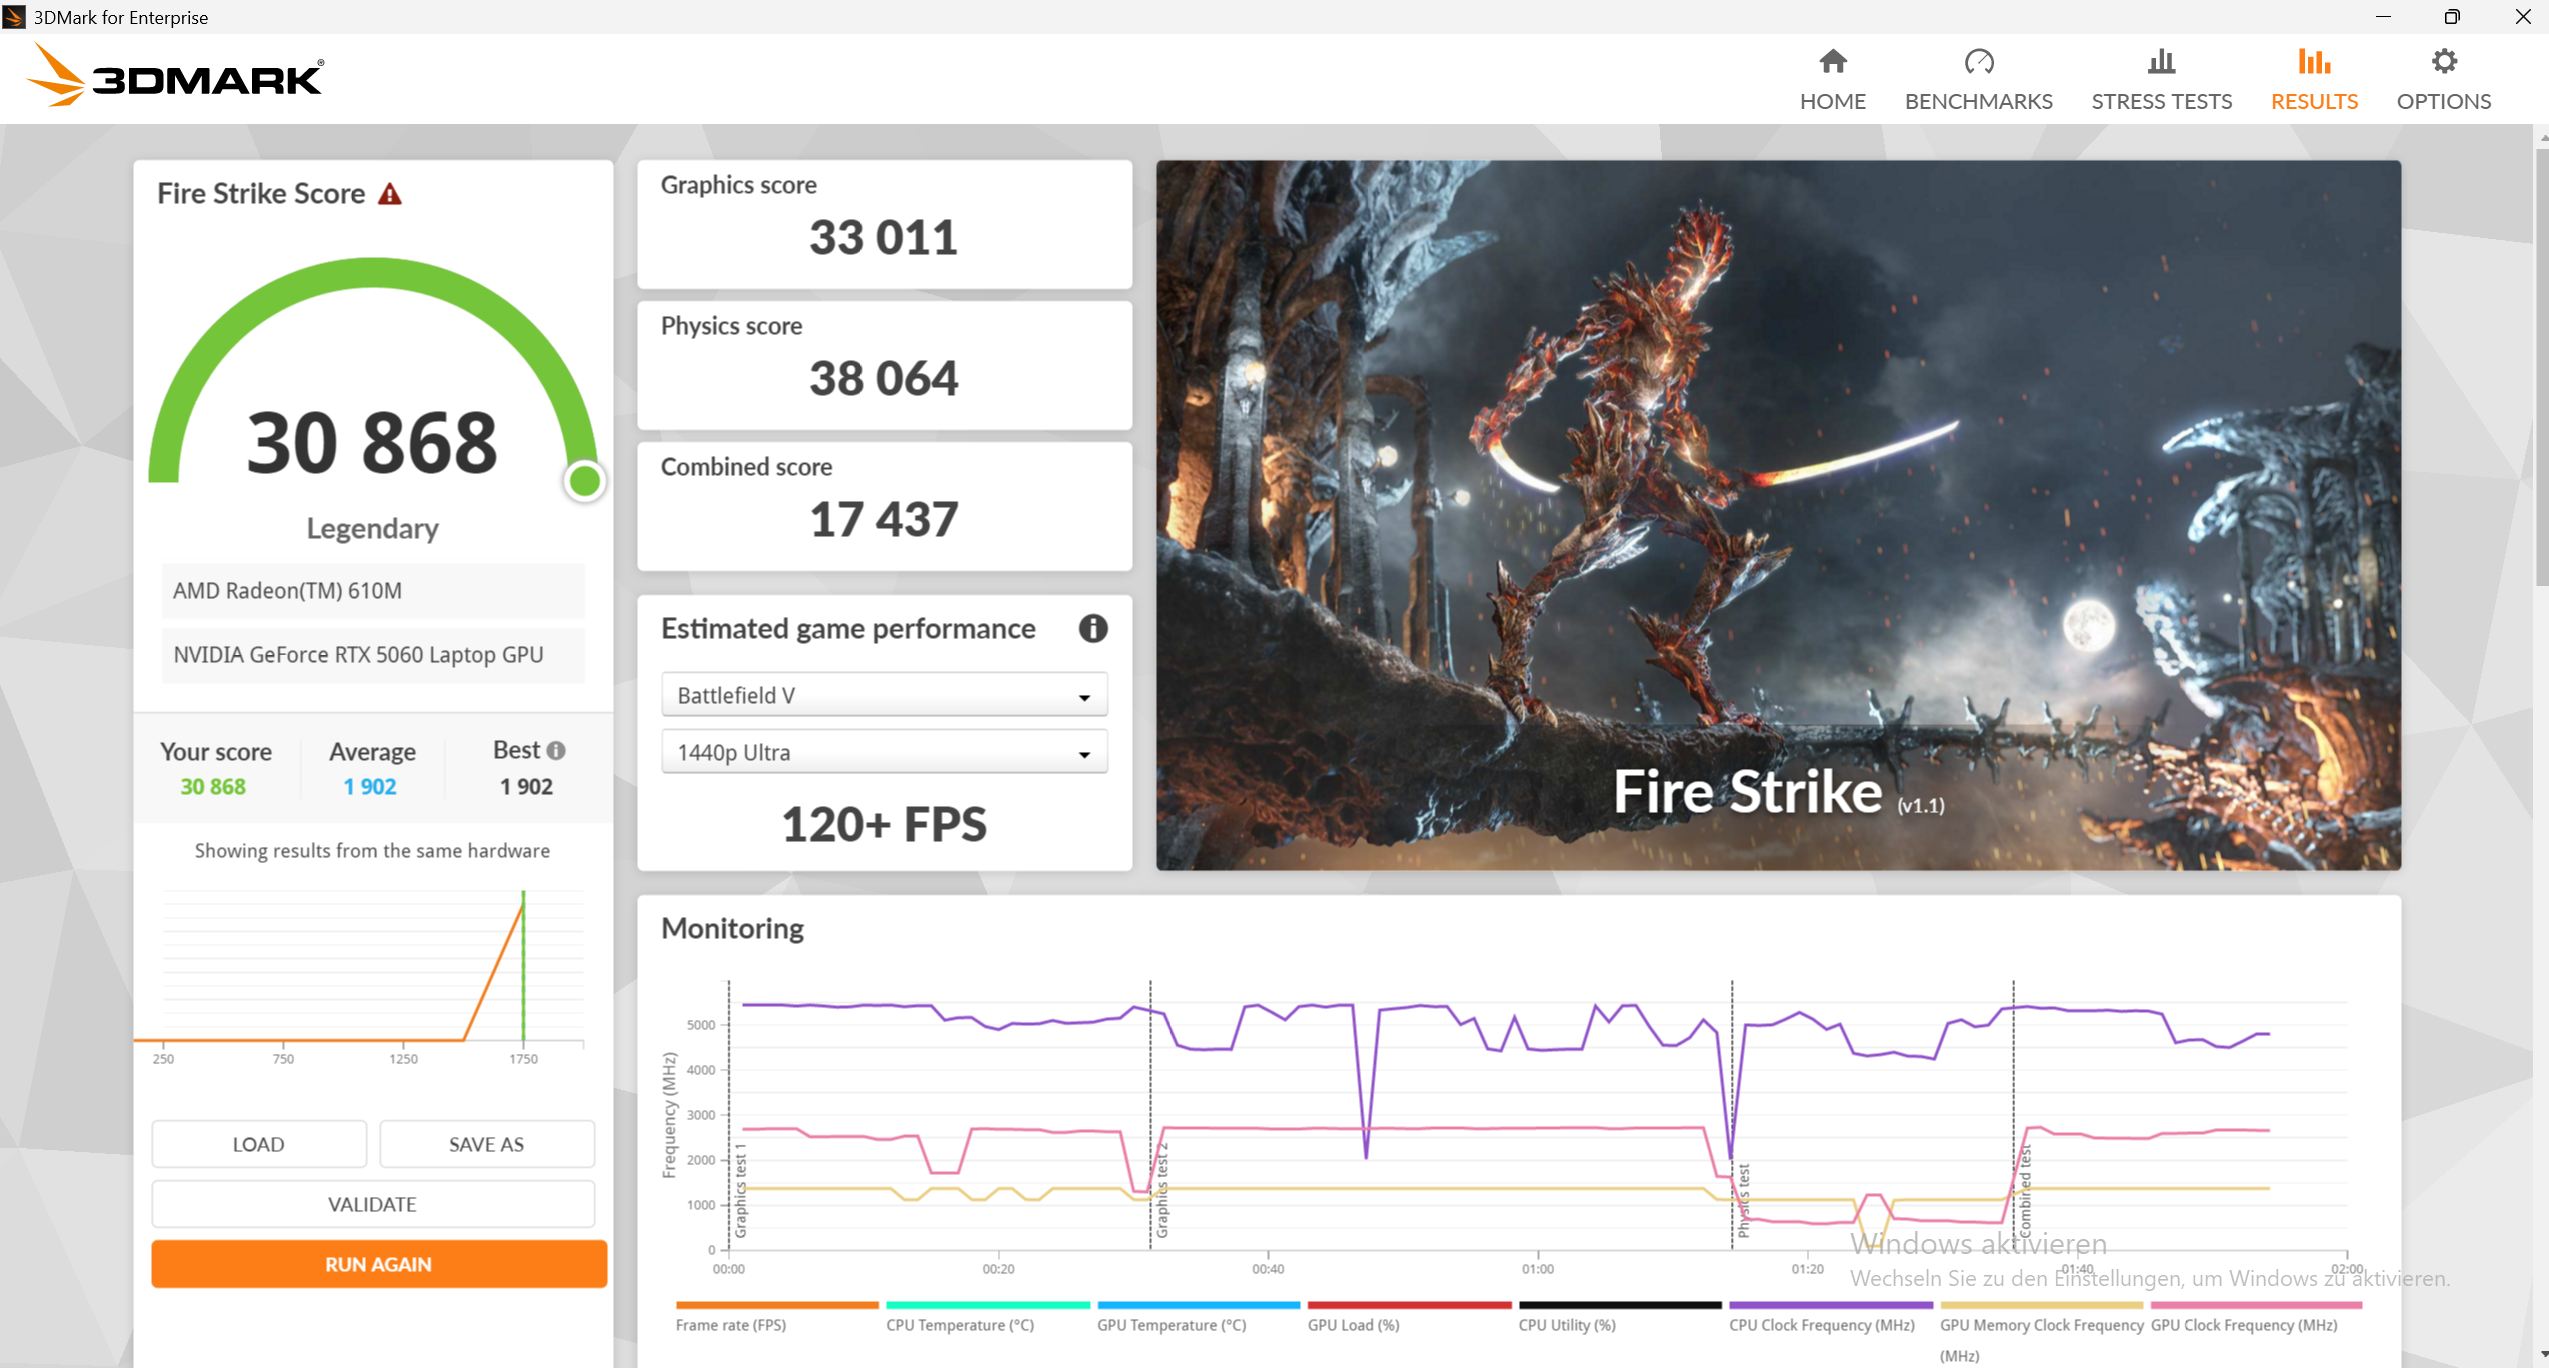
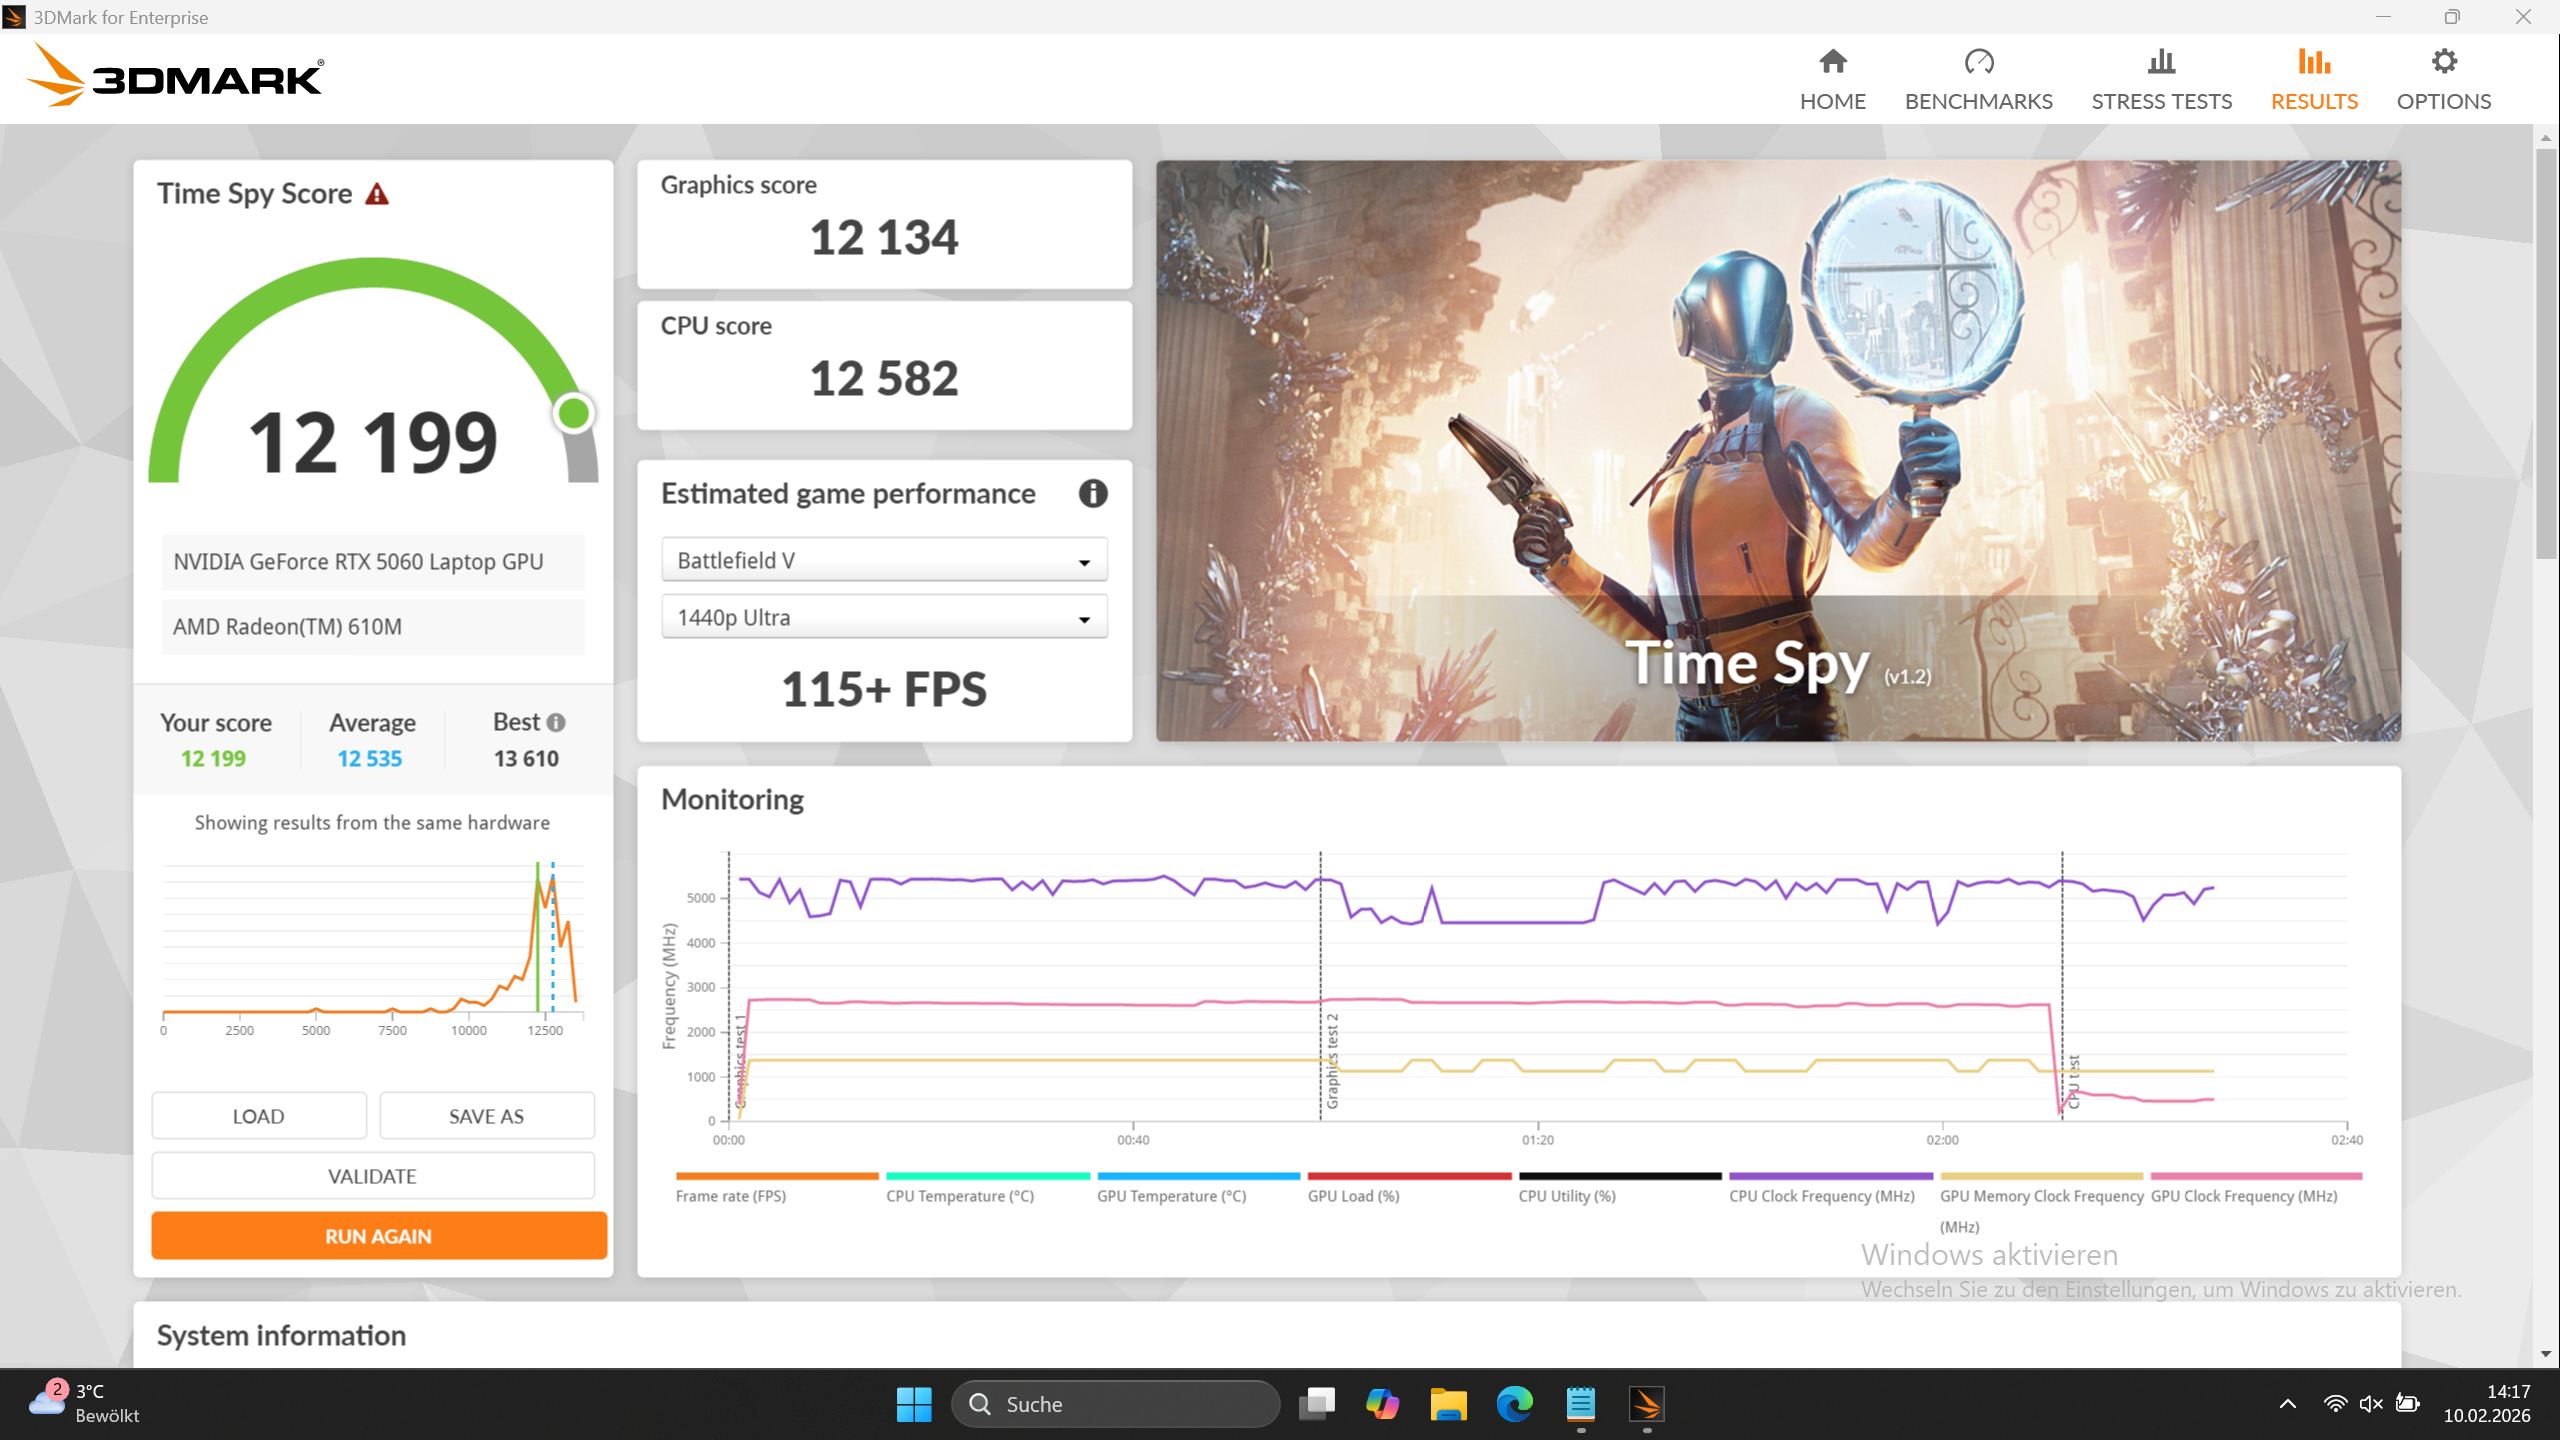
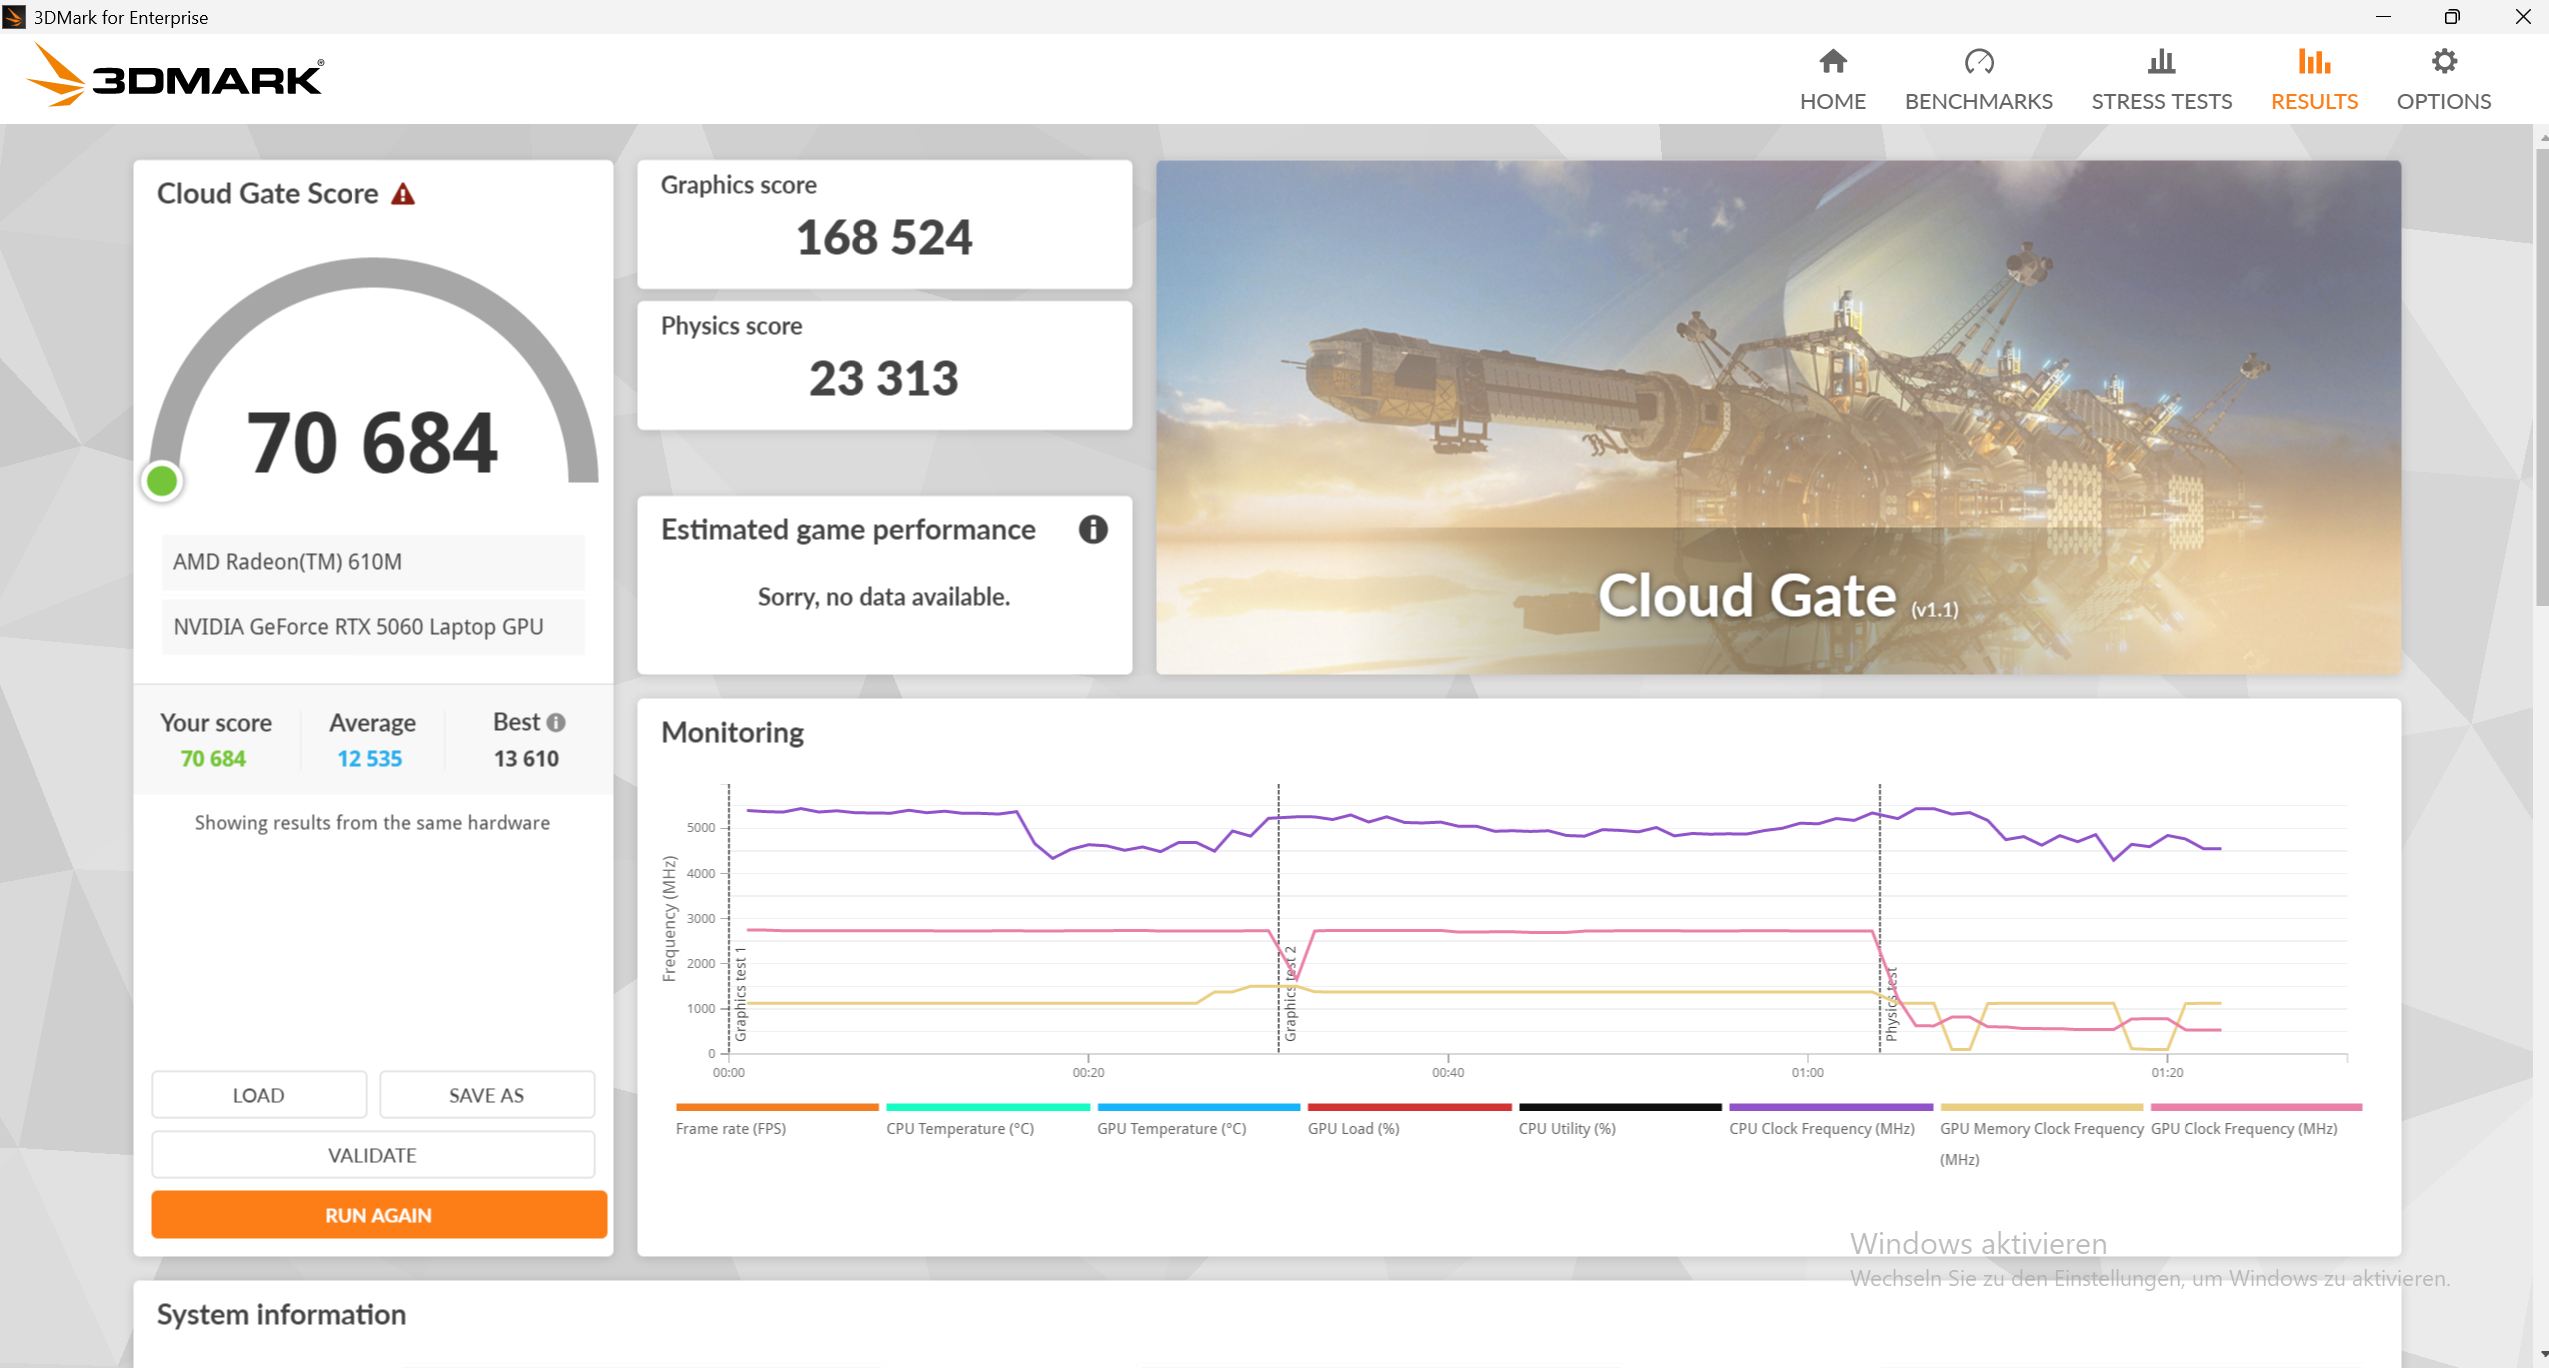
| 3DMark 11 Performance | 36789 points | |
| 3DMark Cloud Gate Standard Score | 70684 points | |
| 3DMark Fire Strike Score | 30868 points | |
| 3DMark Time Spy Score | 12199 points | |
Aide | ||
* ... Moindre est la valeur, meilleures sont les performances
Performances des jeux
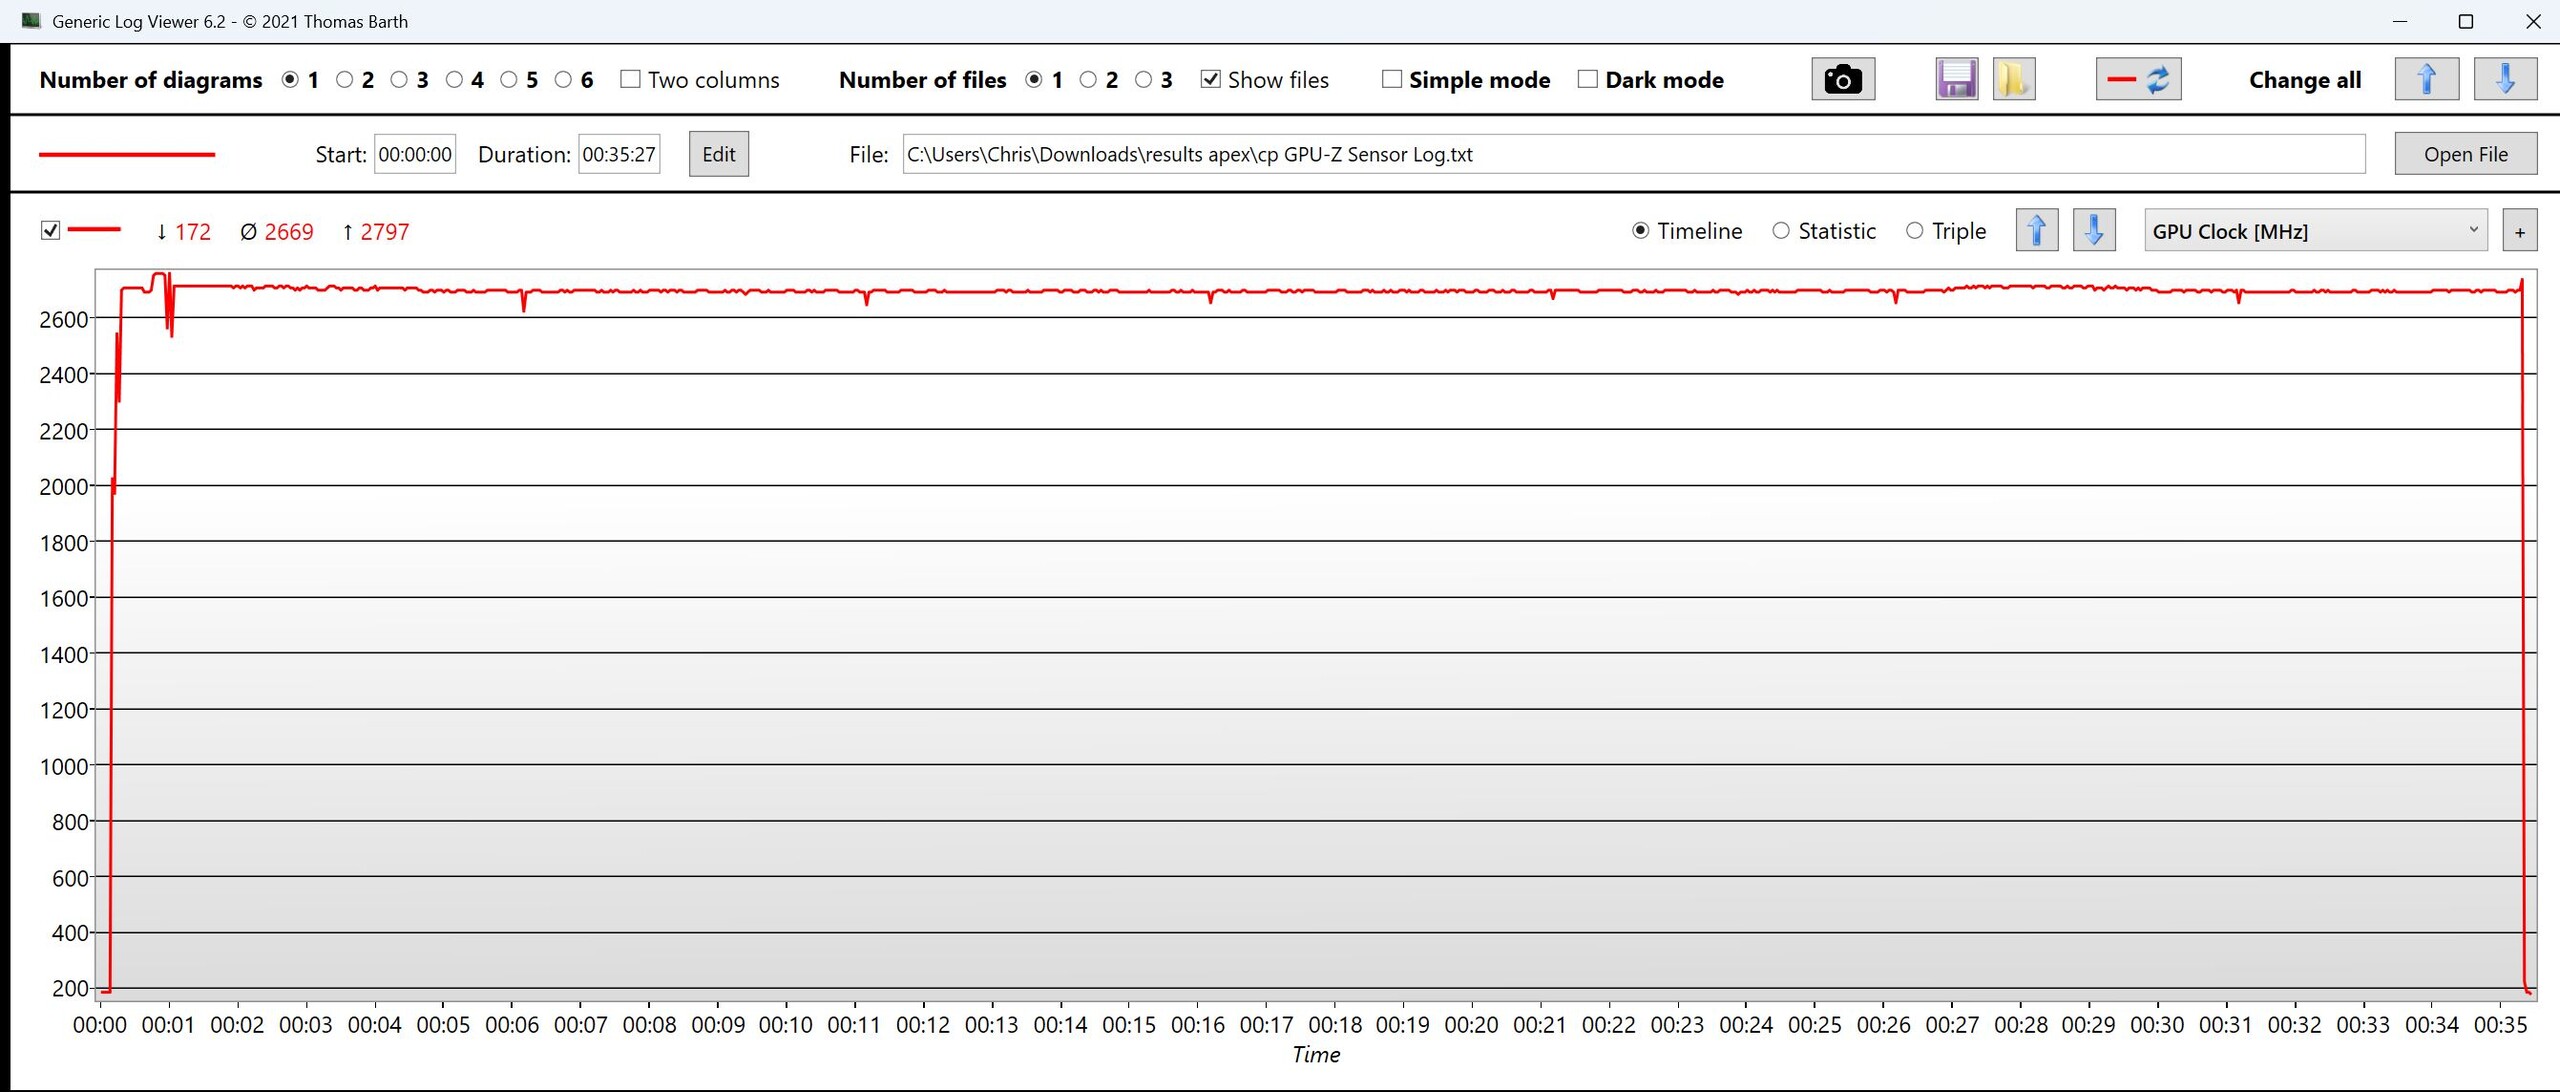
Dans tous les jeux testés, l'Apex surpasse même certains ordinateurs portables RTX 5070 moins performants (Acer Nitro V17, Omen 17z). Elle offre également des performances soutenues très élevées et parfaitement stables dans Cyberpunk.
En mode divertissement, les performances de jeu chutent d'environ 12 %.
Sans ray tracing ni path tracing, tous les jeux tournent sans problème en résolution native avec des paramètres élevés. Il y a de la marge pour le QHD, bien que le DLSS soit souvent nécessaire. En 4K, ce sont surtout les titres les plus anciens qui restent jouables, tandis que les jeux modernes se débattent même avec l'upscaling.
| Final Fantasy XV Benchmark - 1920x1080 High Quality | |
| HP Omen 17z-db100 | |
| Moyenne de la classe Gaming (41 - 215, n=116, 2 dernières années) | |
| Lenovo Legion 7 16IAX10 | |
| Acer Nitro v 17 (ANV17-41-R4CJ) | |
| Schenker XMG Apex 17 M25 | |
| HP Omen 16-ap0091ng | |
| Tulpar T6 V3.5 | |
| Alienware 16 Aurora | |
Cyberpunk 2077 ultra FPS diagramme

| Bas | Moyen | Élevé | Ultra | QHD DLSS | QHD | 4K DLSS | 4K | |
|---|---|---|---|---|---|---|---|---|
| GTA V (2015) | 187.9 | 187.8 | 185.7 | 146.3 | 114.3 | 106 | ||
| Dota 2 Reborn (2015) | 268 | 232 | 223 | 201 | 124.4 | |||
| Final Fantasy XV Benchmark (2018) | 227 | 167.4 | 119.5 | 89.9 | 50.7 | |||
| X-Plane 11.11 (2018) | 164.2 | 142.9 | 118.4 | 99.2 | ||||
| Strange Brigade (2018) | 648 | 348 | 273 | 231 | 162 | 86.1 | ||
| Baldur's Gate 3 (2023) | 170 | 133 | 118 | 113.4 | 114.1 | 78.1 | 65.8 | 38.8 |
| Cyberpunk 2077 (2023) | 128.9 | 124.5 | 104 | 87.2 | 70 | 58.8 | 32.7 | 25.1 |
| Doom: The Dark Ages (2025) | 58.5 | 49.6 | 44.1 | 43.8 | 48 | 30.4 | 22.7 | 11.7 |
| F1 25 (2025) | 263 | 217 | 174.4 | 25.8 |
Émissions et puissance - Quel est le niveau sonore de l'Apex 17 lorsqu'il est soumis à une charge de jeu ?
Émissions sonores
En charge, les ventilateurs sont généralement plus bruyants que ceux des concurrents dont la puissance est partiellement limitée. Même dans 3DMark06, les niveaux de bruit dépassent 50 dB. Pendant les jeux, c'est le système le plus bruyant de la comparaison, bien que le plus faible des Legion 7 plus faible, n'est pas loin derrière.
En mode divertissement, beaucoup plus silencieux, il fonctionne plus silencieusement que ses concurrents tout en conservant des performances compétitives.
Le comportement du ventilateur est quelque peu agressif et volatile, augmentant parfois brièvement, même au ralenti.
Degré de la nuisance sonore
| Au repos |
| 23 / 23 / 23 dB(A) |
| Fortement sollicité |
| 51.41 / 55.5 dB(A) |
 | ||
30 dB silencieux 40 dB(A) audible 50 dB(A) bruyant |
||
min: | ||
| Schenker XMG Apex 17 M25 R9 9955HX, GeForce RTX 5060 Laptop | Lenovo Legion 7 16IAX10 Ultra 7 255HX, GeForce RTX 5060 Laptop | HP Omen 16-ap0091ng R9 8940HX, GeForce RTX 5060 Laptop | MSI Cyborg 17 B13WFKG i7-13620H, GeForce RTX 5060 Laptop | Tulpar T6 V3.5 i7-14700HX, GeForce RTX 5060 Laptop | Alienware 16 Aurora Core 7 240H, GeForce RTX 5060 Laptop | |
|---|---|---|---|---|---|---|
| Noise | -2% | 0% | -6% | -10% | -1% | |
| arrêt / environnement * (dB) | 23 | 23.9 -4% | 23 -0% | 25 -9% | 24 -4% | 22.9 -0% |
| Idle Minimum * (dB) | 23 | 24 -4% | 23 -0% | 25 -9% | 26 -13% | 24 -4% |
| Idle Average * (dB) | 23 | 26 -13% | 23 -0% | 27 -17% | 29 -26% | 25.6 -11% |
| Idle Maximum * (dB) | 23 | 29.4 -28% | 27.64 -20% | 34 -48% | 31 -35% | 25.6 -11% |
| Load Average * (dB) | 51.41 | 35.4 31% | 49.5 4% | 44 14% | 52 -1% | 46.8 9% |
| Cyberpunk 2077 ultra * (dB) | 55.5 | 54.6 2% | 49.5 11% | 48 14% | 52 6% | 49.9 10% |
| Load Maximum * (dB) | 55.5 | 54.7 1% | 52.73 5% | 50 10% | 53 5% | 55.6 -0% |
* ... Moindre est la valeur, meilleures sont les performances
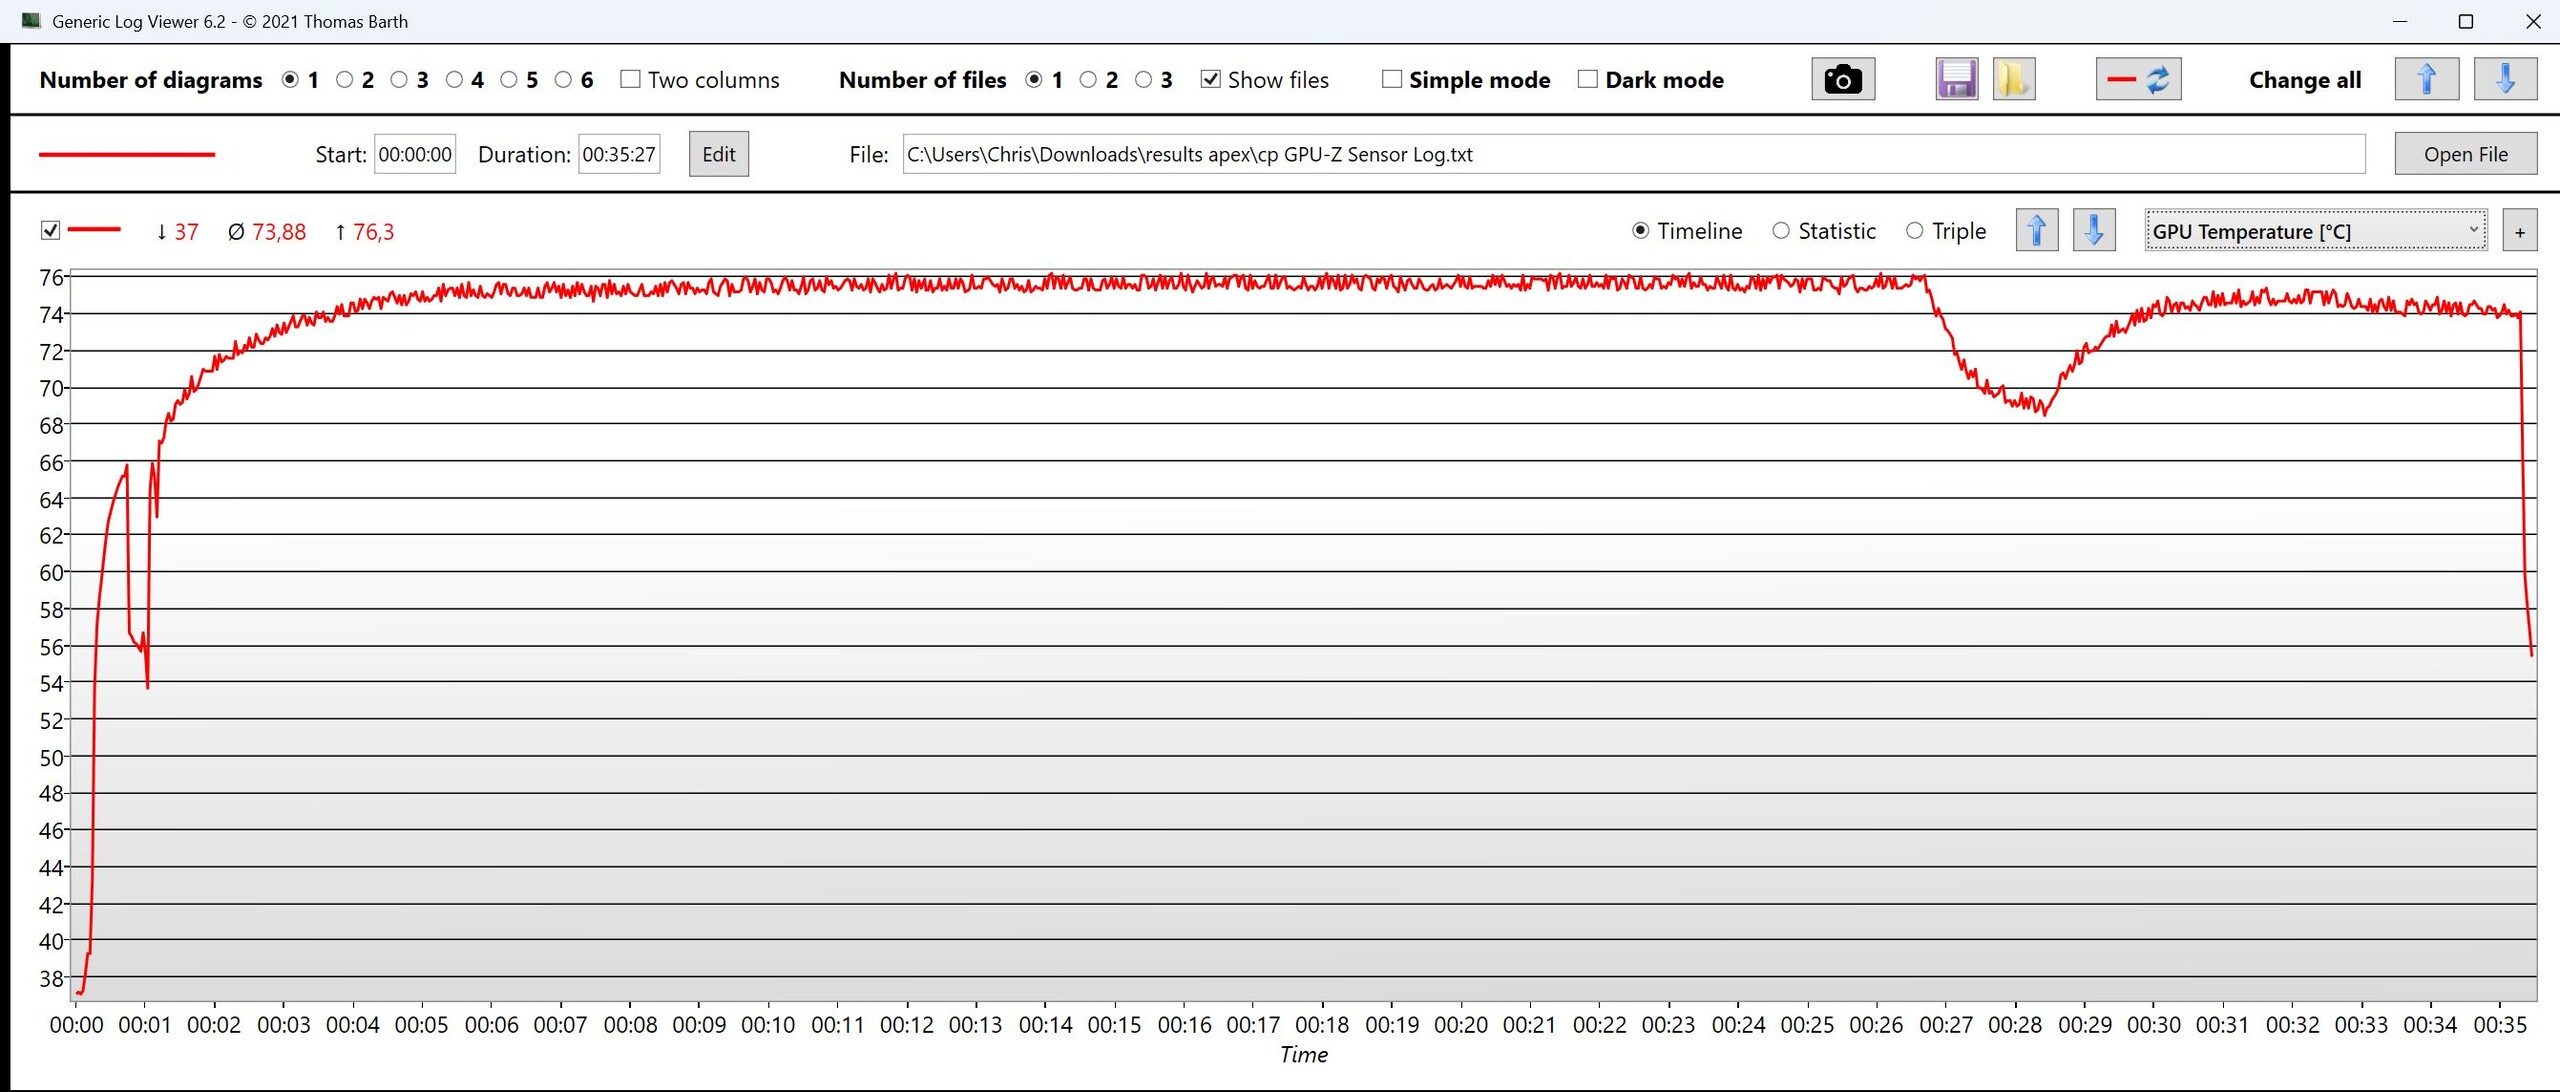
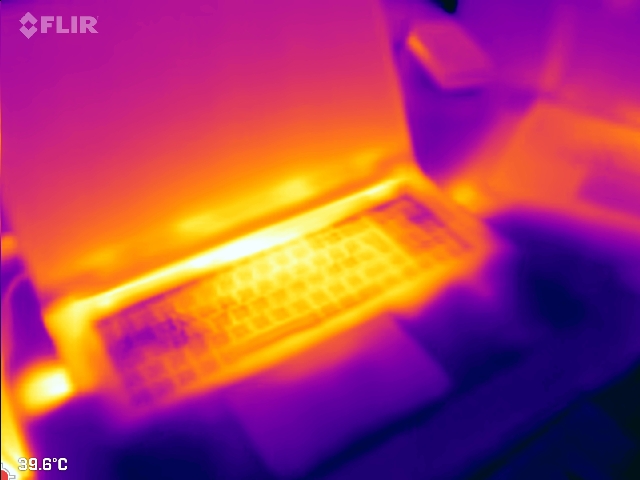
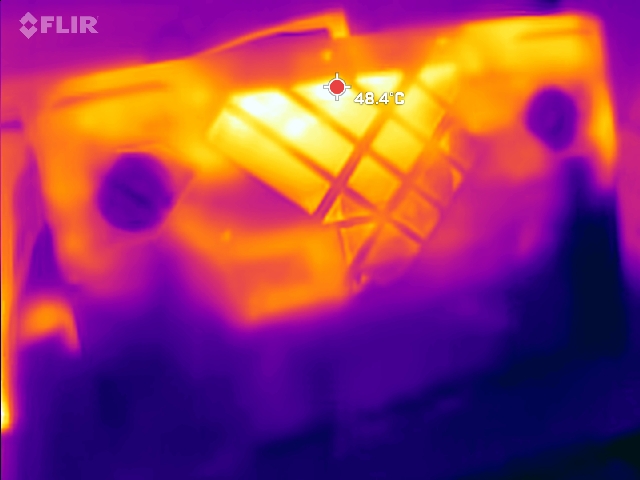
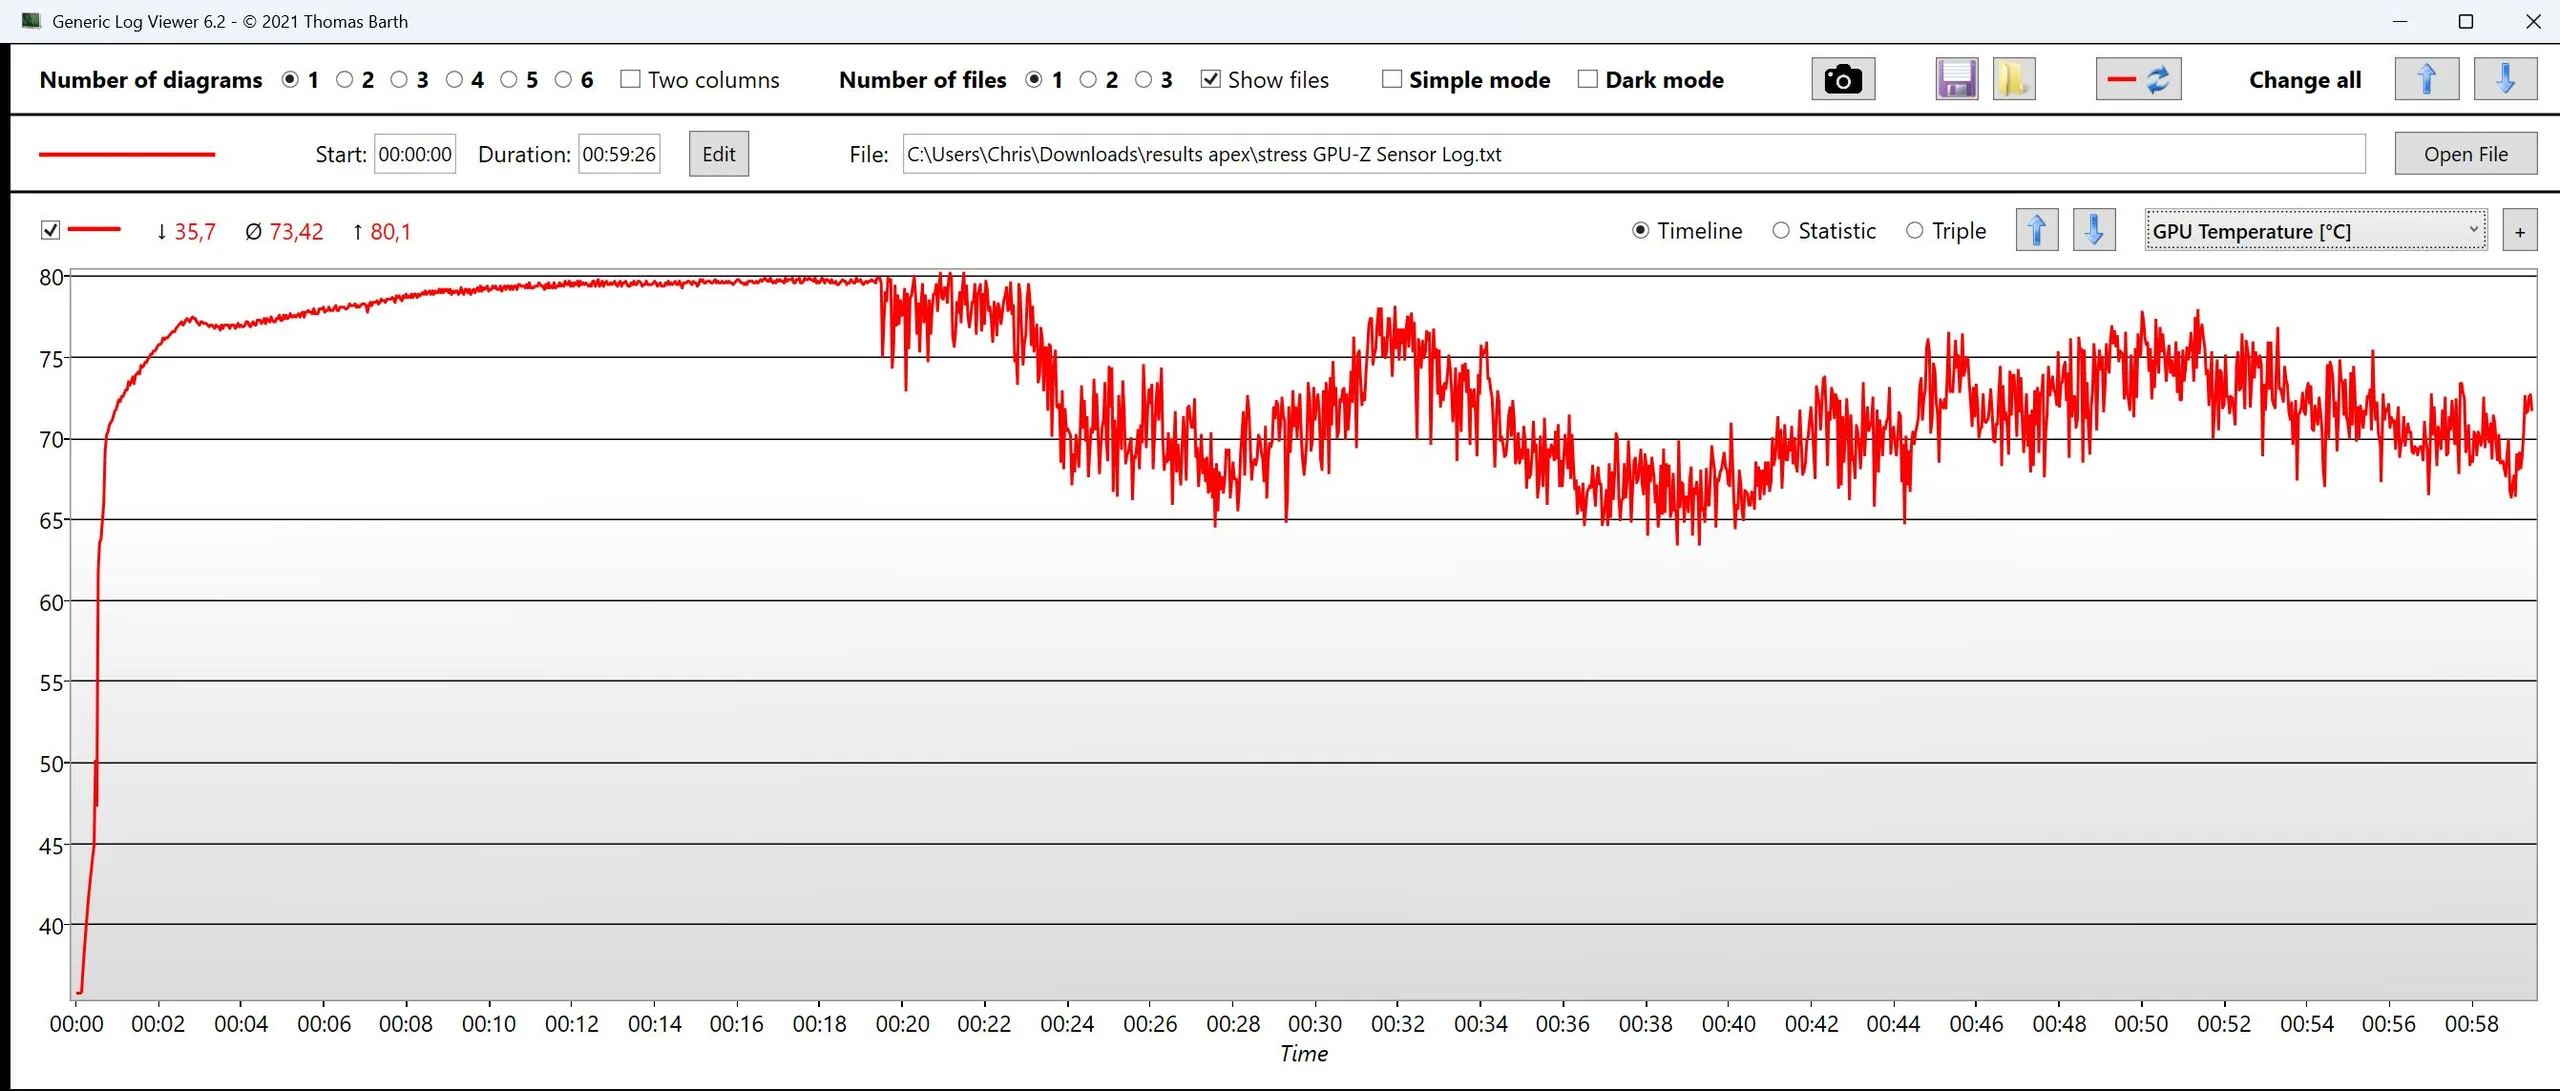
Température
Le puissant système de refroidissement maintient les températures à un niveau généralement bas. Sous charge, des points chauds d'environ 45°C sont mesurés au centre de la face inférieure, tandis que d'autres zones restent nettement plus froides.
(+) La température maximale du côté supérieur est de 36 °C / 97 F, par rapport à la moyenne de 40.4 °C / 105 F, allant de 21.2 à 68.8 °C pour la classe Gaming.
(±) Le fond chauffe jusqu'à un maximum de 43 °C / 109 F, contre une moyenne de 43.3 °C / 110 F
(+) En utilisation inactive, la température moyenne du côté supérieur est de 24.4 °C / 76 F, par rapport à la moyenne du dispositif de 33.9 °C / 93 F.
(+) 3: The average temperature for the upper side is 29.4 °C / 85 F, compared to the average of 33.9 °C / 93 F for the class Gaming.
(+) Les repose-poignets et le pavé tactile sont plus froids que la température de la peau avec un maximum de 27 °C / 80.6 F et sont donc froids au toucher.
(±) La température moyenne de la zone de l'appui-paume de dispositifs similaires était de 28.8 °C / 83.8 F (+1.8 °C / #3.2 F).
| Schenker XMG Apex 17 M25 R9 9955HX, GeForce RTX 5060 Laptop | Lenovo Legion 7 16IAX10 Ultra 7 255HX, GeForce RTX 5060 Laptop | HP Omen 16-ap0091ng R9 8940HX, GeForce RTX 5060 Laptop | MSI Cyborg 17 B13WFKG i7-13620H, GeForce RTX 5060 Laptop | Tulpar T6 V3.5 i7-14700HX, GeForce RTX 5060 Laptop | |
|---|---|---|---|---|---|
| Heat | -24% | -4% | -33% | -15% | |
| Maximum Upper Side * (°C) | 36 | 47 -31% | 36 -0% | 49 -36% | 40 -11% |
| Maximum Bottom * (°C) | 43 | 44 -2% | 37 14% | 49 -14% | 47 -9% |
| Idle Upper Side * (°C) | 27 | 35.6 -32% | 30 -11% | 37 -37% | 30 -11% |
| Idle Bottom * (°C) | 27 | 35.2 -30% | 32 -19% | 39 -44% | 35 -30% |
* ... Moindre est la valeur, meilleures sont les performances
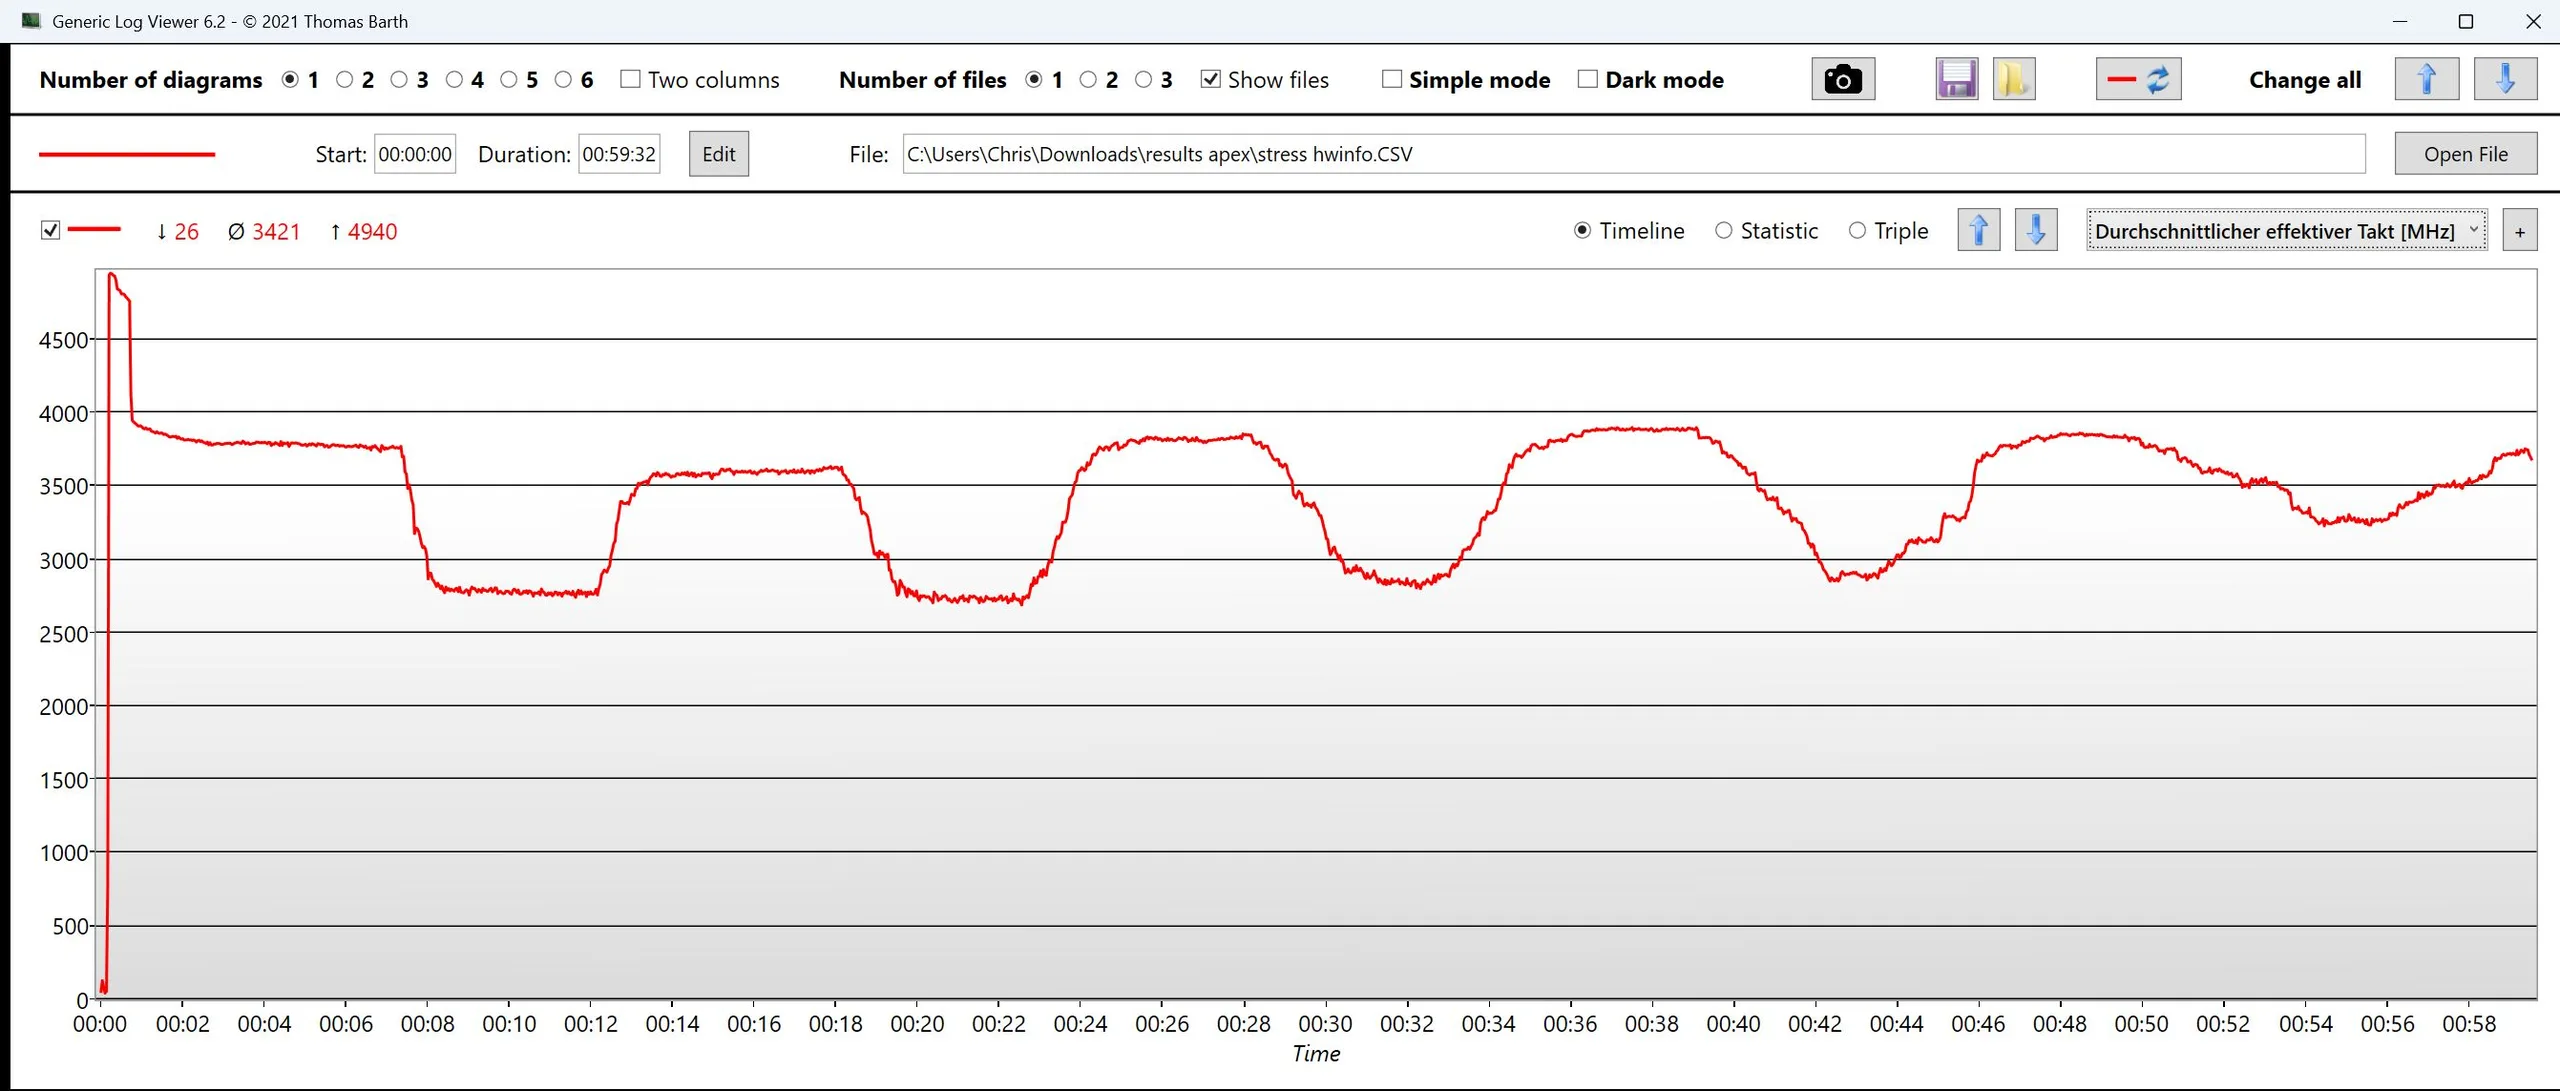
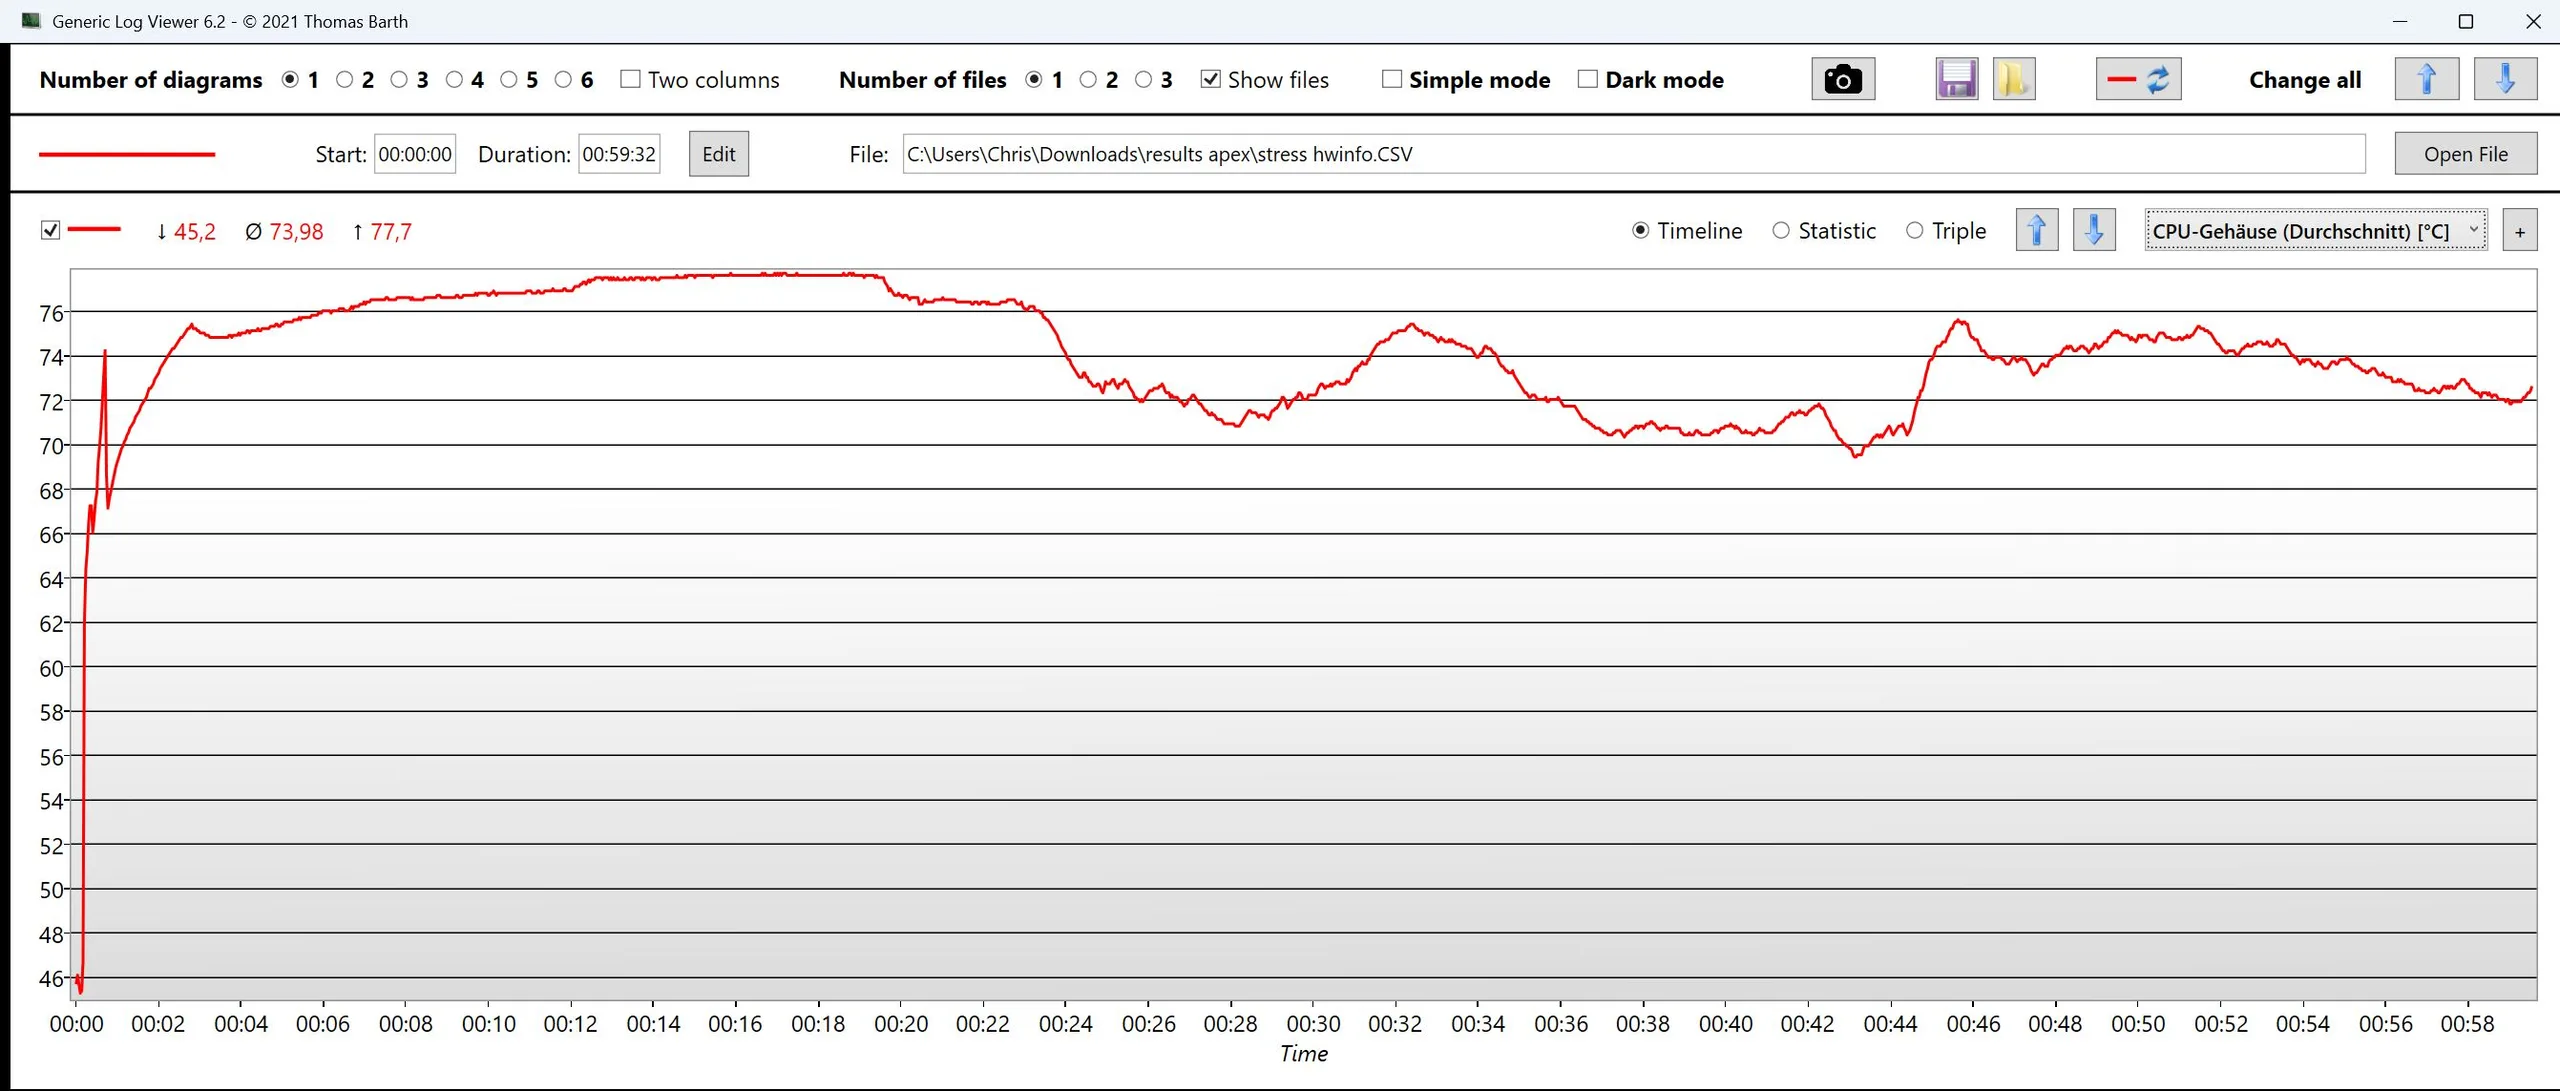
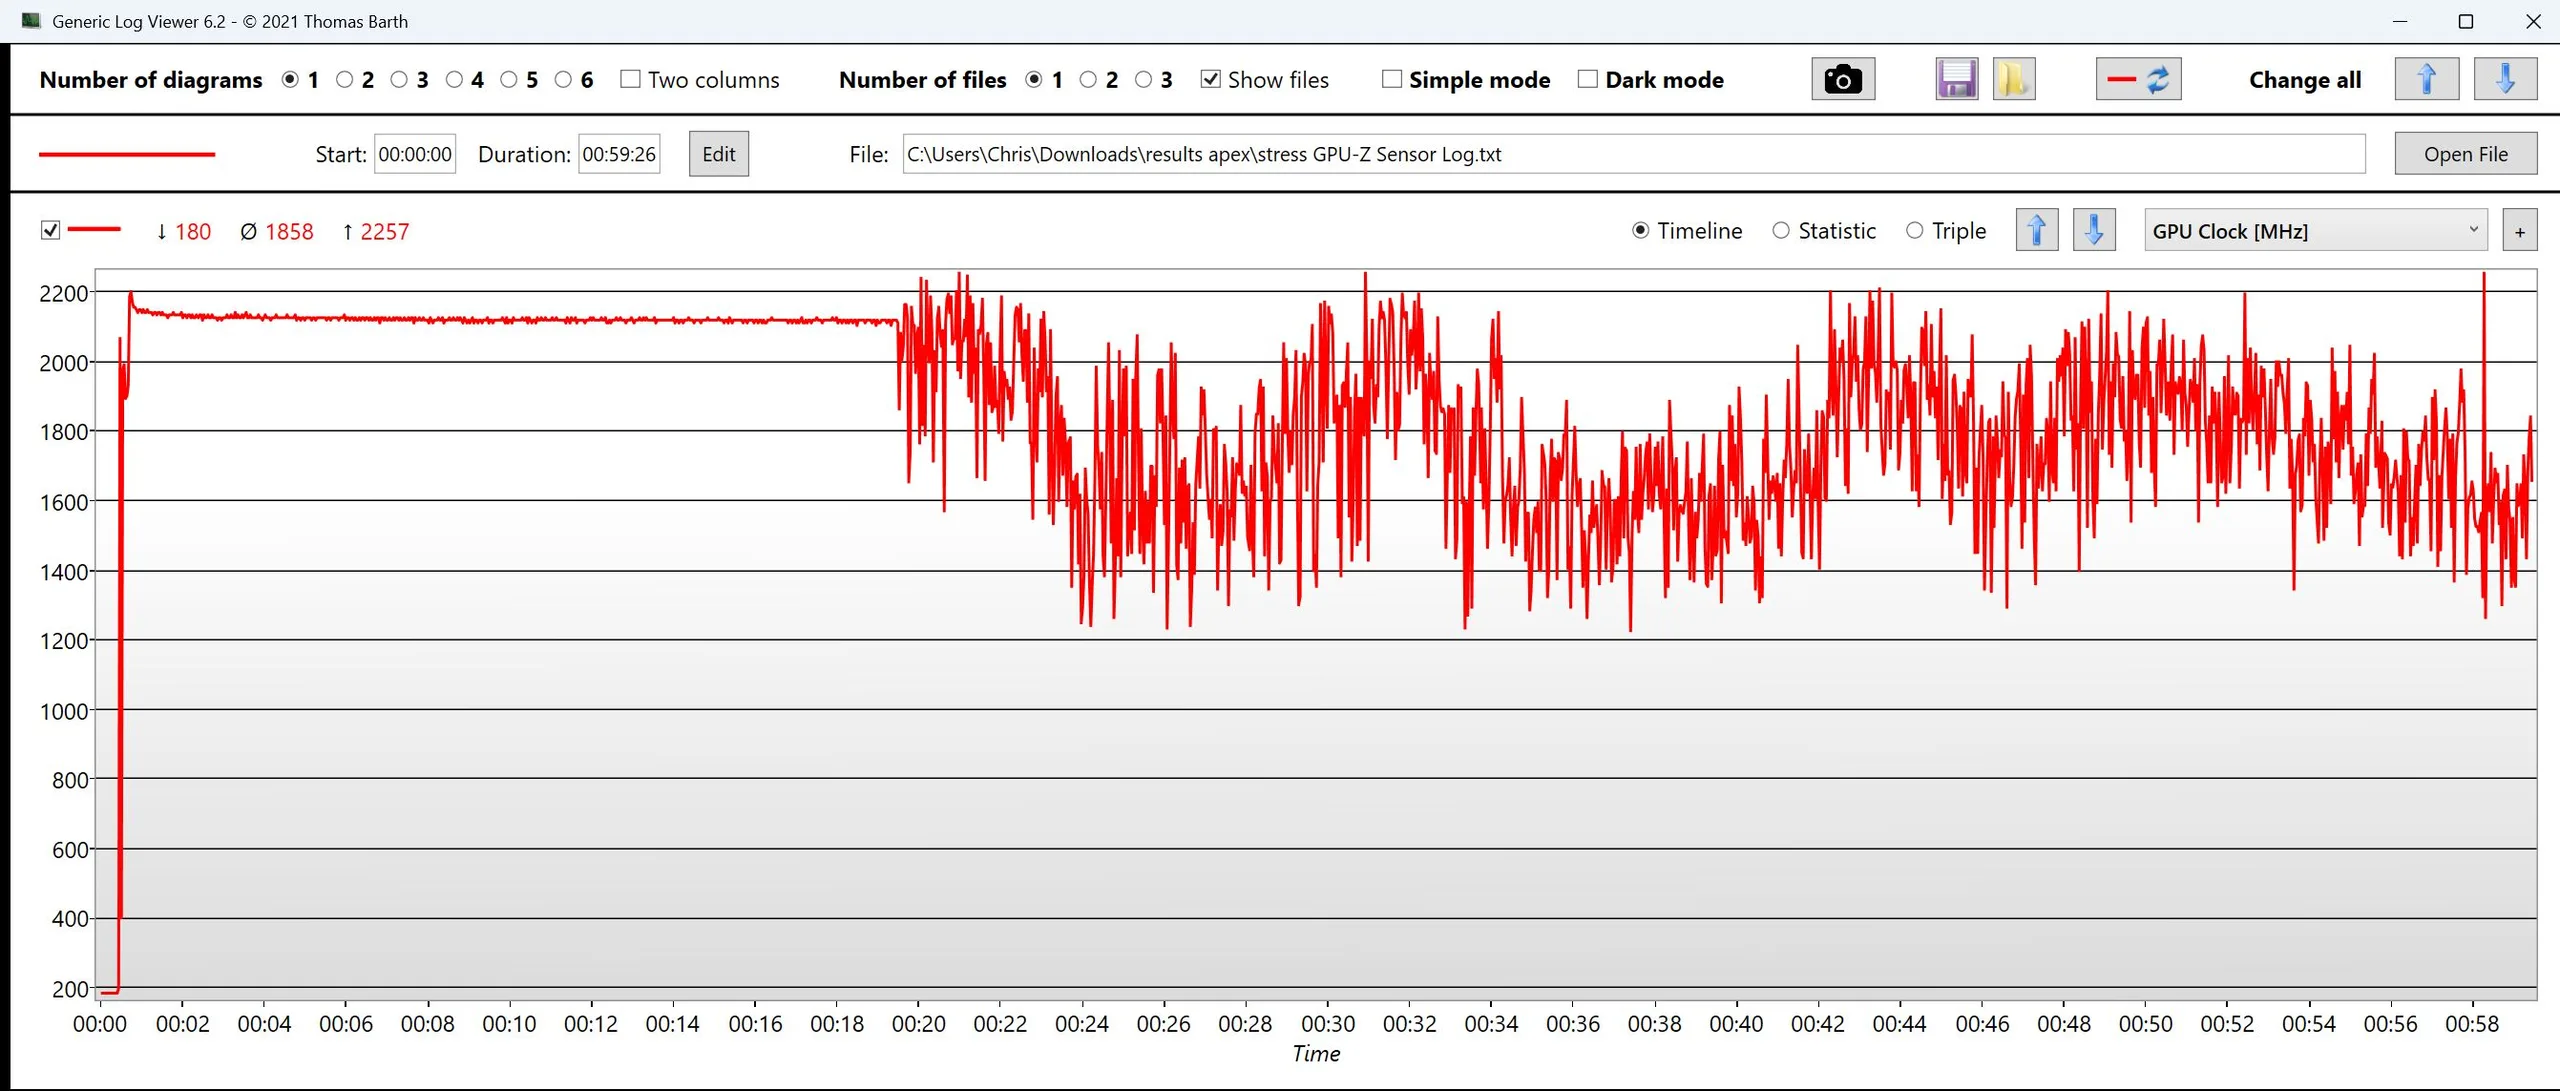
| Horloge CPU (GHz) | Horloge GPU (MHz) | Température moyenne du CPU (°C) | Température moyenne du GPU (°C) | |
| Prime95 + FurMark Stress | 3.4 | 1853 | 74 | 73 |
| Cyberpunk 2077 Stress | 1.1 | 2700 | 84 | 74 |
Intervenants
Les aigus et les médiums sont équilibrés, mais les basses sont quasiment absentes et la puissance globale est légèrement insuffisante. La qualité des enceintes est moyenne. Une prise audio combinée est incluse.
Schenker XMG Apex 17 M25 analyse audio
(±) | le niveau sonore du haut-parleur est moyen mais bon (80.19# dB)
Basses 100 - 315 Hz
(-) | presque aucune basse - en moyenne 29.9% plus bas que la médiane
(±) | la linéarité des basses est moyenne (14.6% delta à la fréquence précédente)
Médiums 400 - 2000 Hz
(+) | médiane équilibrée - seulement 4.7% de la médiane
(+) | les médiums sont linéaires (6.7% delta à la fréquence précédente)
Aiguës 2 - 16 kHz
(+) | des sommets équilibrés - à seulement 4.1% de la médiane
(+) | les aigus sont linéaires (6% delta à la fréquence précédente)
Globalement 100 - 16 000 Hz
(±) | la linéarité du son global est moyenne (22.3% de différence avec la médiane)
Par rapport à la même classe
» 79% de tous les appareils testés de cette catégorie étaient meilleurs, 6% similaires, 15% pires
» Le meilleur avait un delta de 6%, la moyenne était de 18%, le pire était de 132%.
Par rapport à tous les appareils testés
» 65% de tous les appareils testés étaient meilleurs, 6% similaires, 29% pires
» Le meilleur avait un delta de 4%, la moyenne était de 24%, le pire était de 134%.
Lenovo Legion 7 16IAX10 analyse audio
(±) | le niveau sonore du haut-parleur est moyen mais bon (77.6# dB)
Basses 100 - 315 Hz
(±) | basse réduite - en moyenne 9.5% inférieure à la médiane
(±) | la linéarité des basses est moyenne (9.8% delta à la fréquence précédente)
Médiums 400 - 2000 Hz
(+) | médiane équilibrée - seulement 1.5% de la médiane
(+) | les médiums sont linéaires (4% delta à la fréquence précédente)
Aiguës 2 - 16 kHz
(+) | des sommets équilibrés - à seulement 3% de la médiane
(+) | les aigus sont linéaires (4.9% delta à la fréquence précédente)
Globalement 100 - 16 000 Hz
(+) | le son global est linéaire (11.5% différence à la médiane)
Par rapport à la même classe
» 9% de tous les appareils testés de cette catégorie étaient meilleurs, 3% similaires, 88% pires
» Le meilleur avait un delta de 6%, la moyenne était de 18%, le pire était de 132%.
Par rapport à tous les appareils testés
» 7% de tous les appareils testés étaient meilleurs, 2% similaires, 90% pires
» Le meilleur avait un delta de 4%, la moyenne était de 24%, le pire était de 134%.
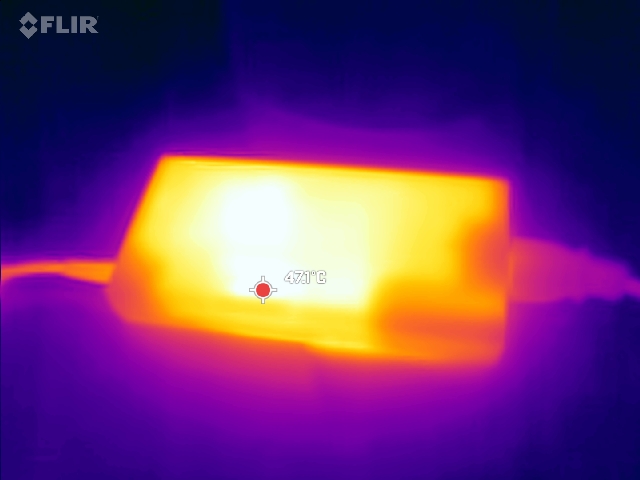
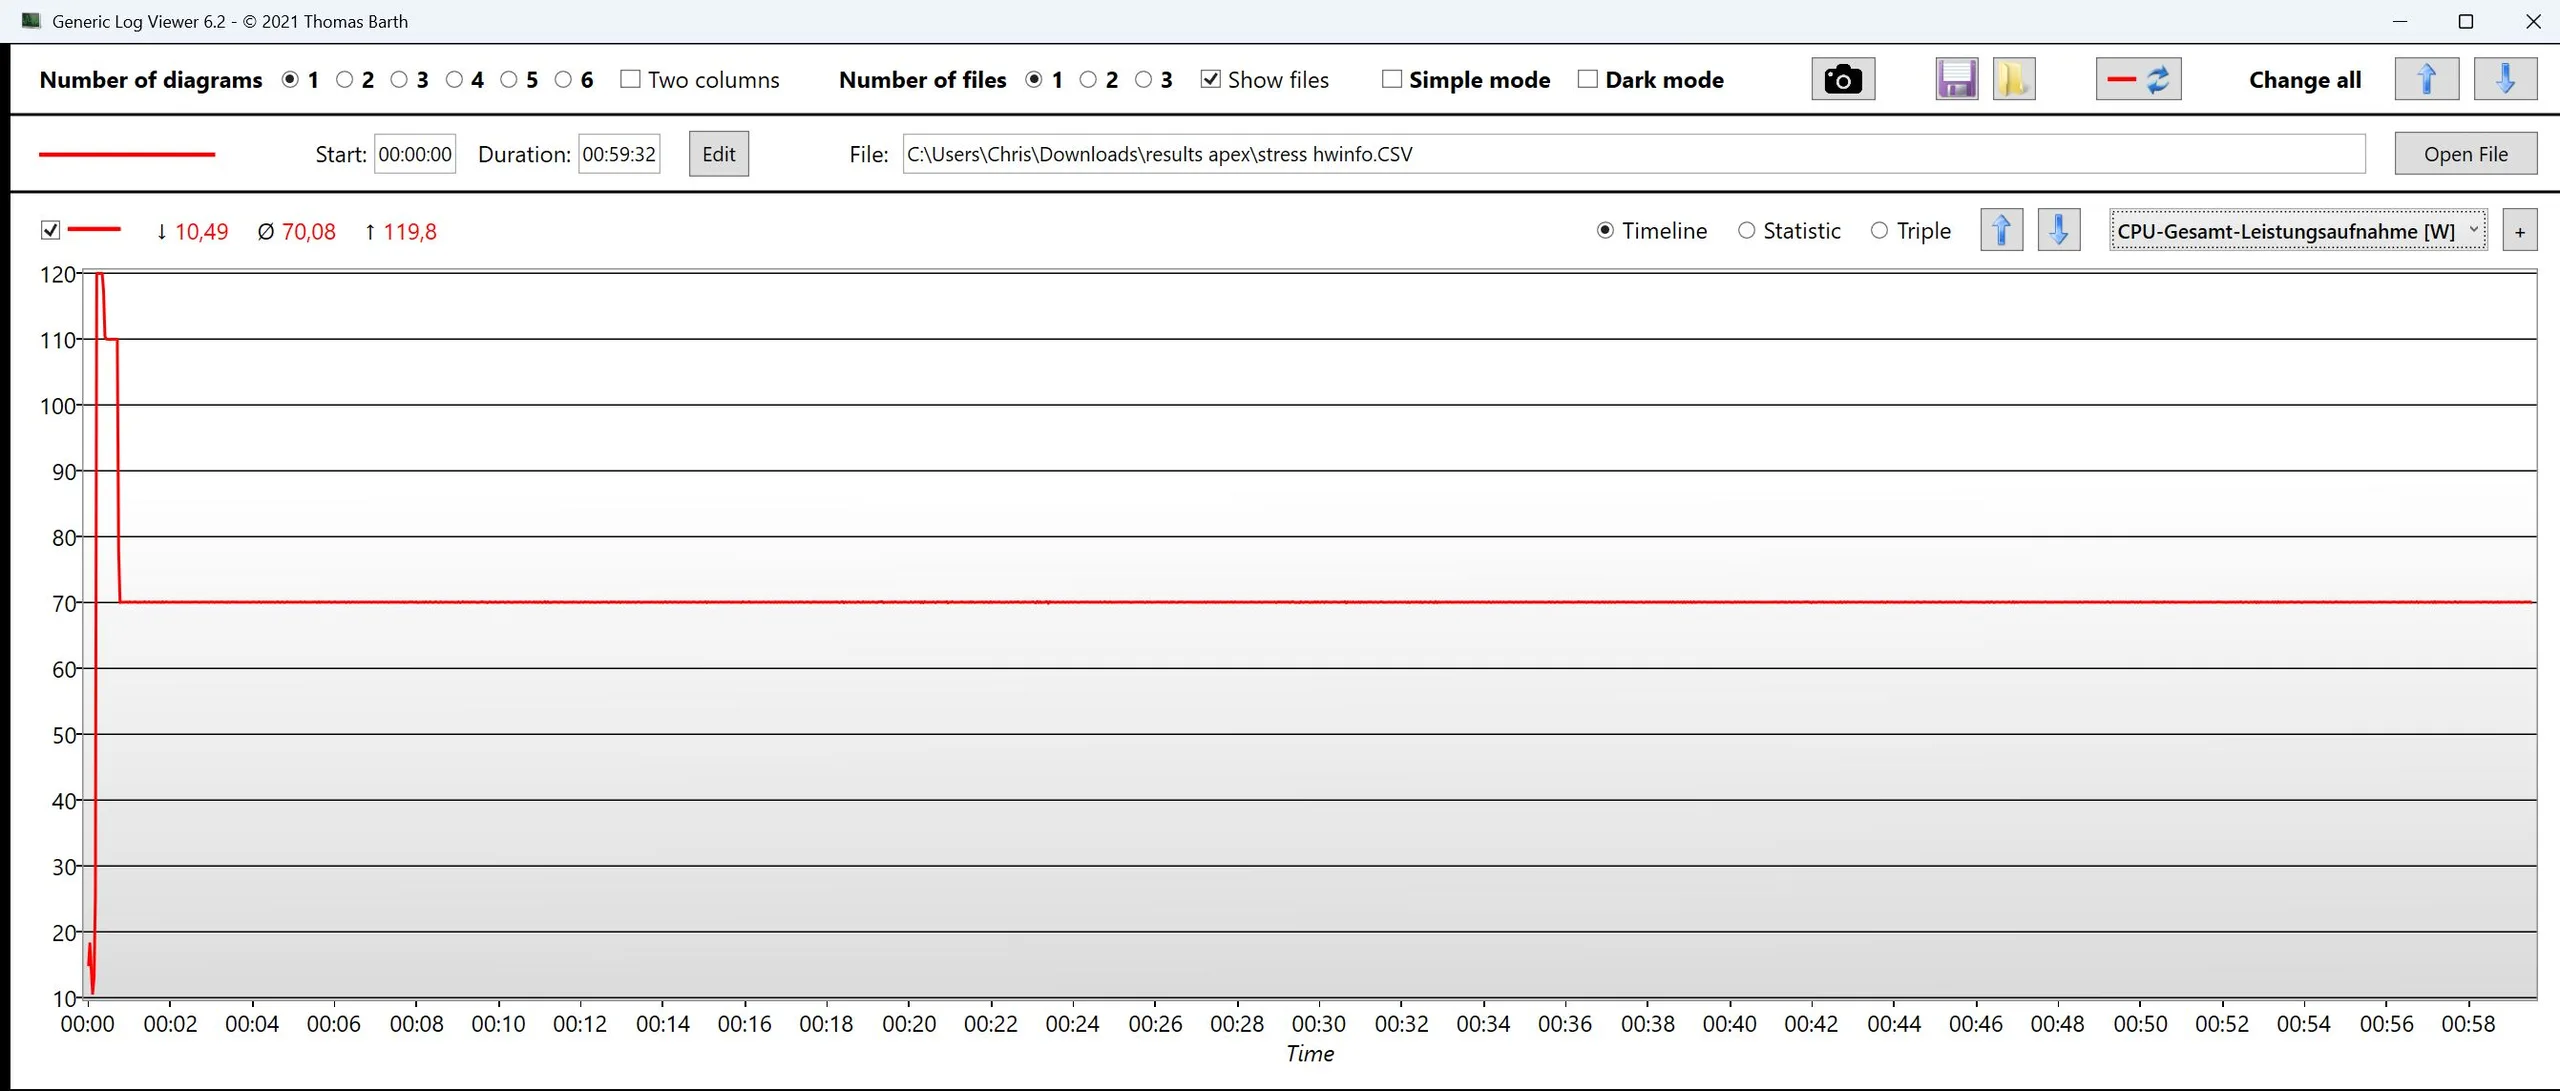
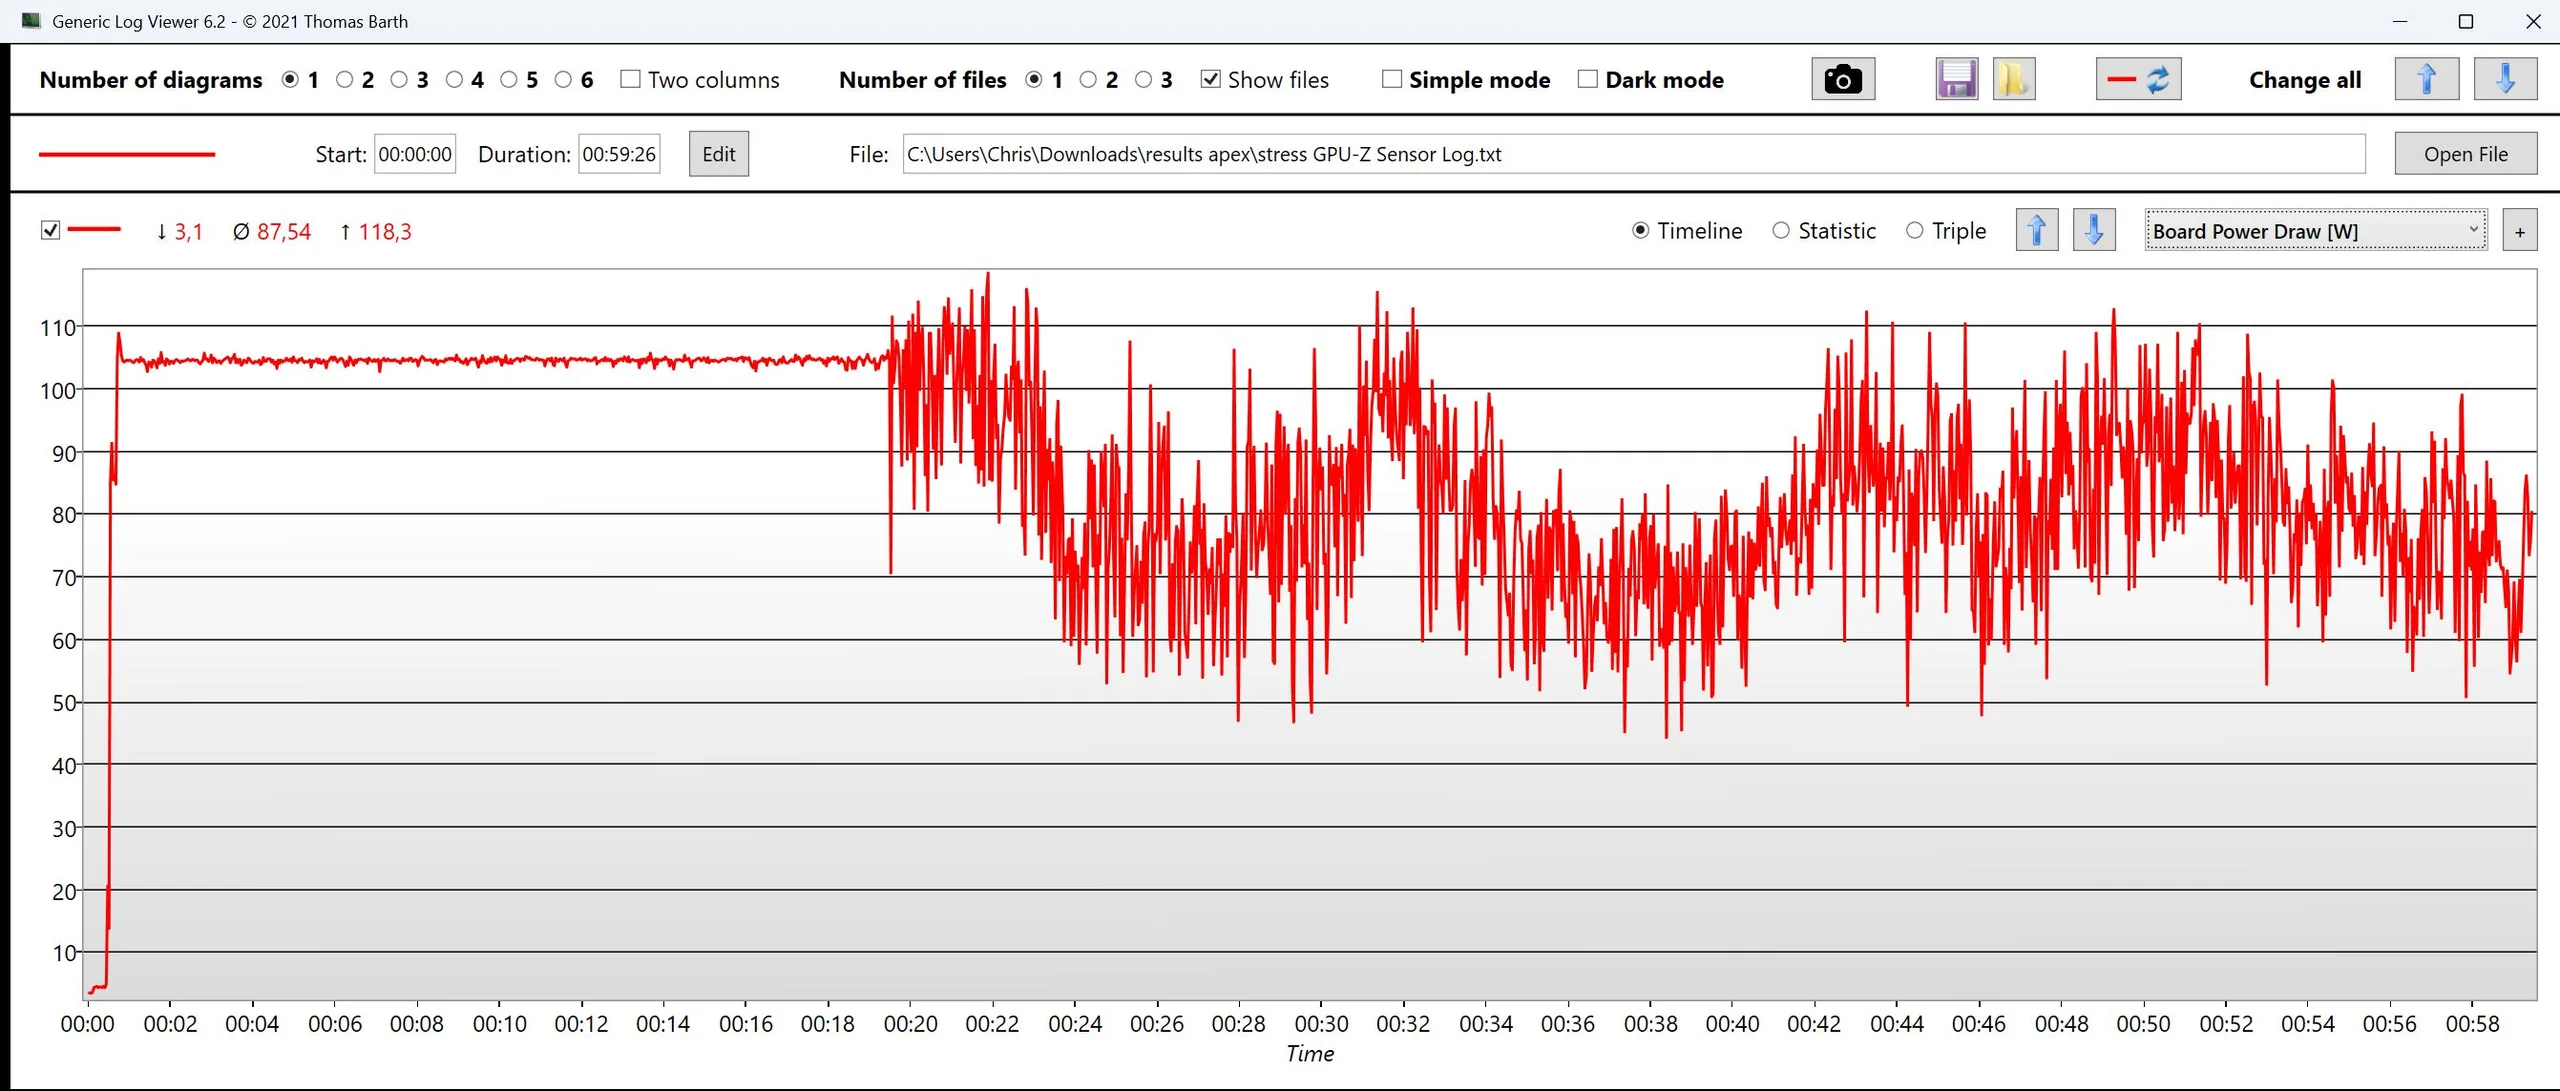
Consommation électrique
Les performances élevées se font au prix d'une consommation d'énergie en charge plus élevée que celle des concurrents. La consommation d'énergie au ralenti doit être optimisée, car le système prend un temps anormalement long pour se stabiliser à un niveau de ralenti relativement élevé.
L'adaptateur d'alimentation de 230 W fourni est peut-être un peu trop petit. Alors que la consommation en jeu se situe en moyenne autour de 220 W, de courtes pointes pouvant atteindre 280 W se produisent.
| Éteint/en veille | |
| Au repos | |
| Fortement sollicité |
|
Légende:
min: | |
| Schenker XMG Apex 17 M25 R9 9955HX, GeForce RTX 5060 Laptop, Samsung 990 Pro 2 TB MZVL72T0HDLB, IPS, 2560x1440, 17.3" | Lenovo Legion 7 16IAX10 Ultra 7 255HX, GeForce RTX 5060 Laptop, WD PC SN7100S SDFPMSL-1T00-1101, OLED, 2560x1600, 16" | HP Omen 16-ap0091ng R9 8940HX, GeForce RTX 5060 Laptop, Samsung PM9C1b MZVL81T0HFLB-00BH1, IPS, 1920x1200, 16" | MSI Cyborg 17 B13WFKG i7-13620H, GeForce RTX 5060 Laptop, Western Digital PC SN5000S SDEPMSJ-512G, IPS, 1920x1080, 17.3" | Tulpar T6 V3.5 i7-14700HX, GeForce RTX 5060 Laptop, Western Digital PC SN5000S SDEPNSJ-1T00-1006, IPS, 1920x1200, 16" | Alienware 16 Aurora Core 7 240H, GeForce RTX 5060 Laptop, , IPS, 2560x1600, 16" | Moyenne NVIDIA GeForce RTX 5060 Laptop | Moyenne de la classe Gaming | |
|---|---|---|---|---|---|---|---|---|
| Power Consumption | 4% | 19% | 36% | 17% | 31% | 17% | -7% | |
| Idle Minimum * (Watt) | 11.3 | 9.4 17% | 7.8 31% | 7.9 30% | 6.7 41% | 4.4 61% | 9.47 ? 16% | 13.5 ? -19% |
| Idle Average * (Watt) | 16.7 | 10.6 37% | 8.8 47% | 12.7 24% | 13.7 18% | 18 -8% | 13.6 ? 19% | 19.3 ? -16% |
| Idle Maximum * (Watt) | 20.7 | 36.4 -76% | 21.5 -4% | 18.1 13% | 21.8 -5% | 18.2 12% | 19.3 ? 7% | 24.7 ? -19% |
| Load Average * (Watt) | 121 | 107.7 11% | 119 2% | 90 26% | 127 -5% | 87.1 28% | 98.3 ? 19% | 108.6 ? 10% |
| Cyberpunk 2077 ultra * (Watt) | 220 | 188 15% | 192 13% | 109.7 50% | 156.7 29% | 123 44% | ||
| Cyberpunk 2077 ultra external monitor * (Watt) | 209 | 187.5 10% | 164.5 21% | 108.4 48% | 151.9 27% | 120.6 42% | ||
| Load Maximum * (Watt) | 281 | 247 12% | 208 26% | 115 59% | 242 14% | 183 35% | 213 ? 24% | 254 ? 10% |
* ... Moindre est la valeur, meilleures sont les performances
Consommation électrique Cyberpunk / Stress test
Consommation électrique avec moniteur externe
Durée de vie de la batterie
Avec 73 Wh, la capacité de la batterie est inférieure à celle de cette catégorie. Néanmoins, l'Apex atteint un peu moins de six heures lors de notre test Wi-Fi, ce qui est un résultat solide.
| Schenker XMG Apex 17 M25 R9 9955HX, GeForce RTX 5060 Laptop, 73 Wh | HP Omen 17z-db100 Ryzen AI 7 350, GeForce RTX 5070 Laptop, 83 Wh | Acer Nitro v 17 (ANV17-41-R4CJ) R7 260, GeForce RTX 5070 Laptop, 76 Wh | MSI Katana 17 HX B14WGK i7-14650HX, GeForce RTX 5070 Laptop, 75 Wh | Lenovo Legion 7 16IAX10 Ultra 7 255HX, GeForce RTX 5060 Laptop, 84 Wh | Moyenne de la classe Gaming | |
|---|---|---|---|---|---|---|
| Autonomie de la batterie | ||||||
| WiFi v1.3 (h) | 5.8 | 8 38% | 4.7 -19% | 5.1 -12% | 4.7 -19% | 6.8 ? 17% |
Schenker XMG Apex 17 M25
- 02/12/2026 v8
Christian Hintze
 Total Sustainability Score:
 Comparaison des alternatives possibles
Image | Modèle | Prix | Poids | Épaisseur | Écran |
|---|---|---|---|---|---|
1. 82.1%  | Schenker XMG Apex 17 M25 AMD Ryzen 9 9955HX ⎘ NVIDIA GeForce RTX 5060 Laptop ⎘ 32 Go Mémoire, 2048 Go SSD | Amazon: Prix de liste: 1899 Euro | 2.8 kg | 28.6 mm | 17.30" 2560x1440 170 PPI IPS |
2. 81.8%  | HP Omen 17z-db100 AMD Ryzen AI 7 350 ⎘ NVIDIA GeForce RTX 5070 Laptop ⎘ 96 Go Mémoire, 4000 Go SSD | Amazon: Prix de liste: 1550 USD | 2.9 kg | 30.1 mm | 17.30" 2560x1440 170 PPI IPS |
3. 80.2%  | Acer Nitro v 17 (ANV17-41-R4CJ) AMD Ryzen 7 260 ⎘ NVIDIA GeForce RTX 5070 Laptop ⎘ 16 Go Mémoire, 1024 Go SSD | Amazon: Prix de liste: 1199 Euro | 2.7 kg | 24 mm | 17.30" 1920x1080 127 PPI IPS |
4. 79.6%  | MSI Crosshair A17 HX D8WGKG AMD Ryzen 9 8940HX ⎘ NVIDIA GeForce RTX 5070 Laptop ⎘ 32 Go Mémoire, 1024 Go SSD | Amazon: Prix de liste: 2000 EUR | 2.9 kg | 29.7 mm | 17.00" 2560x1600 178 PPI IPS |
5. 77.3%  | MSI Katana 17 HX B14WGK Intel Core i7-14650HX ⎘ NVIDIA GeForce RTX 5070 Laptop ⎘ 16 Go Mémoire, 1024 Go SSD | Amazon: Prix de liste: 1800 EUR | 2.7 kg | 28 mm | 17.30" 2560x1440 170 PPI IPS |
6. 86.6%  | Lenovo Legion 7 16IAX10 Intel Core Ultra 7 255HX ⎘ NVIDIA GeForce RTX 5060 Laptop ⎘ 32 Go Mémoire, 1024 Go SSD | Amazon: Prix de liste: 1650 USD | 2 kg | 17.9 mm | 16.00" 2560x1600 189 PPI OLED |
7. 82.5% 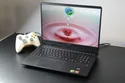 | HP Omen 16-ap0091ng AMD Ryzen 9 8940HX ⎘ NVIDIA GeForce RTX 5060 Laptop ⎘ 16 Go Mémoire, 1000 Go SSD | Amazon: Prix de liste: 1500 Euro | 2.4 kg | 23.7 mm | 16.00" 1920x1200 162 PPI IPS |
Transparency
La sélection des appareils à examiner est effectuée par notre équipe éditoriale. L'échantillon de test a été prêté à l'auteur par le fabricant ou le détaillant pour les besoins de cet examen. Le prêteur n'a pas eu d'influence sur cette évaluation et le fabricant n'a pas reçu de copie de cette évaluation avant sa publication. Il n'y avait aucune obligation de publier cet article. En tant que média indépendant, Notebookcheck n'est pas soumis à l'autorité des fabricants, des détaillants ou des éditeurs.
Voici comment Notebookcheck teste
Chaque année, Notebookcheck examine de manière indépendante des centaines d'ordinateurs portables et de smartphones en utilisant des procédures standardisées afin de garantir que tous les résultats sont comparables. Nous avons continuellement développé nos méthodes de test depuis environ 20 ans et avons établi des normes industrielles dans le processus. Dans nos laboratoires de test, des équipements de mesure de haute qualité sont utilisés par des techniciens et des rédacteurs expérimentés. Ces tests impliquent un processus de validation en plusieurs étapes. Notre système d'évaluation complexe repose sur des centaines de mesures et de points de référence bien fondés, ce qui garantit l'objectivité.
