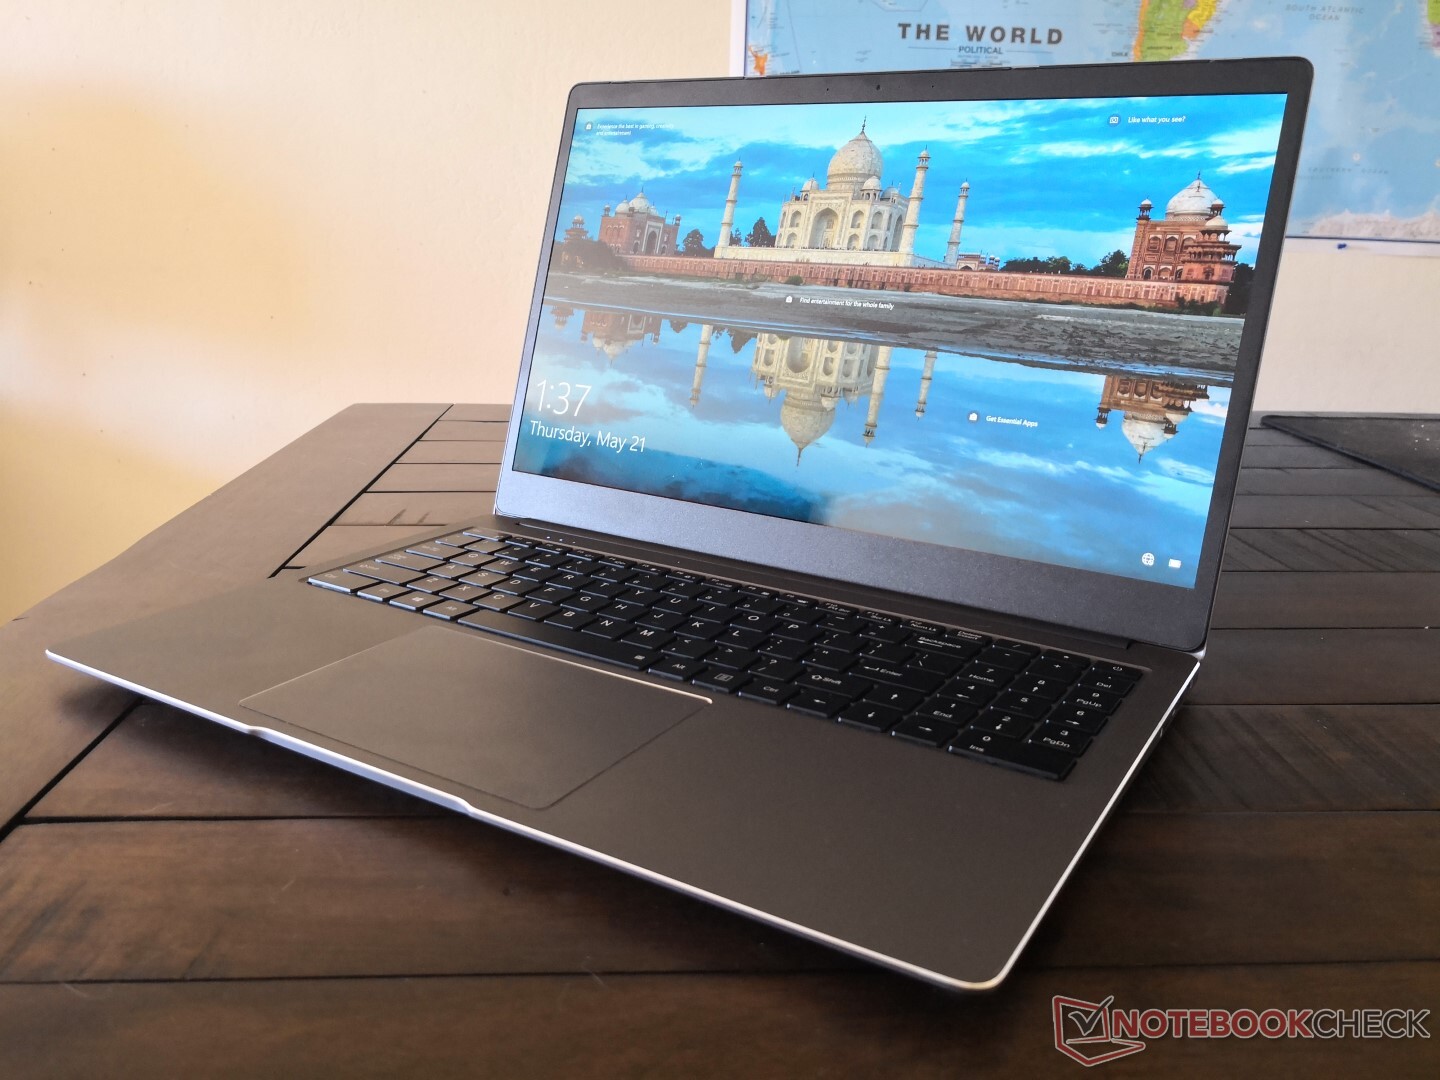
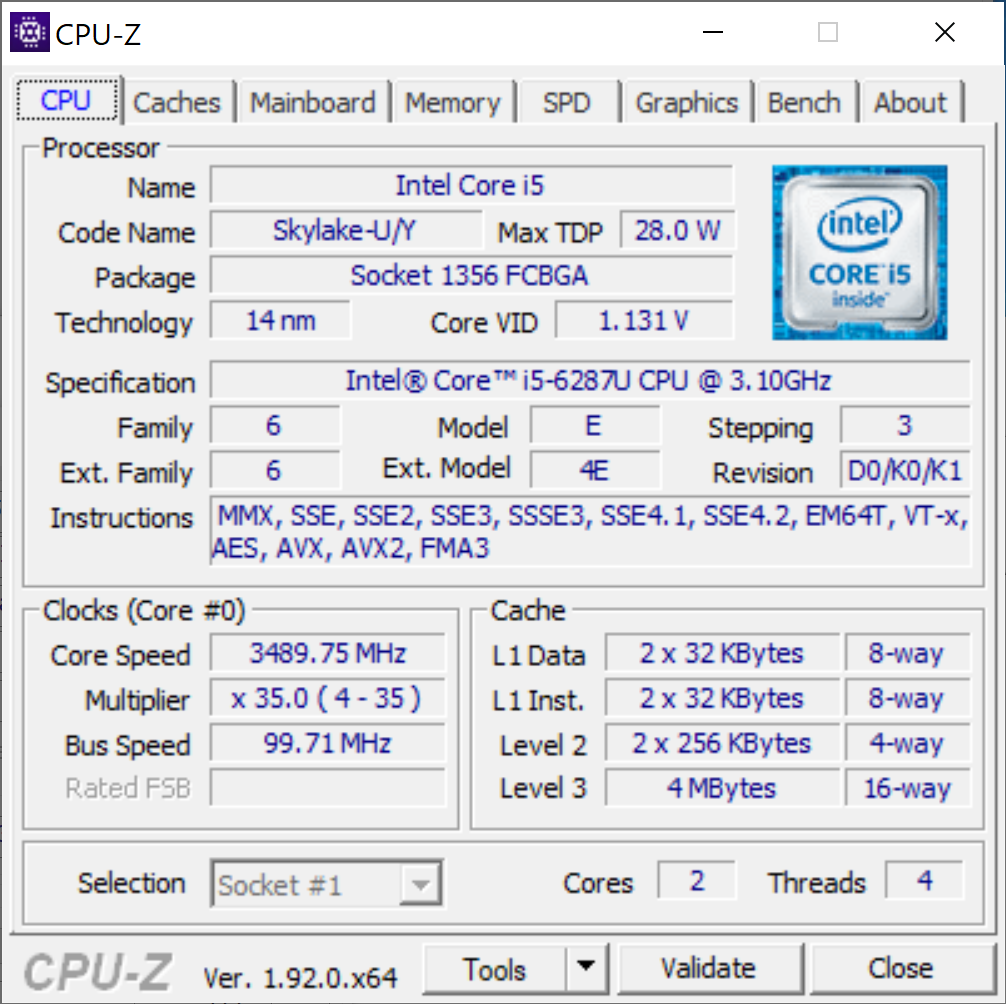
Test du Chuwi AeroBook Plus 4K (i5-6287U, Iris 550, 4K) : l'Intel Skylake U de 6 génération en 2020
Note | Date | Modèle | Poids | Épaisseur | Taille | Résolution | Prix |
|---|---|---|---|---|---|---|---|
| 73.2 % v7 (old) | 07/20 | Chuwi AeroBook Plus 6287U, Iris Graphics 550 | 1.7 kg | 15.9 mm | 15.60" | 3840x2160 | |
| 87.9 % v7 (old) | 11/18 | Apple MacBook Pro 15 2018 (2.6 GHz, 560X) i7-8850H, Radeon Pro 560X | 1.8 kg | 15.5 mm | 15.40" | 2880x1800 | |
| 81.4 % v7 (old) | 02/20 | Lenovo Ideapad S540-15IML i5-10210U, GeForce MX250 | 1.9 kg | 17 mm | 15.60" | 1920x1080 | |
| 80.1 % v6 (old) | 04/18 | HP Envy x360 15-bq102ng R5 2500U, Vega 8 | 2.1 kg | 19.6 mm | 15.60" | 1920x1080 | |
| 73.1 % v7 (old) | 05/20 | Asus Vivobook 15 F512DA-SH31 R3 3200U, Vega 3 | 1.8 kg | 19.9 mm | 15.60" | 1920x1080 |
| SD Card Reader | |
| average JPG Copy Test (av. of 3 runs) | |
| Dell XPS 15 7590 i5 iGPU FHD (Toshiba Exceria Pro SDXC 64 GB UHS-II) | |
| HP Envy x360 15-bq102ng (Toshiba Exceria Pro SDXC 64 GB UHS-II) | |
| Asus Vivobook 15 F512DA-SH31 (Toshiba Exceria Pro M501 64 GB UHS-II) | |
| Chuwi AeroBook Plus (Toshiba Exceria Pro M501 64 GB UHS-II) | |
| maximum AS SSD Seq Read Test (1GB) | |
| Dell XPS 15 7590 i5 iGPU FHD (Toshiba Exceria Pro SDXC 64 GB UHS-II) | |
| HP Envy x360 15-bq102ng (Toshiba Exceria Pro SDXC 64 GB UHS-II) | |
| Asus Vivobook 15 F512DA-SH31 (Toshiba Exceria Pro M501 64 GB UHS-II) | |
| Chuwi AeroBook Plus (Toshiba Exceria Pro M501 64 GB UHS-II) | |
| Networking | |
| iperf3 transmit AX12 | |
| Dynabook Portégé X30L-G | |
| Microsoft Surface Laptop 3 13 Core i5-1035G7 | |
| LG Gram 14Z90N | |
| Chuwi AeroBook Plus | |
| iperf3 receive AX12 | |
| LG Gram 14Z90N | |
| Dynabook Portégé X30L-G | |
| Microsoft Surface Laptop 3 13 Core i5-1035G7 | |
| Chuwi AeroBook Plus | |


| |||||||||||||||||||||||||
Homogénéité de la luminosité: 86 %
Valeur mesurée au centre, sur batterie: 336.9 cd/m²
Contraste: 1047:1 (Valeurs des noirs: 0.33 cd/m²)
ΔE ColorChecker Calman: 4.25 | ∀{0.5-29.43 Ø4.73}
calibrated: 3.49
ΔE Greyscale Calman: 5.8 | ∀{0.09-98 Ø4.97}
88% sRGB (Argyll 1.6.3 3D)
57.2% AdobeRGB 1998 (Argyll 1.6.3 3D)
64.7% AdobeRGB 1998 (Argyll 3D)
88.4% sRGB (Argyll 3D)
66.7% Display P3 (Argyll 3D)
Gamma: 2.13
CCT: 7771 K
| Chuwi AeroBook Plus BOE06C3, IPS, 15.6", 3840x2160 | Apple MacBook Pro 15 2018 (2.6 GHz, 560X) APPA040, IPS, 15.4", 2880x1800 | Dell XPS 15 7590 i5 iGPU FHD LQ156M1, IPS, 15.6", 1920x1080 | Lenovo Yoga C740-15IML B156HAN02.5, IPS LED, 15.6", 1920x1080 | HP Envy x360 15-bq102ng Chi Mei CM15E9, IPS, 15.6", 1920x1080 | Asus Vivobook 15 F512DA-SH31 AU Optronics B156HAN02.1, IPS, 15.6", 1920x1080 | |
|---|---|---|---|---|---|---|
| Display | 32% | 6% | -38% | -34% | -38% | |
| Display P3 Coverage (%) | 66.7 | 98.7 48% | 66.5 0% | 39.04 -41% | 41.36 -38% | 38.71 -42% |
| sRGB Coverage (%) | 88.4 | 99.9 13% | 98 11% | 57.9 -35% | 62.2 -30% | 58.2 -34% |
| AdobeRGB 1998 Coverage (%) | 64.7 | 86.6 34% | 68.4 6% | 40.33 -38% | 42.74 -34% | 40 -38% |
| Response Times | -11% | -25% | -23% | 3% | 1% | |
| Response Time Grey 50% / Grey 80% * (ms) | 39.6 ? | 43.2 ? -9% | 52.8 ? -33% | 50.8 ? -28% | 40 ? -1% | 36 ? 9% |
| Response Time Black / White * (ms) | 27.6 ? | 31.2 ? -13% | 32 ? -16% | 32.4 ? -17% | 26 ? 6% | 29.6 ? -7% |
| PWM Frequency (Hz) | 943 ? | 117000 ? | 1020 ? | 25000 ? | ||
| Screen | 43% | 33% | -27% | 7% | -39% | |
| Brightness middle (cd/m²) | 345.4 | 520 51% | 588 70% | 286 -17% | 221 -36% | 252.8 -27% |
| Brightness (cd/m²) | 318 | 492 55% | 555 75% | 268 -16% | 207 -35% | 237 -25% |
| Brightness Distribution (%) | 86 | 88 2% | 89 3% | 83 -3% | 87 1% | 89 3% |
| Black Level * (cd/m²) | 0.33 | 0.39 -18% | 0.4 -21% | 0.2 39% | 0.15 55% | 0.86 -161% |
| Contrast (:1) | 1047 | 1333 27% | 1470 40% | 1430 37% | 1473 41% | 294 -72% |
| Colorchecker dE 2000 * | 4.25 | 1.2 72% | 2.5 41% | 7.3 -72% | 4.35 -2% | 4.83 -14% |
| Colorchecker dE 2000 max. * | 9.34 | 2.3 75% | 6.3 33% | 21.7 -132% | 8.98 4% | 16.38 -75% |
| Colorchecker dE 2000 calibrated * | 3.49 | 0.6 83% | 5.1 -46% | 3.78 -8% | ||
| Greyscale dE 2000 * | 5.8 | 1.3 78% | 4.5 22% | 7 -21% | 3.09 47% | 4.6 21% |
| Gamma | 2.13 103% | 2.18 101% | 2.2 100% | 2.35 94% | 2.23 99% | 2.34 94% |
| CCT | 7771 84% | 6738 96% | 6836 95% | 5847 111% | 6068 107% | 6841 95% |
| Color Space (Percent of AdobeRGB 1998) (%) | 57.2 | 63.2 10% | 36.9 -35% | 56 -2% | 36.9 -35% | |
| Color Space (Percent of sRGB) (%) | 88 | 98 11% | 57.5 -35% | 86 -2% | 58.1 -34% | |
| Moyenne finale (programmes/paramètres) | 21% /
32% | 5% /
21% | -29% /
-29% | -8% /
-2% | -25% /
-34% |
* ... Moindre est la valeur, meilleures sont les performances
Temps de réponse de l'écran
| ↔ Temps de réponse noir à blanc | ||
|---|---|---|
| 27.6 ms ... hausse ↗ et chute ↘ combinées | ↗ 13.6 ms hausse | 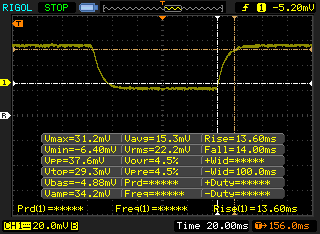 |
| ↘ 14 ms chute | ||
| L'écran souffre de latences relativement élevées, insuffisant pour le jeu. En comparaison, tous les appareils testés affichent entre 0.1 (minimum) et 240 (maximum) ms. » 70 % des appareils testés affichent de meilleures performances. Cela signifie que les latences relevées sont moins bonnes que la moyenne (19.9 ms) de tous les appareils testés. | ||
| ↔ Temps de réponse gris 50% à gris 80% | ||
| 39.6 ms ... hausse ↗ et chute ↘ combinées | ↗ 20.4 ms hausse | 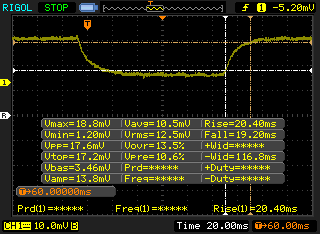 |
| ↘ 19.2 ms chute | ||
| L'écran souffre de latences très élevées, à éviter pour le jeu. En comparaison, tous les appareils testés affichent entre 0.165 (minimum) et 636 (maximum) ms. » 60 % des appareils testés affichent de meilleures performances. Cela signifie que les latences relevées sont moins bonnes que la moyenne (31.1 ms) de tous les appareils testés. | ||
Scintillement / MLI (Modulation de largeur d'impulsion)
| Scintillement / MLI (Modulation de largeur d'impulsion) décelé | 943 Hz | ≤ 99 Niveau de luminosité | 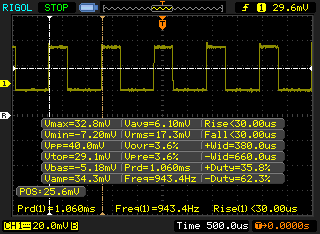 |
Le rétroéclairage de l'écran scintille à la fréquence de 943 Hz (certainement du fait de l'utilisation d'une MDI - Modulation de largeur d'impulsion) à un niveau de luminosité inférieur ou égal à 99 % . Aucun scintillement ne devrait être perceptible au-dessus de cette valeur. La fréquence de rafraîchissement de 943 Hz est élevée, la grande majorité des utilisateurs ne devrait pas percevoir de scintillements et être sujette à une fatigue oculaire accrue. En comparaison, 52 % des appareils testés n'emploient pas MDI pour assombrir leur écran. Nous avons relevé une moyenne à 7798 (minimum : 5 - maximum : 343500) Hz dans le cas où une MDI était active. | |||
Cinebench R20: CPU (Multi Core) | CPU (Single Core)
Blender: v2.79 BMW27 CPU
7-Zip 18.03: 7z b 4 -mmt1 | 7z b 4
Geekbench 5.5: Single-Core | Multi-Core
HWBOT x265 Benchmark v2.2: 4k Preset
LibreOffice : 20 Documents To PDF
R Benchmark 2.5: Overall mean
| Geekbench 5.5 / Single-Core | |
| Apple MacBook Pro 13 2020 2GHz i5 10th-Gen | |
| Asus ZenBook 15 UX534FTC-A8190T | |
| Apple MacBook Air 2020 i3 | |
| Acer Aspire 5 A515-54G | |
| Wacom MobileStudio Pro 13 i7 256GB | |
| Chuwi AeroBook Plus | |
| Moyenne Intel Core i5-6287U (825 - 939, n=2) | |
| Geekbench 5.5 / Multi-Core | |
| Apple MacBook Pro 13 2020 2GHz i5 10th-Gen | |
| Asus ZenBook 15 UX534FTC-A8190T | |
| Acer Aspire 5 A515-54G | |
| Wacom MobileStudio Pro 13 i7 256GB | |
| Chuwi AeroBook Plus | |
| Apple MacBook Air 2020 i3 | |
| Moyenne Intel Core i5-6287U (1935 - 2042, n=2) | |
| HWBOT x265 Benchmark v2.2 / 4k Preset | |
| Apple MacBook Pro 13 2020 2GHz i5 10th-Gen | |
| Lenovo IdeaPad S540-15IWL 81SW0015GE | |
| Microsoft Surface Laptop 3 13 Core i5-1035G7 | |
| Acer Aspire 5 A515-54G | |
| Dell Latitude 13 3390 | |
| Wacom MobileStudio Pro 13 i7 256GB | |
| Chuwi AeroBook Plus | |
| Moyenne Intel Core i5-6287U (n=1) | |
| Apple MacBook Air 2020 i3 | |
| LibreOffice / 20 Documents To PDF | |
| Apple MacBook Air 2020 i3 | |
| Apple MacBook Pro 13 2020 2GHz i5 10th-Gen | |
| Chuwi AeroBook Plus | |
| Moyenne Intel Core i5-6287U (n=1) | |
| Acer Aspire 5 A515-54G | |
| R Benchmark 2.5 / Overall mean | |
| Apple MacBook Air 2020 i3 | |
| Chuwi AeroBook Plus | |
| Moyenne Intel Core i5-6287U (n=1) | |
| Acer Aspire 5 A515-54G | |
| Apple MacBook Pro 13 2020 2GHz i5 10th-Gen | |
Cinebench R20: CPU (Multi Core) | CPU (Single Core)
Blender: v2.79 BMW27 CPU
7-Zip 18.03: 7z b 4 -mmt1 | 7z b 4
Geekbench 5.5: Single-Core | Multi-Core
HWBOT x265 Benchmark v2.2: 4k Preset
LibreOffice : 20 Documents To PDF
R Benchmark 2.5: Overall mean
* ... Moindre est la valeur, meilleures sont les performances
| PCMark 8 | |
| Home Score Accelerated v2 | |
| Lenovo Yoga C740-15IML | |
| Dell Latitude 15 3590 | |
| HP Envy x360 15-bq102ng | |
| Chuwi AeroBook Plus | |
| Asus Vivobook 15 F512DA-SH31 | |
| Work Score Accelerated v2 | |
| Lenovo Yoga C740-15IML | |
| Dell Latitude 15 3590 | |
| Asus Vivobook 15 F512DA-SH31 | |
| HP Envy x360 15-bq102ng | |
| Chuwi AeroBook Plus | |
| PCMark 8 Home Score Accelerated v2 | 2764 points | |
| PCMark 8 Work Score Accelerated v2 | 3609 points | |
| PCMark 10 Score | 3528 points | |
Aide | ||
| DPC Latencies / LatencyMon - interrupt to process latency (max), Web, Youtube, Prime95 | |
| Chuwi AeroBook Plus | |
* ... Moindre est la valeur, meilleures sont les performances
| Chuwi AeroBook Plus HIKVision HS-SSD-C100N M.2 SATA III SSD 256 GB | HP Envy x360 15-bq102ng Samsung PM961 MZVLW256HEHP | Dell XPS 15 7590 i5 iGPU FHD Toshiba XG6 KXG60ZNV512G | Lenovo Yoga C740-15IML Samsung SSD PM981 MZVLB512HAJQ | Asus Vivobook 15 F512DA-SH31 SanDisk X600 SD9SN8W-128G | |
|---|---|---|---|---|---|
| AS SSD | 268% | 640% | 678% | -12% | |
| Seq Read (MB/s) | 469 | 2465 426% | 2357 403% | 2732 483% | 341.4 -27% |
| Seq Write (MB/s) | 418.3 | 1318 215% | 1235 195% | 1477 253% | 134.2 -68% |
| 4K Read (MB/s) | 21.17 | 42.97 103% | 43.29 104% | 57.7 173% | 27.83 31% |
| 4K Write (MB/s) | 48.31 | 81.9 70% | 99.7 106% | 136.3 182% | 54.9 14% |
| 4K-64 Read (MB/s) | 155.4 | 1025 560% | 1020 556% | 1021 557% | 217.1 40% |
| 4K-64 Write (MB/s) | 56.6 | 338.6 498% | 1502 2554% | 1651 2817% | 68.1 20% |
| Access Time Read * (ms) | 0.11 | 0.077 30% | 0.07 36% | 0.062 44% | 0.153 -39% |
| Access Time Write * (ms) | 0.726 | 0.046 94% | 0.039 95% | 0.028 96% | 1.075 -48% |
| Score Read (Points) | 223 | 1314 489% | 1299 483% | 1352 506% | 279 25% |
| Score Write (Points) | 147 | 552 276% | 1726 1074% | 1935 1216% | 136 -7% |
| Score Total (Points) | 490 | 2488 408% | 3640 643% | 3929 702% | 559 14% |
| Copy ISO MB/s (MB/s) | 407 | 700 72% | 2145 427% | 1972 385% | 115.9 -72% |
| Copy Program MB/s (MB/s) | 80.6 | 167.2 107% | 565 601% | 642 697% | 44.51 -45% |
| Copy Game MB/s (MB/s) | 73.9 | 370.4 401% | 1320 1686% | 1090 1375% | 74.3 1% |
| CrystalDiskMark 5.2 / 6 | 152% | 218% | 275% | -22% | |
| Write 4K (MB/s) | 115.3 | 116 1% | 93.6 -19% | 142.3 23% | 65.2 -43% |
| Read 4K (MB/s) | 28.98 | 42.73 47% | 41.87 44% | 47.56 64% | 31.22 8% |
| Write Seq (MB/s) | 352.8 | 1222 246% | 1698 381% | 2185 519% | 284.8 -19% |
| Read Seq (MB/s) | 506 | 1608 218% | 1978 291% | 2235 342% | 497.5 -2% |
| Write 4K Q32T1 (MB/s) | 275.9 | 280.1 2% | 383.1 39% | 515 87% | 164 -41% |
| Read 4K Q32T1 (MB/s) | 219.9 | 333.6 52% | 326.9 49% | 413.4 88% | 230.2 5% |
| Write Seq Q32T1 (MB/s) | 466.2 | 1291 177% | 2778 496% | 2981 539% | 221.7 -52% |
| Read Seq Q32T1 (MB/s) | 558 | 3183 470% | 3119 459% | 3565 539% | 389.7 -30% |
| Moyenne finale (programmes/paramètres) | 210% /
226% | 429% /
487% | 477% /
531% | -17% /
-15% |
* ... Moindre est la valeur, meilleures sont les performances

Disk Throttling: DiskSpd Read Loop, Queue Depth 8
| 3DMark 11 Performance | 2695 points | |
| 3DMark Cloud Gate Standard Score | 8532 points | |
| 3DMark Fire Strike Score | 1552 points | |
| 3DMark Time Spy Score | 599 points | |
Aide | ||
| Bas | Moyen | Élevé | Ultra | |
|---|---|---|---|---|
| Dota 2 Reborn (2015) | 82.5 | 43.5 | 26.9 | 23.6 |
| X-Plane 11.11 (2018) | 22.7 | 15.9 | 14.1 |
| Chuwi AeroBook Plus Iris Graphics 550, 6287U, HIKVision HS-SSD-C100N M.2 SATA III SSD 256 GB | Apple MacBook Pro 15 2018 (2.6 GHz, 560X) Radeon Pro 560X, i7-8850H, Apple SSD AP0512 | Dell XPS 15 7590 i5 iGPU FHD UHD Graphics 630, i5-9300H, Toshiba XG6 KXG60ZNV512G | Lenovo Yoga C740-15IML UHD Graphics 620, i7-10510U, Samsung SSD PM981 MZVLB512HAJQ | HP Envy x360 15-bq102ng Vega 8, R5 2500U, Samsung PM961 MZVLW256HEHP | Asus Vivobook 15 F512DA-SH31 Vega 3, R3 3200U, SanDisk X600 SD9SN8W-128G | |
|---|---|---|---|---|---|---|
| Noise | -7% | 5% | 7% | -0% | 8% | |
| arrêt / environnement * (dB) | 28.5 | 29.6 -4% | 29.3 -3% | 29.3 -3% | 30.13 -6% | 29.2 -2% |
| Idle Minimum * (dB) | 28.5 | 30.1 -6% | 29.3 -3% | 29.3 -3% | 30.13 -6% | 29.2 -2% |
| Idle Average * (dB) | 31.1 | 30.1 3% | 29.3 6% | 29.3 6% | 30.13 3% | 29.2 6% |
| Idle Maximum * (dB) | 33 | 30.1 9% | 29.8 10% | 29.6 10% | 30.13 9% | 29.2 12% |
| Load Average * (dB) | 36.4 | 46.8 -29% | 32.4 11% | 32.4 11% | 38.8 -7% | 30.5 16% |
| Load Maximum * (dB) | 41.2 | 46.8 -14% | 37.2 10% | 33.3 19% | 38.8 6% | 34 17% |
| Witcher 3 ultra * (dB) | 36 |
* ... Moindre est la valeur, meilleures sont les performances
Degré de la nuisance sonore
| Au repos |
| 28.5 / 31.1 / 33 dB(A) |
| Fortement sollicité |
| 36.4 / 41.2 dB(A) |
 | ||
30 dB silencieux 40 dB(A) audible 50 dB(A) bruyant |
||
min: | ||
(±) La température maximale du côté supérieur est de 44.8 °C / 113 F, par rapport à la moyenne de 36.8 °C / 98 F, allant de 21 à 71 °C pour la classe Multimedia.
(-) Le fond chauffe jusqu'à un maximum de 49.2 °C / 121 F, contre une moyenne de 39.1 °C / 102 F
(+) En utilisation inactive, la température moyenne du côté supérieur est de 30.3 °C / 87 F, par rapport à la moyenne du dispositif de 31.3 °C / 88 F.
(+) Les repose-poignets et le pavé tactile sont plus froids que la température de la peau avec un maximum de 31 °C / 87.8 F et sont donc froids au toucher.
(-) La température moyenne de la zone de l'appui-paume de dispositifs similaires était de 28.7 °C / 83.7 F (-2.3 °C / #-4.1 F).
Chuwi AeroBook Plus analyse audio
(±) | le niveau sonore du haut-parleur est moyen mais bon (79.4# dB)
Basses 100 - 315 Hz
(-) | presque aucune basse - en moyenne 17.5% plus bas que la médiane
(±) | la linéarité des basses est moyenne (10.3% delta à la fréquence précédente)
Médiums 400 - 2000 Hz
(±) | médiane supérieure - en moyenne 6.1% supérieure à la médiane
(±) | la linéarité des médiums est moyenne (8.8% delta à la fréquence précédente)
Aiguës 2 - 16 kHz
(+) | des sommets équilibrés - à seulement 4.8% de la médiane
(±) | la linéarité des aigus est moyenne (10.8% delta à la fréquence précédente)
Globalement 100 - 16 000 Hz
(±) | la linéarité du son global est moyenne (24.3% de différence avec la médiane)
Par rapport à la même classe
» 86% de tous les appareils testés de cette catégorie étaient meilleurs, 5% similaires, 9% pires
» Le meilleur avait un delta de 5%, la moyenne était de 17%, le pire était de 45%.
Par rapport à tous les appareils testés
» 74% de tous les appareils testés étaient meilleurs, 6% similaires, 21% pires
» Le meilleur avait un delta de 4%, la moyenne était de 24%, le pire était de 134%.
Apple MacBook 12 (Early 2016) 1.1 GHz analyse audio
(+) | les haut-parleurs peuvent jouer relativement fort (83.6# dB)
Basses 100 - 315 Hz
(±) | basse réduite - en moyenne 11.3% inférieure à la médiane
(±) | la linéarité des basses est moyenne (14.2% delta à la fréquence précédente)
Médiums 400 - 2000 Hz
(+) | médiane équilibrée - seulement 2.4% de la médiane
(+) | les médiums sont linéaires (5.5% delta à la fréquence précédente)
Aiguës 2 - 16 kHz
(+) | des sommets équilibrés - à seulement 2% de la médiane
(+) | les aigus sont linéaires (4.5% delta à la fréquence précédente)
Globalement 100 - 16 000 Hz
(+) | le son global est linéaire (10.2% différence à la médiane)
Par rapport à la même classe
» 7% de tous les appareils testés de cette catégorie étaient meilleurs, 2% similaires, 91% pires
» Le meilleur avait un delta de 5%, la moyenne était de 18%, le pire était de 53%.
Par rapport à tous les appareils testés
» 5% de tous les appareils testés étaient meilleurs, 1% similaires, 94% pires
» Le meilleur avait un delta de 4%, la moyenne était de 24%, le pire était de 134%.
| Éteint/en veille | |
| Au repos | |
| Fortement sollicité |
|
Légende:
min: | |
| Chuwi AeroBook Plus 6287U, Iris Graphics 550, HIKVision HS-SSD-C100N M.2 SATA III SSD 256 GB, IPS, 3840x2160, 15.6" | Apple MacBook Pro 15 2018 (2.6 GHz, 560X) i7-8850H, Radeon Pro 560X, Apple SSD AP0512, IPS, 2880x1800, 15.4" | Dell XPS 15 7590 i5 iGPU FHD i5-9300H, UHD Graphics 630, Toshiba XG6 KXG60ZNV512G, IPS, 1920x1080, 15.6" | Lenovo Yoga C740-15IML i7-10510U, UHD Graphics 620, Samsung SSD PM981 MZVLB512HAJQ, IPS LED, 1920x1080, 15.6" | HP Envy x360 15-bq102ng R5 2500U, Vega 8, Samsung PM961 MZVLW256HEHP, IPS, 1920x1080, 15.6" | Dell Latitude 15 3590 i5-8250U, UHD Graphics 620, Samsung SSD PM871b MZ7LN256HAJQ, TN LED, 1920x1080, 15.6" | |
|---|---|---|---|---|---|---|
| Power Consumption | -2% | 11% | 35% | 39% | 47% | |
| Idle Minimum * (Watt) | 11.8 | 3.4 71% | 3.79 68% | 2.97 75% | 4.8 59% | 4.3 64% |
| Idle Average * (Watt) | 13.3 | 11 17% | 6.9 48% | 7.2 46% | 7 47% | 7.2 46% |
| Idle Maximum * (Watt) | 16.4 | 14.9 9% | 9.2 44% | 9.9 40% | 9.5 42% | 9.8 40% |
| Load Average * (Watt) | 52.2 | 78.9 -51% | 62 -19% | 40.8 22% | 40.8 22% | 38 27% |
| Load Maximum * (Watt) | 58.6 | 91.2 -56% | 108 -84% | 64.7 -10% | 44.3 24% | 24 59% |
* ... Moindre est la valeur, meilleures sont les performances
| Chuwi AeroBook Plus 6287U, Iris Graphics 550, 55 Wh | Apple MacBook Pro 15 2018 (2.6 GHz, 560X) i7-8850H, Radeon Pro 560X, 83 Wh | Dell XPS 15 7590 i5 iGPU FHD i5-9300H, UHD Graphics 630, 97 Wh | Lenovo Yoga C740-15IML i7-10510U, UHD Graphics 620, 60.3 Wh | HP Envy x360 15-bq102ng R5 2500U, Vega 8, 55.8 Wh | Asus Vivobook 15 F512DA-SH31 R3 3200U, Vega 3, 37 Wh | |
|---|---|---|---|---|---|---|
| Autonomie de la batterie | 149% | 244% | 154% | 73% | 46% | |
| WiFi v1.3 (h) | 4.1 | 10.2 149% | 14.1 244% | 10.4 154% | 7.1 73% | 6 46% |
| Witcher 3 ultra (h) | 1.5 | |||||
| Load (h) | 1.7 | 2 |
Points positifs
Points négatifs
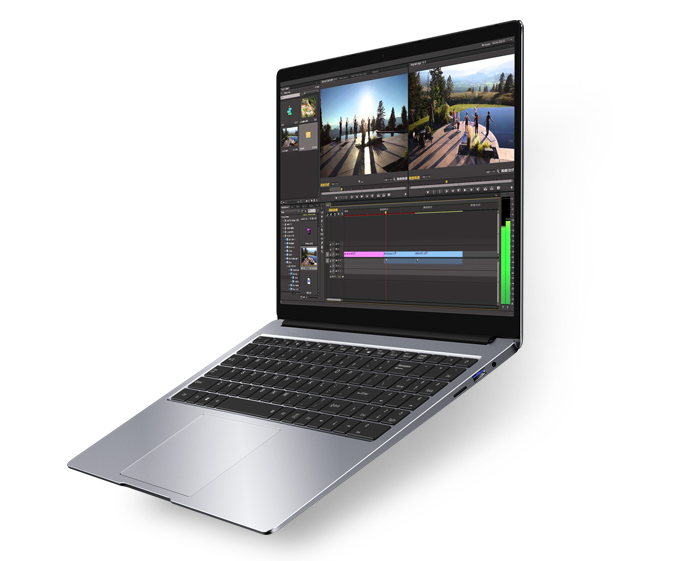
Le Chuwi AeroBook Plus taille dans les coûts afin d'intégrer un bel écran 4K à ce niveau de prix. Certains sont compréhensibles, comme le WLAN 1x1, la RAM soudée, le SSD SATA III, et l'absence de Thunderbolt 3. D'autres sont plus difficiles à accepter. Le clavier et le clickpad peu fiables rendent l'appareil plus difficile à utiliser que nécessaire, et la longévité des charnières est sujette à caution. Le contrôle qualité pourrait sans doute être meilleure, au vu de notre expérience avec plusieurs de leurs portables. Mais notre modèle est peut-être un modèle de préproduction, l'AeroBook Plus étant toujours dans sa phase de crowdfunding.
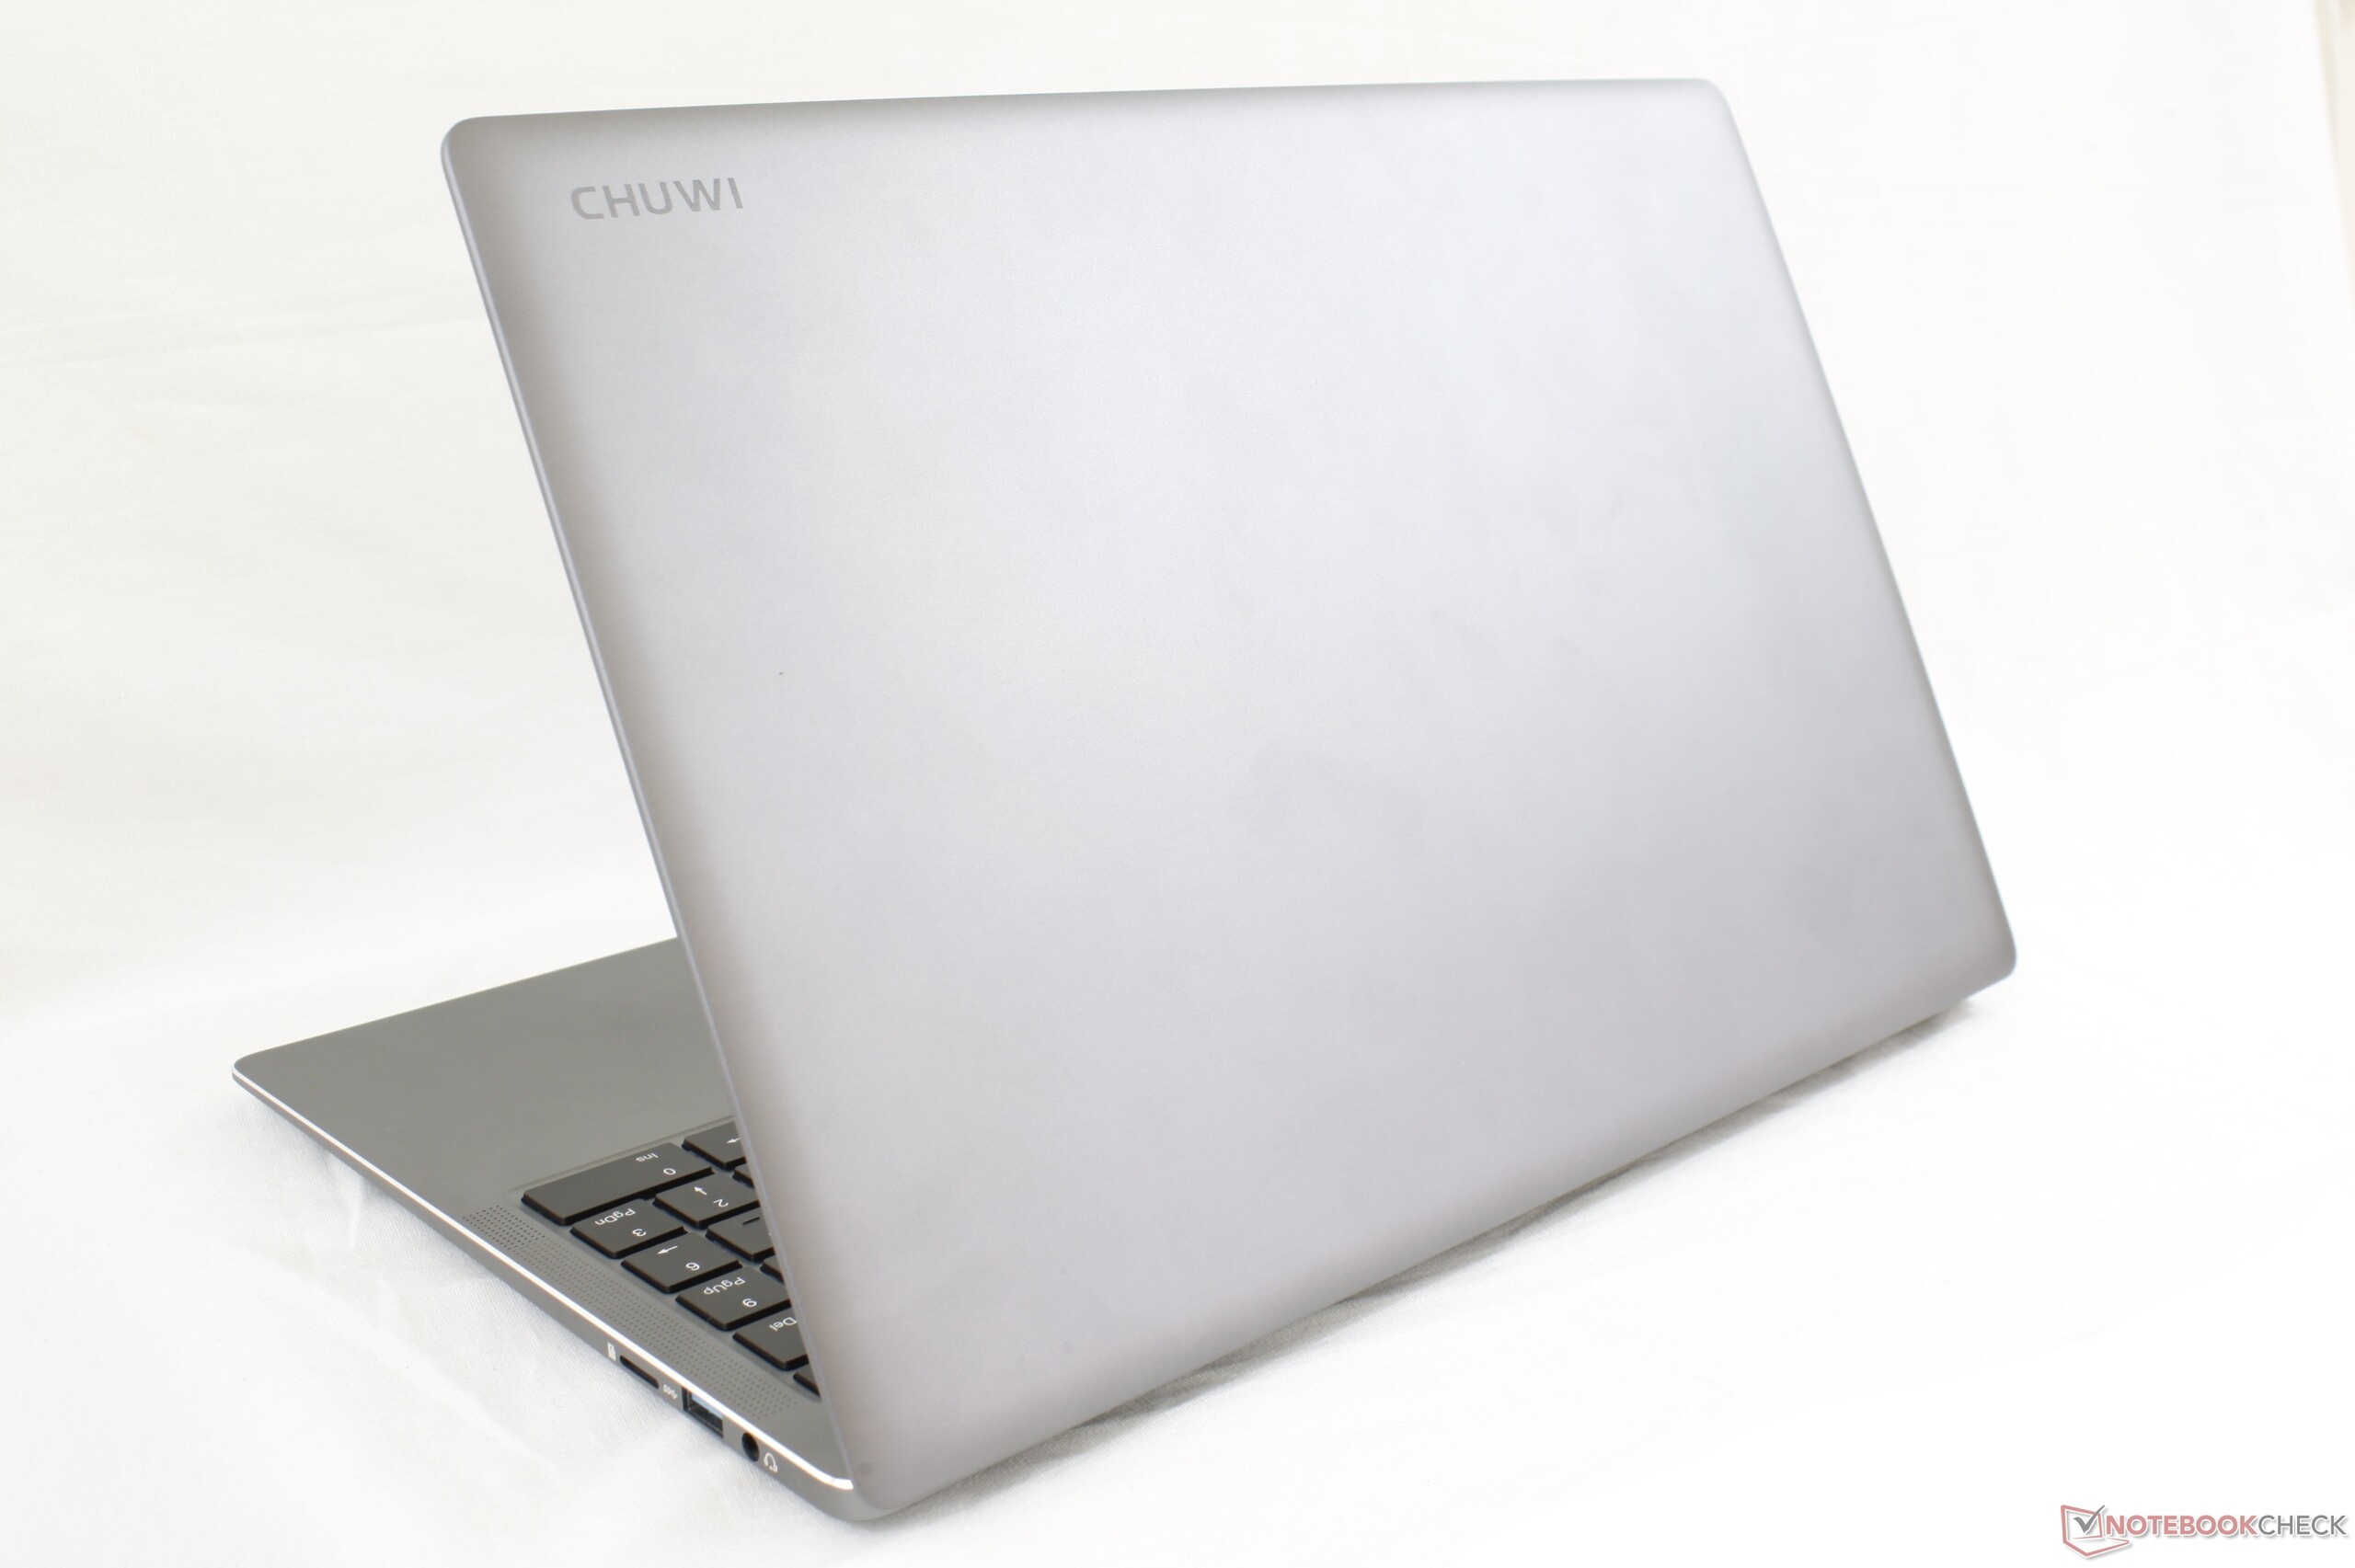
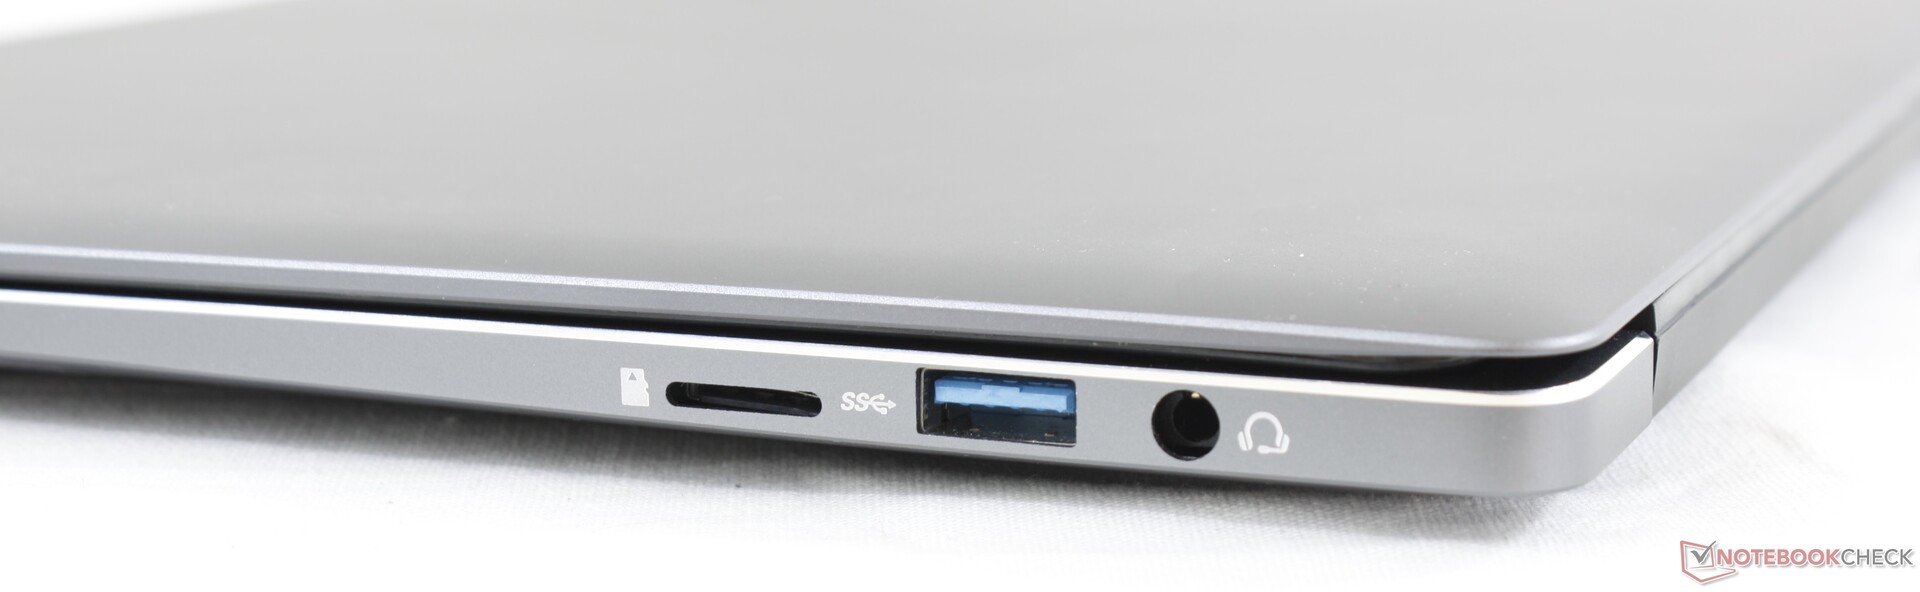
Quelques aspects de l'appareil méritent des louanges. La grand clickpad, la course des touches, la variété des ports et le design permettent à l'AeroBook de se démarquer. D'autres appareils de cette gamme de prix, tels les Asus VivoBook, Dell Inspiron ou HP Pavilion sont majoritairement en plastique, et son plus épais.
Ceux qui veulent absolument un ultrabook avec un écran 4K sans avoir à casser leur tirelire devraient plutôt se tourner vers d'anciens PC portables Dell, HP ou Lenovo avec des processeurs Kaby Lake ou Kaby Lake R, parce qu'ils ont de meilleures garanties et un meilleur contrôle qualité.
Belle allure et excellent écran 4K - tout le reste est moyen ou nécessite d'être changé, tel le clickpad peu fiable, les charnières fragiles ou les touches de clavier non réactives.
L’intégralité de cette critique est disponible en anglais en suivant ce lien.
Chuwi AeroBook Plus
- 05/22/2020 v7 (old)
Allen Ngo
Price comparison
