 Deutsch
 English
 Español
 Français
 Italiano
 Nederlands
 Polski
 Português
 Русский
 Türkçe
 Svenska
 Chinese
 Magyar
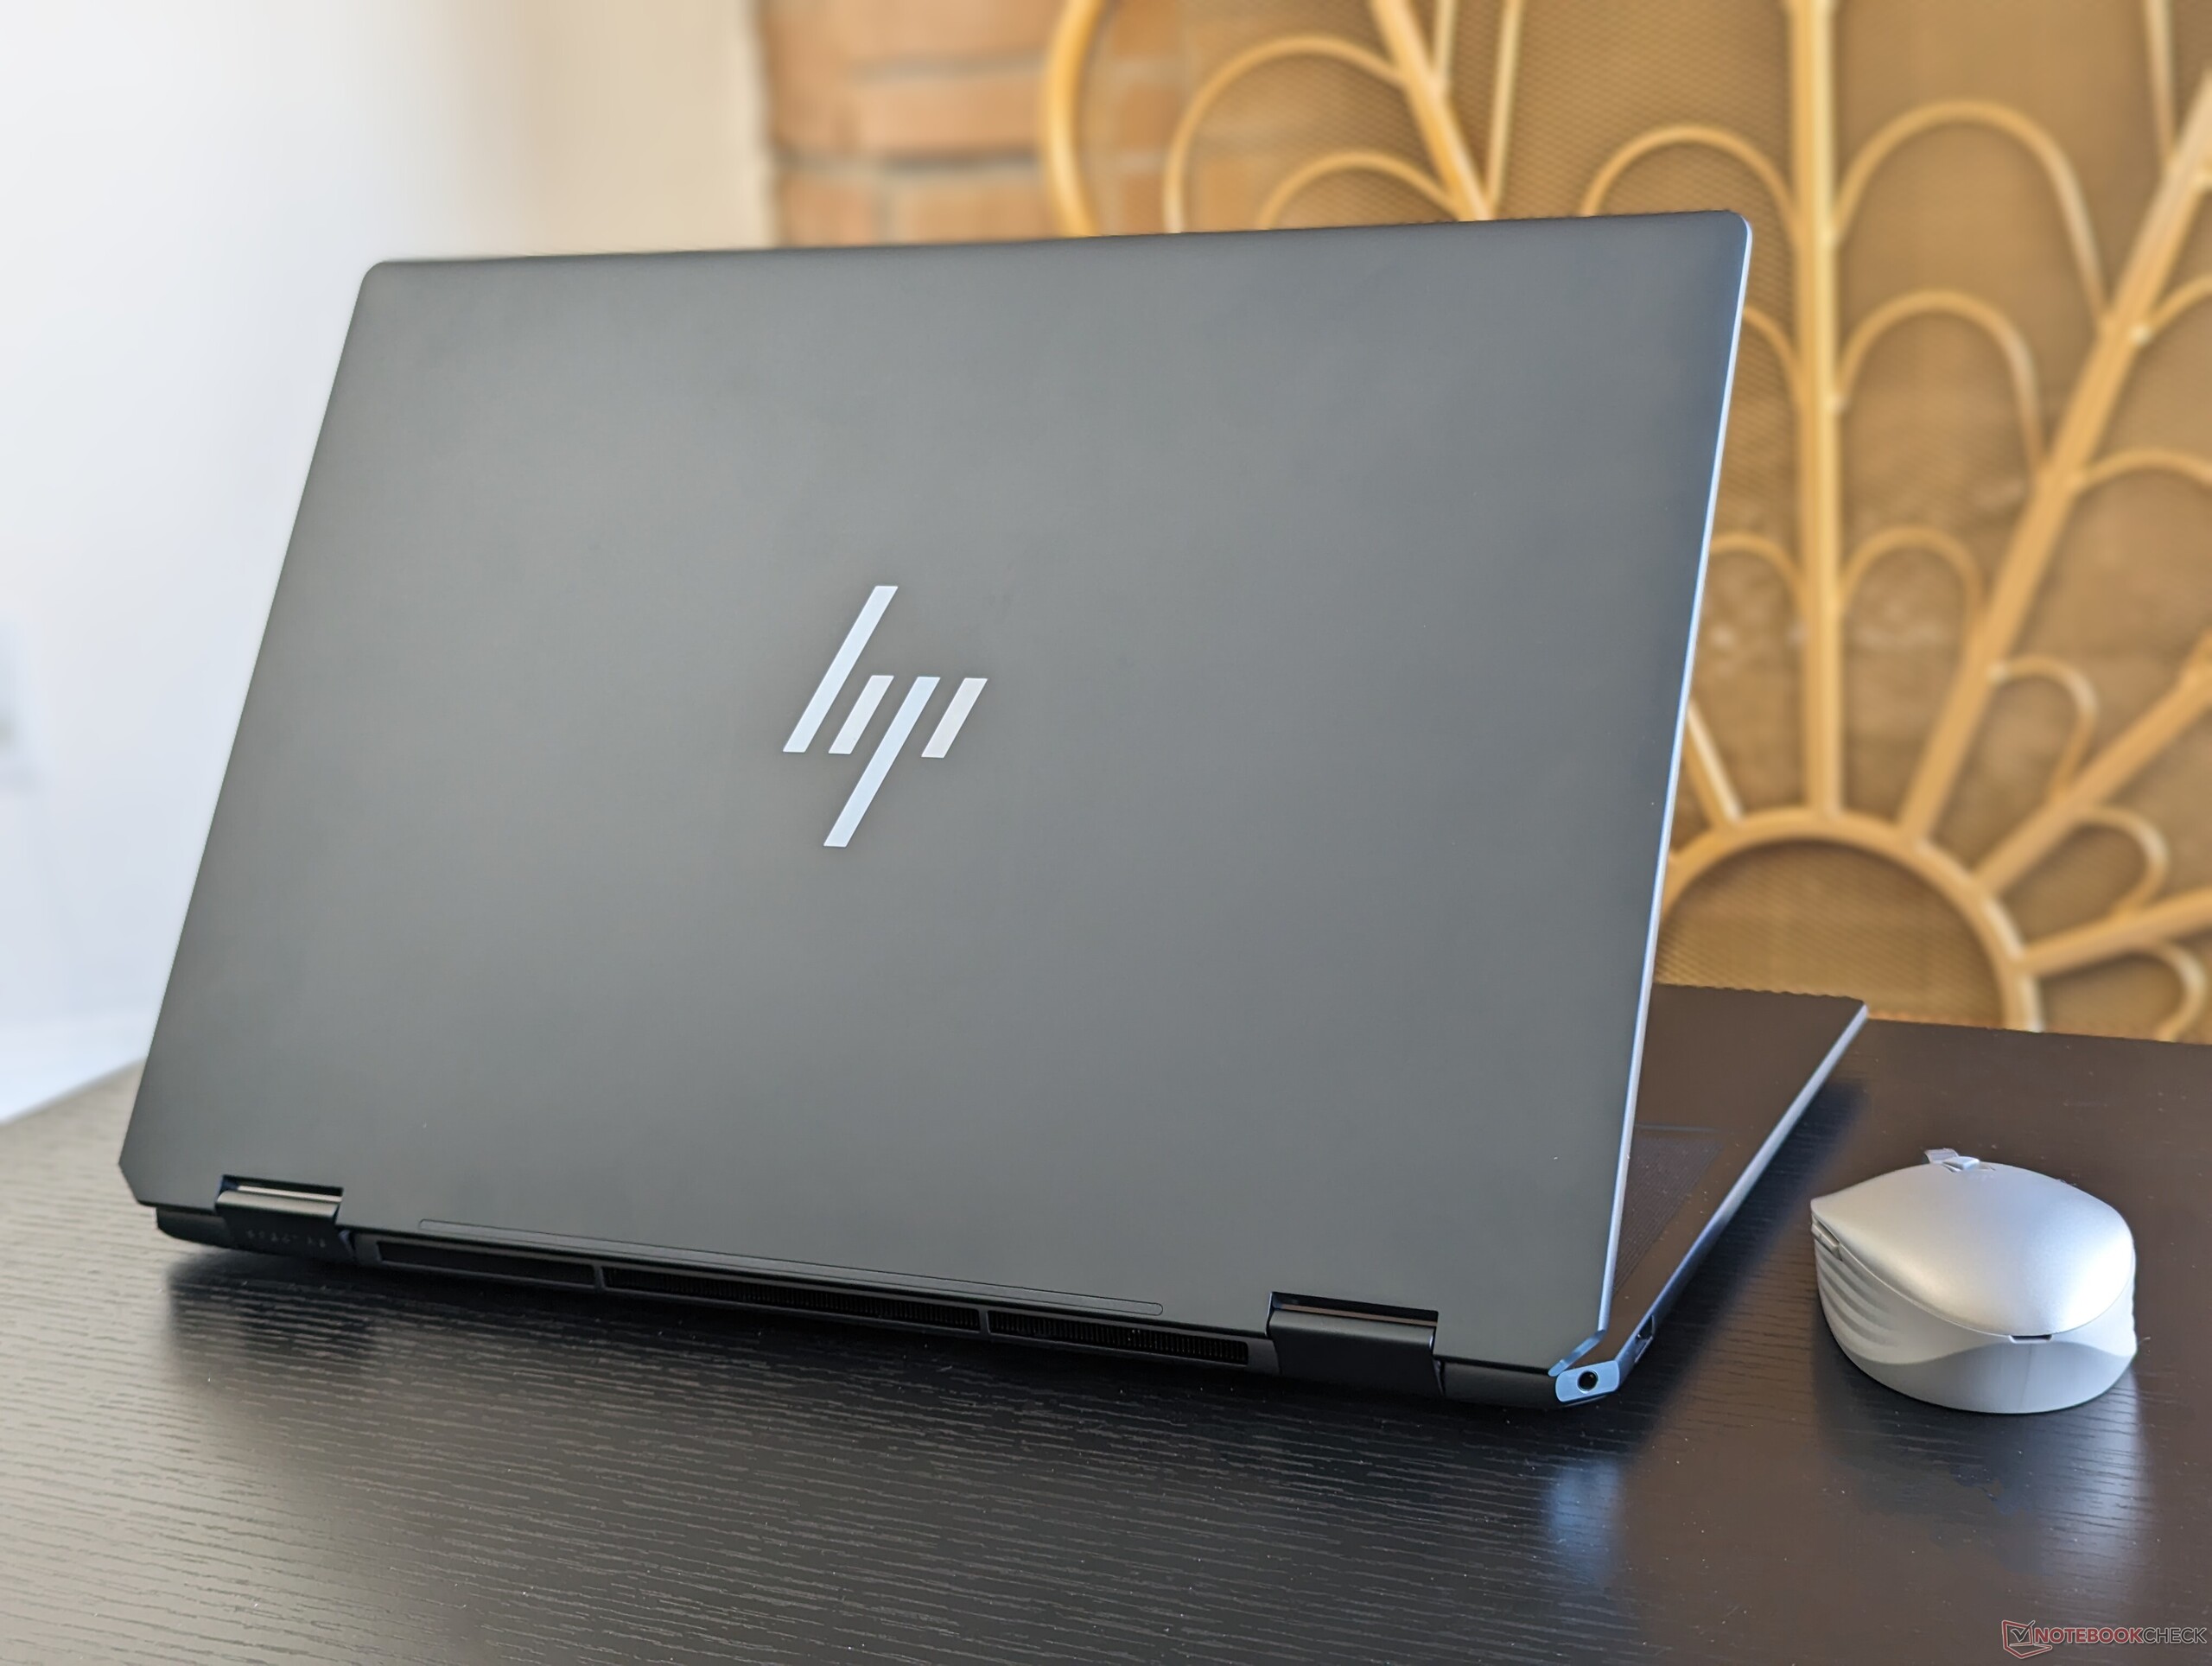
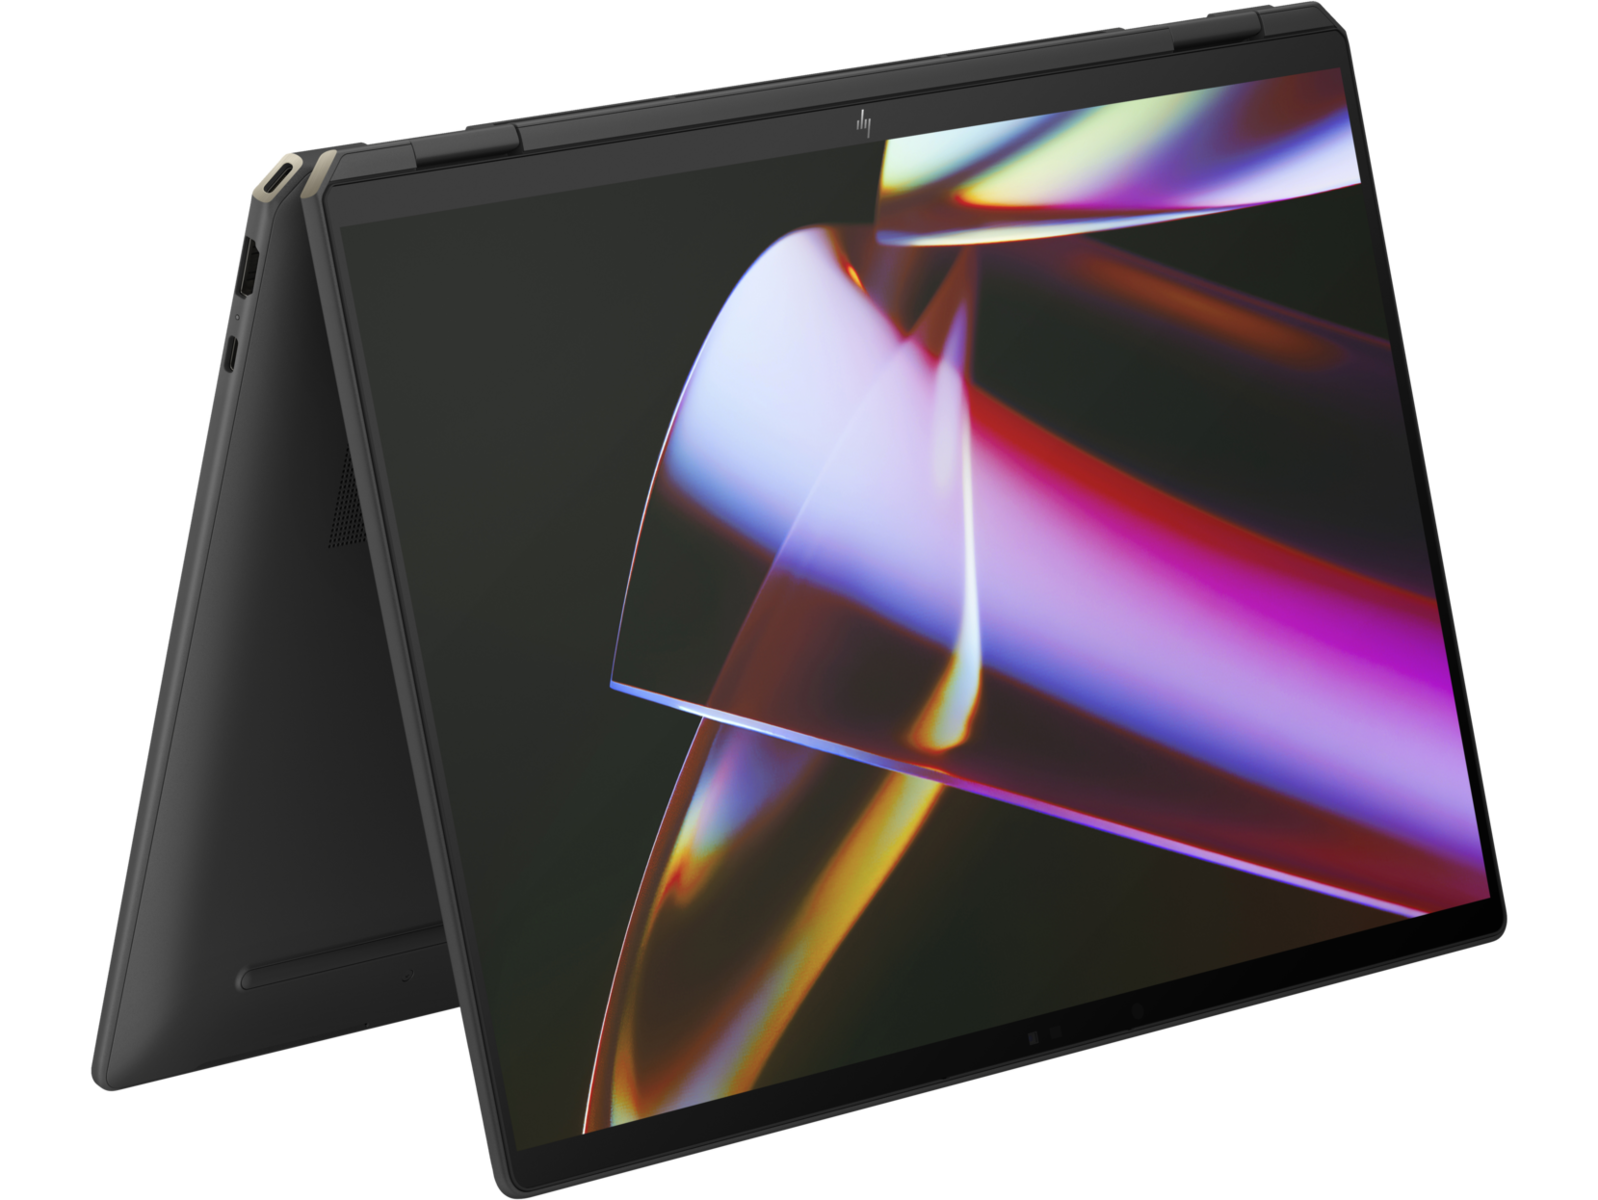
Test du HP Spectre x360 16 : convertible avec maintenant une RTX GeForce 4050 de 55 W

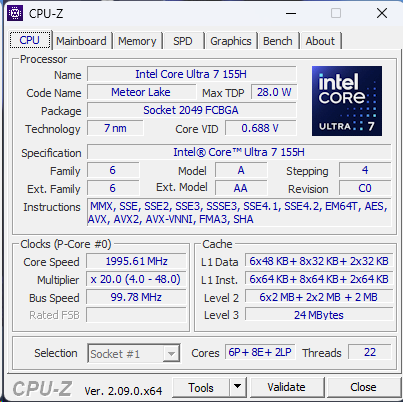
Après avoir récemment passé en revue la version iGPU du nouveau Spectre x360 16, nous sommes maintenant prêts à examiner la configuration RTX GeForce du même modèle. Tout le reste de l'ordinateur portable reste identique entre les deux configurations et nous vous recommandons donc de consulter notre revue existante sur la SKU iGPU pour en savoir plus sur les caractéristiques physiques de l'ordinateur portable convertible.
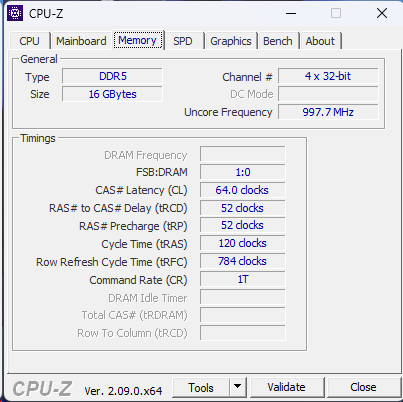
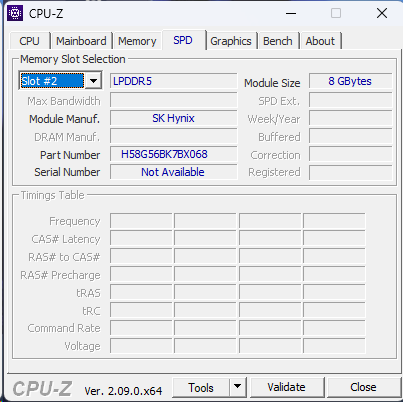
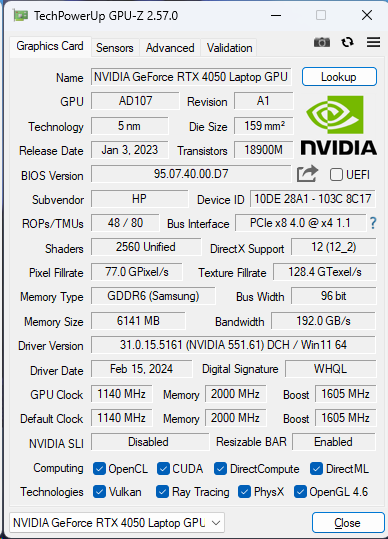
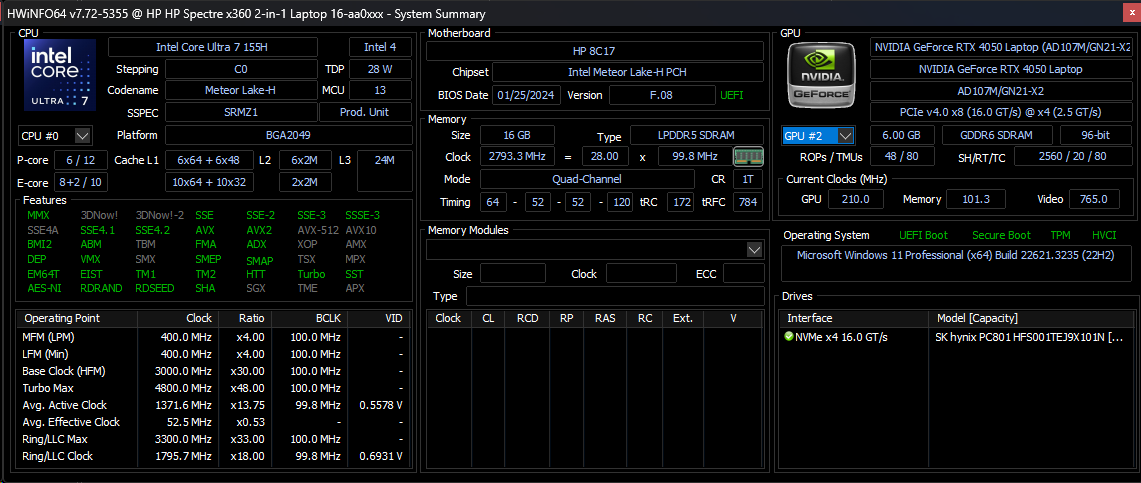
Notre modèle est configuré avec un processeur Core Ultra 7 155H de première génération, un GPU RTX 4050 de 55 W GeForce, 16 Go de RAM soudée et un écran tactile OLED 1800p pour un prix de détail d'environ 1600 $. D'autres SKUs peuvent inclure le double de RAM ou un écran tactile 1600p 120 Hz IPS à la place, mais tous ont le même CPU Core Ultra 7 et le même GPU RTX 4050.
Plus d'avis sur HP :
Comparaison avec les concurrents potentiels
Note | Date | Modèle | Poids | Épaisseur | Taille | Résolution | Meilleur prix |
|---|---|---|---|---|---|---|---|
| 91.1 % | 03/24 | HP Spectre x360 16 RTX 4050 Ultra 7 155H, NVIDIA GeForce RTX 4050 Laptop GPU | 2 kg | 19.8 mm | 16.00" | 2880x1800 | |
| 91.4 % | 02/24 | HP Spectre x360 16-aa0074ng Ultra 7 155H, Arc 8-Cores | 1.9 kg | 19.8 mm | 16.00" | 2880x1800 | |
| 87.3 % | 01/23 | HP Spectre x360 2-in-1 16-f1075ng i7-12700H, Iris Xe G7 96EUs | 2 kg | 19.9 mm | 16.00" | 3072x1920 | |
| 90 % | 03/24 | Honor MagicBook Pro 16 2024 Ultra 7 155H, NVIDIA GeForce RTX 4060 Laptop GPU | 1.9 kg | 17.9 mm | 16.00" | 3072x1920 | |
| 88.1 % | 12/23 | MSI Prestige 16 B1MG-001US Ultra 7 155H, Arc 8-Cores | 1.6 kg | 19.1 mm | 16.00" | 2560x1600 | |
| 85.8 % | 11/23 | LG Gram 2in1 16 16T90R - G.AA78G i7-1360P, Iris Xe G7 96EUs | 1.5 kg | 17.2 mm | 16.00" | 2560x1600 |
Cas
La configuration dGPU est légèrement plus lourde que l'option iGPU d'environ 100 g.
Communication
Webcam


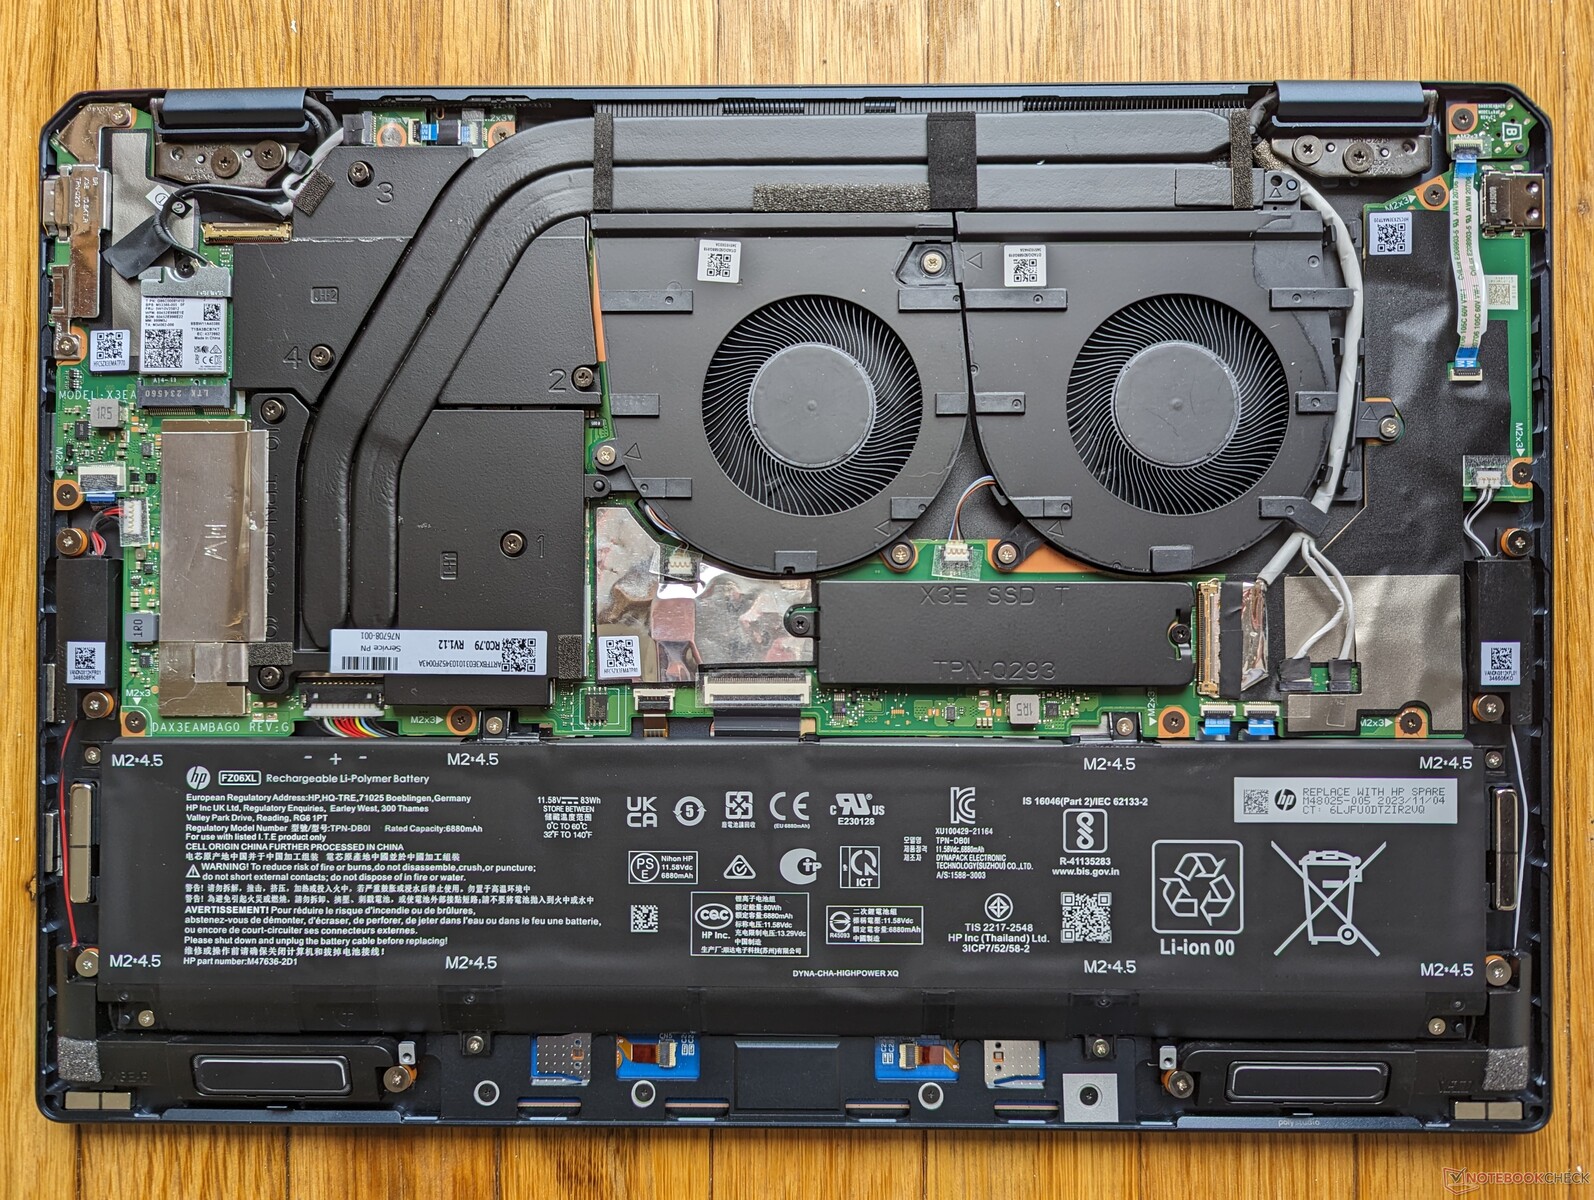
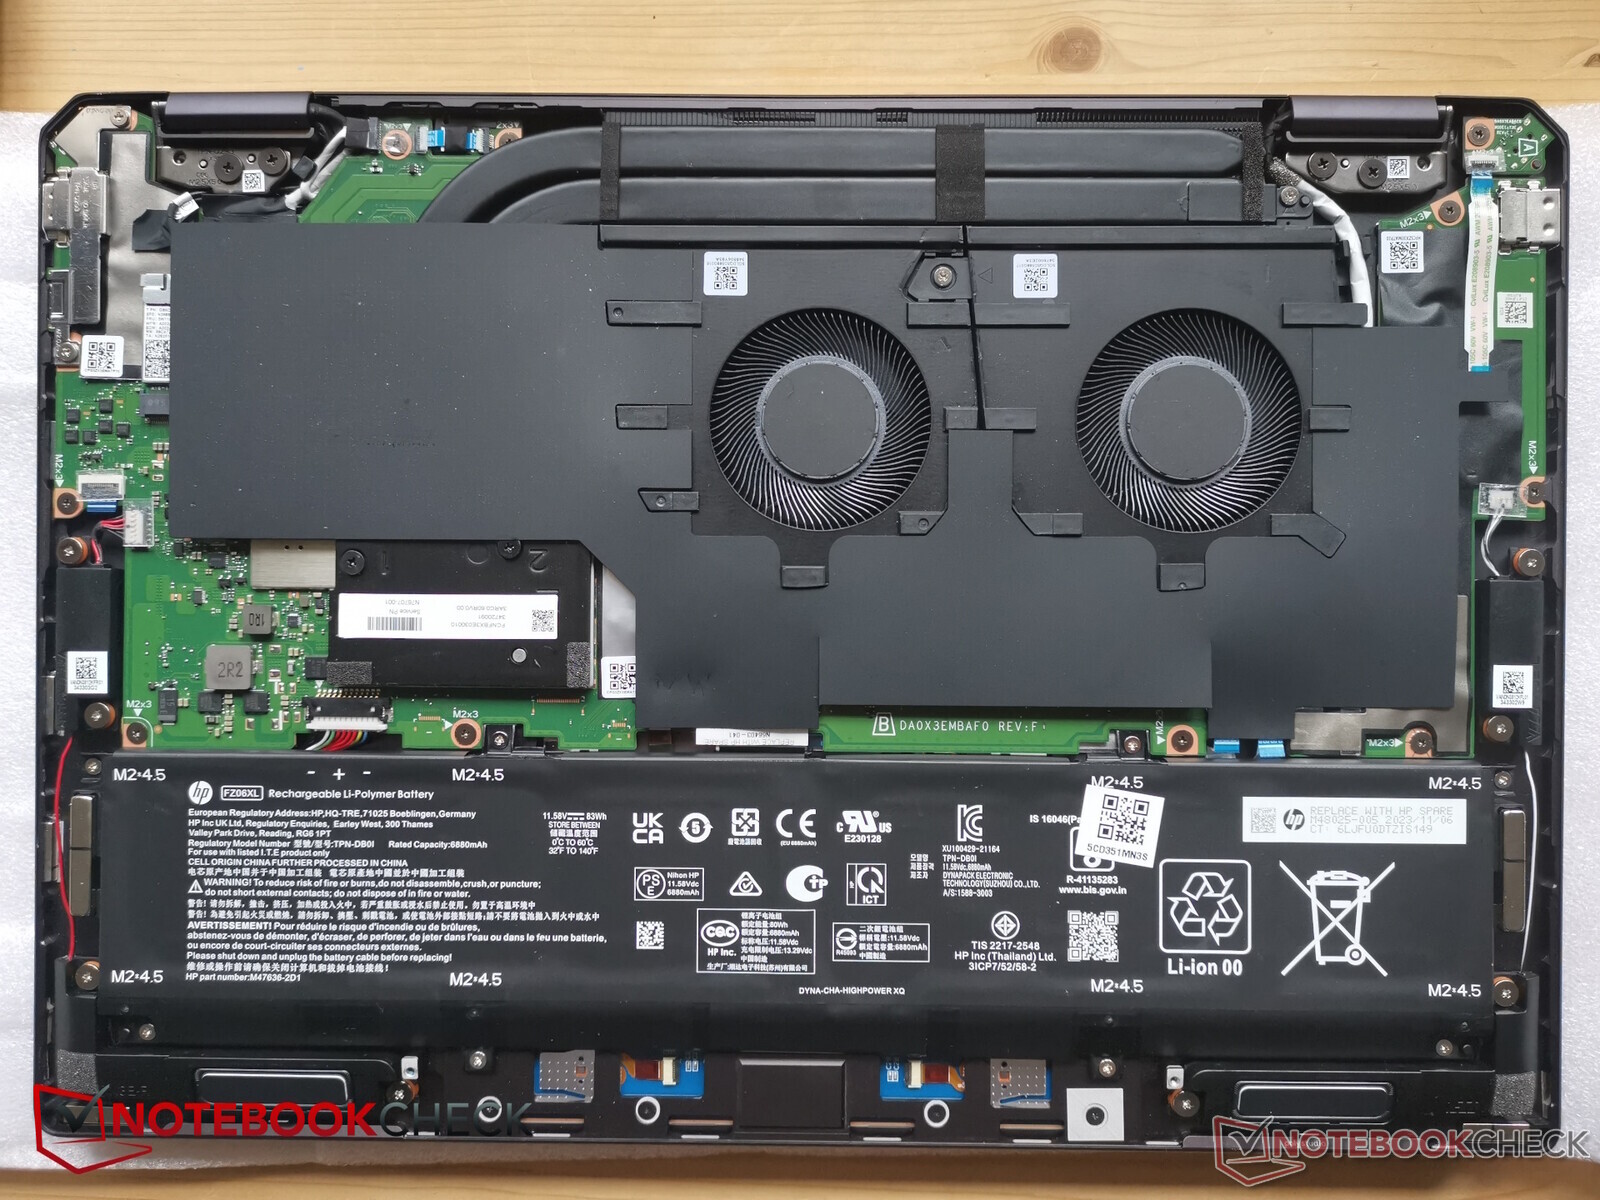
Maintenance
La configuration dGPU comprend des caloducs en cuivre plus longs que la version iGPU, comme indiqué ci-dessous, ce qui contribue à un poids légèrement plus élevé. Pour le reste, la carte mère est pratiquement identique.
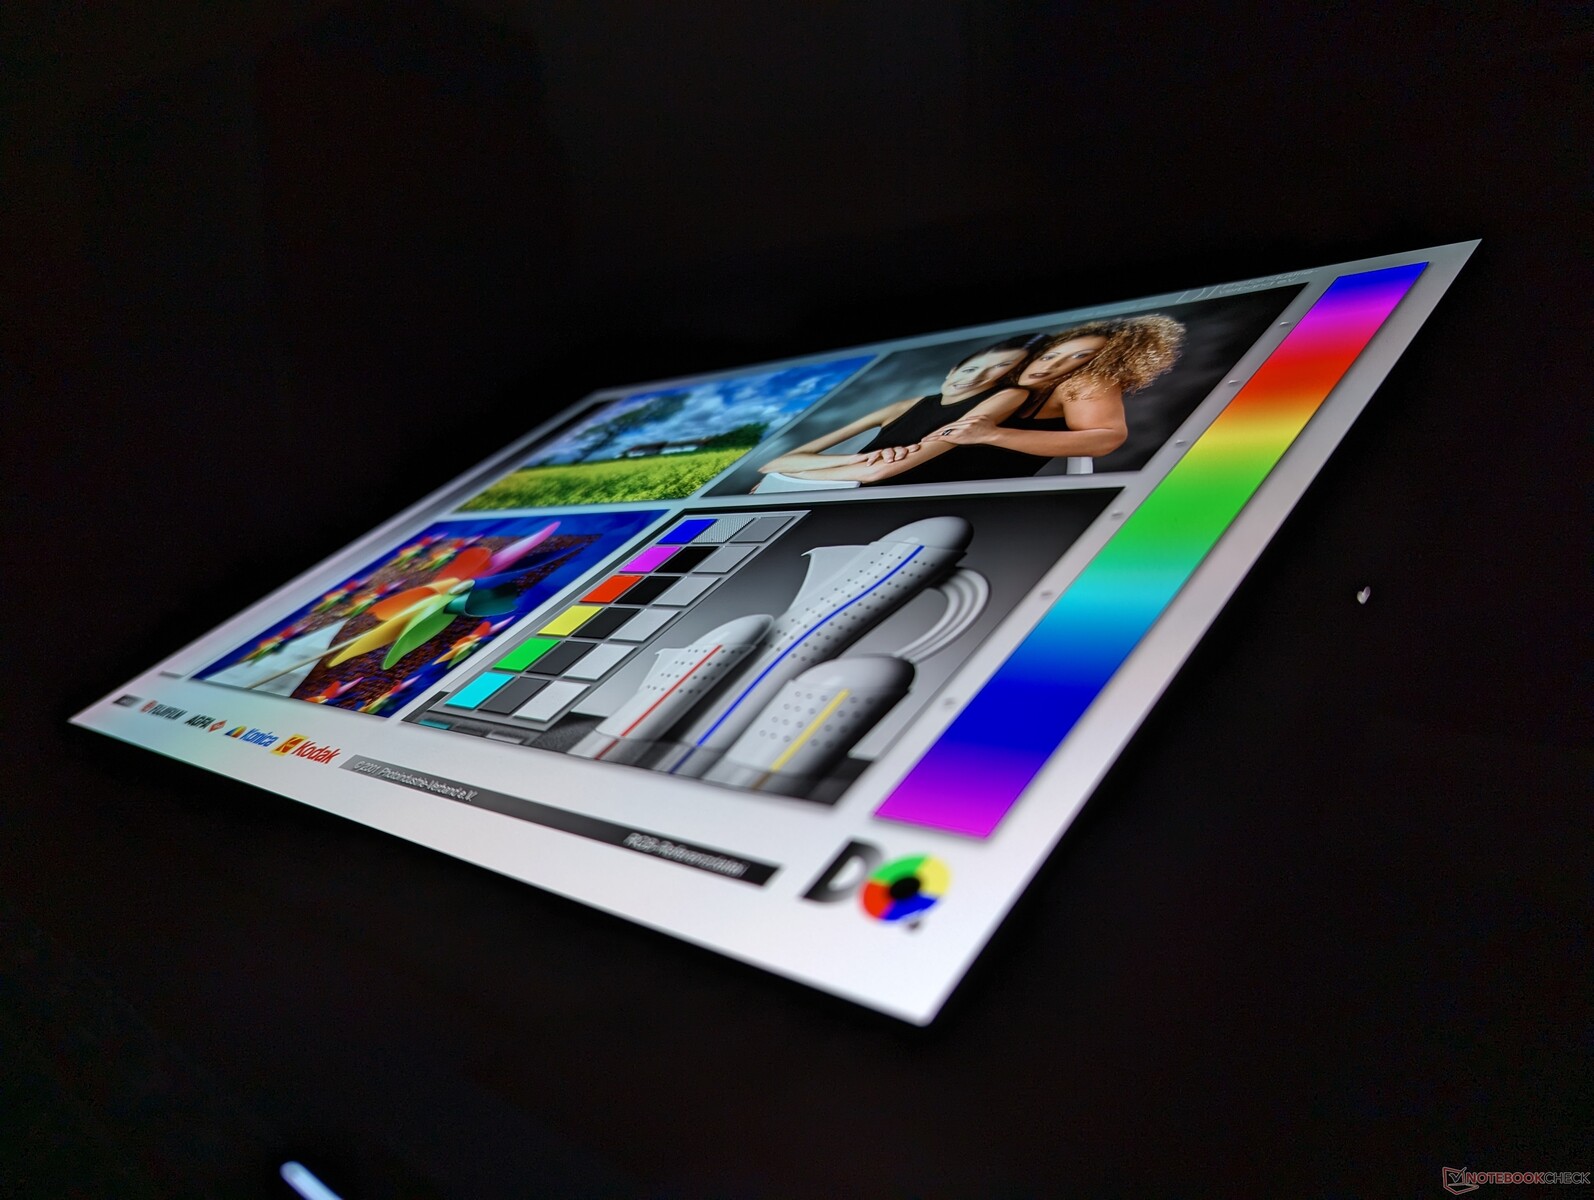
Affichage
| |||||||||||||||||||||||||
Homogénéité de la luminosité: 99 %
Valeur mesurée au centre, sur batterie: 385.2 cd/m²
Contraste: ∞:1 (Valeurs des noirs: 0 cd/m²)
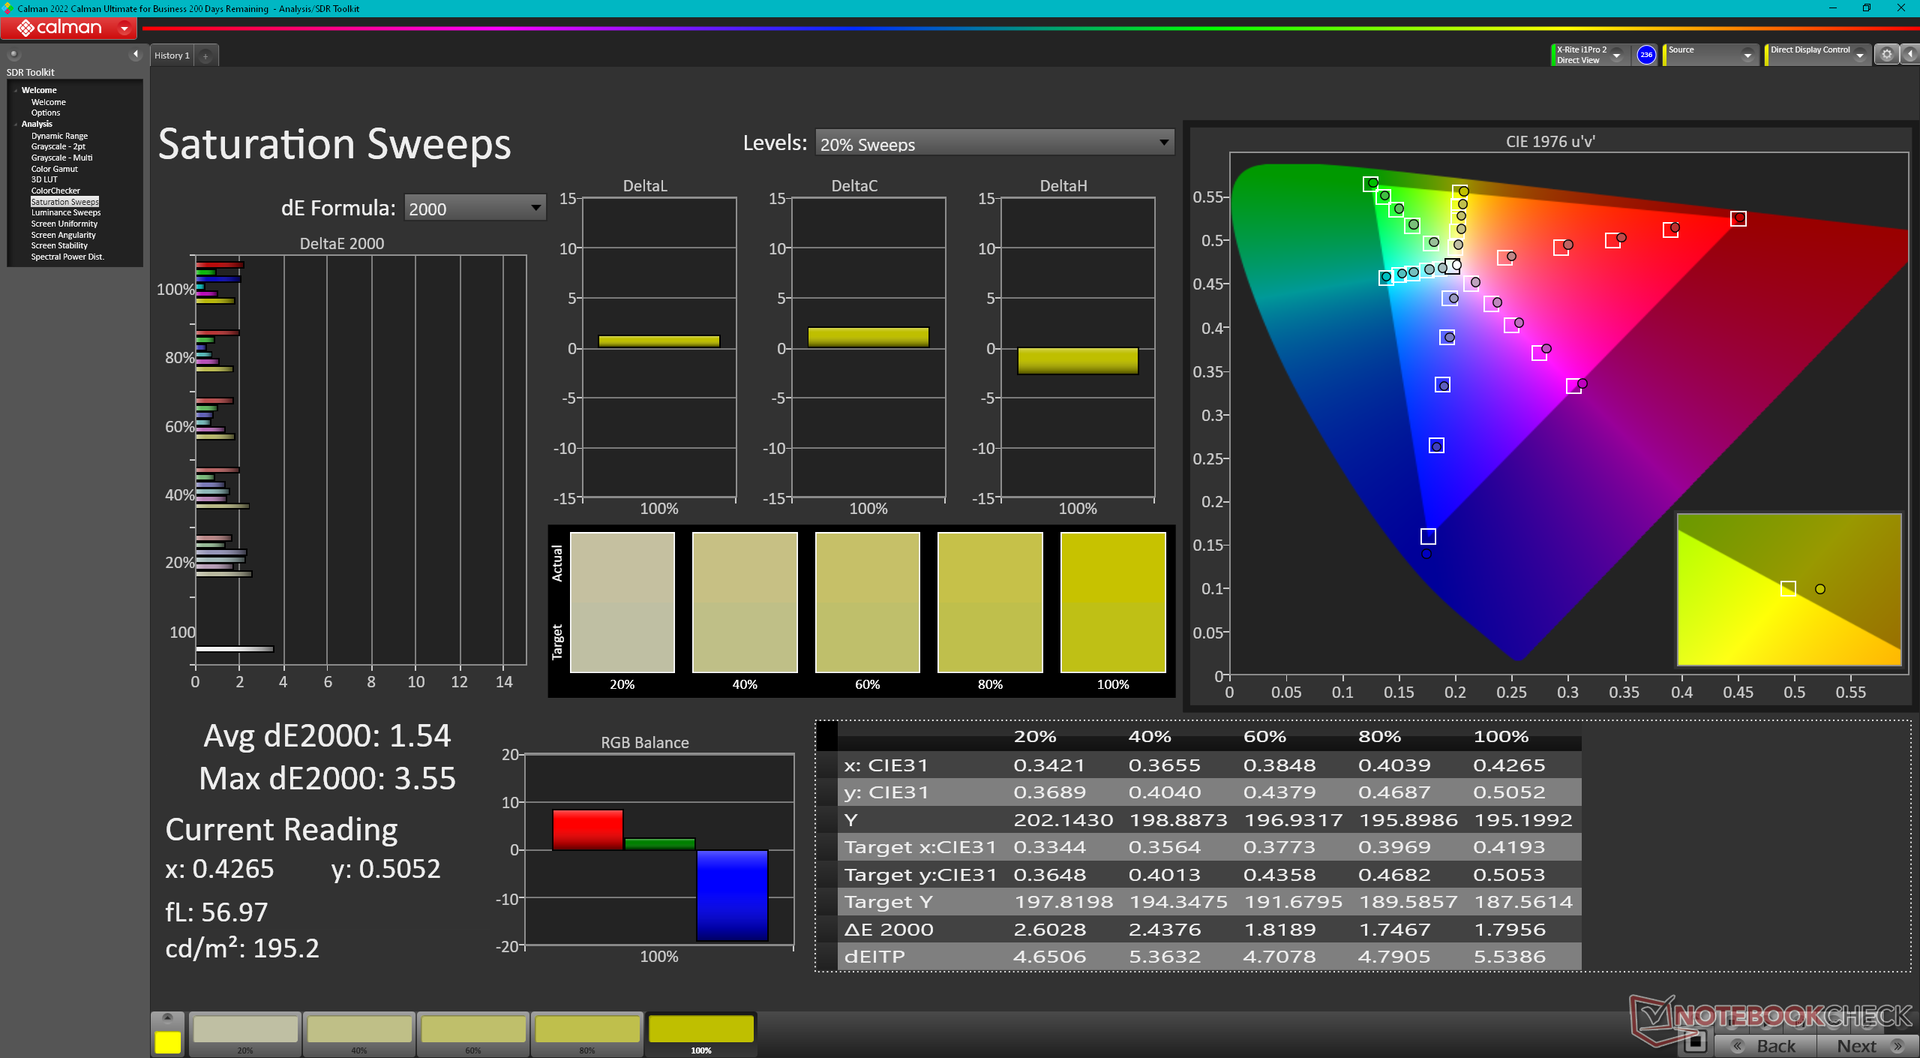
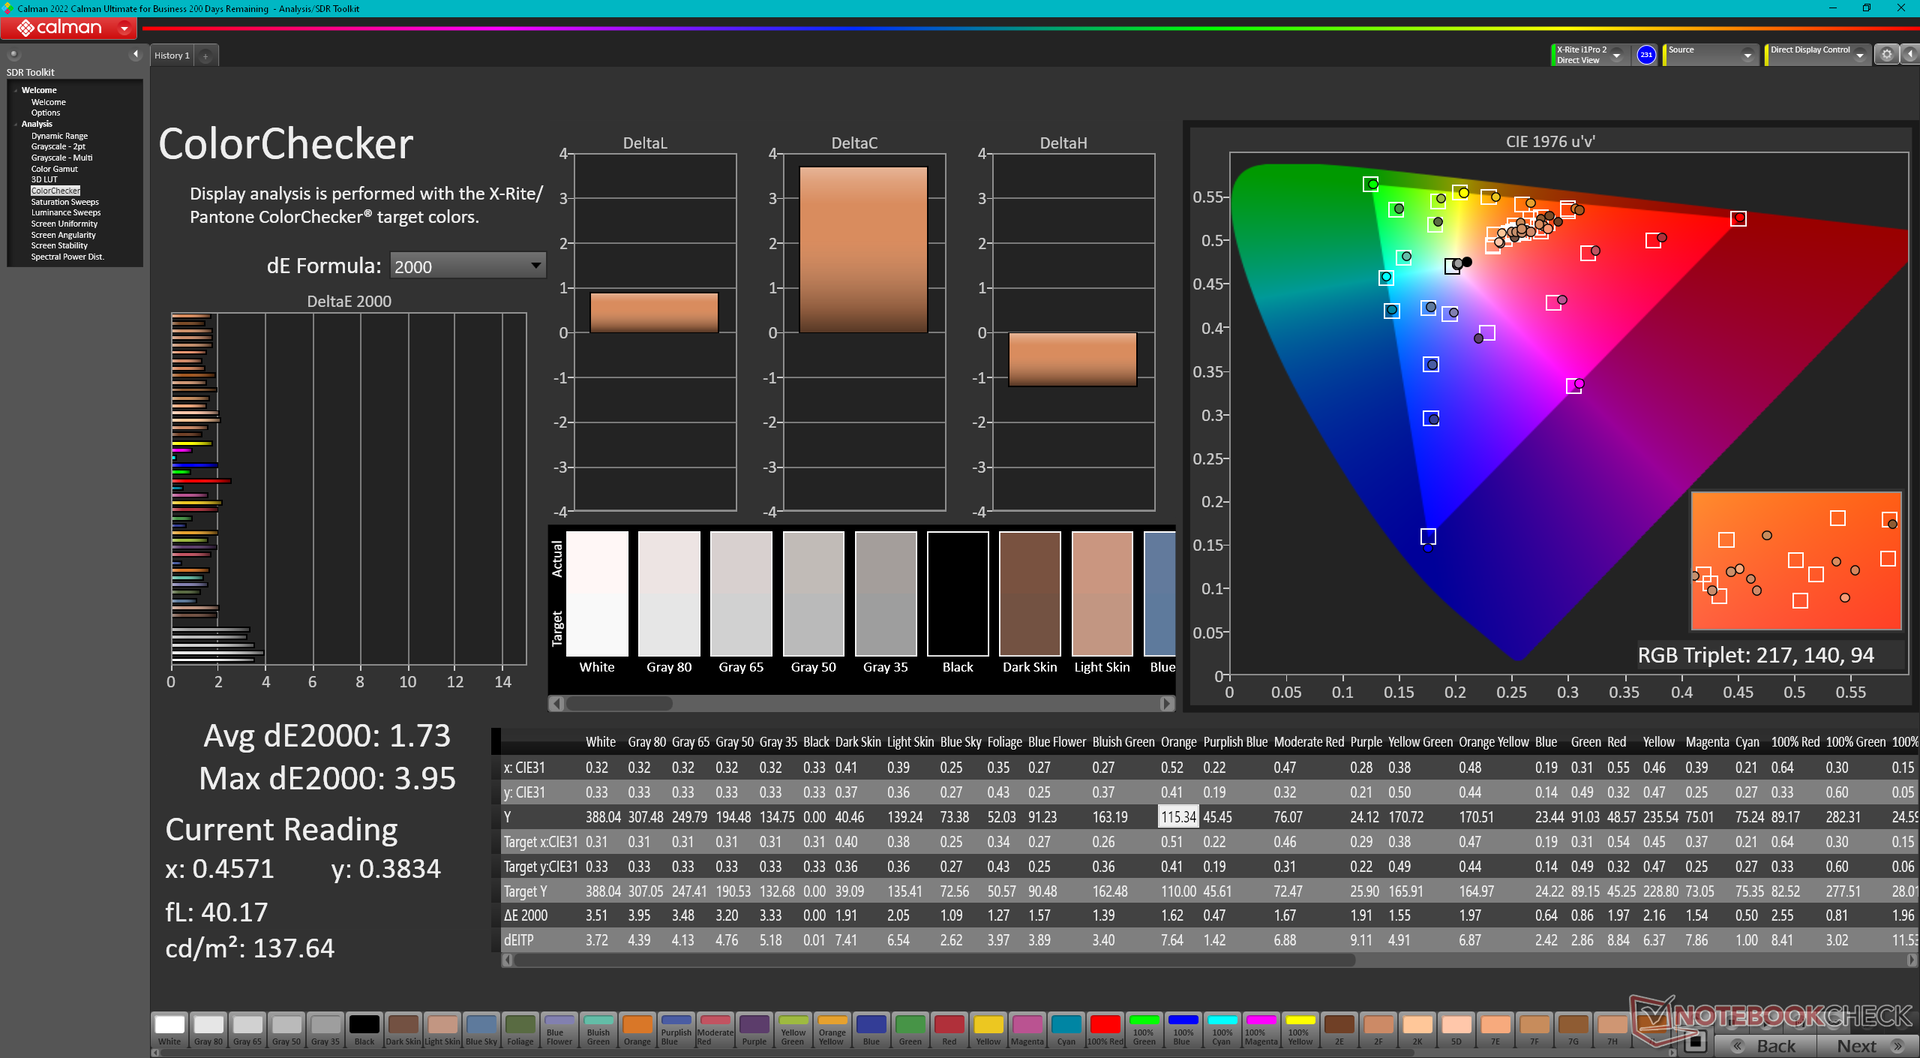
ΔE Color 1.73 | 0.5-29.43 Ø5
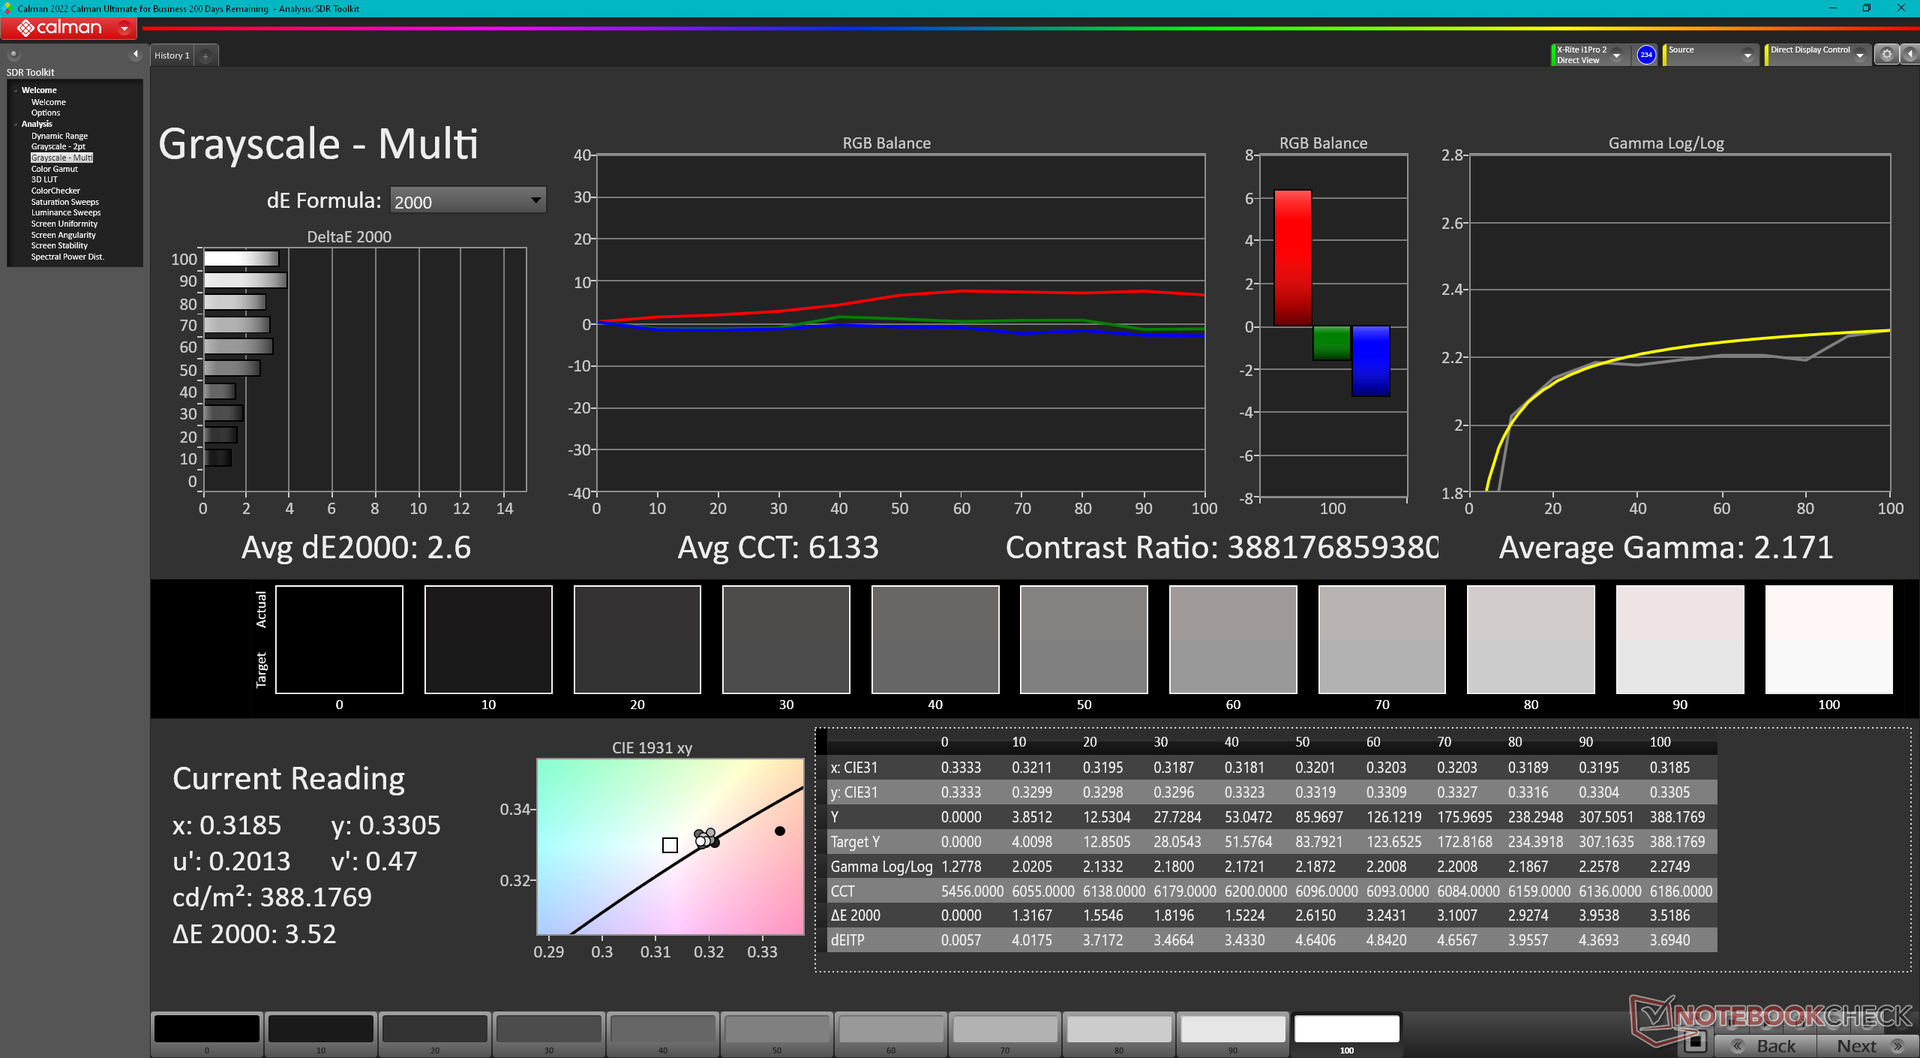
ΔE Greyscale 2.6 | 0.57-98 Ø5.3
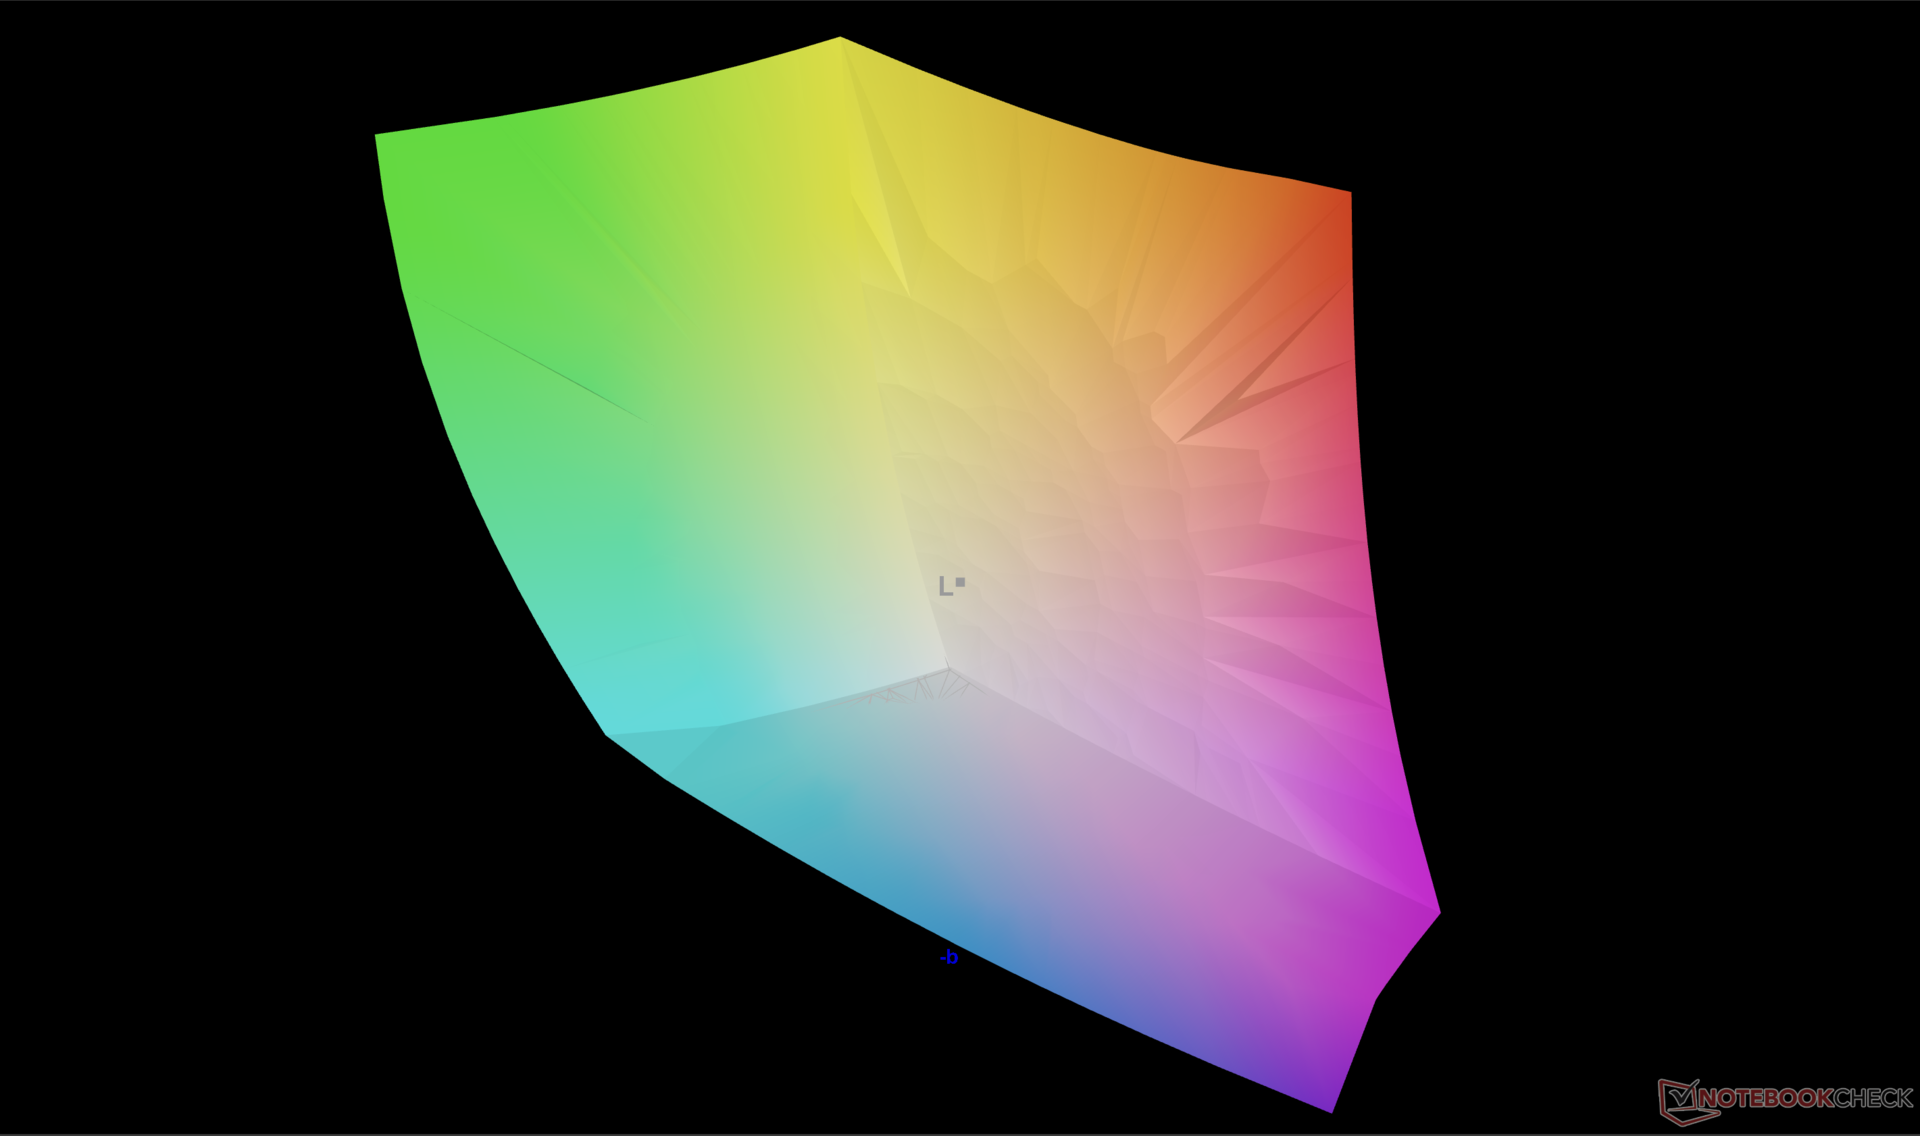
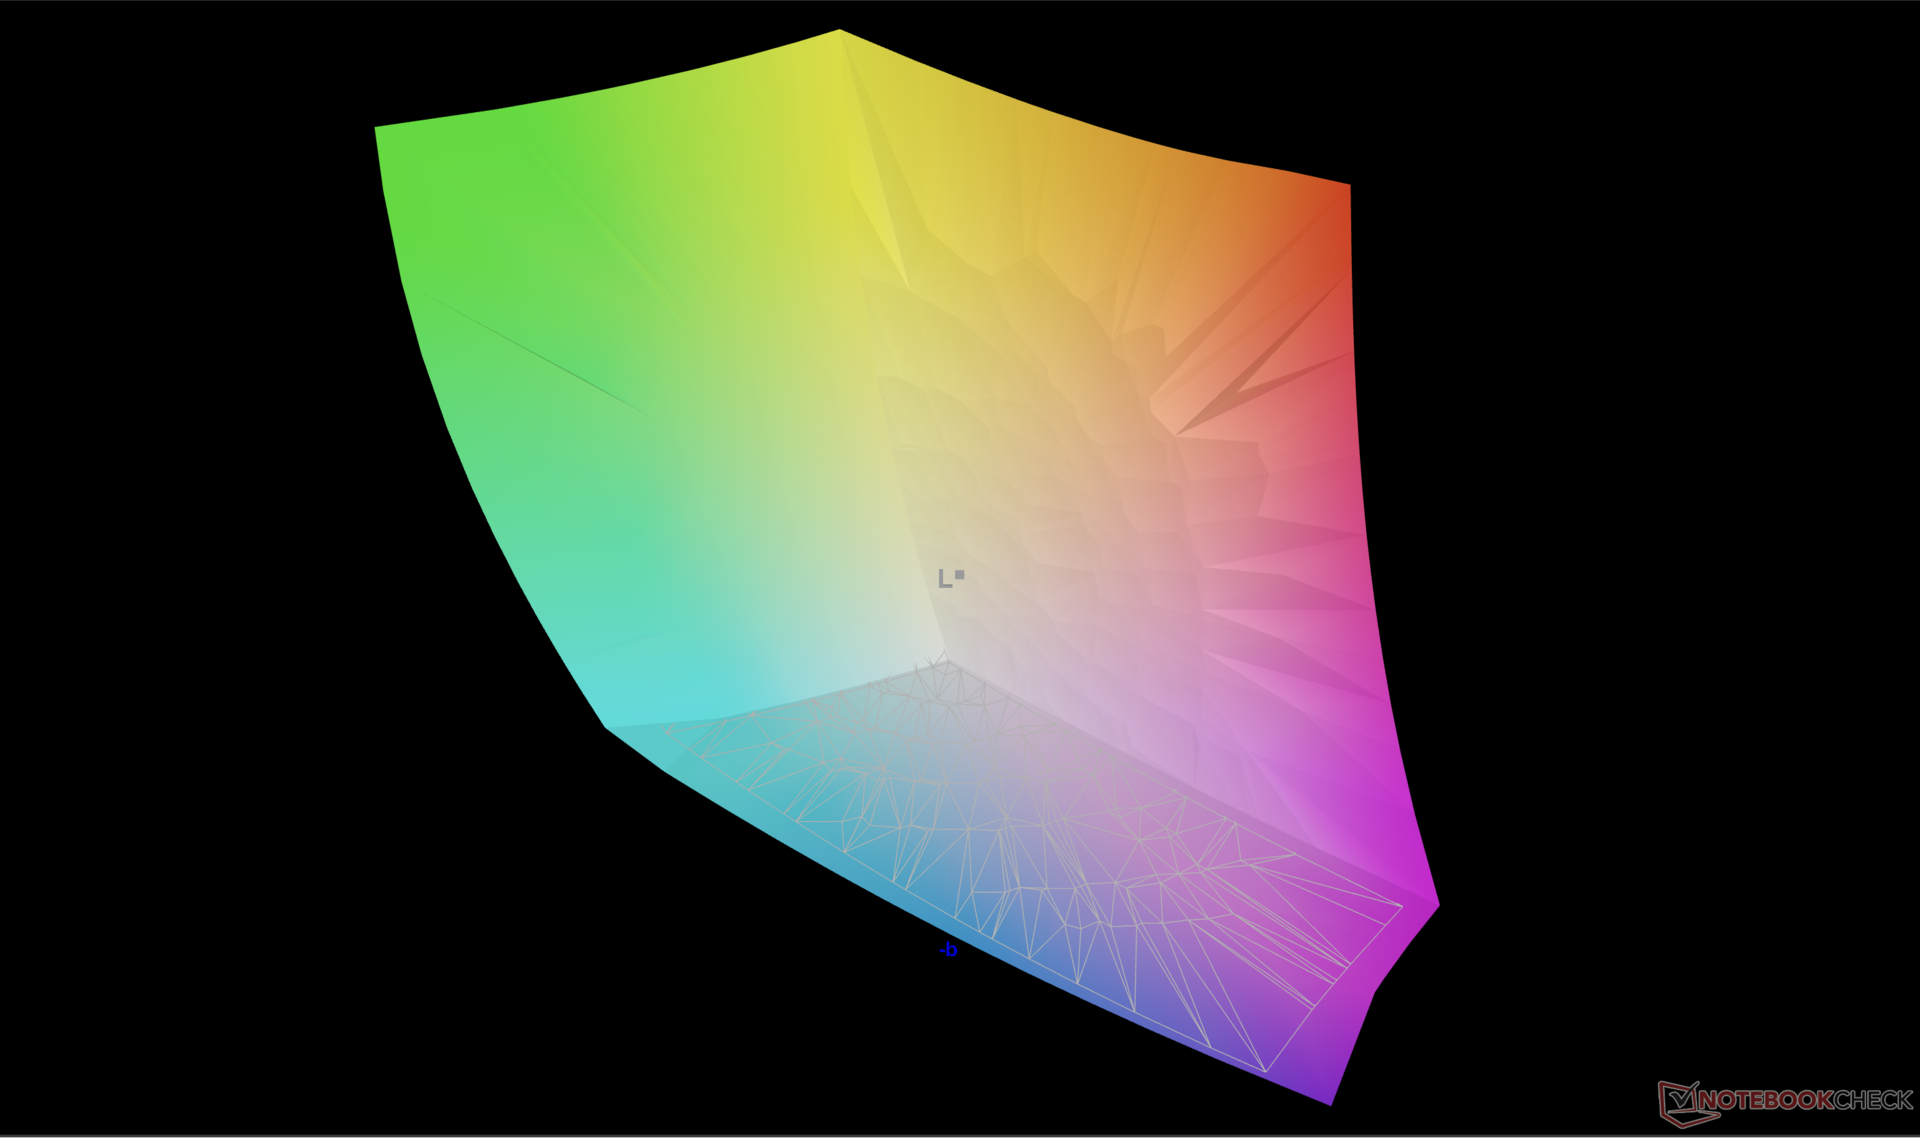
96.7% AdobeRGB 1998 (Argyll 2.2.0 3D)
100% sRGB (Argyll 2.2.0 3D)
99.6% Display P3 (Argyll 2.2.0 3D)
Gamma: 2.17
| HP Spectre x360 16 RTX 4050 Samsung SDC41A6, OLED, 2880x1800, 16.00 | HP Spectre x360 16-aa0074ng Samsung SDC41A6, OLED, 2880x1800, 16.00 | HP Spectre x360 2-in-1 16-f1075ng AU Optronics AUO50A3, IPS, 3072x1920, 16.00 | Honor MagicBook Pro 16 2024 TL160MDMP01, IPS, 3072x1920, 16.00 | MSI Prestige 16 B1MG-001US AU Optronics B160QAN03.R, IPS, 2560x1600, 16.00 | LG Gram 2in1 16 16T90R - G.AA78G LP160WQ1-SPB2, IPS, 2560x1600, 16.00 | |
|---|---|---|---|---|---|---|
| Display | -1% | -15% | -3% | -5% | -5% | |
| Display P3 Coverage | 99.6 | 98.9 -1% | 75.6 -24% | 98.8 -1% | 96.7 -3% | 96.5 -3% |
| sRGB Coverage | 100 | 99.9 0% | 100.2 0% | 100 0% | 99.8 0% | 99.9 0% |
| AdobeRGB 1998 Coverage | 96.7 | 94.4 -2% | 77.2 -20% | 89.1 -8% | 84.6 -13% | 84.6 -13% |
| Response Times | -6% | -4862% | -630% | -5038% | -3606% | |
| Response Time Grey 50% / Grey 80% * | 0.78 ? | 0.8 ? -3% | 52 ? -6567% | 6.3 ? -708% | 49.4 ? -6233% | 38.4 ? -4823% |
| Response Time Black / White * | 0.86 ? | 1 ? -16% | 28 ? -3156% | 5.6 ? -551% | 33.9 ? -3842% | 21.4 ? -2388% |
| PWM Frequency | 480 ? | 480 0% | ||||
| Screen | -7% | -102% | 13% | -88% | -58% | |
| Brightness middle | 385.2 | 424 10% | 425 10% | 551 43% | 473.6 23% | 329 -15% |
| Brightness | 387 | 425 10% | 406 5% | 524 35% | 456 18% | 310 -20% |
| Brightness Distribution | 99 | 99 0% | 78 -21% | 91 -8% | 87 -12% | 88 -11% |
| Black Level * | 0.24 | 0.52 | 0.19 | 0.39 | ||
| Colorchecker dE 2000 * | 1.73 | 2.37 -37% | 5.8 -235% | 1.7 2% | 5.9 -241% | 3.52 -103% |
| Colorchecker dE 2000 max. * | 3.95 | 4.97 -26% | 11.03 -179% | 4.1 -4% | 9.37 -137% | 6.96 -76% |
| Greyscale dE 2000 * | 2.6 | 2.55 2% | 7.57 -191% | 2.4 8% | 7.3 -181% | 5.75 -121% |
| Gamma | 2.17 101% | 2.49 88% | 6600 0% | 2.2 100% | 1.9 116% | 2.137 103% |
| CCT | 6133 106% | 6548 99% | 6842 95% | 7260 90% | 7584 86% | |
| Colorchecker dE 2000 calibrated * | 2.26 | 4.16 | 1 | 0.89 | 1.15 | |
| Contrast | 1771 | 1060 | 2493 | 844 | ||
| Moyenne finale (programmes/paramètres) | -5% /
-5% | -1660% /
-943% | -207% /
-108% | -1710% /
-966% | -1223% /
-688% |
* ... Moindre est la valeur, meilleures sont les performances
Temps de réponse de l'écran
| ↔ Temps de réponse noir à blanc | ||
|---|---|---|
| 0.86 ms ... hausse ↗ et chute ↘ combinées | ↗ 0.4 ms hausse | 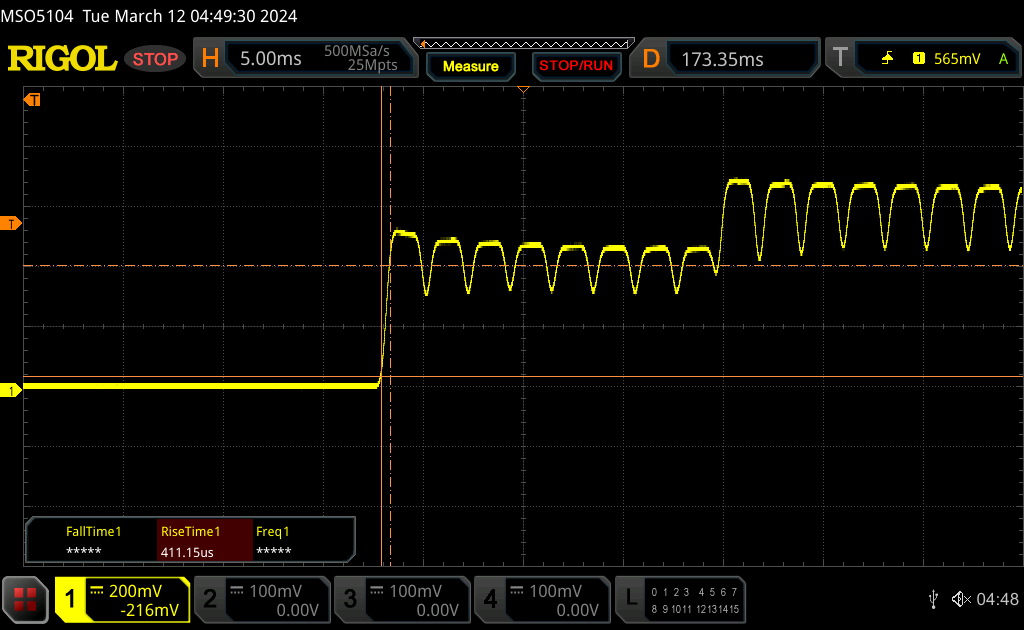 |
| ↘ 0.46 ms chute | ||
| L'écran montre de très faibles temps de réponse, parfait pour le jeu. En comparaison, tous les appareils testés affichent entre 0.1 (minimum) et 240 (maximum) ms. » 1 % des appareils testés affichent de meilleures performances. Cela signifie que les latences relevées sont meilleures que la moyenne (21.5 ms) de tous les appareils testés. | ||
| ↔ Temps de réponse gris 50% à gris 80% | ||
| 0.78 ms ... hausse ↗ et chute ↘ combinées | ↗ 0.44 ms hausse |  |
| ↘ 0.34 ms chute | ||
| L'écran montre de très faibles temps de réponse, parfait pour le jeu. En comparaison, tous les appareils testés affichent entre 0.2 (minimum) et 636 (maximum) ms. » 1 % des appareils testés affichent de meilleures performances. Cela signifie que les latences relevées sont meilleures que la moyenne (33.7 ms) de tous les appareils testés. | ||
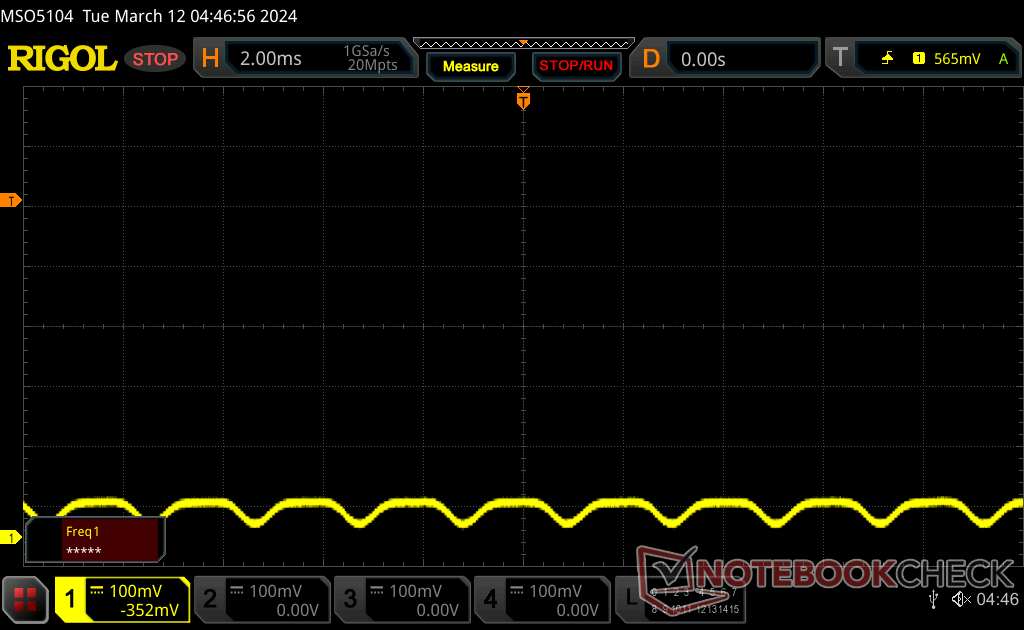
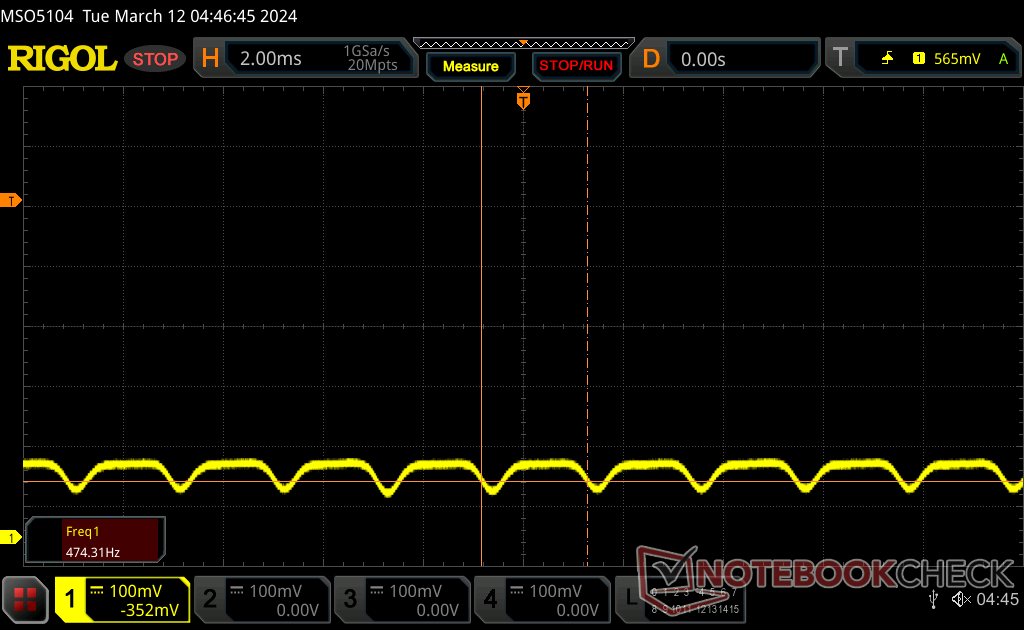
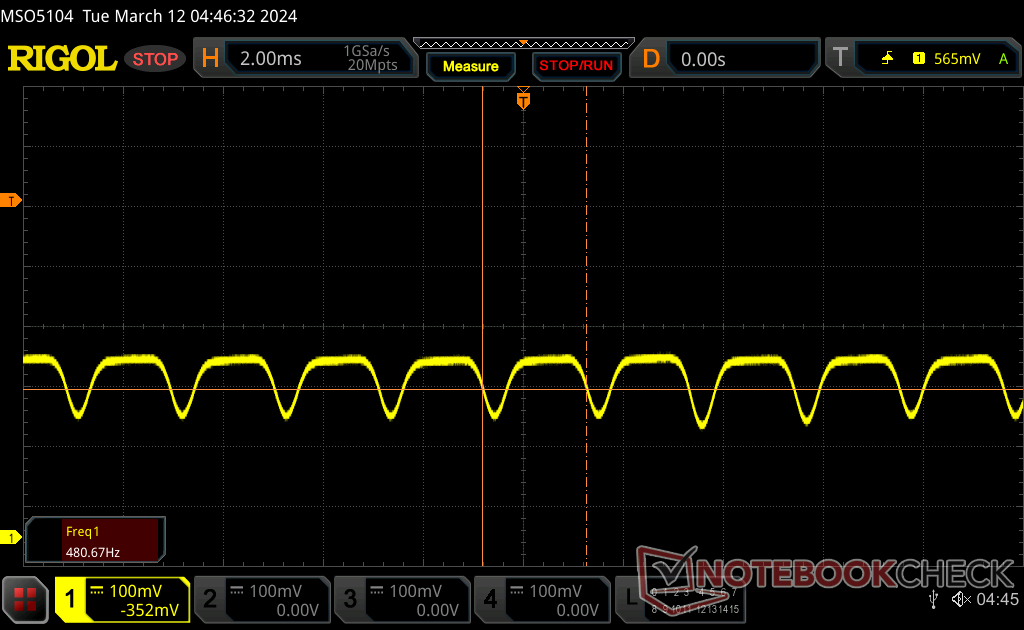
Scintillement / MLI (Modulation de largeur d'impulsion)
| Scintillement / MLI (Modulation de largeur d'impulsion) décelé | 480 Hz | ≤ 100 Niveau de luminosité | 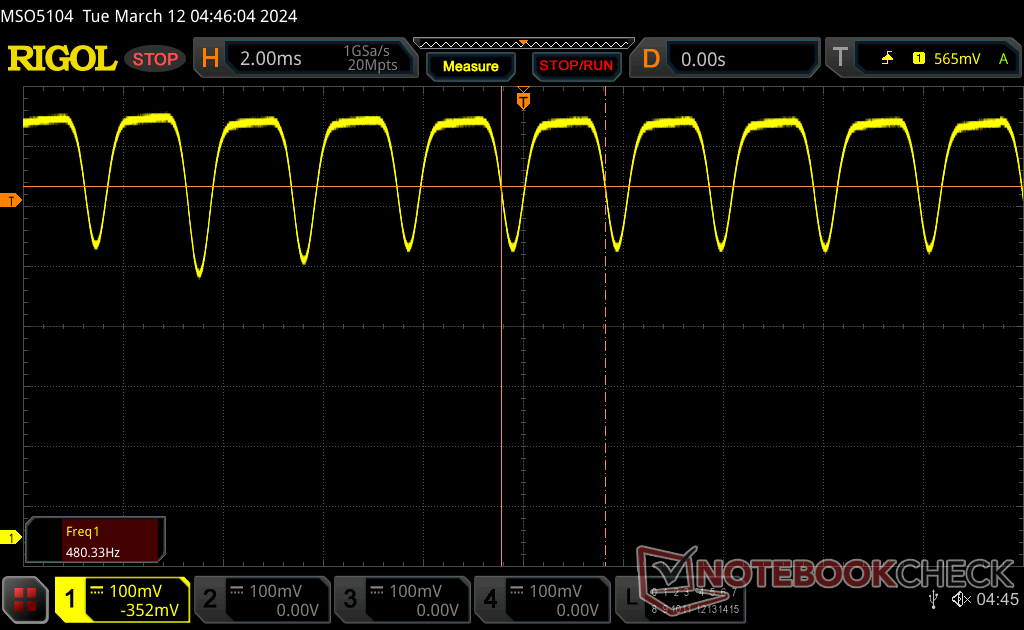 |
Le rétroéclairage de l'écran scintille à la fréquence de 480 Hz (certainement du fait de l'utilisation d'une MDI - Modulation de largeur d'impulsion) à un niveau de luminosité inférieur ou égal à 100 % . Aucun scintillement ne devrait être perceptible au-dessus de cette valeur. La fréquence de rafraîchissement de 480 Hz est relativement élevée, la grande majorité des utilisateurs ne devrait pas percevLa fréquence de rafraîchissement de 480 Hz est relativement élevée, la grande majorité des utilisateurs ne devrait pas percevoir de scintillements et être sujette à une fatigue oculaire accrue.oir de scintillements et être sujette à une fatigue oculaire accrue. Néanmoins certaines personnes pourront toujours percevoir un scintillement. En comparaison, 53 % des appareils testés n'emploient pas MDI pour assombrir leur écran. Nous avons relevé une moyenne à 17903 (minimum : 5 - maximum : 3846000) Hz dans le cas où une MDI était active. | |||


Performance
Conditions d'essai
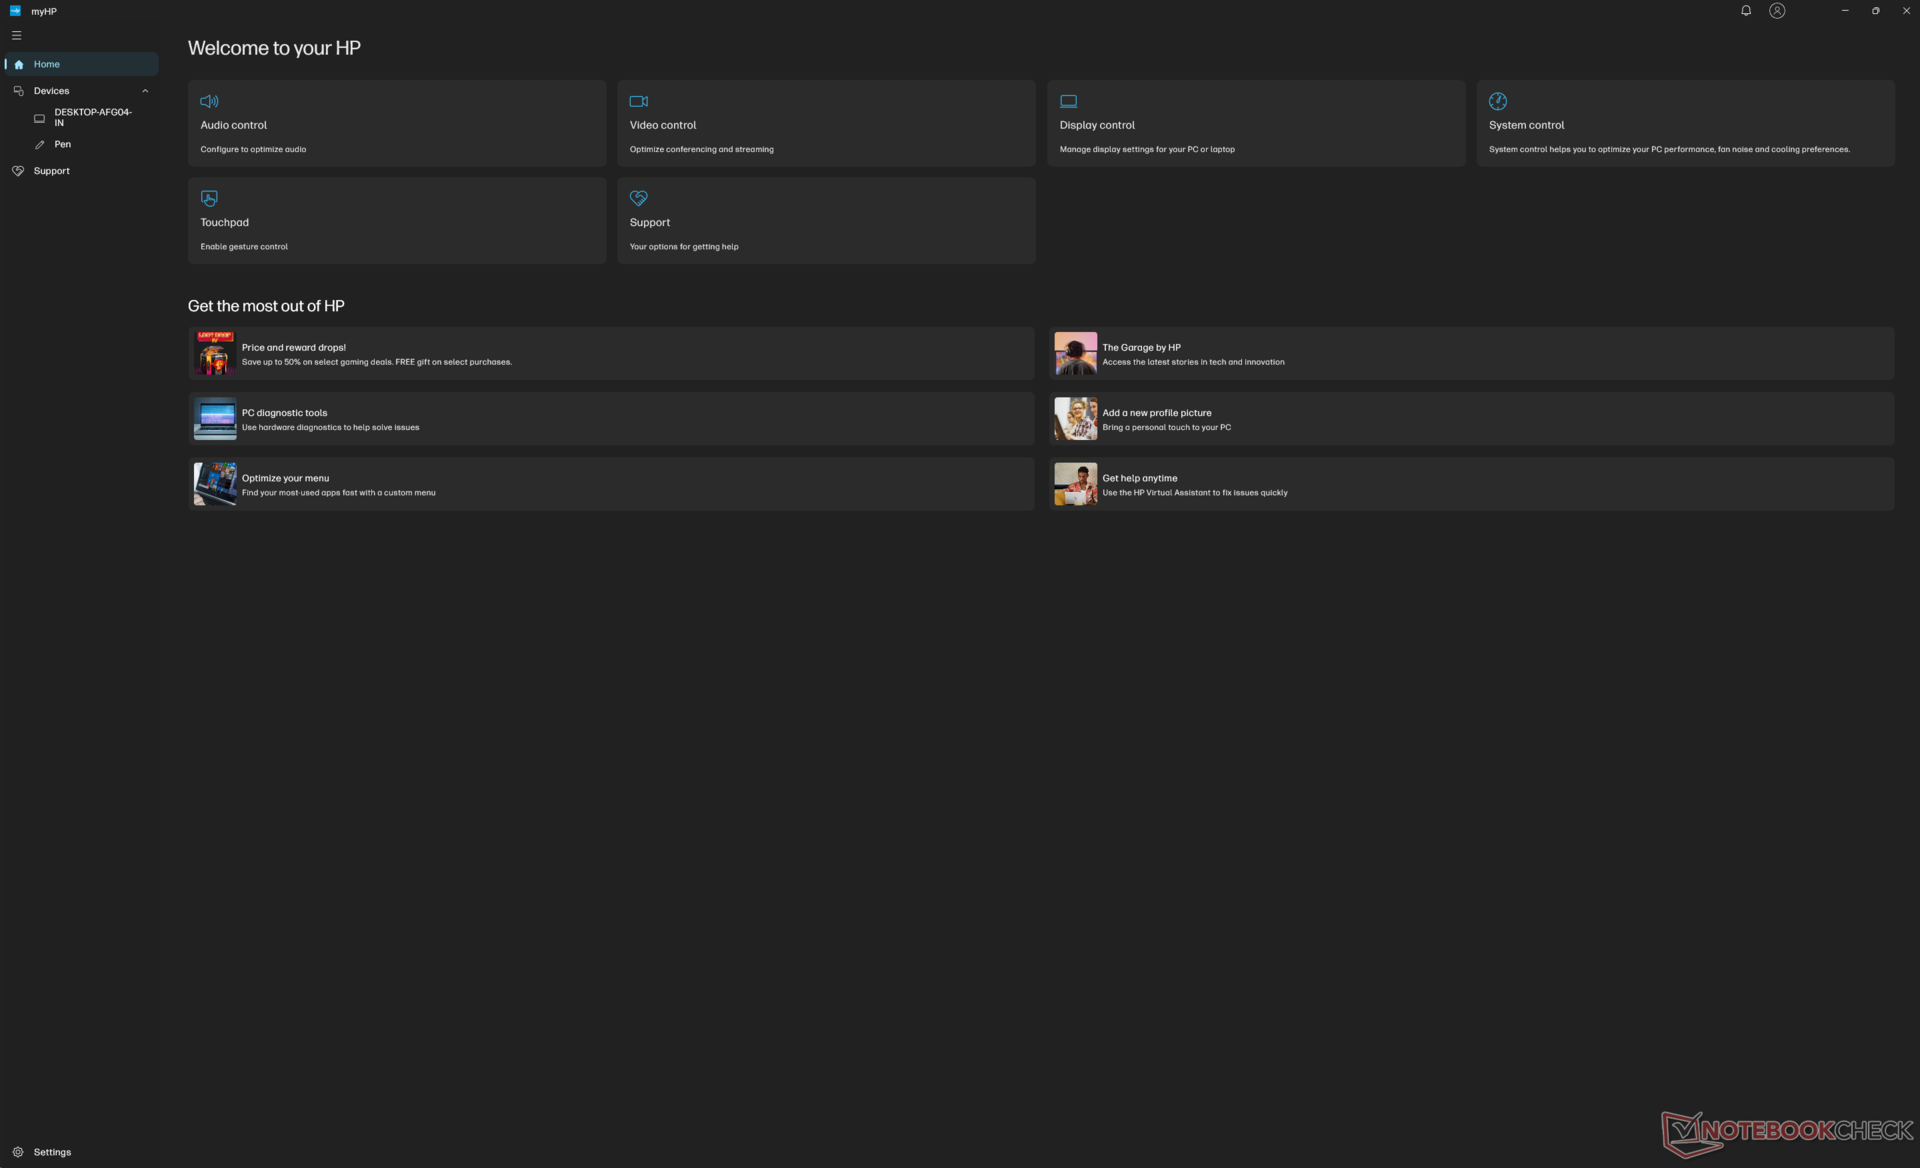
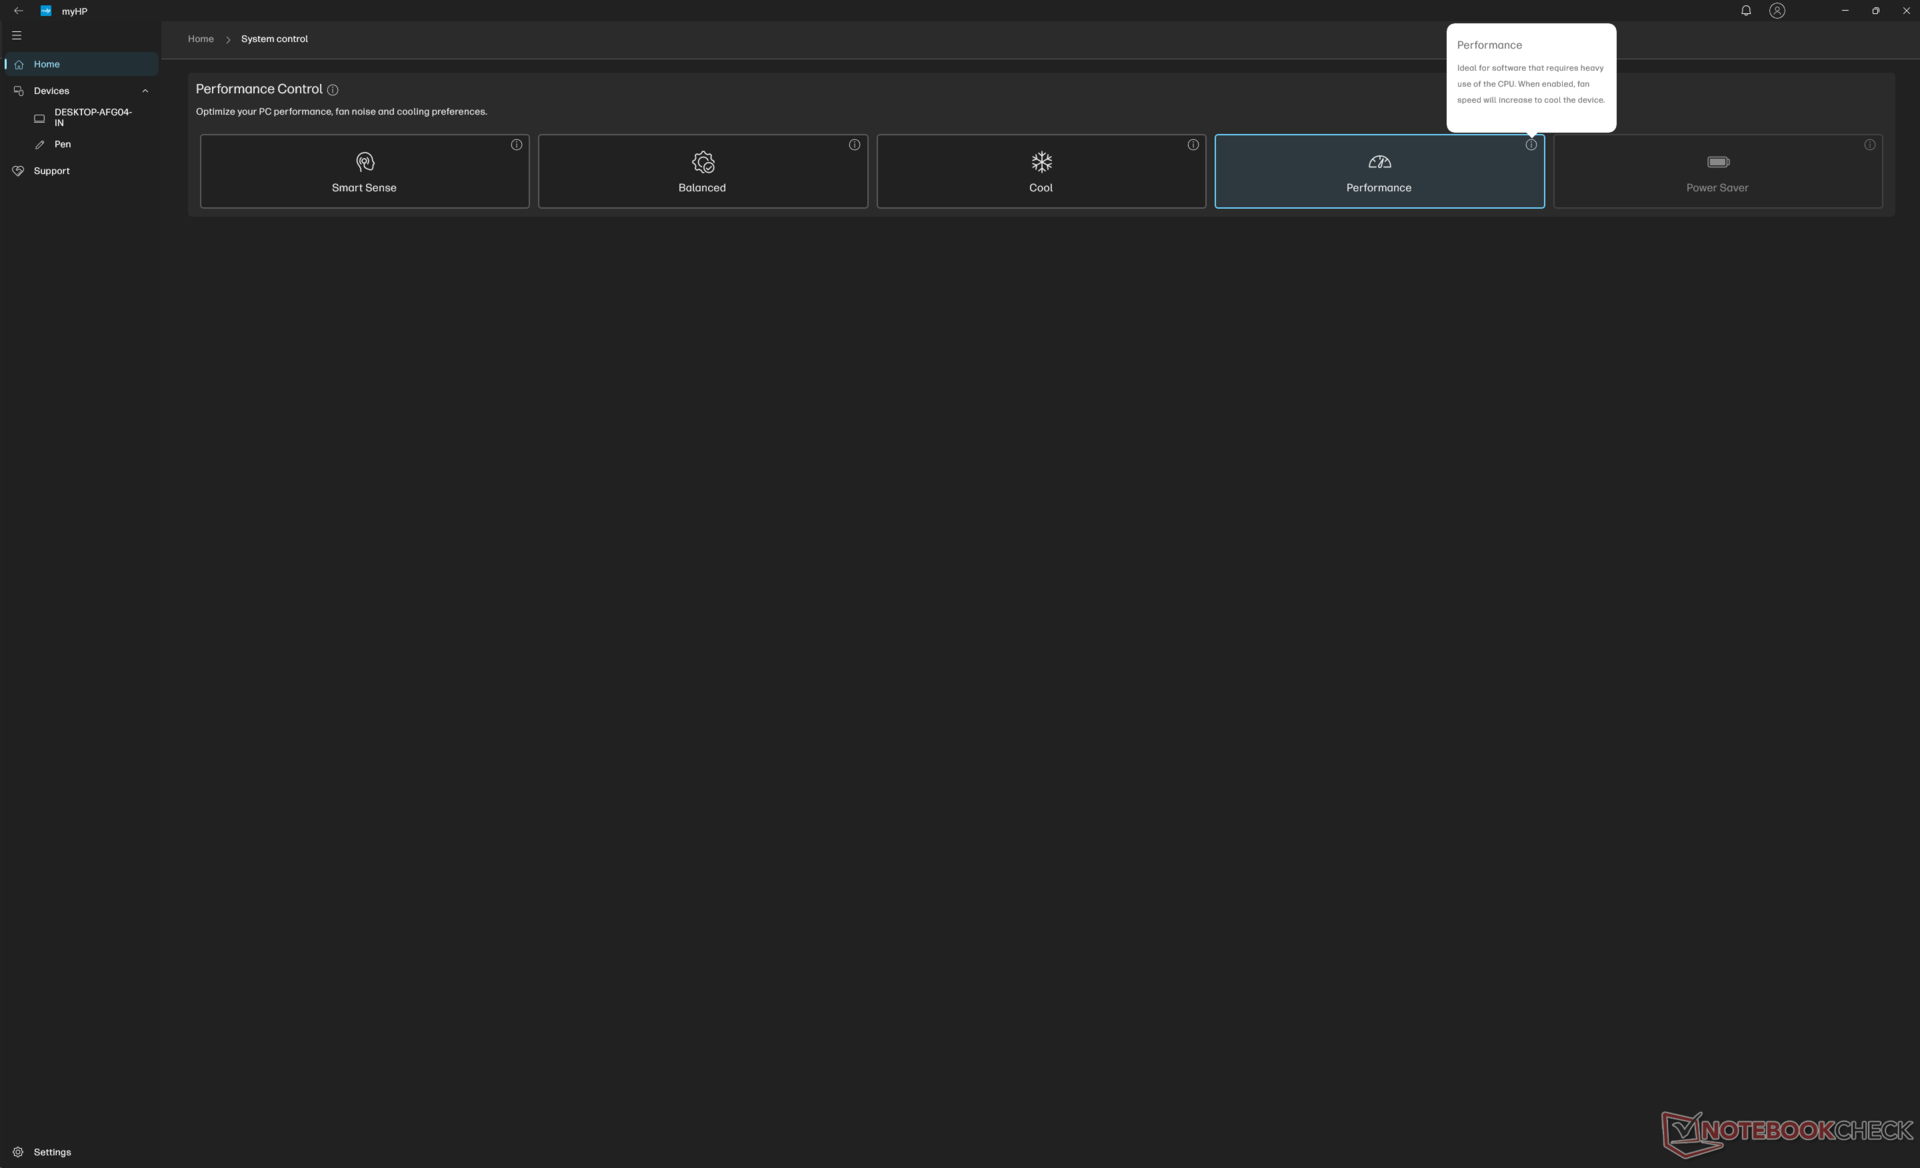
Nous avons réglé Windows et MyHP sur leur mode Performance respectif avant d'effectuer les tests ci-dessous. MyHP et Omen Gaming Hub sont tous deux installés sur le système, mais la plupart des fonctionnalités importantes liées à la convivialité et aux profils d'alimentation sont liées à MyHP.
Processeur
Le Core Ultra 7 155H dans notre configuration dGPU donnerait des résultats inférieurs à ceux du même CPU dans notre configuration iGPU. L'écart peut atteindre 20 % entre les deux systèmes et les résultats ne s'améliorent pas, même après plusieurs tests. En effet, si l'on regarde de plus près les niveaux de consommation d'énergie de la carte CPU dans chaque configuration, le CPU de notre unité dGPU n'atteindrait que 28 W alors que le même CPU dans notre unité iGPU se stabiliserait à un niveau de consommation plus élevé de 40 W.
HP indique qu'elle est consciente du fait que le CPU "s'étrangle incorrectement pendant certaines charges de travail" et qu'une mise à jour logicielle est en cours pour résoudre ce problème. Nous ajouterons les nouveaux résultats ici dès que la mise à jour sera disponible.
Cinebench R15 Multi Loop
Cinebench R23: Multi Core | Single Core
Cinebench R20: CPU (Multi Core) | CPU (Single Core)
Cinebench R15: CPU Multi 64Bit | CPU Single 64Bit
Blender: v2.79 BMW27 CPU
7-Zip 18.03: 7z b 4 | 7z b 4 -mmt1
Geekbench 6.2: Multi-Core | Single-Core
Geekbench 5.5: Multi-Core | Single-Core
HWBOT x265 Benchmark v2.2: 4k Preset
LibreOffice : 20 Documents To PDF
R Benchmark 2.5: Overall mean
* ... Moindre est la valeur, meilleures sont les performances
AIDA64: FP32 Ray-Trace | FPU Julia | CPU SHA3 | CPU Queen | FPU SinJulia | FPU Mandel | CPU AES | CPU ZLib | FP64 Ray-Trace | CPU PhotoWorxx
| Performance Rating | |
| Honor MagicBook Pro 16 2024 | |
| MSI Prestige 16 B1MG-001US | |
| HP Spectre x360 16 RTX 4050 | |
| Moyenne Intel Core Ultra 7 155H | |
| HP Spectre x360 16-aa0074ng | |
| HP Spectre x360 2-in-1 16-f1075ng | |
| LG Gram 2in1 16 16T90R - G.AA78G | |
| AIDA64 / FP32 Ray-Trace | |
| Honor MagicBook Pro 16 2024 | |
| MSI Prestige 16 B1MG-001US | |
| HP Spectre x360 16 RTX 4050 | |
| Moyenne Intel Core Ultra 7 155H (6670 - 18470, n=25) | |
| HP Spectre x360 16-aa0074ng | |
| HP Spectre x360 2-in-1 16-f1075ng | |
| LG Gram 2in1 16 16T90R - G.AA78G | |
| LG Gram 2in1 16 16T90R - G.AA78G | |
| AIDA64 / FPU Julia | |
| Honor MagicBook Pro 16 2024 | |
| MSI Prestige 16 B1MG-001US | |
| HP Spectre x360 16 RTX 4050 | |
| Moyenne Intel Core Ultra 7 155H (43630 - 93181, n=25) | |
| HP Spectre x360 16-aa0074ng | |
| HP Spectre x360 2-in-1 16-f1075ng | |
| LG Gram 2in1 16 16T90R - G.AA78G | |
| AIDA64 / CPU SHA3 | |
| Honor MagicBook Pro 16 2024 | |
| MSI Prestige 16 B1MG-001US | |
| HP Spectre x360 16 RTX 4050 | |
| Moyenne Intel Core Ultra 7 155H (1940 - 4436, n=25) | |
| HP Spectre x360 16-aa0074ng | |
| HP Spectre x360 2-in-1 16-f1075ng | |
| LG Gram 2in1 16 16T90R - G.AA78G | |
| AIDA64 / CPU Queen | |
| MSI Prestige 16 B1MG-001US | |
| HP Spectre x360 2-in-1 16-f1075ng | |
| HP Spectre x360 16-aa0074ng | |
| Honor MagicBook Pro 16 2024 | |
| Moyenne Intel Core Ultra 7 155H (64698 - 93266, n=25) | |
| LG Gram 2in1 16 16T90R - G.AA78G | |
| HP Spectre x360 16 RTX 4050 | |
| AIDA64 / FPU SinJulia | |
| Honor MagicBook Pro 16 2024 | |
| MSI Prestige 16 B1MG-001US | |
| HP Spectre x360 16 RTX 4050 | |
| HP Spectre x360 16-aa0074ng | |
| Moyenne Intel Core Ultra 7 155H (5639 - 10641, n=25) | |
| HP Spectre x360 2-in-1 16-f1075ng | |
| LG Gram 2in1 16 16T90R - G.AA78G | |
| AIDA64 / FPU Mandel | |
| Honor MagicBook Pro 16 2024 | |
| MSI Prestige 16 B1MG-001US | |
| HP Spectre x360 16 RTX 4050 | |
| Moyenne Intel Core Ultra 7 155H (21052 - 47685, n=25) | |
| HP Spectre x360 16-aa0074ng | |
| HP Spectre x360 2-in-1 16-f1075ng | |
| LG Gram 2in1 16 16T90R - G.AA78G | |
| AIDA64 / CPU AES | |
| Honor MagicBook Pro 16 2024 | |
| HP Spectre x360 2-in-1 16-f1075ng | |
| LG Gram 2in1 16 16T90R - G.AA78G | |
| MSI Prestige 16 B1MG-001US | |
| Moyenne Intel Core Ultra 7 155H (45713 - 152179, n=25) | |
| HP Spectre x360 16 RTX 4050 | |
| HP Spectre x360 16-aa0074ng | |
| AIDA64 / CPU ZLib | |
| Honor MagicBook Pro 16 2024 | |
| MSI Prestige 16 B1MG-001US | |
| HP Spectre x360 16 RTX 4050 | |
| Moyenne Intel Core Ultra 7 155H (557 - 1250, n=25) | |
| HP Spectre x360 16-aa0074ng | |
| HP Spectre x360 2-in-1 16-f1075ng | |
| LG Gram 2in1 16 16T90R - G.AA78G | |
| AIDA64 / FP64 Ray-Trace | |
| Honor MagicBook Pro 16 2024 | |
| MSI Prestige 16 B1MG-001US | |
| HP Spectre x360 16 RTX 4050 | |
| Moyenne Intel Core Ultra 7 155H (3569 - 9802, n=25) | |
| HP Spectre x360 16-aa0074ng | |
| HP Spectre x360 2-in-1 16-f1075ng | |
| LG Gram 2in1 16 16T90R - G.AA78G | |
| AIDA64 / CPU PhotoWorxx | |
| HP Spectre x360 16-aa0074ng | |
| HP Spectre x360 16 RTX 4050 | |
| Moyenne Intel Core Ultra 7 155H (32719 - 54223, n=25) | |
| MSI Prestige 16 B1MG-001US | |
| Honor MagicBook Pro 16 2024 | |
| LG Gram 2in1 16 16T90R - G.AA78G | |
| HP Spectre x360 2-in-1 16-f1075ng | |
Test de stress
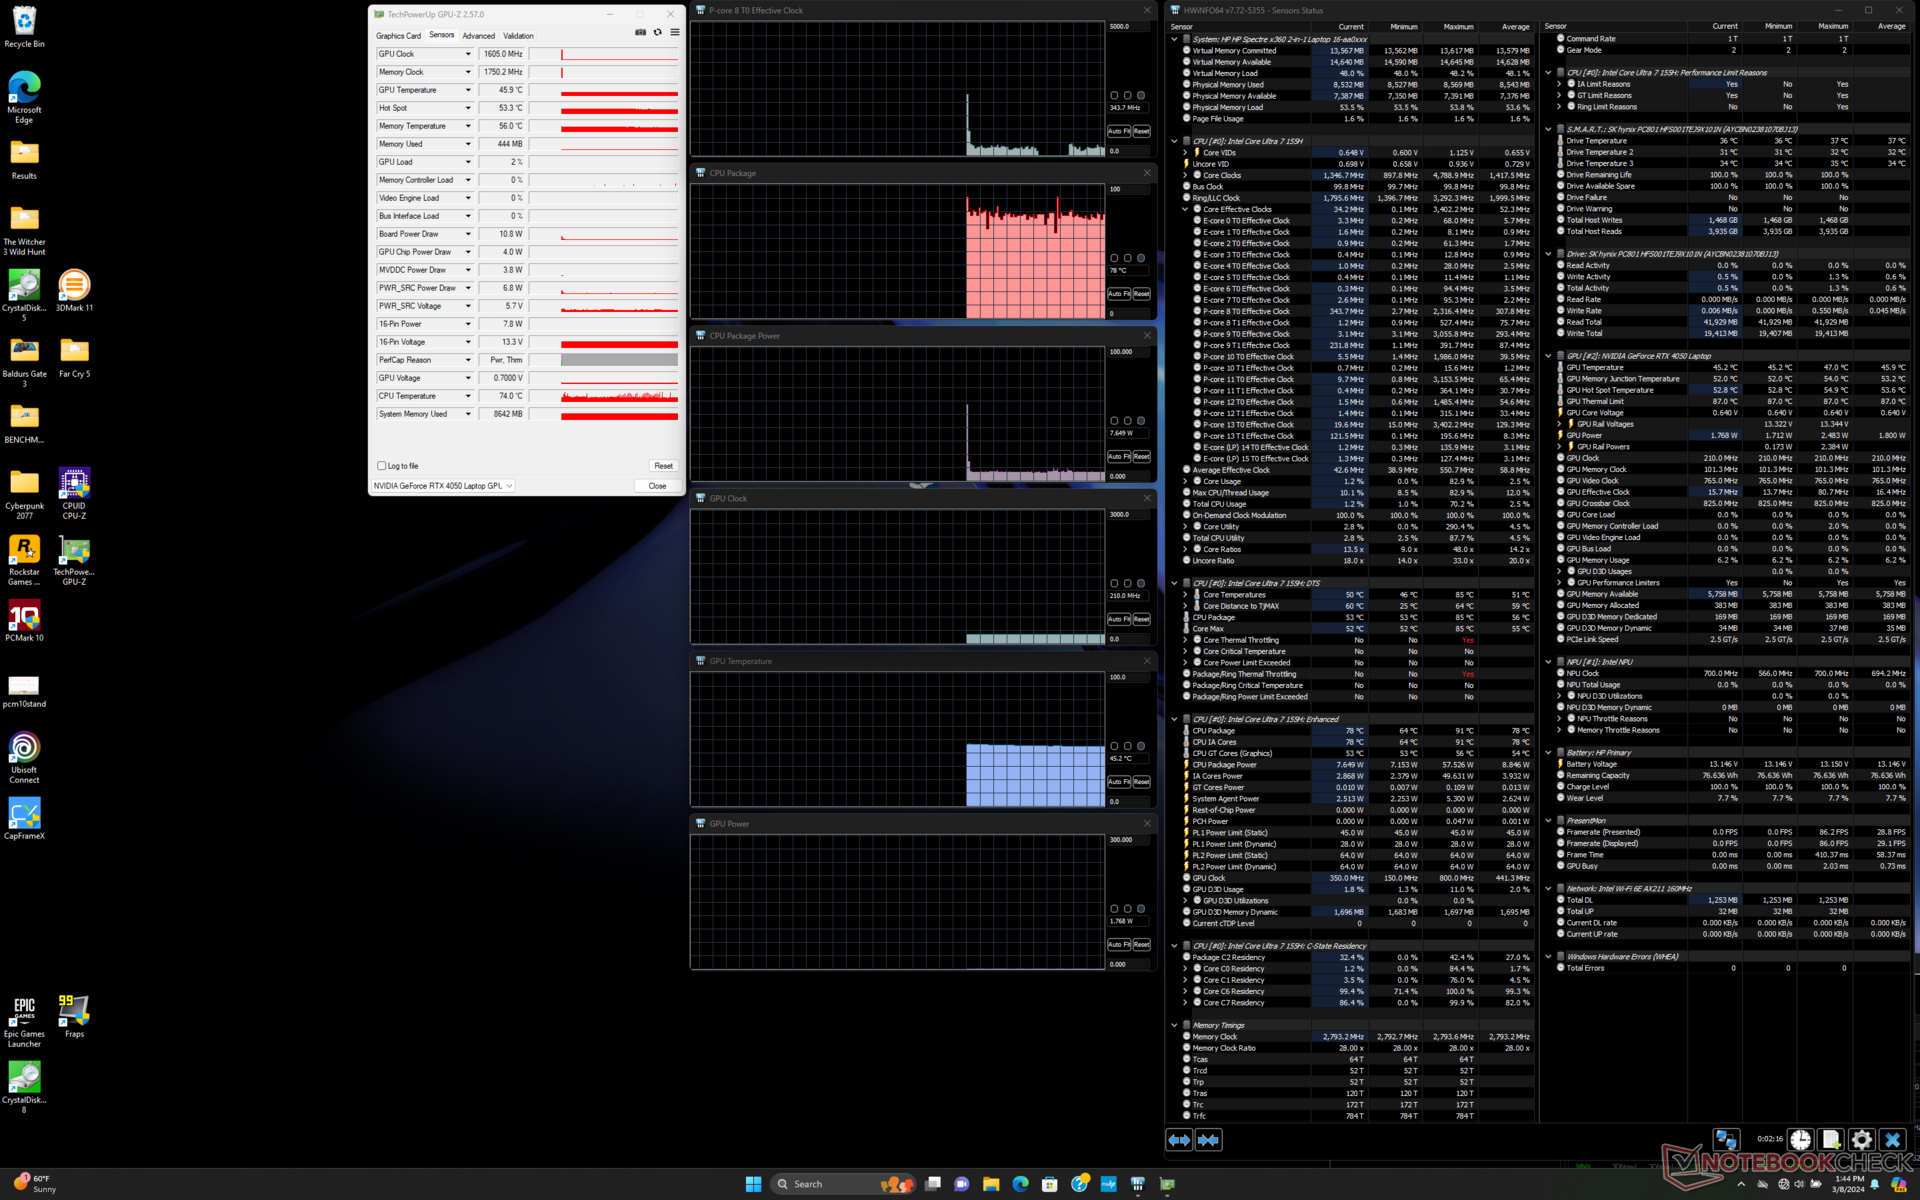
La fréquence d'horloge du processeur et la consommation d'énergie de la carte lors du lancement de Prime95 atteignent respectivement 3,2 GHz et 65 W, avant de chuter à 1,4 GHz et 28 W quelques secondes plus tard, ce qui représente une baisse relativement importante des performances. La température du cœur peut atteindre 95°C lorsque Turbo Boost atteint 3,2 GHz, et les fréquences d'horloge plus lentes sont donc nécessaires pour maintenir les températures sous contrôle.
Les performances graphiques sont différentes en mode équilibré et en mode performance. Par exemple, la fréquence d'horloge du GPU et la consommation d'énergie de la carte en mode équilibré se stabiliseraient à une valeur de 1,5 GHz Witcher 3 en mode équilibré se stabilisent respectivement à 1920 MHz et 39 W, contre 2235 MHz et 53 W en mode performance. Les températures des cœurs sont également plus élevées en mode Performance, comme le montre le tableau ci-dessous.
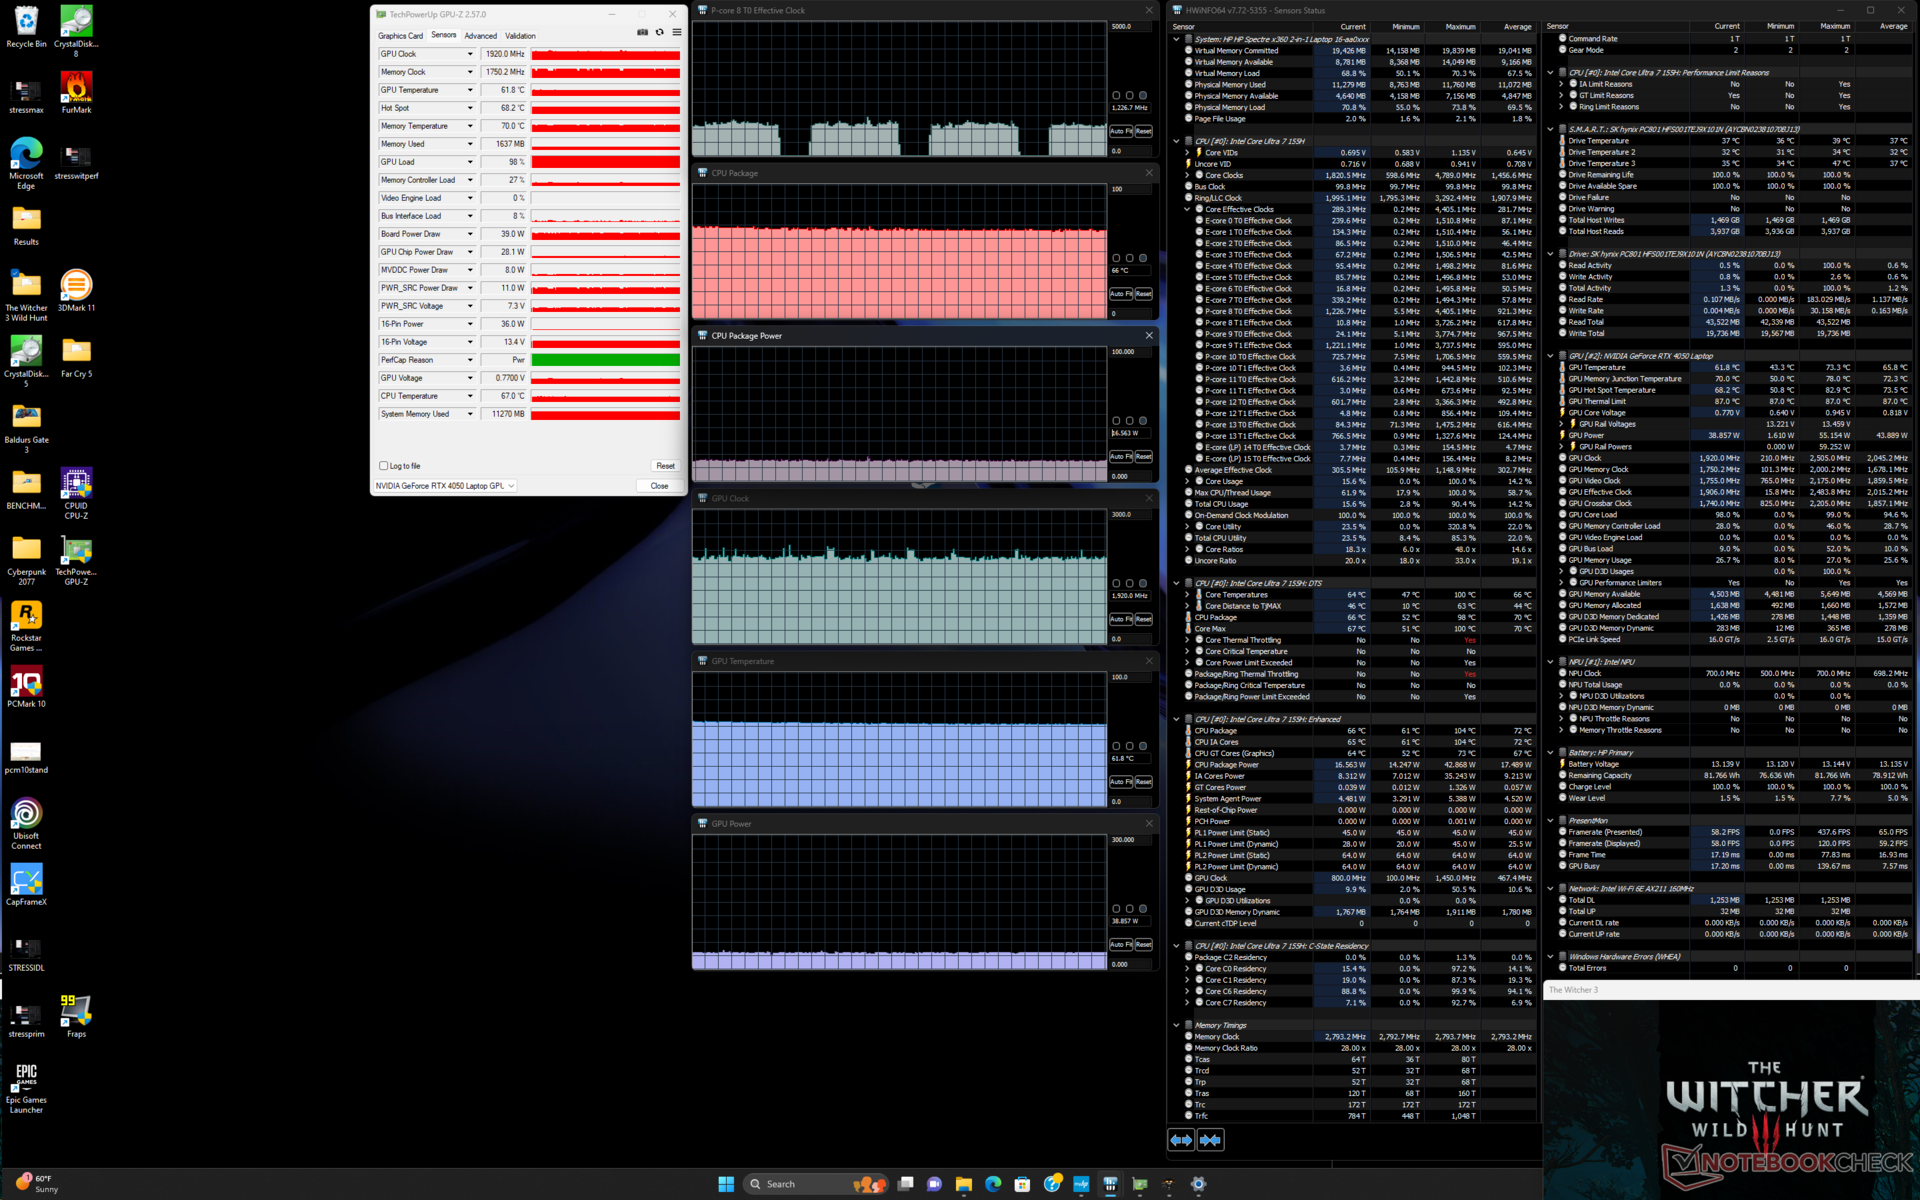

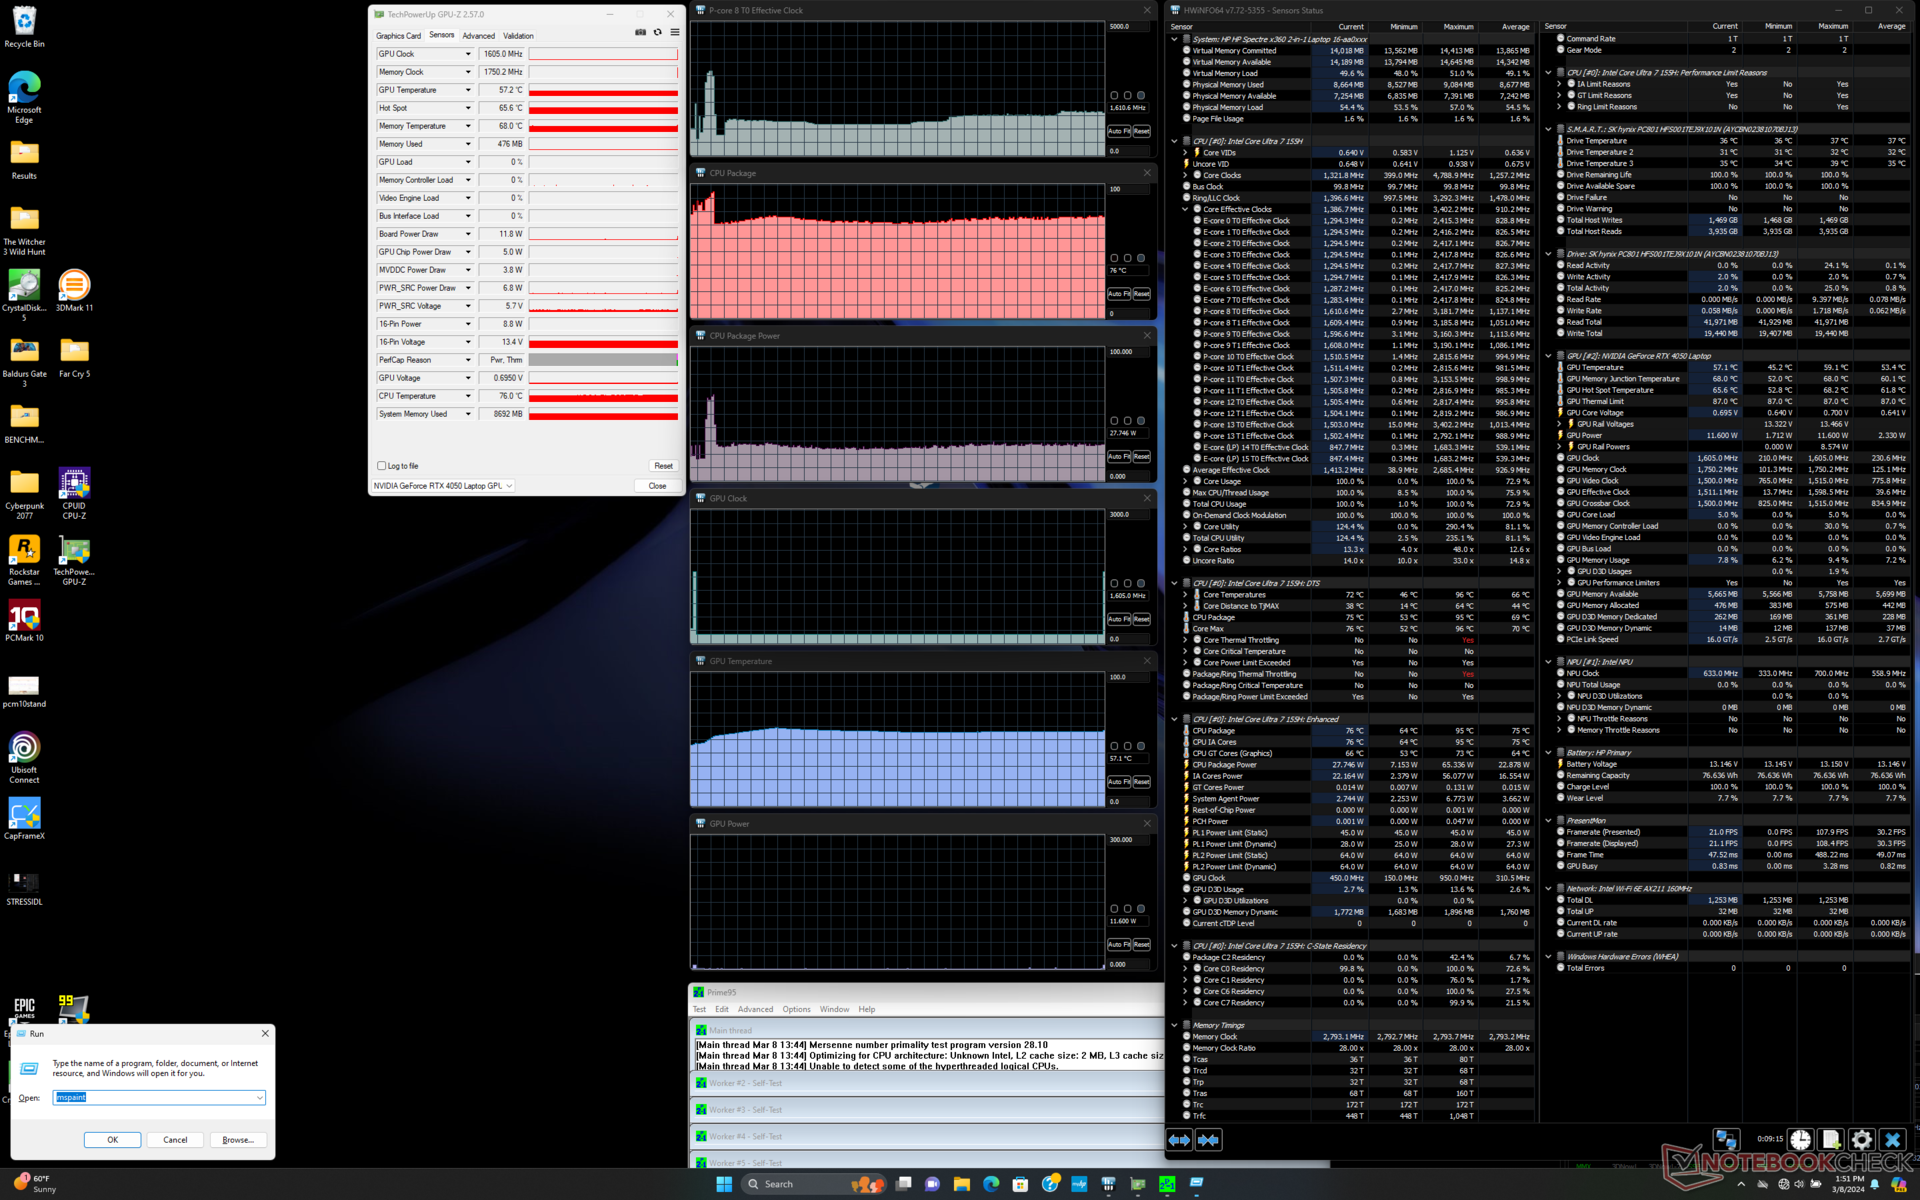
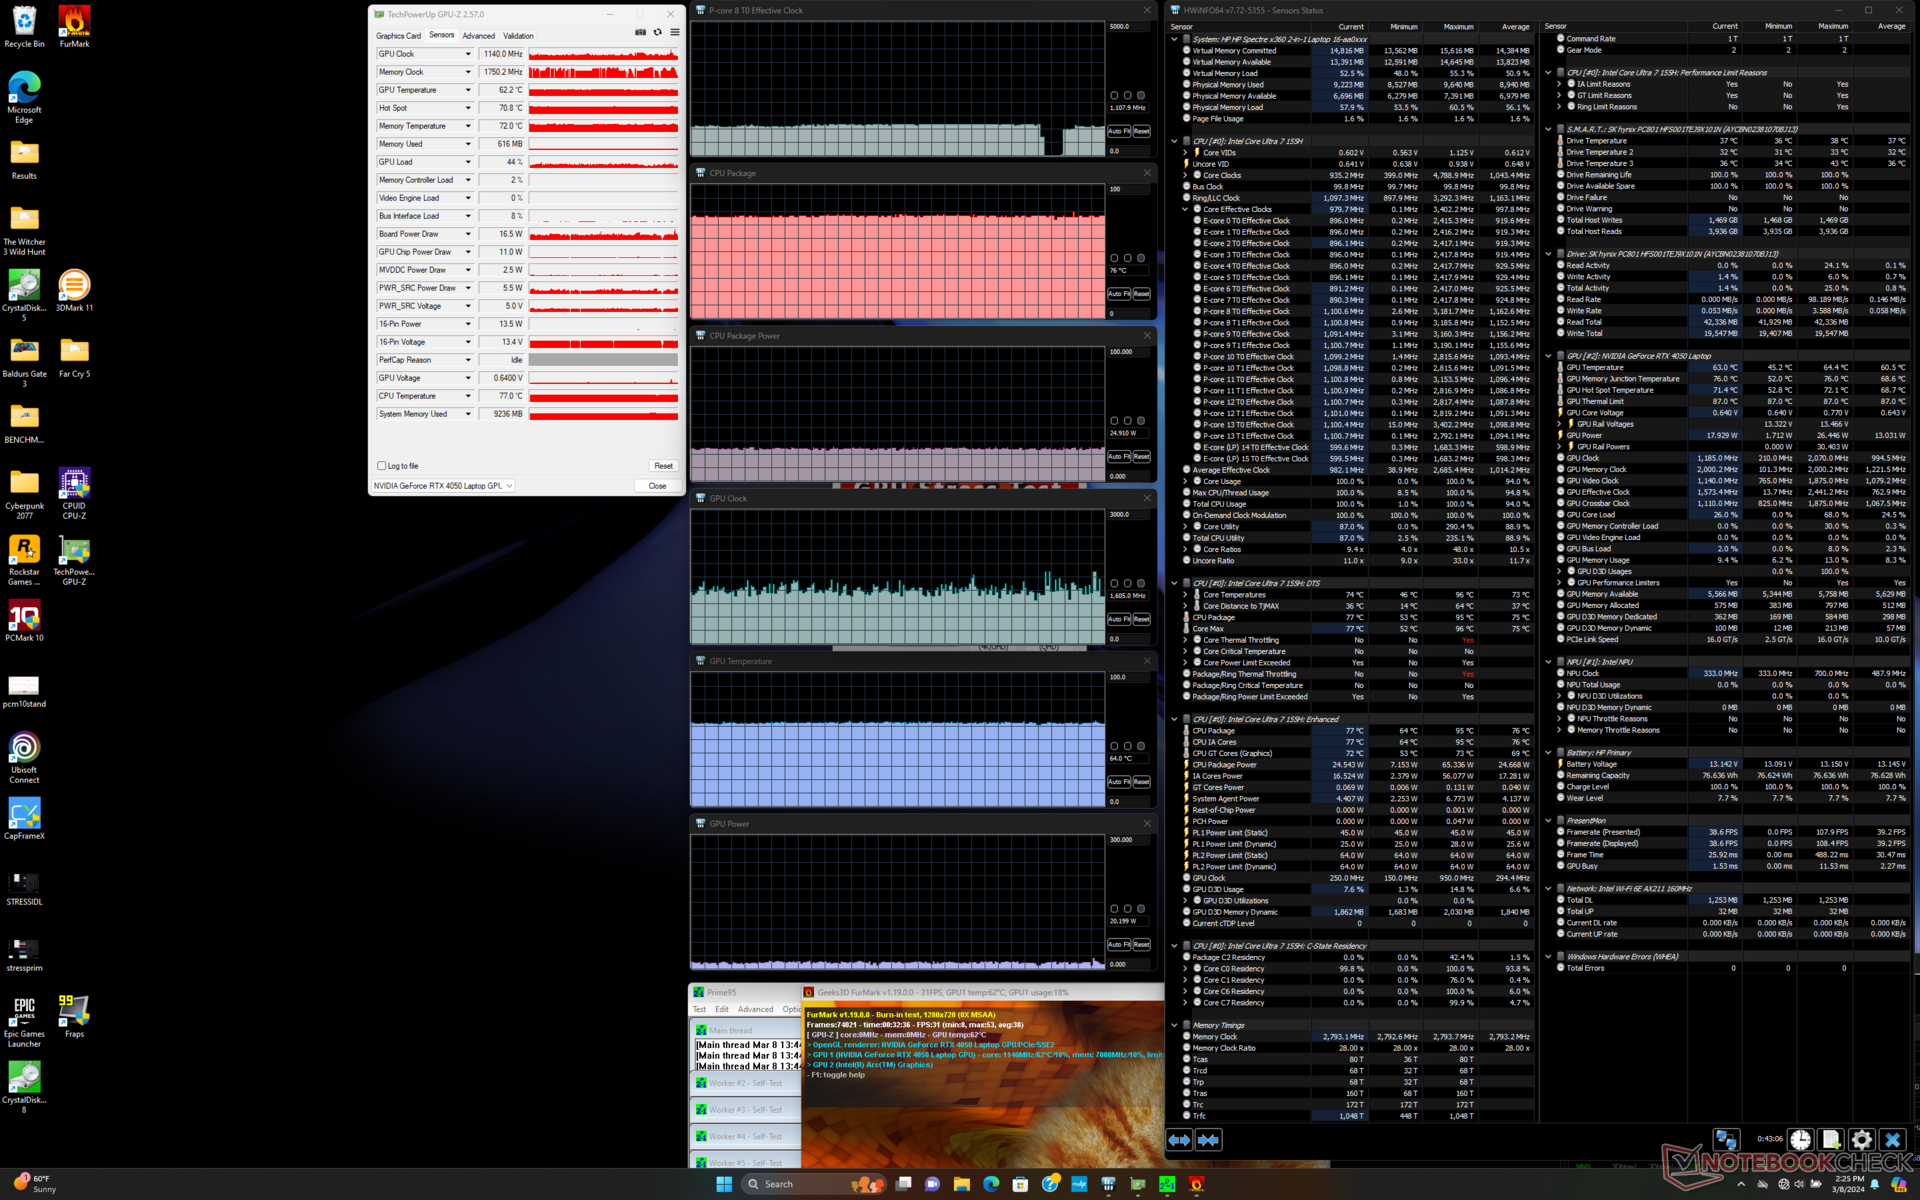
| Horloge du CPU (GHz) | Horloge du GPU (MHz) | Température moyenne du CPU (°C) | Température moyenne du GPU (°C) | |
| Système au repos | -- | -- | 53 | 45 |
| Prime95 Stress | ~1.5 | -- | 75 | 57 |
| Prime95 + FurMark Stress | ~1.1 | ~1140 | 77 | 64 |
| Witcher 3 Stress(mode équilibré) | ~1.1 | 1920 | 66 | 62 |
| Witcher 3 Stress (mode Performance) | ~1.1 | 2235 | 72 | 71 |
Performance du système
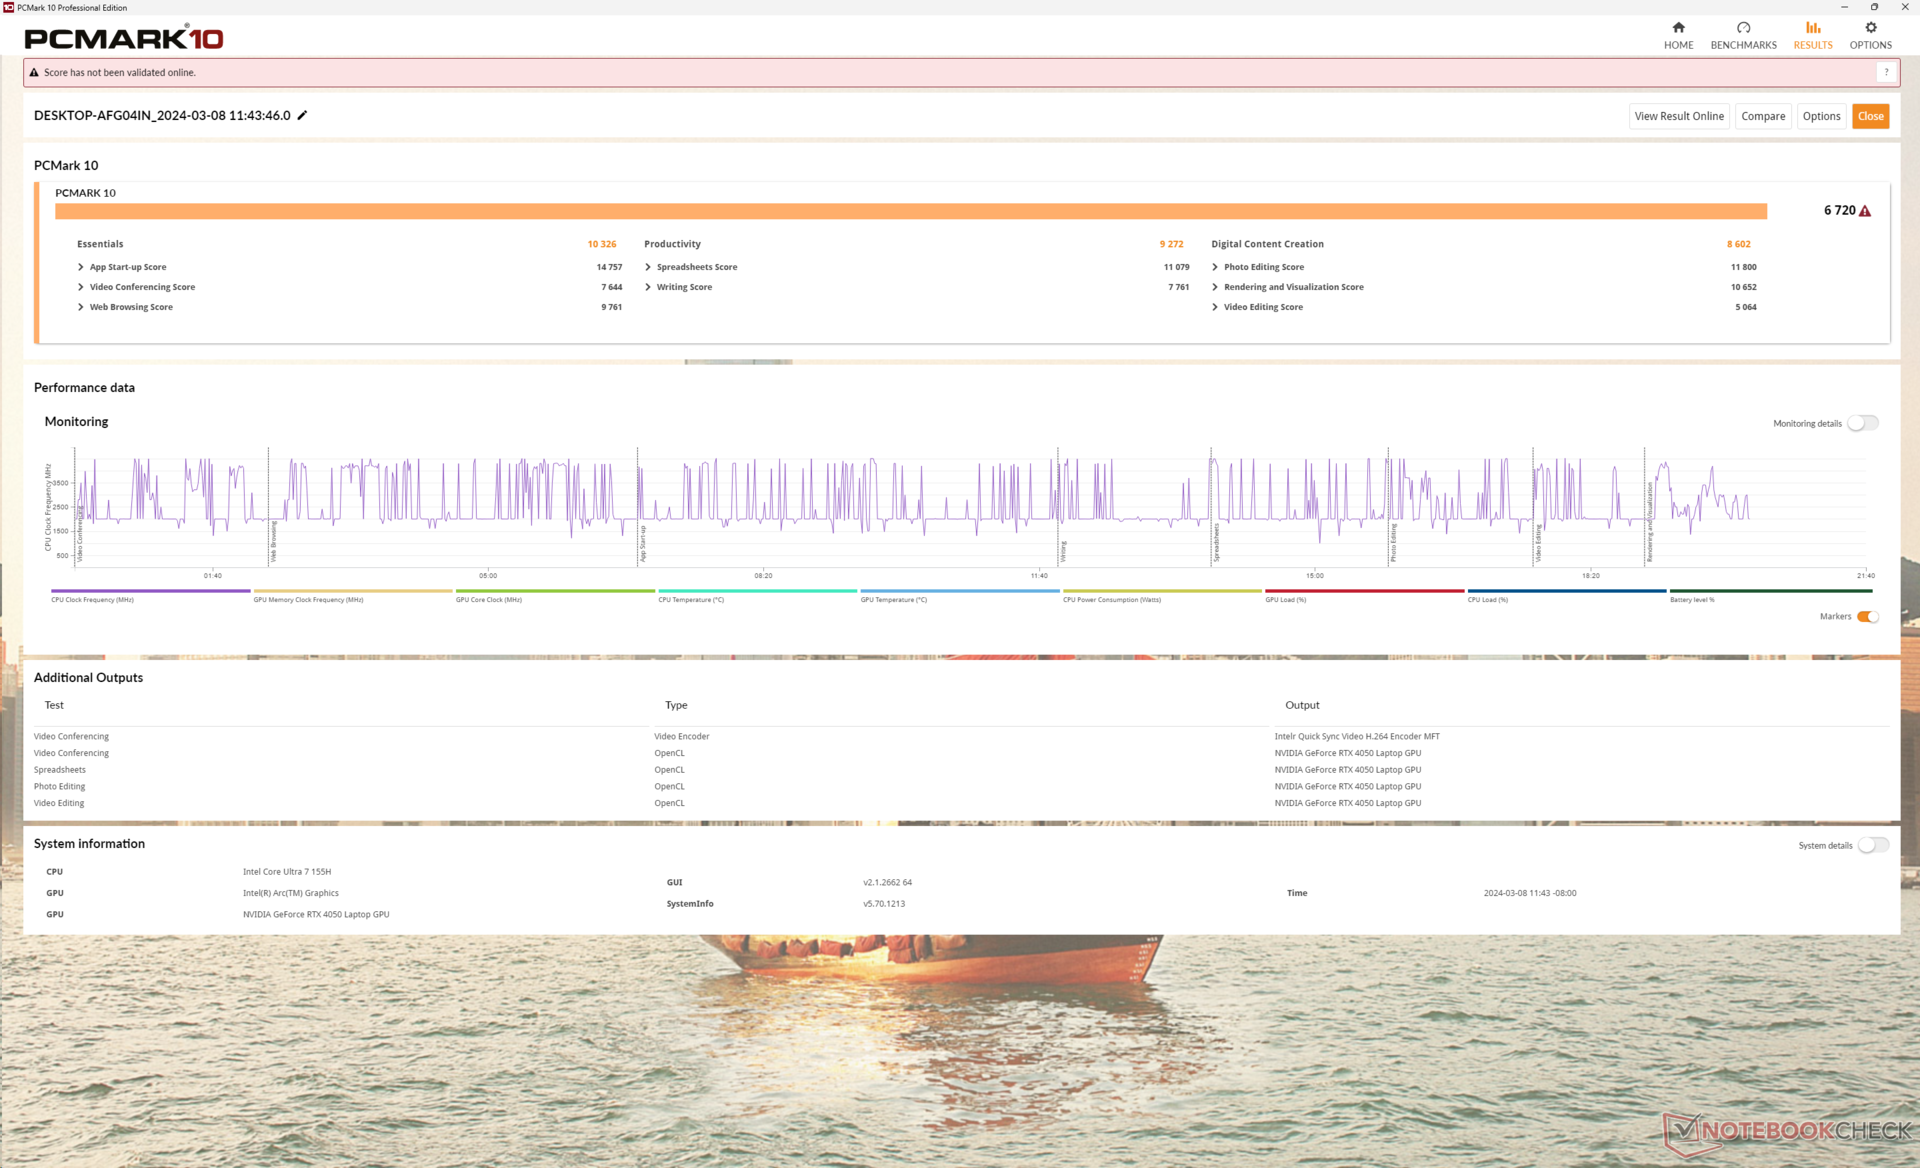
Les scores de PCMark 10 sont comparables à ceux de la configuration iGPU du même modèle, même si notre version dGPU est nettement plus rapide. Cependant, PCMark n'a jamais été un outil de benchmarking GPU précis pour les systèmes dotés d'une carte graphique Optimus 1.0 comme notre Spectre x360 16 series.
CrossMark: Overall | Productivity | Creativity | Responsiveness
WebXPRT 3: Overall
WebXPRT 4: Overall
Mozilla Kraken 1.1: Total
| PCMark 10 / Score | |
| MSI Prestige 16 B1MG-001US | |
| HP Spectre x360 16-aa0074ng | |
| Honor MagicBook Pro 16 2024 | |
| Moyenne Intel Core Ultra 7 155H, NVIDIA GeForce RTX 4050 Laptop GPU (6537 - 6973, n=3) | |
| HP Spectre x360 16 RTX 4050 | |
| HP Spectre x360 2-in-1 16-f1075ng | |
| LG Gram 2in1 16 16T90R - G.AA78G | |
| PCMark 10 / Essentials | |
| LG Gram 2in1 16 16T90R - G.AA78G | |
| MSI Prestige 16 B1MG-001US | |
| HP Spectre x360 2-in-1 16-f1075ng | |
| HP Spectre x360 16-aa0074ng | |
| HP Spectre x360 16 RTX 4050 | |
| Moyenne Intel Core Ultra 7 155H, NVIDIA GeForce RTX 4050 Laptop GPU (10044 - 10446, n=3) | |
| Honor MagicBook Pro 16 2024 | |
| PCMark 10 / Productivity | |
| HP Spectre x360 16 RTX 4050 | |
| Moyenne Intel Core Ultra 7 155H, NVIDIA GeForce RTX 4050 Laptop GPU (8769 - 9272, n=3) | |
| HP Spectre x360 16-aa0074ng | |
| MSI Prestige 16 B1MG-001US | |
| Honor MagicBook Pro 16 2024 | |
| HP Spectre x360 2-in-1 16-f1075ng | |
| LG Gram 2in1 16 16T90R - G.AA78G | |
| PCMark 10 / Digital Content Creation | |
| Honor MagicBook Pro 16 2024 | |
| MSI Prestige 16 B1MG-001US | |
| HP Spectre x360 16-aa0074ng | |
| Moyenne Intel Core Ultra 7 155H, NVIDIA GeForce RTX 4050 Laptop GPU (8602 - 9624, n=3) | |
| HP Spectre x360 16 RTX 4050 | |
| HP Spectre x360 2-in-1 16-f1075ng | |
| LG Gram 2in1 16 16T90R - G.AA78G | |
| CrossMark / Overall | |
| MSI Prestige 16 B1MG-001US | |
| Honor MagicBook Pro 16 2024 | |
| HP Spectre x360 16-aa0074ng | |
| HP Spectre x360 2-in-1 16-f1075ng | |
| Moyenne Intel Core Ultra 7 155H, NVIDIA GeForce RTX 4050 Laptop GPU (1574 - 1740, n=3) | |
| HP Spectre x360 16 RTX 4050 | |
| LG Gram 2in1 16 16T90R - G.AA78G | |
| CrossMark / Productivity | |
| HP Spectre x360 2-in-1 16-f1075ng | |
| MSI Prestige 16 B1MG-001US | |
| Honor MagicBook Pro 16 2024 | |
| HP Spectre x360 16-aa0074ng | |
| Moyenne Intel Core Ultra 7 155H, NVIDIA GeForce RTX 4050 Laptop GPU (1496 - 1659, n=3) | |
| LG Gram 2in1 16 16T90R - G.AA78G | |
| HP Spectre x360 16 RTX 4050 | |
| CrossMark / Creativity | |
| MSI Prestige 16 B1MG-001US | |
| HP Spectre x360 16-aa0074ng | |
| Moyenne Intel Core Ultra 7 155H, NVIDIA GeForce RTX 4050 Laptop GPU (1831 - 1930, n=3) | |
| HP Spectre x360 16 RTX 4050 | |
| Honor MagicBook Pro 16 2024 | |
| HP Spectre x360 2-in-1 16-f1075ng | |
| LG Gram 2in1 16 16T90R - G.AA78G | |
| CrossMark / Responsiveness | |
| HP Spectre x360 2-in-1 16-f1075ng | |
| Honor MagicBook Pro 16 2024 | |
| MSI Prestige 16 B1MG-001US | |
| LG Gram 2in1 16 16T90R - G.AA78G | |
| HP Spectre x360 16-aa0074ng | |
| Moyenne Intel Core Ultra 7 155H, NVIDIA GeForce RTX 4050 Laptop GPU (1167 - 1467, n=3) | |
| HP Spectre x360 16 RTX 4050 | |
| WebXPRT 3 / Overall | |
| MSI Prestige 16 B1MG-001US | |
| Honor MagicBook Pro 16 2024 | |
| Moyenne Intel Core Ultra 7 155H, NVIDIA GeForce RTX 4050 Laptop GPU (278 - 281, n=3) | |
| HP Spectre x360 16 RTX 4050 | |
| HP Spectre x360 16-aa0074ng | |
| HP Spectre x360 2-in-1 16-f1075ng | |
| LG Gram 2in1 16 16T90R - G.AA78G | |
| WebXPRT 4 / Overall | |
| MSI Prestige 16 B1MG-001US | |
| HP Spectre x360 16-aa0074ng | |
| Honor MagicBook Pro 16 2024 | |
| Moyenne Intel Core Ultra 7 155H, NVIDIA GeForce RTX 4050 Laptop GPU (255 - 258, n=3) | |
| HP Spectre x360 16 RTX 4050 | |
| HP Spectre x360 2-in-1 16-f1075ng | |
| Mozilla Kraken 1.1 / Total | |
| LG Gram 2in1 16 16T90R - G.AA78G | |
| HP Spectre x360 16 RTX 4050 | |
| MSI Prestige 16 B1MG-001US | |
| HP Spectre x360 2-in-1 16-f1075ng | |
| Honor MagicBook Pro 16 2024 | |
| HP Spectre x360 16-aa0074ng | |
| Moyenne Intel Core Ultra 7 155H, NVIDIA GeForce RTX 4050 Laptop GPU (416 - 537, n=3) | |
* ... Moindre est la valeur, meilleures sont les performances
| PCMark 10 Score | 6720 points | |
Aide | ||
| AIDA64 / Memory Copy | |
| HP Spectre x360 16-aa0074ng | |
| Moyenne Intel Core Ultra 7 155H (62397 - 95631, n=25) | |
| HP Spectre x360 16 RTX 4050 | |
| Honor MagicBook Pro 16 2024 | |
| MSI Prestige 16 B1MG-001US | |
| LG Gram 2in1 16 16T90R - G.AA78G | |
| HP Spectre x360 2-in-1 16-f1075ng | |
| AIDA64 / Memory Read | |
| HP Spectre x360 16 RTX 4050 | |
| HP Spectre x360 16-aa0074ng | |
| Moyenne Intel Core Ultra 7 155H (60544 - 90647, n=25) | |
| Honor MagicBook Pro 16 2024 | |
| MSI Prestige 16 B1MG-001US | |
| LG Gram 2in1 16 16T90R - G.AA78G | |
| HP Spectre x360 2-in-1 16-f1075ng | |
| AIDA64 / Memory Write | |
| HP Spectre x360 16 RTX 4050 | |
| LG Gram 2in1 16 16T90R - G.AA78G | |
| MSI Prestige 16 B1MG-001US | |
| Honor MagicBook Pro 16 2024 | |
| HP Spectre x360 16-aa0074ng | |
| Moyenne Intel Core Ultra 7 155H (64852 - 93451, n=25) | |
| HP Spectre x360 2-in-1 16-f1075ng | |
| AIDA64 / Memory Latency | |
| Moyenne Intel Core Ultra 7 155H (125.8 - 173, n=25) | |
| Honor MagicBook Pro 16 2024 | |
| HP Spectre x360 16-aa0074ng | |
| HP Spectre x360 16 RTX 4050 | |
| MSI Prestige 16 B1MG-001US | |
| LG Gram 2in1 16 16T90R - G.AA78G | |
| HP Spectre x360 2-in-1 16-f1075ng | |
* ... Moindre est la valeur, meilleures sont les performances
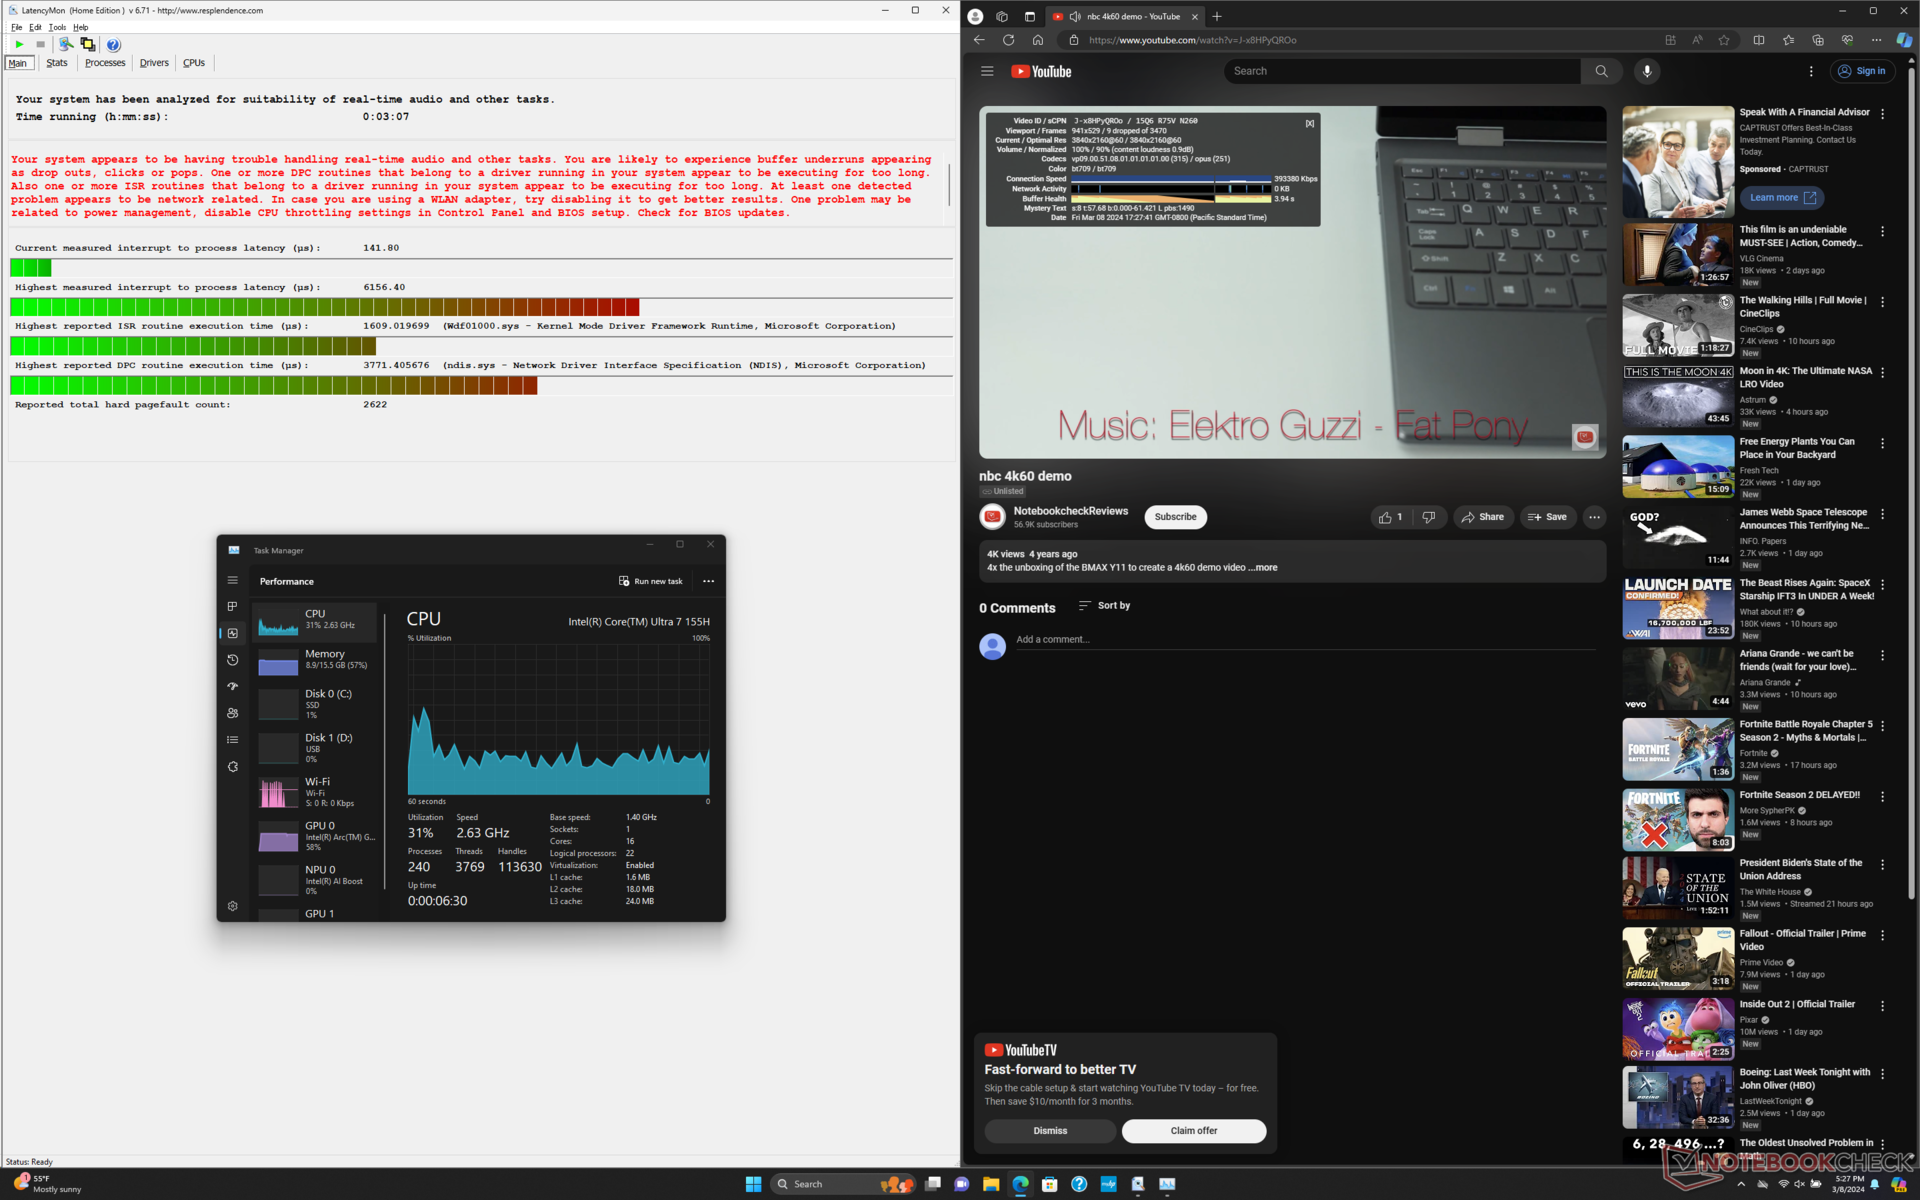
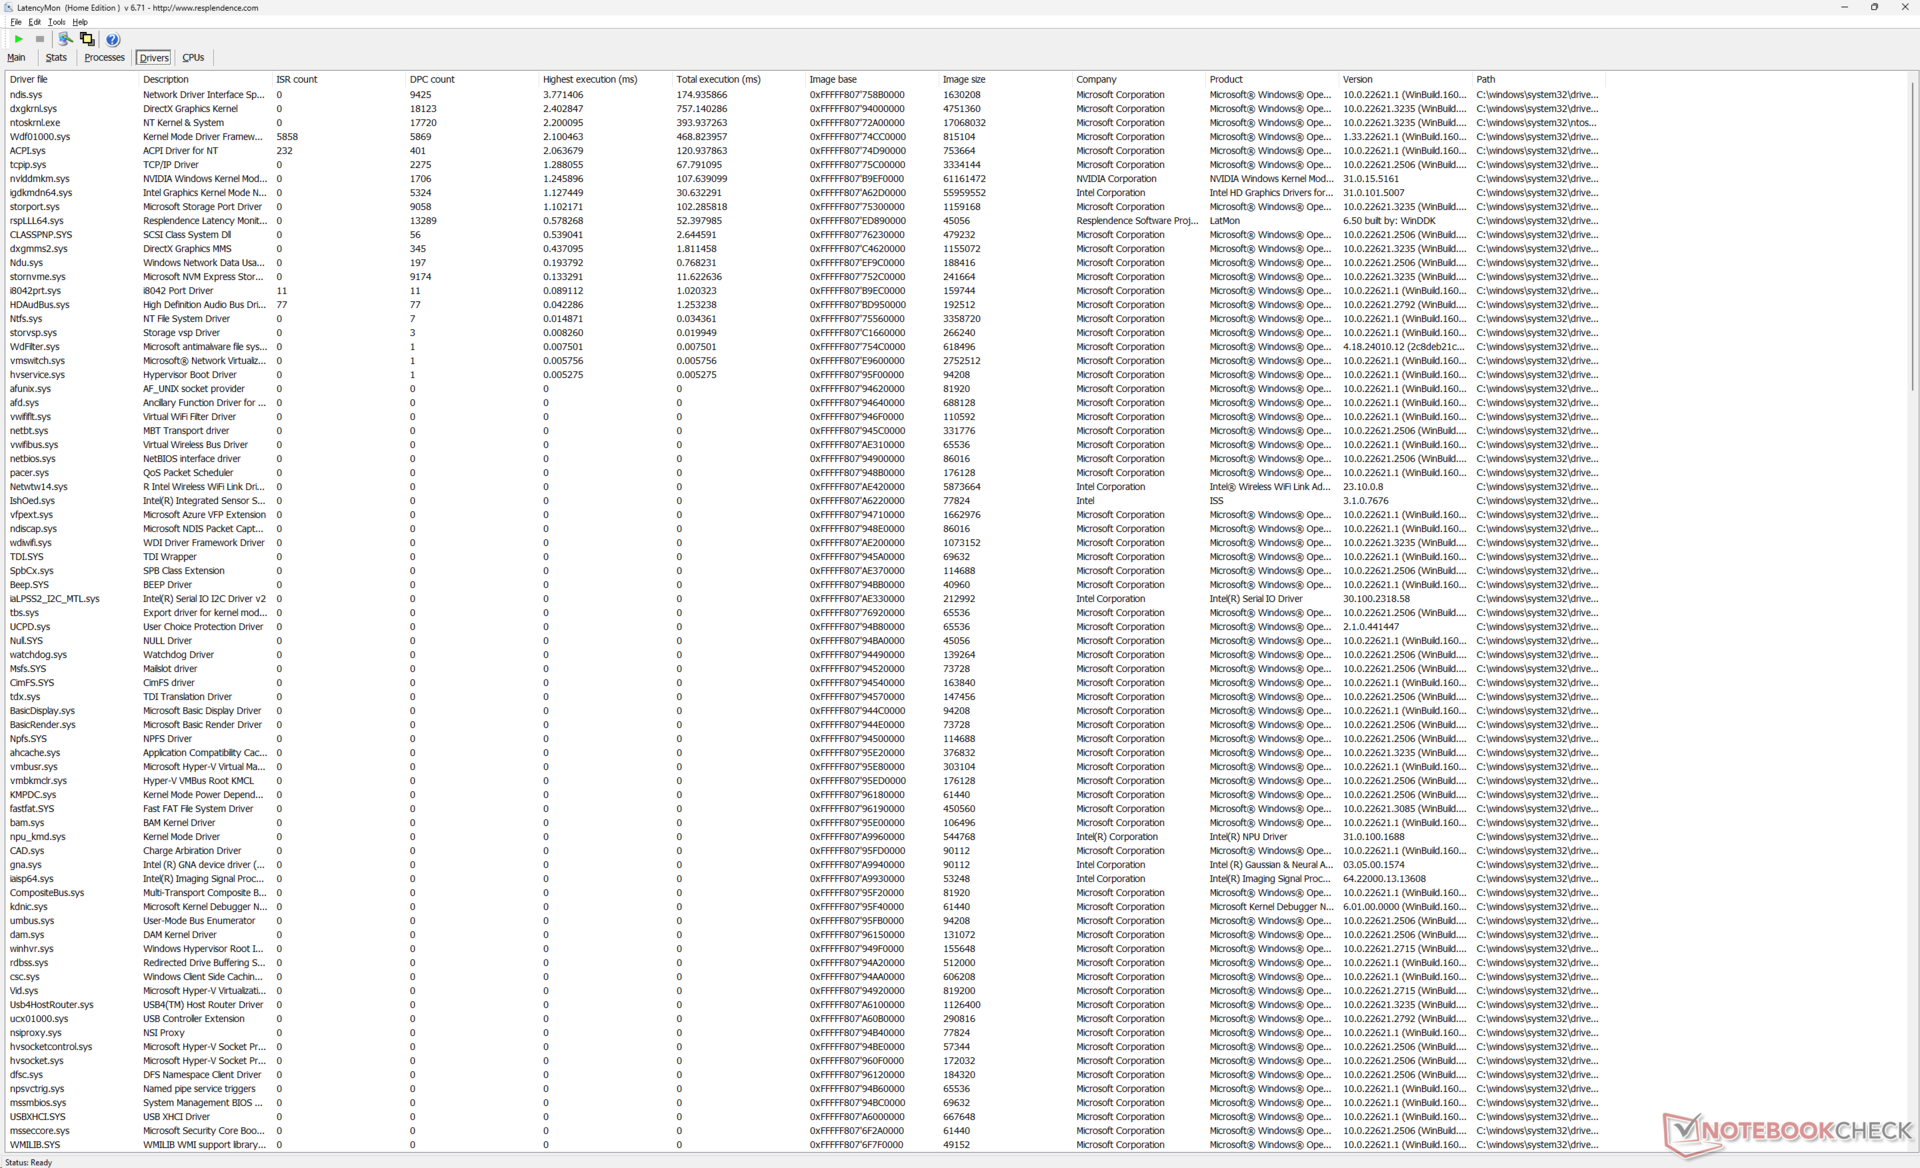
Latence DPC
LatencyMon révèle à la fois des problèmes de DPC et des pertes d'images pendant notre test vidéo 4K60 d'une durée d'une minute. Notre unité d'évaluation iGPU présentait également des pertes d'images pendant le même test, ce qui suggère un problème sous-jacent potentiel dans les deux configurations.
| DPC Latencies / LatencyMon - interrupt to process latency (max), Web, Youtube, Prime95 | |
| LG Gram 2in1 16 16T90R - G.AA78G | |
| HP Spectre x360 16 RTX 4050 | |
| Honor MagicBook Pro 16 2024 | |
| HP Spectre x360 2-in-1 16-f1075ng | |
| HP Spectre x360 16-aa0074ng | |
| MSI Prestige 16 B1MG-001US | |
* ... Moindre est la valeur, meilleures sont les performances
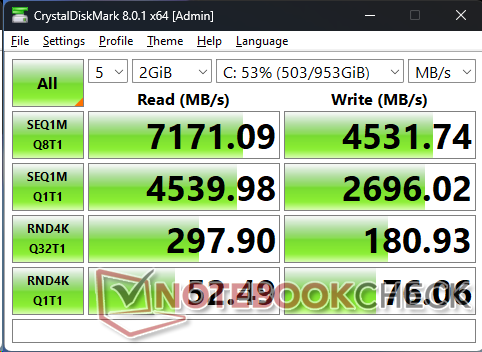
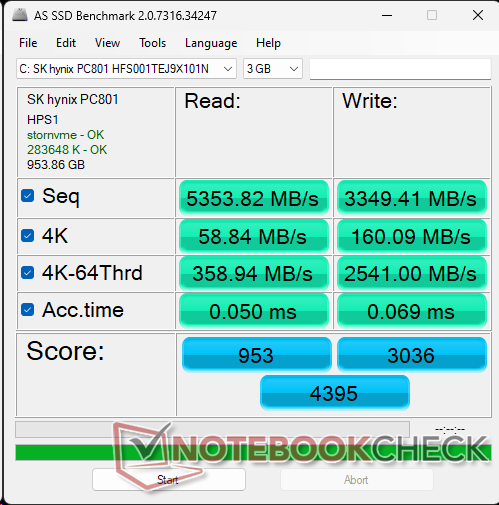
Dispositifs de stockage
Notre unité de test spécifique est livrée avec la carte SK Hynix PC801 au lieu du Kioxia XG8. Les taux de transfert sont néanmoins excellents et il n'y a pas de problèmes d'étranglement notables lorsque DiskSpd fonctionne en boucle.

* ... Moindre est la valeur, meilleures sont les performances
Disk Throttling: DiskSpd Read Loop, Queue Depth 8
Performance du GPU
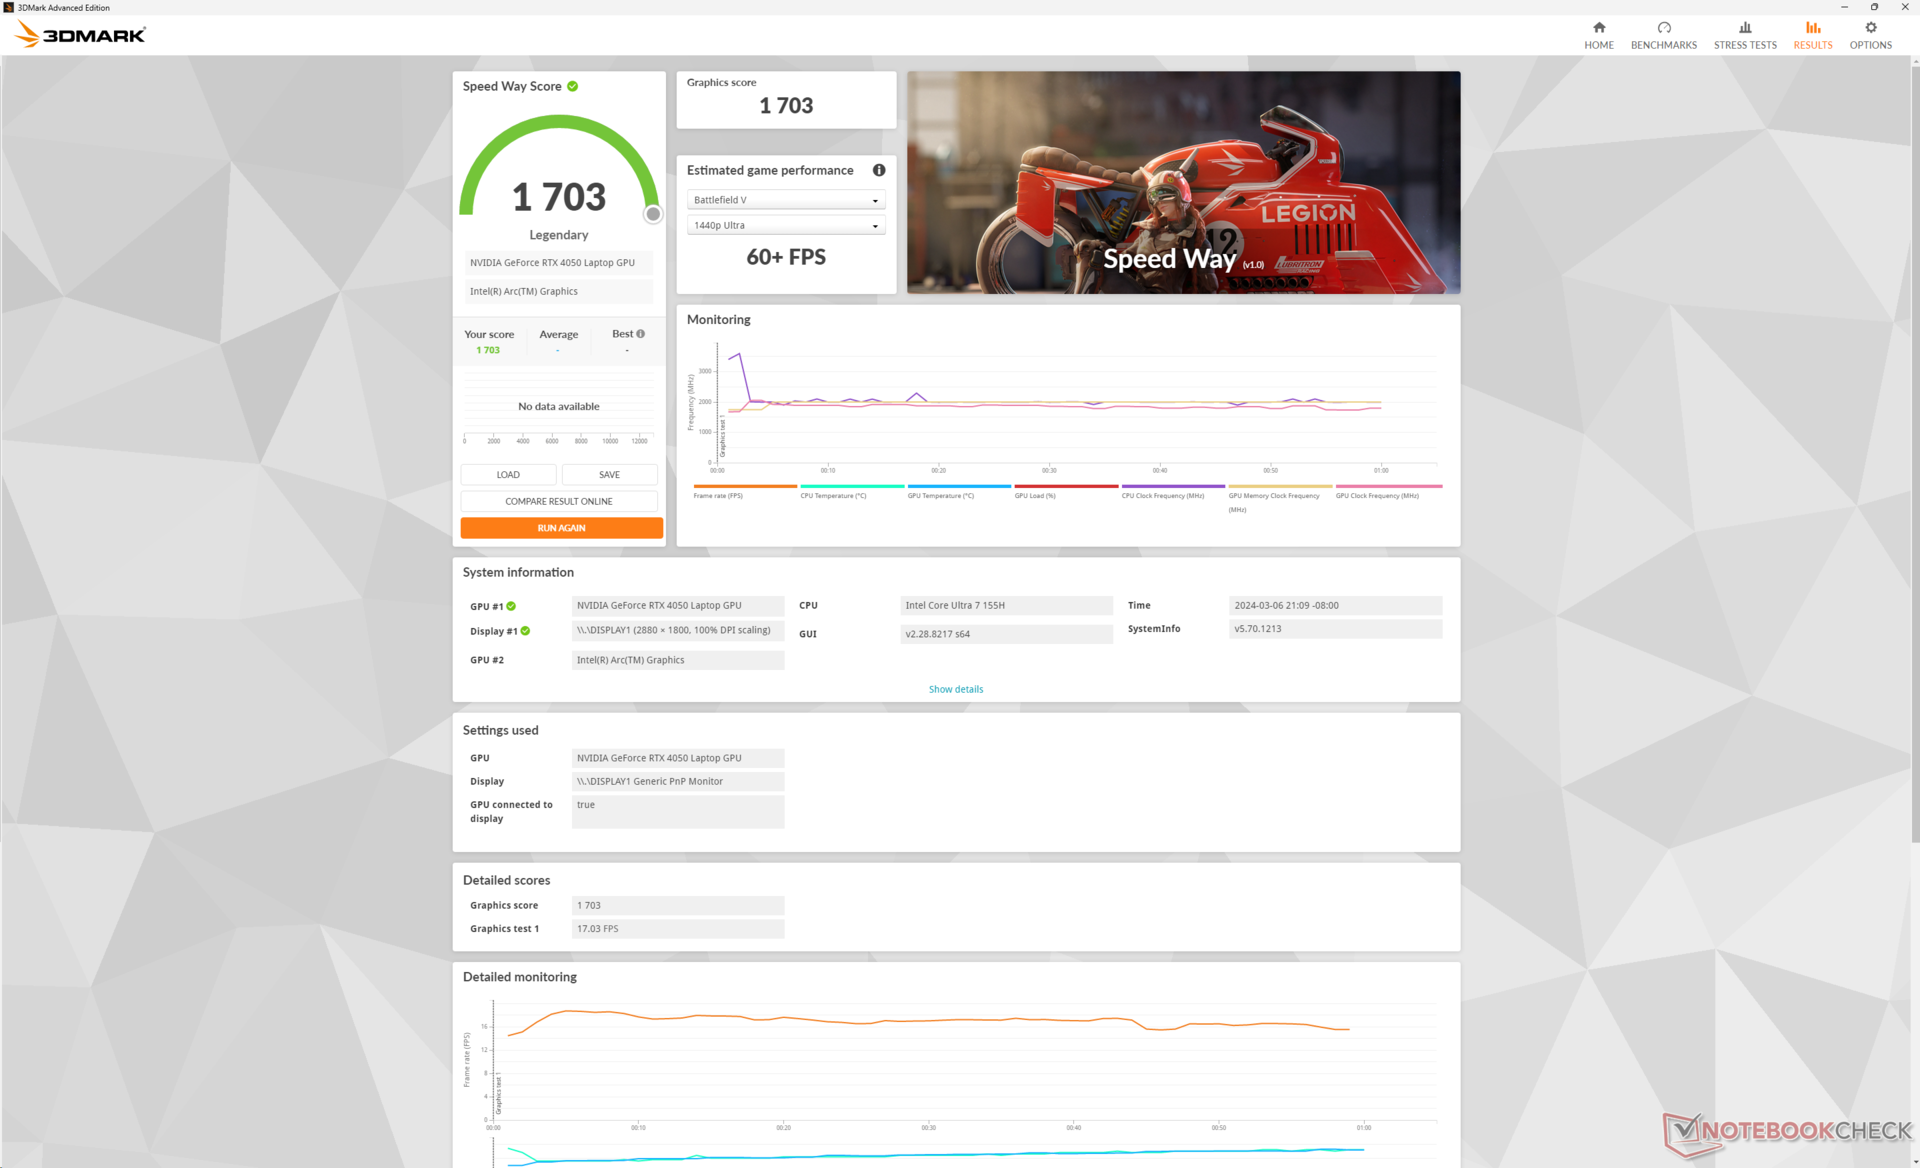
Il va sans dire que la GeForce RTX 4050 offre une augmentation massive des performances par rapport à la configuration intégrée Arc 8. les scores 3DMark sont environ deux fois plus élevés, tandis que l'accélération CUDA permet un rendu plus rapide dans Blender par un facteur de 10.
Par rapport à d'autres ordinateurs portables équipés du même GPU RTX 4050, le Spectre x360 16 est cependant moins performant. La cible TGP de 55 W est inférieure à celle des ordinateurs portables concurrents tels que l'Acer Predator Helios Neo 16 Test du Predator Helios Neo 16 : Acer a créé une chimère pour le jeu ou Victus 15 qui visent 130 W et 75 W, respectivement. En conséquence, les scores 3DMark sont environ 10 à 15 % plus lents que la moyenne des ordinateurs portables de notre base de données avec le même GPU GeForce RTX 4050.
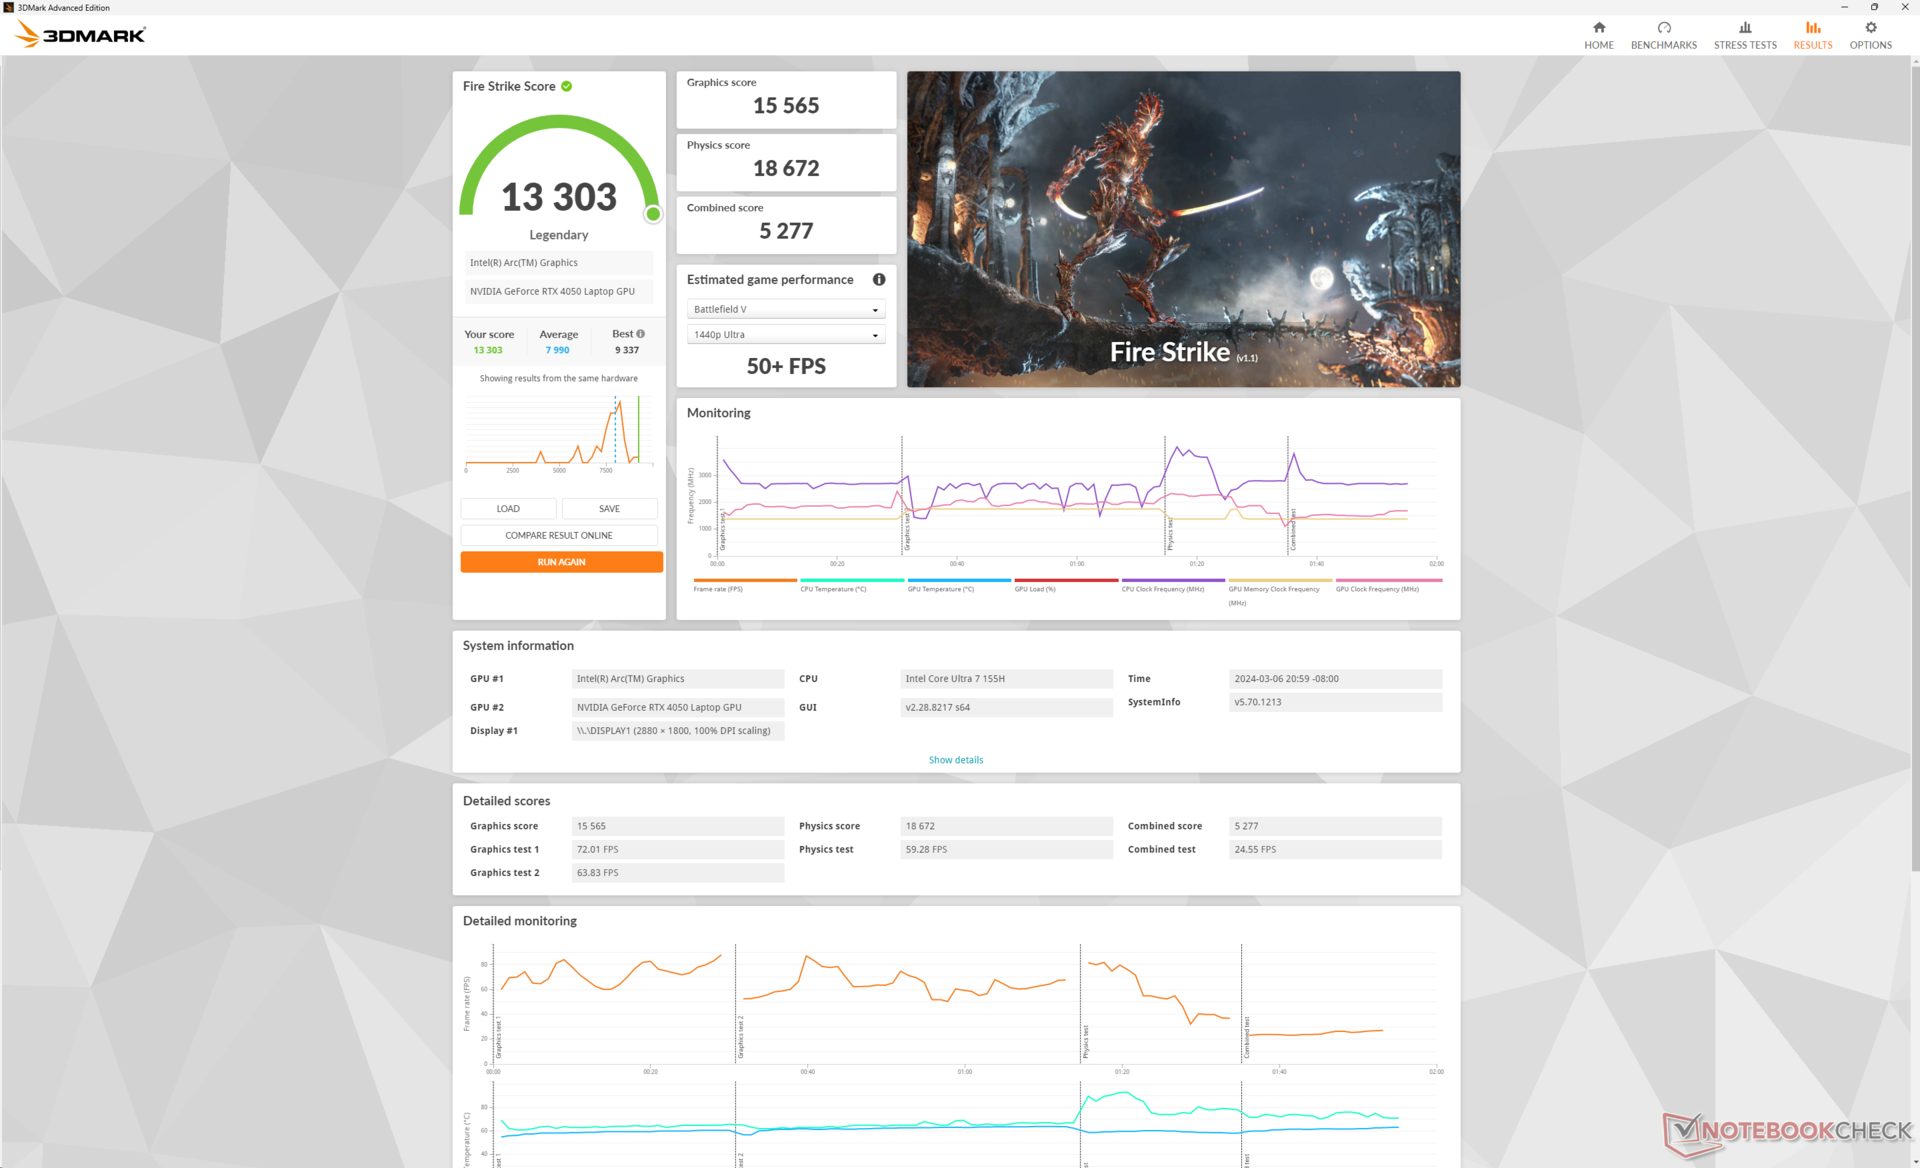
| Profil de puissance | Score graphique | Score physique | Score combiné |
| Mode Performance | 17908 | 17248 | 7364 |
| Mode équilibré | 15565 (-13%) | 18672 (+8%) | 5277 (-28%) |
| Alimentation par batterie | 14156 (-21%) | 21326 (+24%) | 5985 (-19%) |
Fire Strike les résultats sont incohérents comme le montre le tableau ci-dessus. Le score du CPU augmente en mode équilibré et en mode batterie, alors que l'inverse est vrai pour le score du GPU, même après plusieurs tests à froid. Encore une fois, HP est conscient du problème et dit qu'un correctif est en cours d'élaboration.
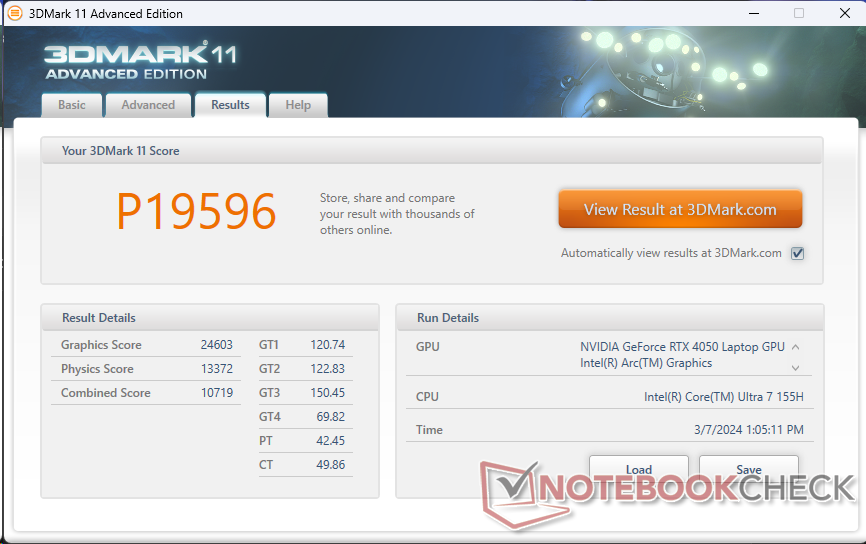
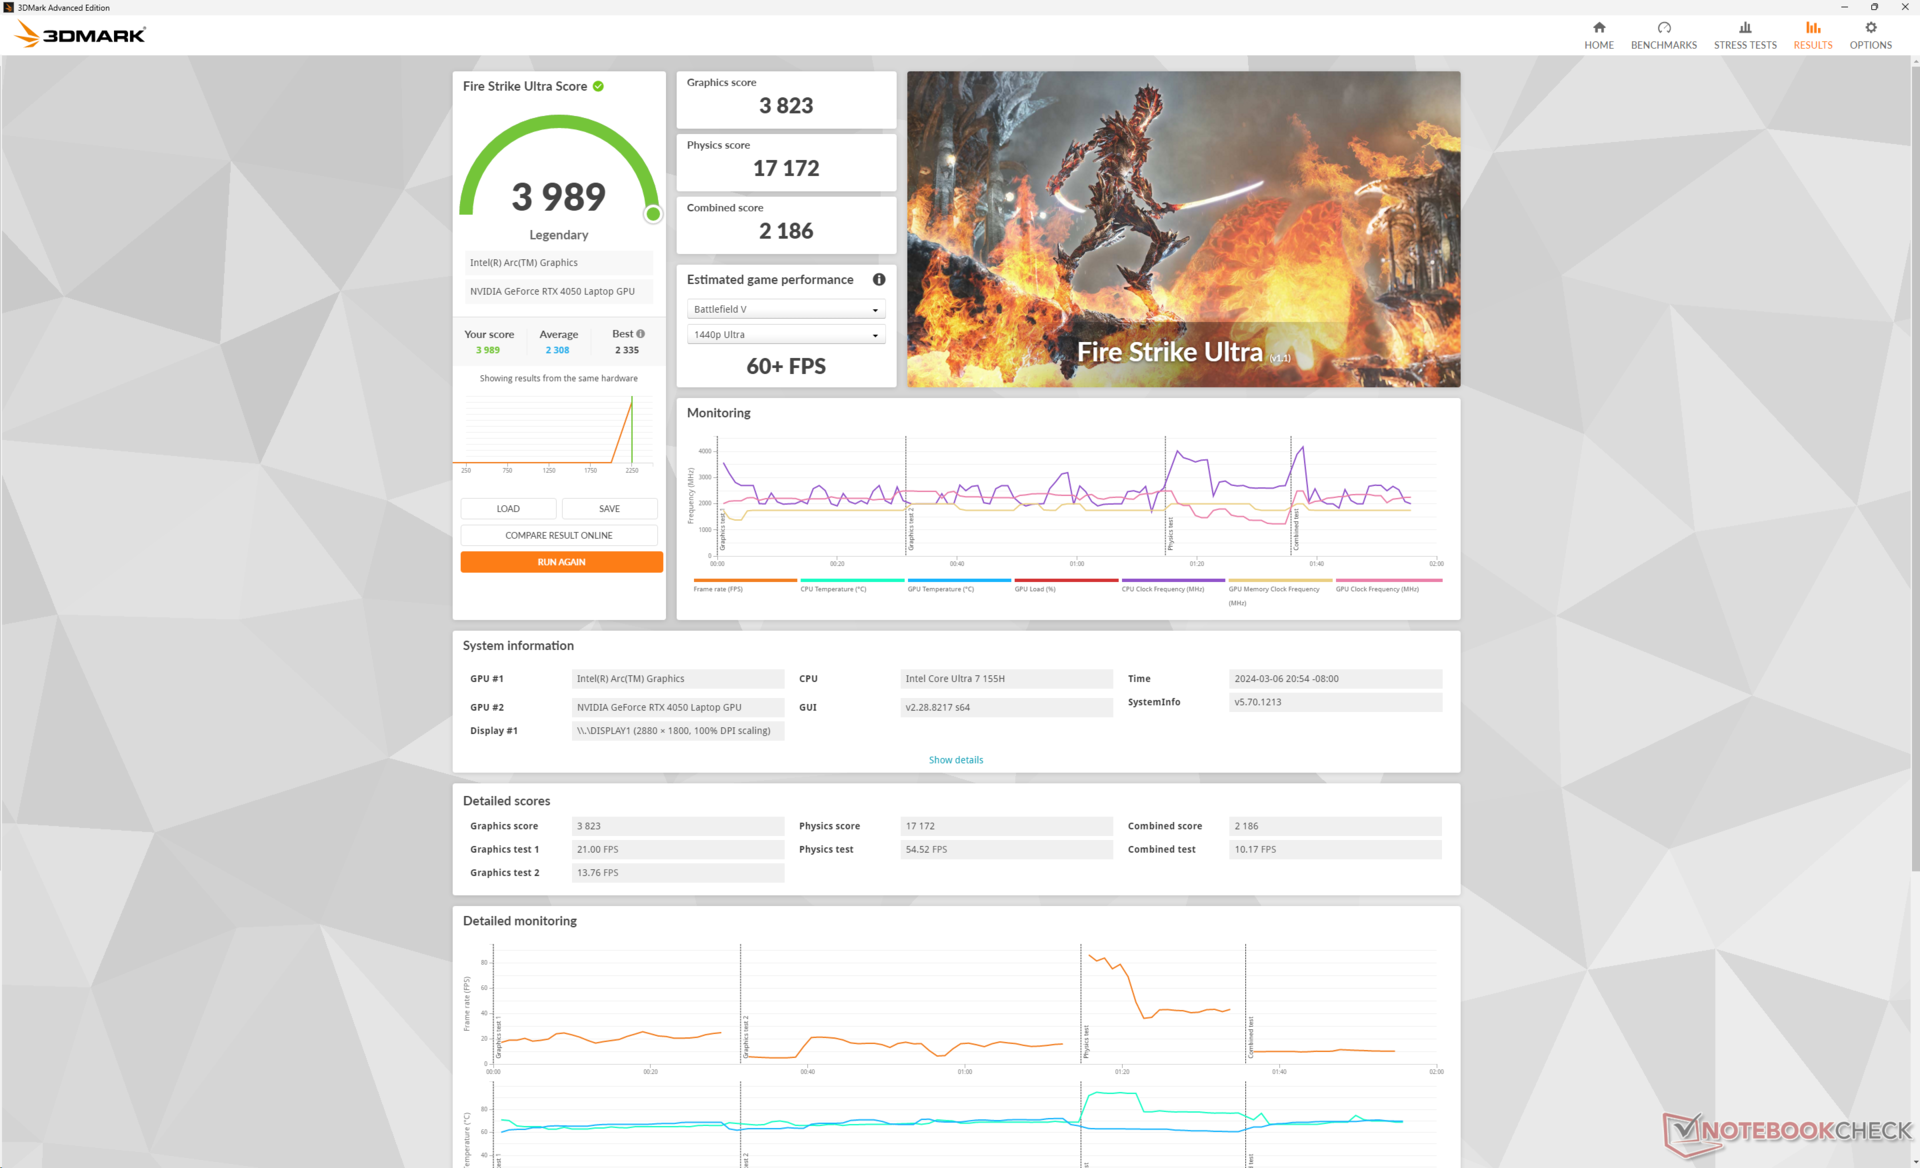
| 3DMark 11 Performance | 19596 points | |
| 3DMark Fire Strike Score | 15586 points | |
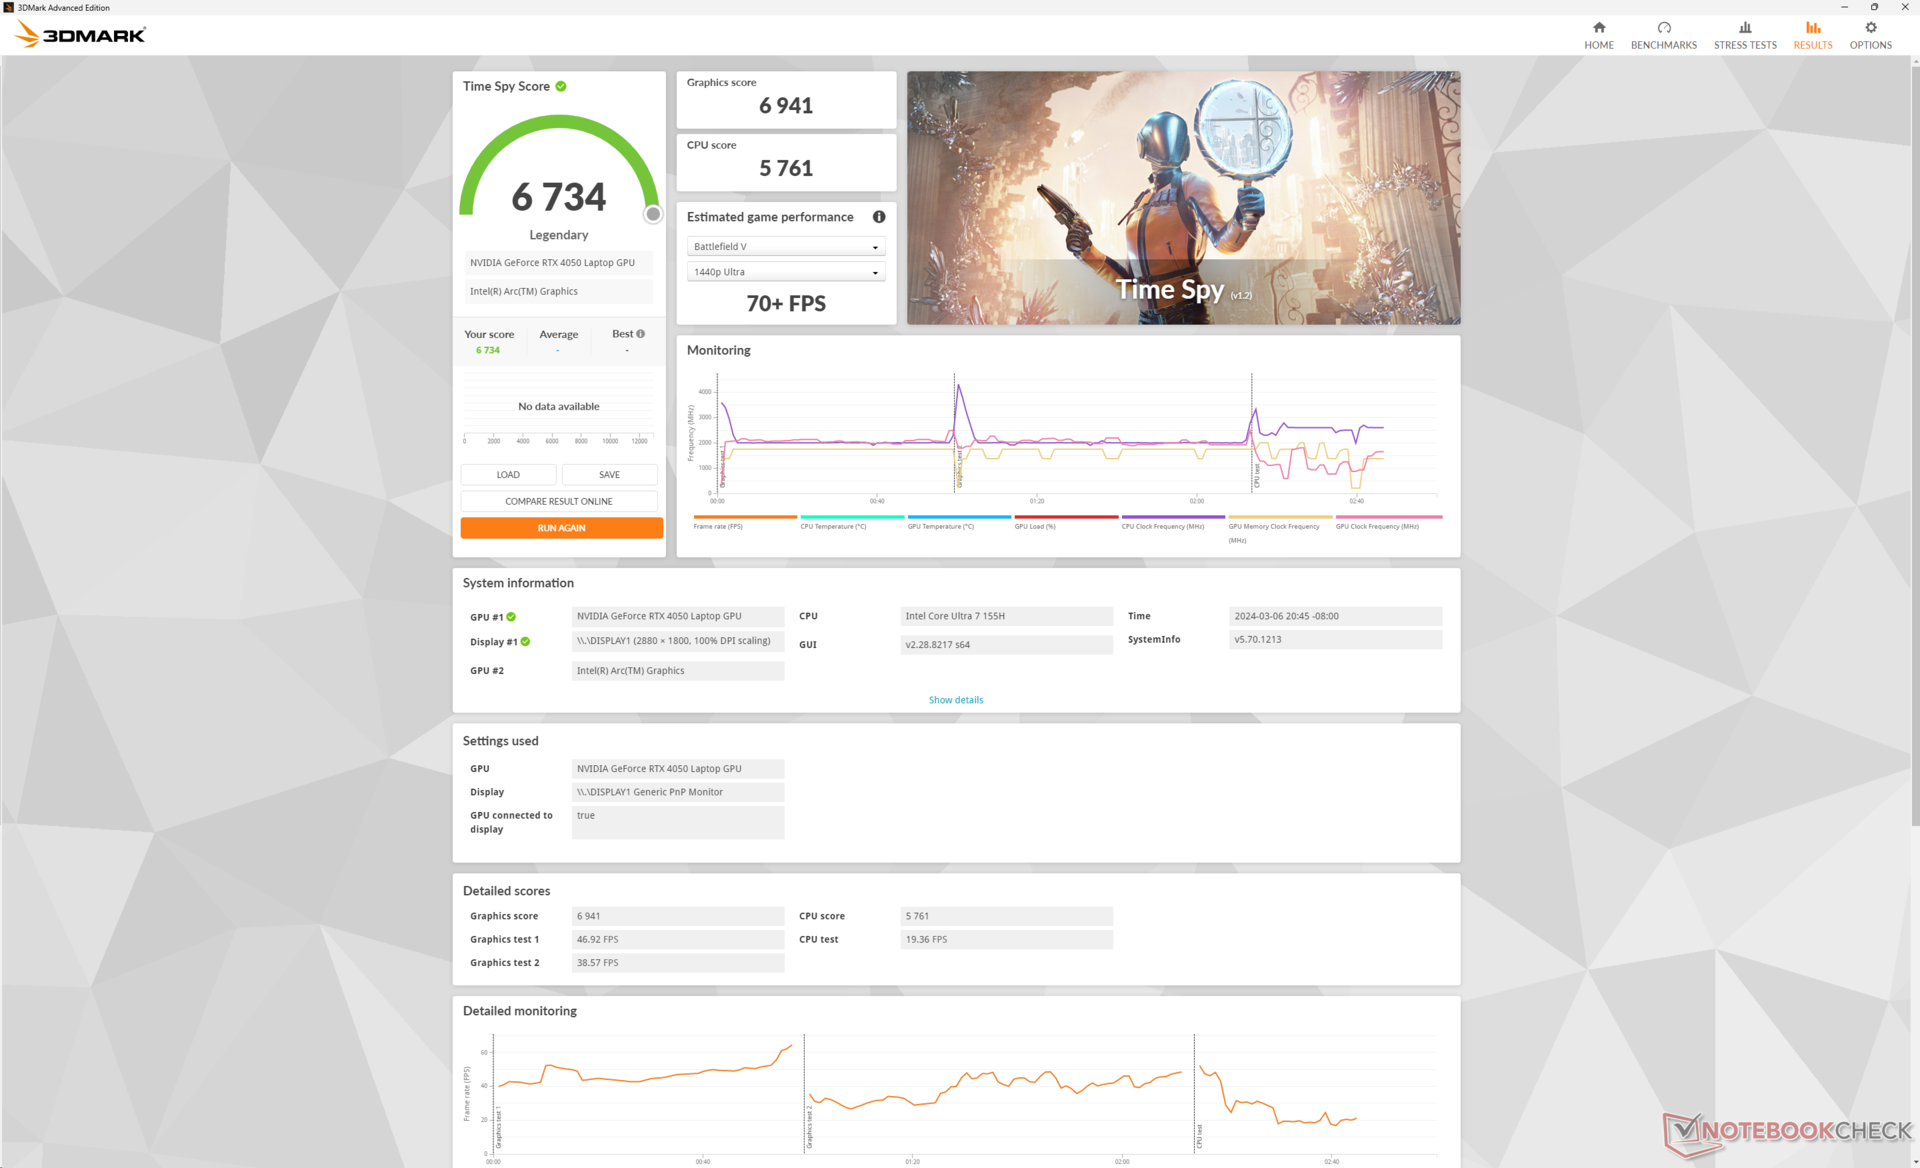
| 3DMark Time Spy Score | 6734 points | |
Aide | ||
* ... Moindre est la valeur, meilleures sont les performances
Performances des jeux
La GeForce RTX 4050 est puissante pour les jeux malgré son statut de GPU RTX d'entrée de gamme. Les jeux exigeants comme Cyberpunk 2077 tournent bien en 1080p avec les paramètres Ultra avant toute amélioration DLSS. Cependant, les choses se gâtent à des résolutions plus élevées, auquel cas il est recommandé de baisser les paramètres pour maintenir les taux d'images à flot. Les jeux sont très nets lorsqu'ils sont joués sur l'écran OLED 1800p natif, mais préparez-vous à réduire la plupart des effets graphiques.
| The Witcher 3 - 1920x1080 Ultra Graphics & Postprocessing (HBAO+) | |
| Honor MagicBook Pro 16 2024 | |
| HP Spectre x360 16 RTX 4050 | |
| MSI Prestige 16 B1MG-001US | |
| HP Spectre x360 16-aa0074ng | |
| LG Gram 2in1 16 16T90R - G.AA78G | |
| HP Spectre x360 2-in-1 16-f1075ng | |
| GTA V - 1920x1080 Highest Settings possible AA:4xMSAA + FX AF:16x | |
| Honor MagicBook Pro 16 2024 | |
| HP Spectre x360 16 RTX 4050 | |
| HP Spectre x360 16-aa0074ng | |
| LG Gram 2in1 16 16T90R - G.AA78G | |
| HP Spectre x360 2-in-1 16-f1075ng | |
| Final Fantasy XV Benchmark - 1920x1080 High Quality | |
| Honor MagicBook Pro 16 2024 | |
| HP Spectre x360 16 RTX 4050 | |
| MSI Prestige 16 B1MG-001US | |
| HP Spectre x360 16-aa0074ng | |
| LG Gram 2in1 16 16T90R - G.AA78G | |
| HP Spectre x360 2-in-1 16-f1075ng | |
| Strange Brigade - 1920x1080 ultra AA:ultra AF:16 | |
| Honor MagicBook Pro 16 2024 | |
| HP Spectre x360 16 RTX 4050 | |
| HP Spectre x360 16-aa0074ng | |
| MSI Prestige 16 B1MG-001US | |
| LG Gram 2in1 16 16T90R - G.AA78G | |
| HP Spectre x360 2-in-1 16-f1075ng | |
| Dota 2 Reborn - 1920x1080 ultra (3/3) best looking | |
| Honor MagicBook Pro 16 2024 | |
| HP Spectre x360 16 RTX 4050 | |
| MSI Prestige 16 B1MG-001US | |
| HP Spectre x360 16-aa0074ng | |
| LG Gram 2in1 16 16T90R - G.AA78G | |
| HP Spectre x360 2-in-1 16-f1075ng | |
| X-Plane 11.11 - 1920x1080 high (fps_test=3) | |
| Honor MagicBook Pro 16 2024 | |
| HP Spectre x360 16 RTX 4050 | |
| HP Spectre x360 2-in-1 16-f1075ng | |
| LG Gram 2in1 16 16T90R - G.AA78G | |
| MSI Prestige 16 B1MG-001US | |
| HP Spectre x360 16-aa0074ng | |
| Tiny Tina's Wonderlands | |
| 1920x1080 Medium Preset (DX12) | |
| Moyenne NVIDIA GeForce RTX 4050 Laptop GPU (93.4 - 148.8, n=4) | |
| HP Spectre x360 16 RTX 4050 | |
| Lenovo ThinkPad E16 G1 Core i5-1335U | |
| 1920x1080 High Preset (DX12) | |
| Moyenne NVIDIA GeForce RTX 4050 Laptop GPU (63.3 - 99.5, n=4) | |
| HP Spectre x360 16 RTX 4050 | |
| Lenovo ThinkPad E16 G1 Core i5-1335U | |
| 1920x1080 Badass Preset (DX12) | |
| Moyenne NVIDIA GeForce RTX 4050 Laptop GPU (49.8 - 77.3, n=4) | |
| HP Spectre x360 16 RTX 4050 | |
| Lenovo ThinkPad E16 G1 Core i5-1335U | |
| 2560x1440 Badass Preset (DX12) | |
| Moyenne NVIDIA GeForce RTX 4050 Laptop GPU (33.6 - 47.7, n=3) | |
| HP Spectre x360 16 RTX 4050 | |
| Baldur's Gate 3 | |
| 1920x1080 Medium Preset | |
| Moyenne NVIDIA GeForce RTX 4050 Laptop GPU (56 - 85.9, n=5) | |
| HP Spectre x360 16 RTX 4050 | |
| 1920x1080 High Preset | |
| Moyenne NVIDIA GeForce RTX 4050 Laptop GPU (49.8 - 71.9, n=5) | |
| HP Spectre x360 16 RTX 4050 | |
| 1920x1080 Ultra Preset | |
| Moyenne NVIDIA GeForce RTX 4050 Laptop GPU (48.3 - 71, n=5) | |
| HP Spectre x360 16 RTX 4050 | |
| 2560x1440 Ultra Preset | |
| HP Spectre x360 16 RTX 4050 | |
| Moyenne NVIDIA GeForce RTX 4050 Laptop GPU (32.4 - 49.8, n=4) | |
Witcher 3 FPS Chart
| Bas | Moyen | Élevé | Ultra | QHD | |
| GTA V (2015) | 171.3 | 162.2 | 135.3 | 76.7 | 57.3 |
| The Witcher 3 (2015) | 299 | 209.6 | 120.1 | 62.7 | |
| Dota 2 Reborn (2015) | 142 | 124.2 | 119.6 | 106.4 | |
| Final Fantasy XV Benchmark (2018) | 132.7 | 94.5 | 68.6 | 49.6 | |
| X-Plane 11.11 (2018) | 100.6 | 86.7 | 69.7 | ||
| Far Cry 5 (2018) | 97 | 93 | 95 | 87 | 64 |
| Strange Brigade (2018) | 299 | 171.1 | 137.4 | 121.3 | 81.2 |
| Tiny Tina's Wonderlands (2022) | 135.1 | 113.4 | 75.4 | 59.1 | 40.4 |
| F1 22 (2022) | 159.4 | 146.6 | 124.6 | 42 | 26.9 |
| Baldur's Gate 3 (2023) | 84.9 | 71.4 | 64 | 63.1 | 42.5 |
| Cyberpunk 2077 2.0 Phantom Liberty (2023) | 79.3 | 63.3 | 53.5 | 46 | 27.5 |
Émissions - L'un des cabriolets de 16 pouces les plus silencieux
Bruit du système
Le bruit des ventilateurs est à peine plus fort que celui de la configuration iGPU qui était déjà très silencieuse. Nous n'avons pu enregistrer qu'un maximum de 32 dB(A) en mode Performance, contre 29 dB(A) pour la version iGPU ou 39 dB(A) pour le Spectre x360 16 de l'année dernière spectre x360 16 de l'année dernière design.
Degré de la nuisance sonore
| Au repos |
| 23.6 / 23.6 / 23.6 dB(A) |
| Fortement sollicité |
| 29.2 / 32.1 dB(A) |
 | ||
30 dB silencieux 40 dB(A) audible 50 dB(A) bruyant |
||
min: | ||
| HP Spectre x360 16 RTX 4050 NVIDIA GeForce RTX 4050 Laptop GPU, Ultra 7 155H, SK hynix PC801 HFS001TEJ9X101N | HP Spectre x360 16-aa0074ng Arc 8-Cores, Ultra 7 155H, Kioxia XG8 KXG80ZNV1T02 | HP Spectre x360 2-in-1 16-f1075ng Iris Xe G7 96EUs, i7-12700H, SK Hynix PC711 1TB HFS001TDE9X073N | Honor MagicBook Pro 16 2024 NVIDIA GeForce RTX 4060 Laptop GPU, Ultra 7 155H, WD PC SN740 SDDPNQD-1T00 | MSI Prestige 16 B1MG-001US Arc 8-Cores, Ultra 7 155H, Samsung PM9A1 MZVL22T0HBLB | LG Gram 2in1 16 16T90R - G.AA78G Iris Xe G7 96EUs, i7-1360P, Samsung PM9A1 MZVL21T0HCLR | |
|---|---|---|---|---|---|---|
| Noise | 8% | -21% | -13% | -24% | -12% | |
| off / environment * | 23.3 | 23 1% | 26 -12% | 24 -3% | 24.5 -5% | 25.1 -8% |
| Idle Minimum * | 23.6 | 23 3% | 26 -10% | 24 -2% | 24.5 -4% | 25.1 -6% |
| Idle Average * | 23.6 | 23 3% | 26 -10% | 24 -2% | 26.3 -11% | 25.1 -6% |
| Idle Maximum * | 23.6 | 23 3% | 26 -10% | 27.2 -15% | 26.3 -11% | 26.1 -11% |
| Load Average * | 29.2 | 23 21% | 42.9 -47% | 29 1% | 36.5 -25% | 31.4 -8% |
| Witcher 3 ultra * | 32.1 | 27 16% | 42.9 -34% | 42.1 -31% | 46.3 -44% | 41.1 -28% |
| Load Maximum * | 32.1 | 28.62 11% | 39.1 -22% | 45 -40% | 52.9 -65% | 36.6 -14% |
* ... Moindre est la valeur, meilleures sont les performances
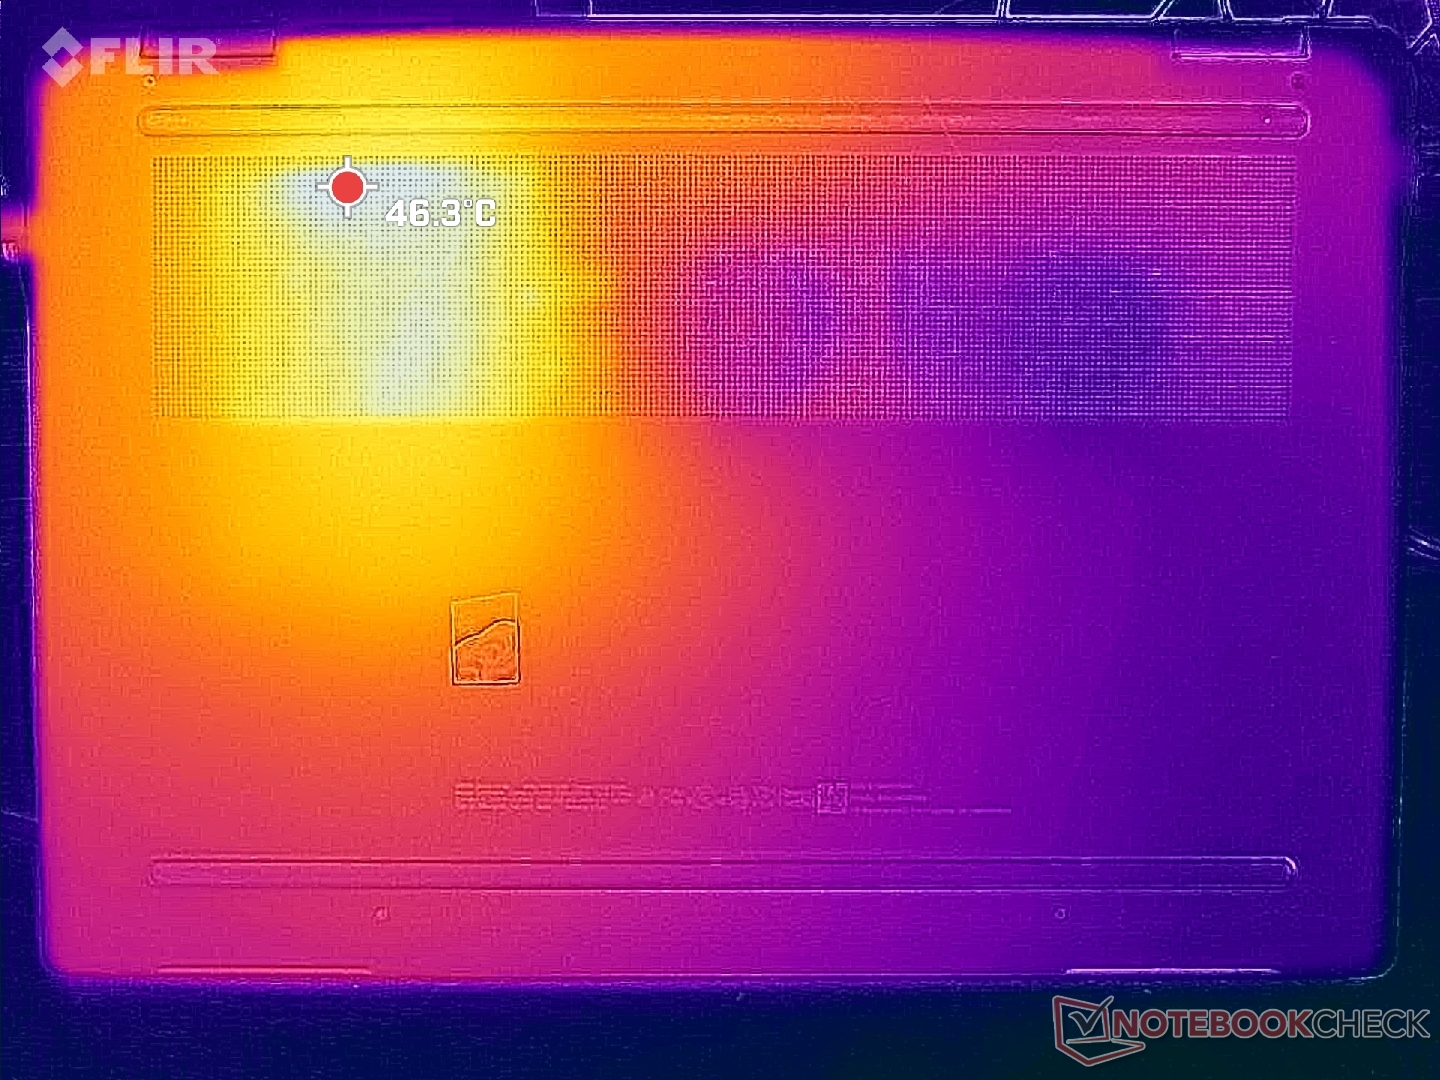
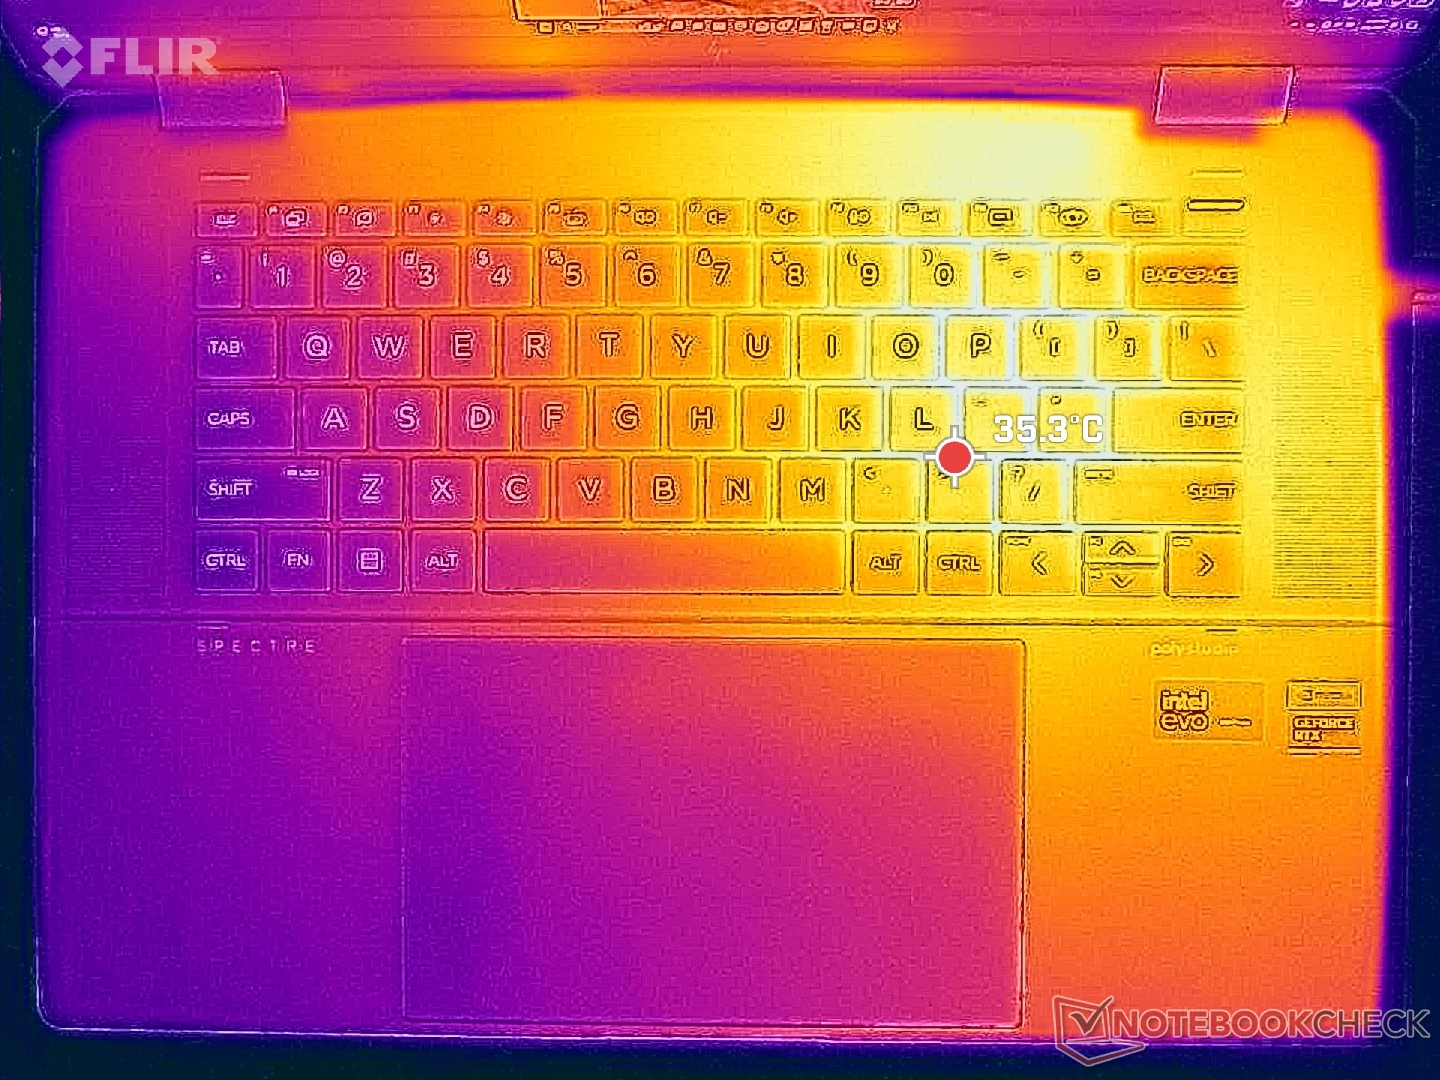
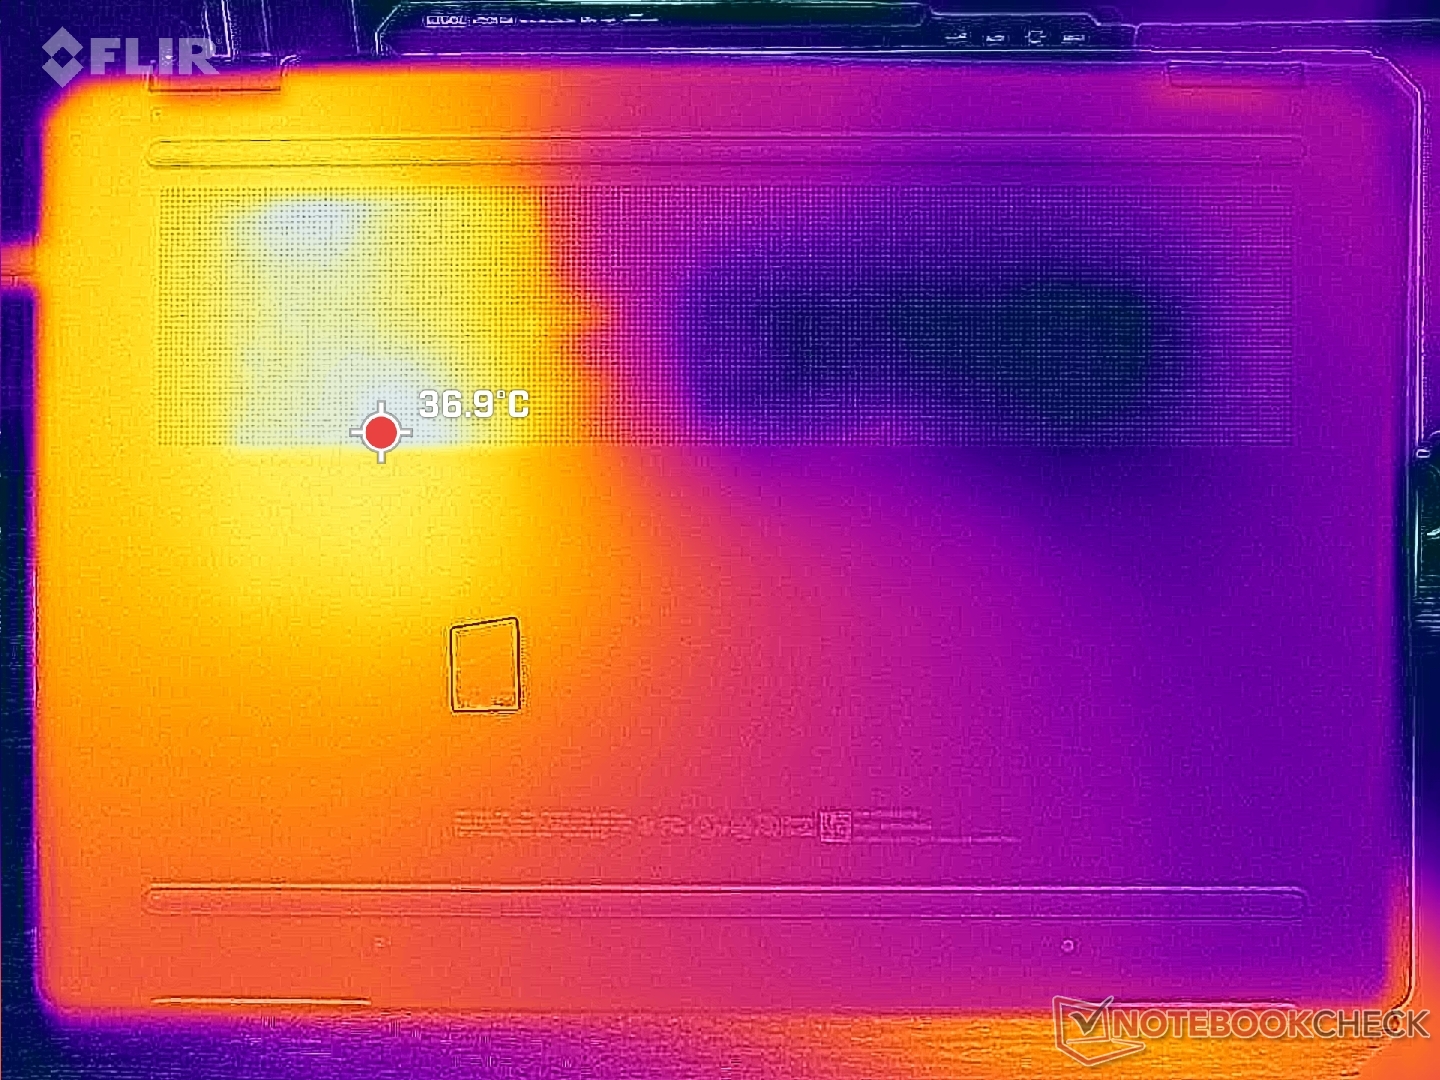
Température
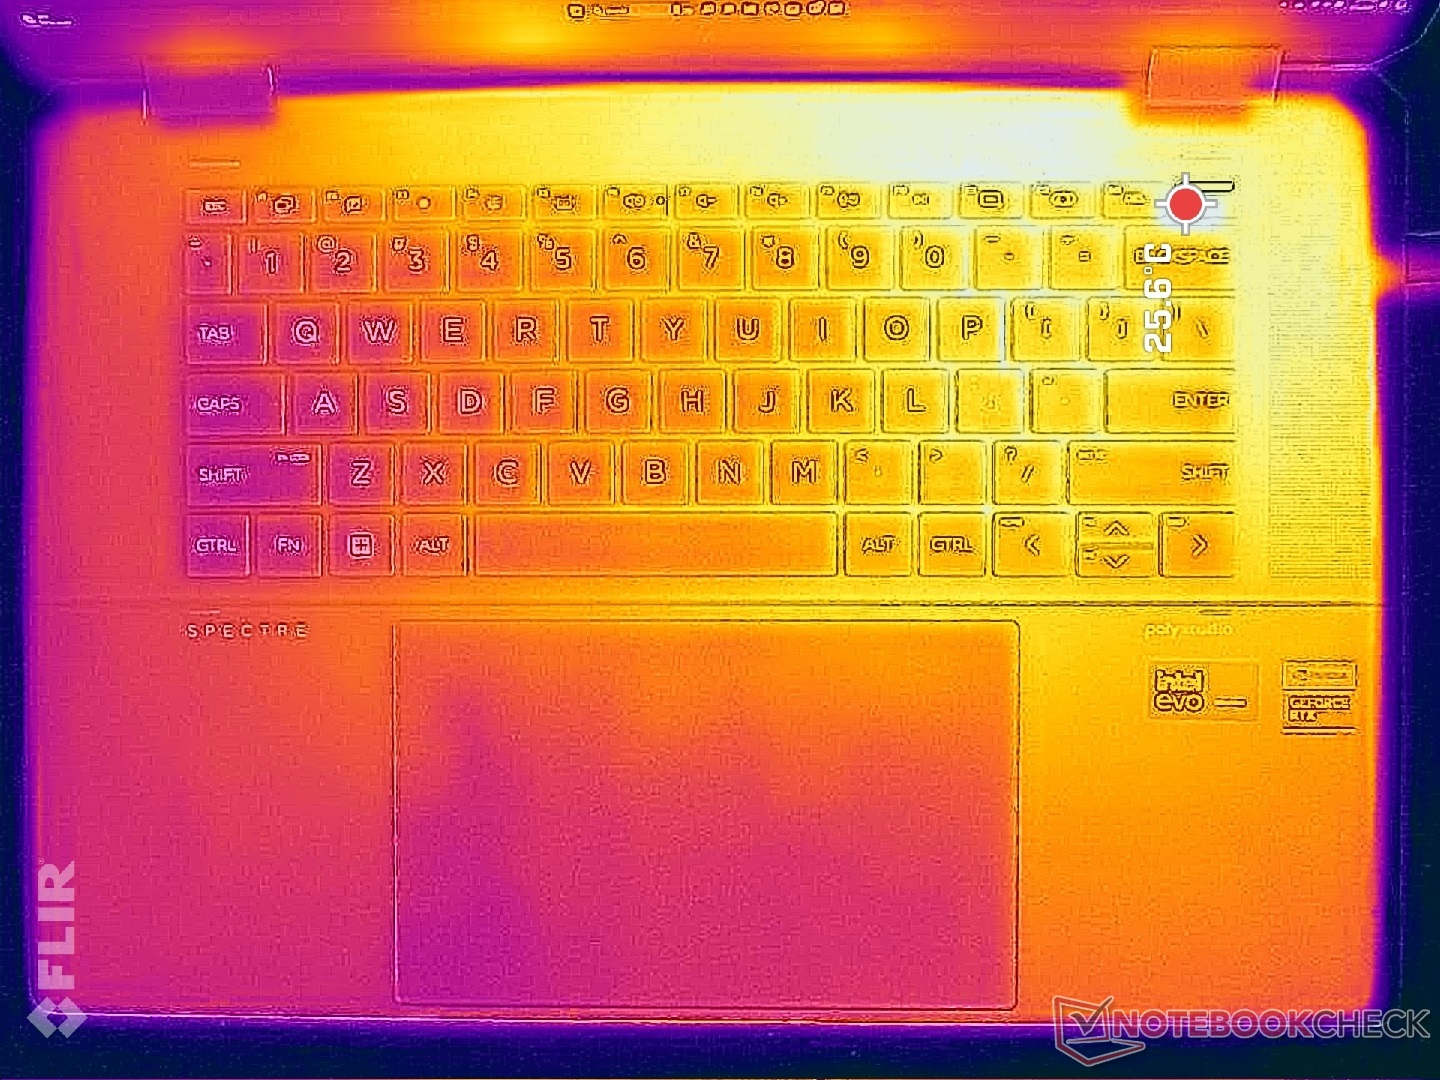
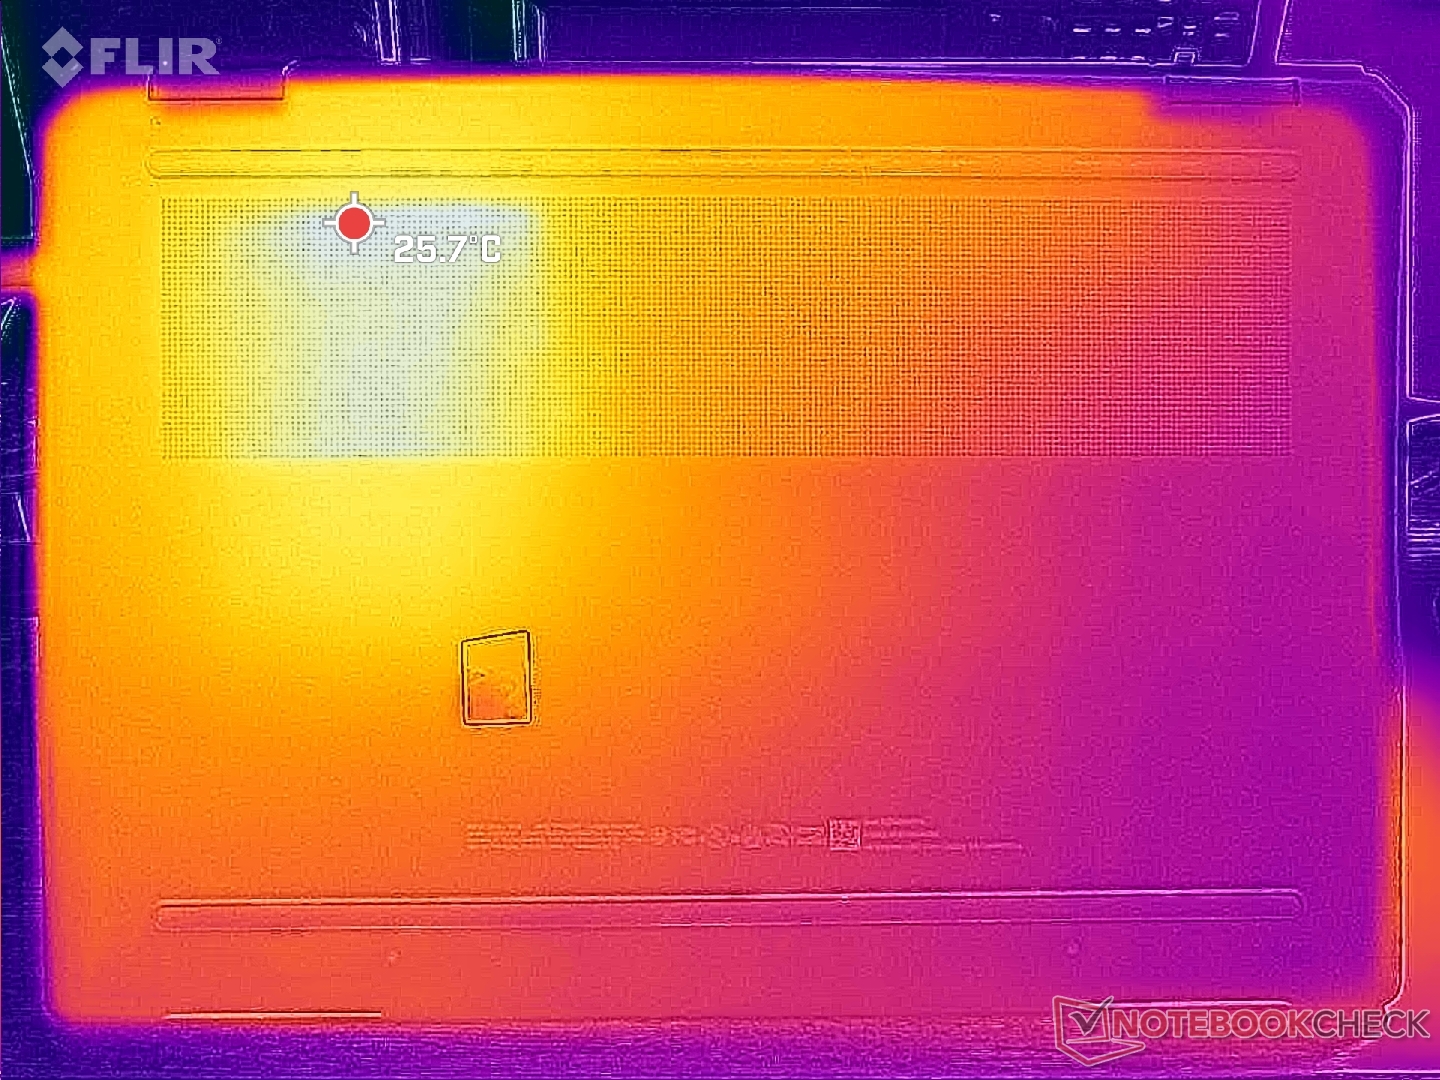
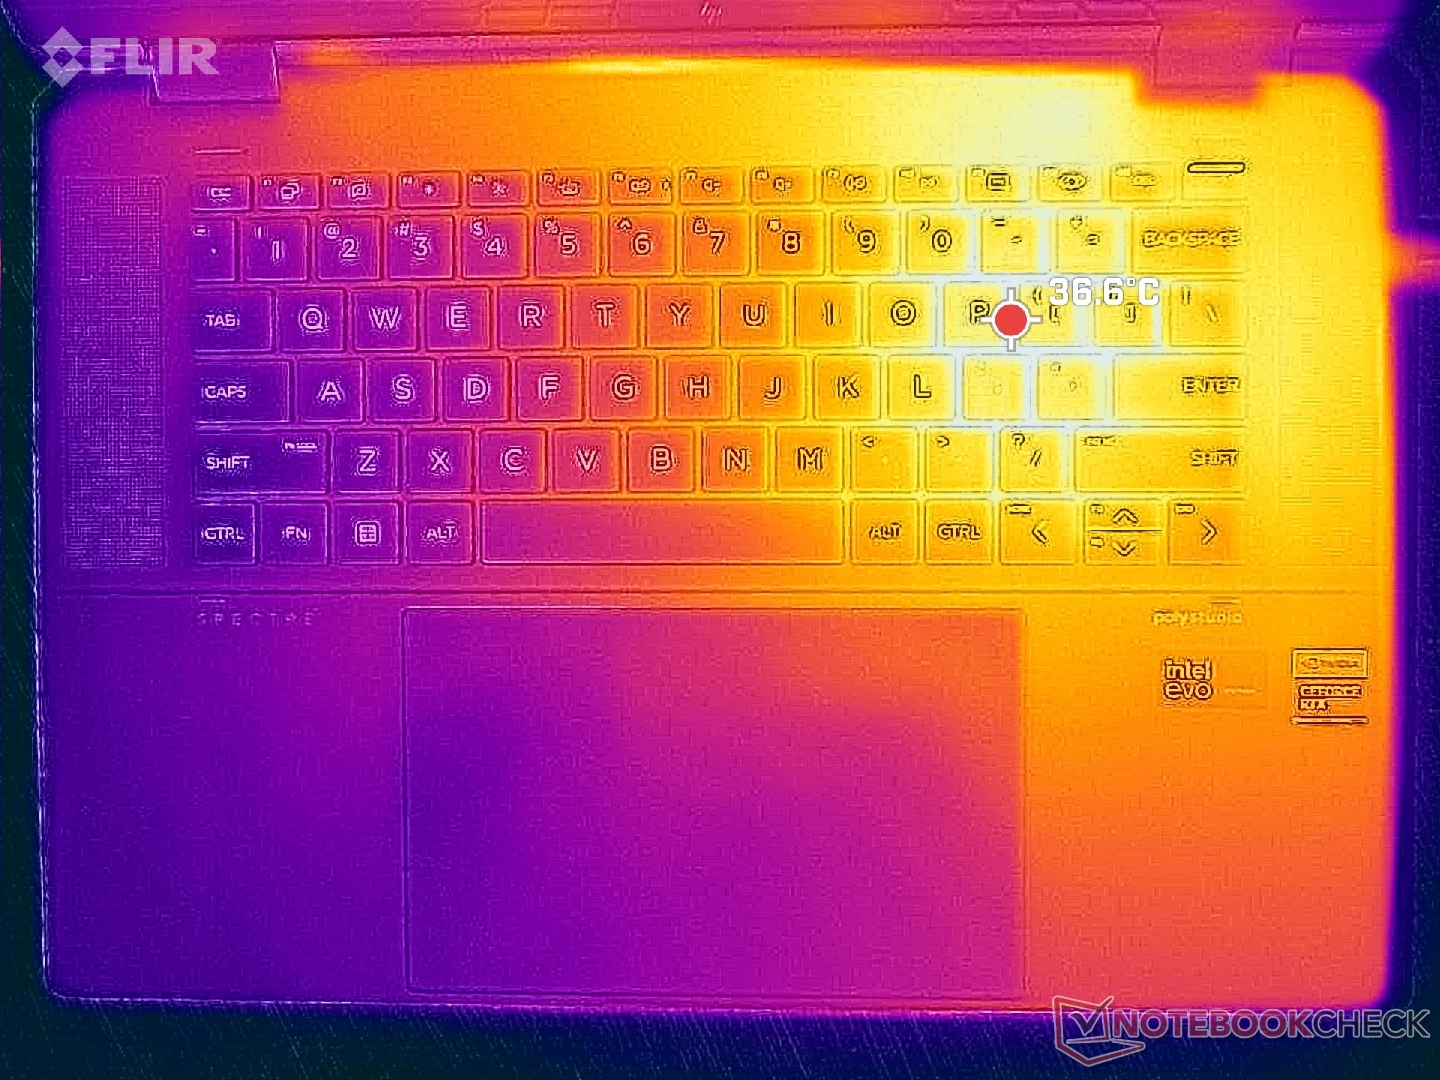
Les températures de surface sont à nouveau beaucoup plus élevées sur la moitié droite de l'ordinateur portable que sur la moitié gauche, comme le montrent les cartes de température ci-dessous, en raison de la conception de la solution de refroidissement. Les points chauds sont, comme on pouvait s'y attendre, plus chauds sur notre version dGPU que sur la version iGPU Witcher 3 atteignent respectivement 40°C et 46°C, contre 35°C et 40°C pour la version iGPU.
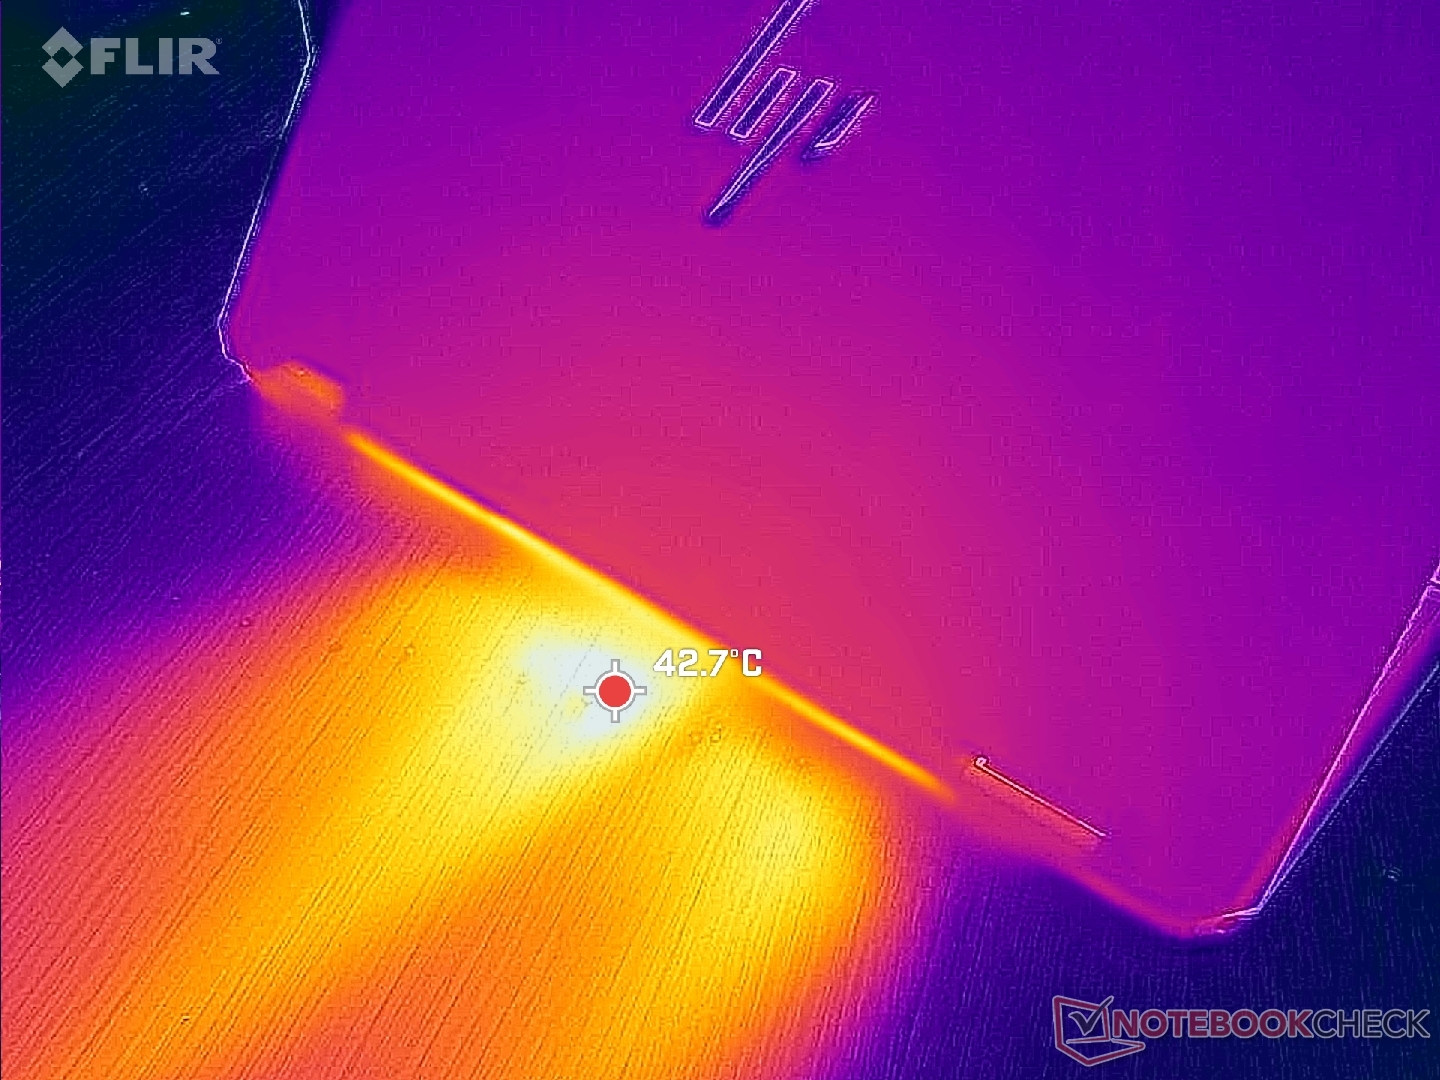
(+) La température maximale du côté supérieur est de 39.6 °C / 103 F, par rapport à la moyenne de 35.3 °C / 96 F, allant de 19.6 à 55.7 °C pour la classe Convertible.
(+) Le fond chauffe jusqu'à un maximum de 39.2 °C / 103 F, contre une moyenne de 36.7 °C / 98 F
(+) En utilisation inactive, la température moyenne du côté supérieur est de 26.1 °C / 79 F, par rapport à la moyenne du dispositif de 30.2 °C / 86 F.
(+) En jouant à The Witcher 3, la température moyenne du côté supérieur est de 31.6 °C / 89 F, alors que la moyenne de l'appareil est de 30.2 °C / 86 F.
(+) Les repose-poignets et le pavé tactile atteignent la température maximale de la peau (32.2 °C / 90 F) et ne sont donc pas chauds.
(-) La température moyenne de la zone de l'appui-paume de dispositifs similaires était de 28.1 °C / 82.6 F (-4.1 °C / #-7.4 F).
| HP Spectre x360 16 RTX 4050 Intel Core Ultra 7 155H, NVIDIA GeForce RTX 4050 Laptop GPU | HP Spectre x360 16-aa0074ng Intel Core Ultra 7 155H, Intel Arc 8-Cores iGPU | HP Spectre x360 2-in-1 16-f1075ng Intel Core i7-12700H, Intel Iris Xe Graphics G7 96EUs | Honor MagicBook Pro 16 2024 Intel Core Ultra 7 155H, NVIDIA GeForce RTX 4060 Laptop GPU | MSI Prestige 16 B1MG-001US Intel Core Ultra 7 155H, Intel Arc 8-Cores iGPU | LG Gram 2in1 16 16T90R - G.AA78G Intel Core i7-1360P, Intel Iris Xe Graphics G7 96EUs | |
|---|---|---|---|---|---|---|
| Heat | -1% | 8% | 9% | -1% | -24% | |
| Maximum Upper Side * | 39.6 | 37 7% | 37.4 6% | 39.7 -0% | 48.8 -23% | 55 -39% |
| Maximum Bottom * | 39.2 | 44 -12% | 39.1 -0% | 42.9 -9% | 47.6 -21% | 55.4 -41% |
| Idle Upper Side * | 29 | 31 -7% | 27.1 7% | 23.7 18% | 24.2 17% | 34.9 -20% |
| Idle Bottom * | 31.6 | 29 8% | 26.3 17% | 23.5 26% | 23.6 25% | 30 5% |
* ... Moindre est la valeur, meilleures sont les performances
Intervenants
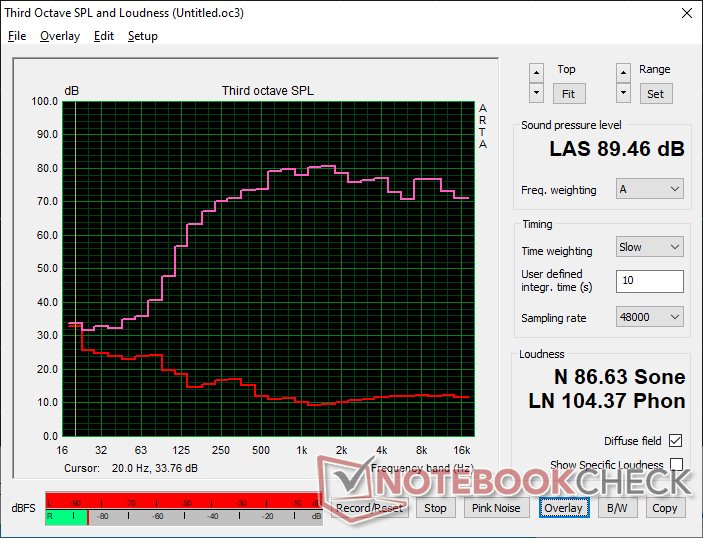
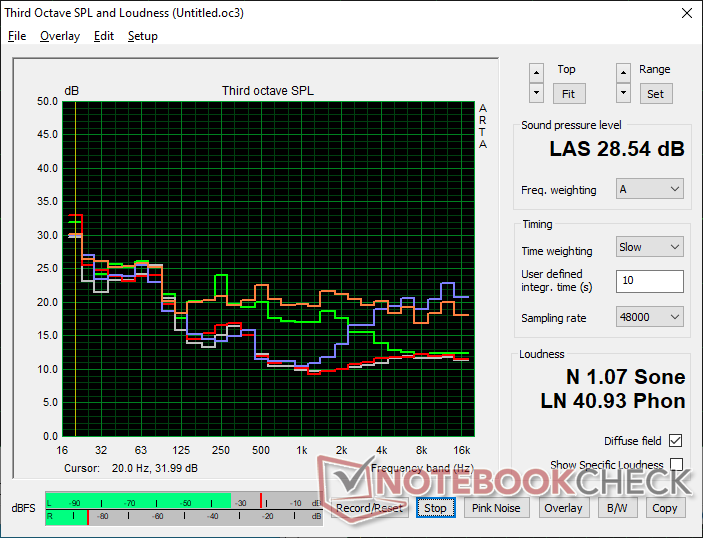
HP Spectre x360 16 RTX 4050 analyse audio
(+) | les haut-parleurs peuvent jouer relativement fort (89.5# dB)
Bass 100 - 315 Hz
(±) | basse réduite - en moyenne 13.2% inférieure à la médiane
(±) | la linéarité des basses est moyenne (7.9% delta à la fréquence précédente)
Mids 400 - 2000 Hz
(+) | médiane équilibrée - seulement 3.2% de la médiane
(+) | les médiums sont linéaires (3% delta à la fréquence précédente)
Aiguës 2 - 16 kHz
(+) | des sommets équilibrés - à seulement 1.6% de la médiane
(+) | les aigus sont linéaires (3.5% delta à la fréquence précédente)
Overall 100 - 16.000 Hz
(+) | le son global est linéaire (9.2% différence à la médiane)
Par rapport à la même classe
» 4% de tous les appareils testés de cette catégorie étaient meilleurs, 1% similaires, 96% pires
» Le meilleur avait un delta de 6%, la moyenne était de 21%, le pire était de 57%.
Par rapport à tous les appareils testés
» 2% de tous les appareils testés étaient meilleurs, 1% similaires, 97% pires
» Le meilleur avait un delta de 4%, la moyenne était de 25%, le pire était de 134%.
Apple MacBook Pro 16 2021 M1 Pro analyse audio
(+) | les haut-parleurs peuvent jouer relativement fort (84.7# dB)
Bass 100 - 315 Hz
(+) | bonne basse - seulement 3.8% loin de la médiane
(+) | les basses sont linéaires (5.2% delta à la fréquence précédente)
Mids 400 - 2000 Hz
(+) | médiane équilibrée - seulement 1.3% de la médiane
(+) | les médiums sont linéaires (2.1% delta à la fréquence précédente)
Aiguës 2 - 16 kHz
(+) | des sommets équilibrés - à seulement 1.9% de la médiane
(+) | les aigus sont linéaires (2.7% delta à la fréquence précédente)
Overall 100 - 16.000 Hz
(+) | le son global est linéaire (4.6% différence à la médiane)
Par rapport à la même classe
» 0% de tous les appareils testés de cette catégorie étaient meilleurs, 0% similaires, 100% pires
» Le meilleur avait un delta de 5%, la moyenne était de 18%, le pire était de 45%.
Par rapport à tous les appareils testés
» 0% de tous les appareils testés étaient meilleurs, 0% similaires, 100% pires
» Le meilleur avait un delta de 4%, la moyenne était de 25%, le pire était de 134%.
Gestion de l'énergie
Consommation électrique
L'exécution Witcher 3 en mode Performance demande environ 93 W, soit près de 2 fois plus que la configuration iGPU. Les taux de rafraîchissement avec le GPU Nvidia sont 2 à 3 fois plus rapides et la consommation d'énergie plus élevée en vaut la peine du point de vue de la performance par watt.
En répétant le test ci-dessus en mode équilibré au lieu du mode performance, la consommation serait ramenée à 75 W. Les économies d'énergie correspondent à nos observations sur le TGP dans la section Test de stress ci-dessus. Si vous souhaitez tirer le meilleur parti de votre système, assurez-vous d'activer le mode Performance via MyHP.
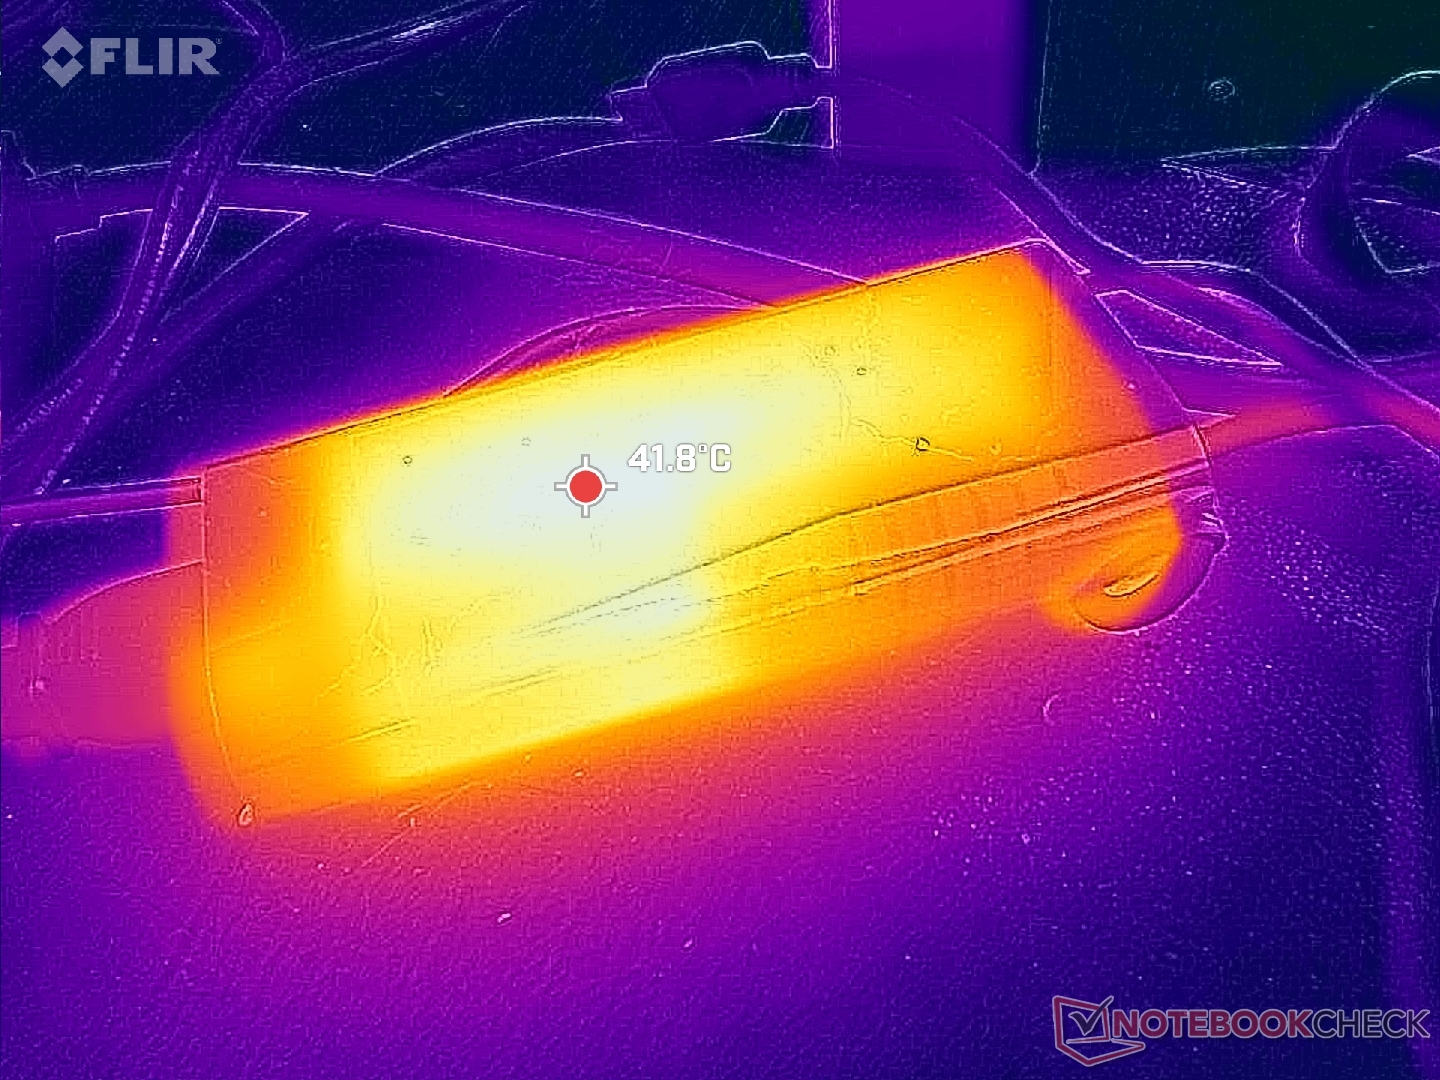
Nous sommes en mesure d'enregistrer une consommation maximale temporaire de 121 W à partir de l'adaptateur secteur USB-C 140 W de petite-moyenne taille (~13,8 x 6,5 x 2,9 cm) lorsque le CPU et le GPU sont chacun à 100 % d'utilisation. Le taux de charge n'est pas affecté de manière significative, car l'étranglement des performances intervient très rapidement, comme mentionné ci-dessus, pour ramener la consommation à 70 W. Notez que la configuration iGPU est livrée avec un adaptateur USB-C plus petit de 100 W à la place.
(Note de la rédaction: cette section sera mise à jour lorsque les réparations de notre multimètre Metrahit Energy seront terminées. Nous vous prions de nous excuser pour la gêne occasionnée)
| HP Spectre x360 16 RTX 4050 Ultra 7 155H, NVIDIA GeForce RTX 4050 Laptop GPU, SK hynix PC801 HFS001TEJ9X101N, OLED, 2880x1800, 16.00 | HP Spectre x360 16-aa0074ng Ultra 7 155H, Arc 8-Cores, Kioxia XG8 KXG80ZNV1T02, OLED, 2880x1800, 16.00 | HP Spectre x360 2-in-1 16-f1075ng i7-12700H, Iris Xe G7 96EUs, SK Hynix PC711 1TB HFS001TDE9X073N, IPS, 3072x1920, 16.00 | Honor MagicBook Pro 16 2024 Ultra 7 155H, NVIDIA GeForce RTX 4060 Laptop GPU, WD PC SN740 SDDPNQD-1T00, IPS, 3072x1920, 16.00 | MSI Prestige 16 B1MG-001US Ultra 7 155H, Arc 8-Cores, Samsung PM9A1 MZVL22T0HBLB, IPS, 2560x1600, 16.00 | LG Gram 2in1 16 16T90R - G.AA78G i7-1360P, Iris Xe G7 96EUs, Samsung PM9A1 MZVL21T0HCLR, IPS, 2560x1600, 16.00 | |
|---|---|---|---|---|---|---|
| Power Consumption | ||||||
| Idle Minimum * | 4.1 | 9 | 5.2 | 3 | 5.5 | |
| Idle Average * | 4.5 | 11.1 | 14.4 | 9.5 | 7.2 | |
| Idle Maximum * | 5.9 | 16.4 | 15.4 | 12 | 12.9 | |
| Load Average * | 51.2 | 38.3 | 105.4 | 68.3 | 55 | |
| Witcher 3 ultra * | 47.6 | 34.4 | 107.6 | 59.8 | 47 | |
| Load Maximum * | 90.4 | 82.5 | 195.2 | 104.8 | 63.6 |
* ... Moindre est la valeur, meilleures sont les performances
Power Consumption Witcher 3 / Stresstest
Power Consumption external Monitor
Autonomie de la batterie
La durée de vie de la batterie est, comme on pouvait s'y attendre, plus courte que sur la configuration iGPU, mais la différence est étonnamment mineure. Nous sommes parvenus à obtenir 11 heures de navigation réelle avec le profil équilibré, soit à peine une heure de moins qu'avec l'unité iGPU. En optant pour la configuration IPS, vous augmenterez probablement la durée d'utilisation.
| HP Spectre x360 16 RTX 4050 Ultra 7 155H, NVIDIA GeForce RTX 4050 Laptop GPU, 83 Wh | HP Spectre x360 16-aa0074ng Ultra 7 155H, Arc 8-Cores, 83 Wh | HP Spectre x360 2-in-1 16-f1075ng i7-12700H, Iris Xe G7 96EUs, 83 Wh | Honor MagicBook Pro 16 2024 Ultra 7 155H, NVIDIA GeForce RTX 4060 Laptop GPU, 75 Wh | MSI Prestige 16 B1MG-001US Ultra 7 155H, Arc 8-Cores, 99.9 Wh | LG Gram 2in1 16 16T90R - G.AA78G i7-1360P, Iris Xe G7 96EUs, 80 Wh | |
|---|---|---|---|---|---|---|
| Autonomie de la batterie | 9% | -5% | 11% | 67% | 8% | |
| WiFi v1.3 | 660 | 717 9% | 630 -5% | 734 11% | 1100 67% | 716 8% |
| H.264 | 862 | 671 | 784 | |||
| Load | 139 | 95 | 58 | 166 | 121 | |
| Reader / Idle | 1233 | 1506 |
Points positifs
Points négatifs
Verdict - Polyvalence au détriment de la performance
Le HP Spectre x360 16 est l'un des ordinateurs portables convertibles de 16 pouces les plus silencieux et les plus portables du marché, doté d'une carte graphique discrète GeForce RTX 4050. Ce système a été conçu pour les utilisateurs intensifs en déplacement qui peuvent également exploiter le facteur de forme 2-en-1 et les couleurs profondes P3 de l'écran tactile OLED. De ce point de vue, le modèle est une réussite.
La finesse du design a nécessité des compromis en termes de performances. En particulier, le GPU RTX 4050 de 55 W est nettement plus lent que la plupart des autres ordinateurs portables dotés de la même option graphique. Le Spectre x360 16 est toujours rapide pour sa taille, bien sûr, mais son GPU GeForce est définitivement dans le bas du spectre en raison de sa cible TGP basse. Les utilisateurs qui souhaitent maximiser les performances ou qui ne trouvent pas le format 2-en-1 utile peuvent considérer le MSI Prestige 16 ou le Honor MagicBook Pro 16 qui peuvent être configurés avec des cartes graphiques RTX plus haut de gamme que le HP tout en conservant une philosophie de conception mince et légère similaire.
Le Spectre x360 16 est un ordinateur convertible 16 pouces haut de gamme et bien construit. Les performances sont généralement excellentes, mais il existe certainement des alternatives plus rapides si vous êtes prêt à renoncer au design 2-en-1.
Nous devons également mentionner les performances plus lentes que prévu du processeur de la configuration dGPU au moment de la rédaction de cet article. HP indique qu'un correctif est en cours d'élaboration et nous mettrons à jour la section CPU lorsque le correctif sera mis en ligne. Sinon, le GPU semble fonctionner correctement.
Prix et disponibilité
HP livre maintenant le Spectre x360 16 2-en-1 avec GeForce RTX 4050 graphics à partir de 1440 $ avec l'écran tactile IPS ou 1600 $ avec l'écran tactile OLED tel qu'il a été testé.
HP Spectre x360 16 RTX 4050
-
03/13/2024 v7
Allen Ngo
Transparency
The present review sample was made available to the author as a loan by the manufacturer or a shop for the purposes of review. The lender had no influence on this review, nor did the manufacturer receive a copy of this review before publication. There was no obligation to publish this review.
Pricecompare

