Verdict - Le XPS renaît
Tout comme le nouveau XPS 14, le XPS 16 2026 répond à certaines des principales préoccupations du modèle 2025 pour une meilleure expérience utilisateur. Le système est désormais beaucoup plus léger et plus facile à transporter, avec une esthétique visuelle plus épurée et l'absence de touches tactiles frustrantes. Le passage à Panther Lake a également permis d'améliorer de manière significative les performances par watt pour augmenter les durées d'utilisation de plusieurs heures au minimum.
L'une des principales raisons de la conception plus mince, plus silencieuse et plus compacte de cette année peut être attribuée à un changement majeur : l'absence d'options graphiques discrètes. L'absence de dGPU permet au système de s'affranchir de circuits imprimés plus petits, d'une solution de refroidissement plus petite et d'un profil plus fin pour un modèle globalement plus léger. Les utilisateurs devront sacrifier les performances graphiques, car le GPU intégré de Panther Lake, aussi efficace soit-il, ne peut rivaliser avec la puissance brute d'une RTX 5070 de GeForce sur le Dell 16 Premium sortant. Les GPU externes peuvent contourner cette limitation, mais les créateurs de contenu ou les joueurs exigeant plus de performances graphiques en déplacement peuvent trouver un meilleur rapport qualité-prix dans le modèle 2025.
Le design plus fin et plus ciblé du nouveau XPS 16 peut parfois donner l'impression d'être dépouillé par rapport à certains concurrents. Des alternatives comme le Samsung Galaxy Book6 Ultra ou l'Asus Zenbook S16 Asus Zenbook S16 disposent de ports plus intégrés ou même de la prise en charge de disques SSD M.2 secondaires afin de réduire la dépendance aux adaptateurs ou aux stations d'accueil.
Points positifs
Points négatifs
Prix et disponibilité
Dell livre maintenant le XPS 16 à partir de 1750 $ pour la configuration Core Ultra 5 325 telle que revue, jusqu'à 2160 $ pour la configuration Core Ultra X7 358H OLED à écran tactile.
Table des matières
- Verdict - Le XPS renaît
- Spécifications
- Cas - Beaucoup plus léger qu'avant
- Connectivité
- Périphériques d'entrée - Dites adieu aux touches tactiles
- Écran - L'un des meilleurs écrans FHD+ IPS
- Performance - Tout miser sur le lac Panther
- Émissions - Plus silencieuses, mais encore assez chaudes
- Gestion de l'énergie - Panther Lake est le roi de l'efficacité
- Notebookcheck Rating
- Comparaison avec des concurrents potentiels
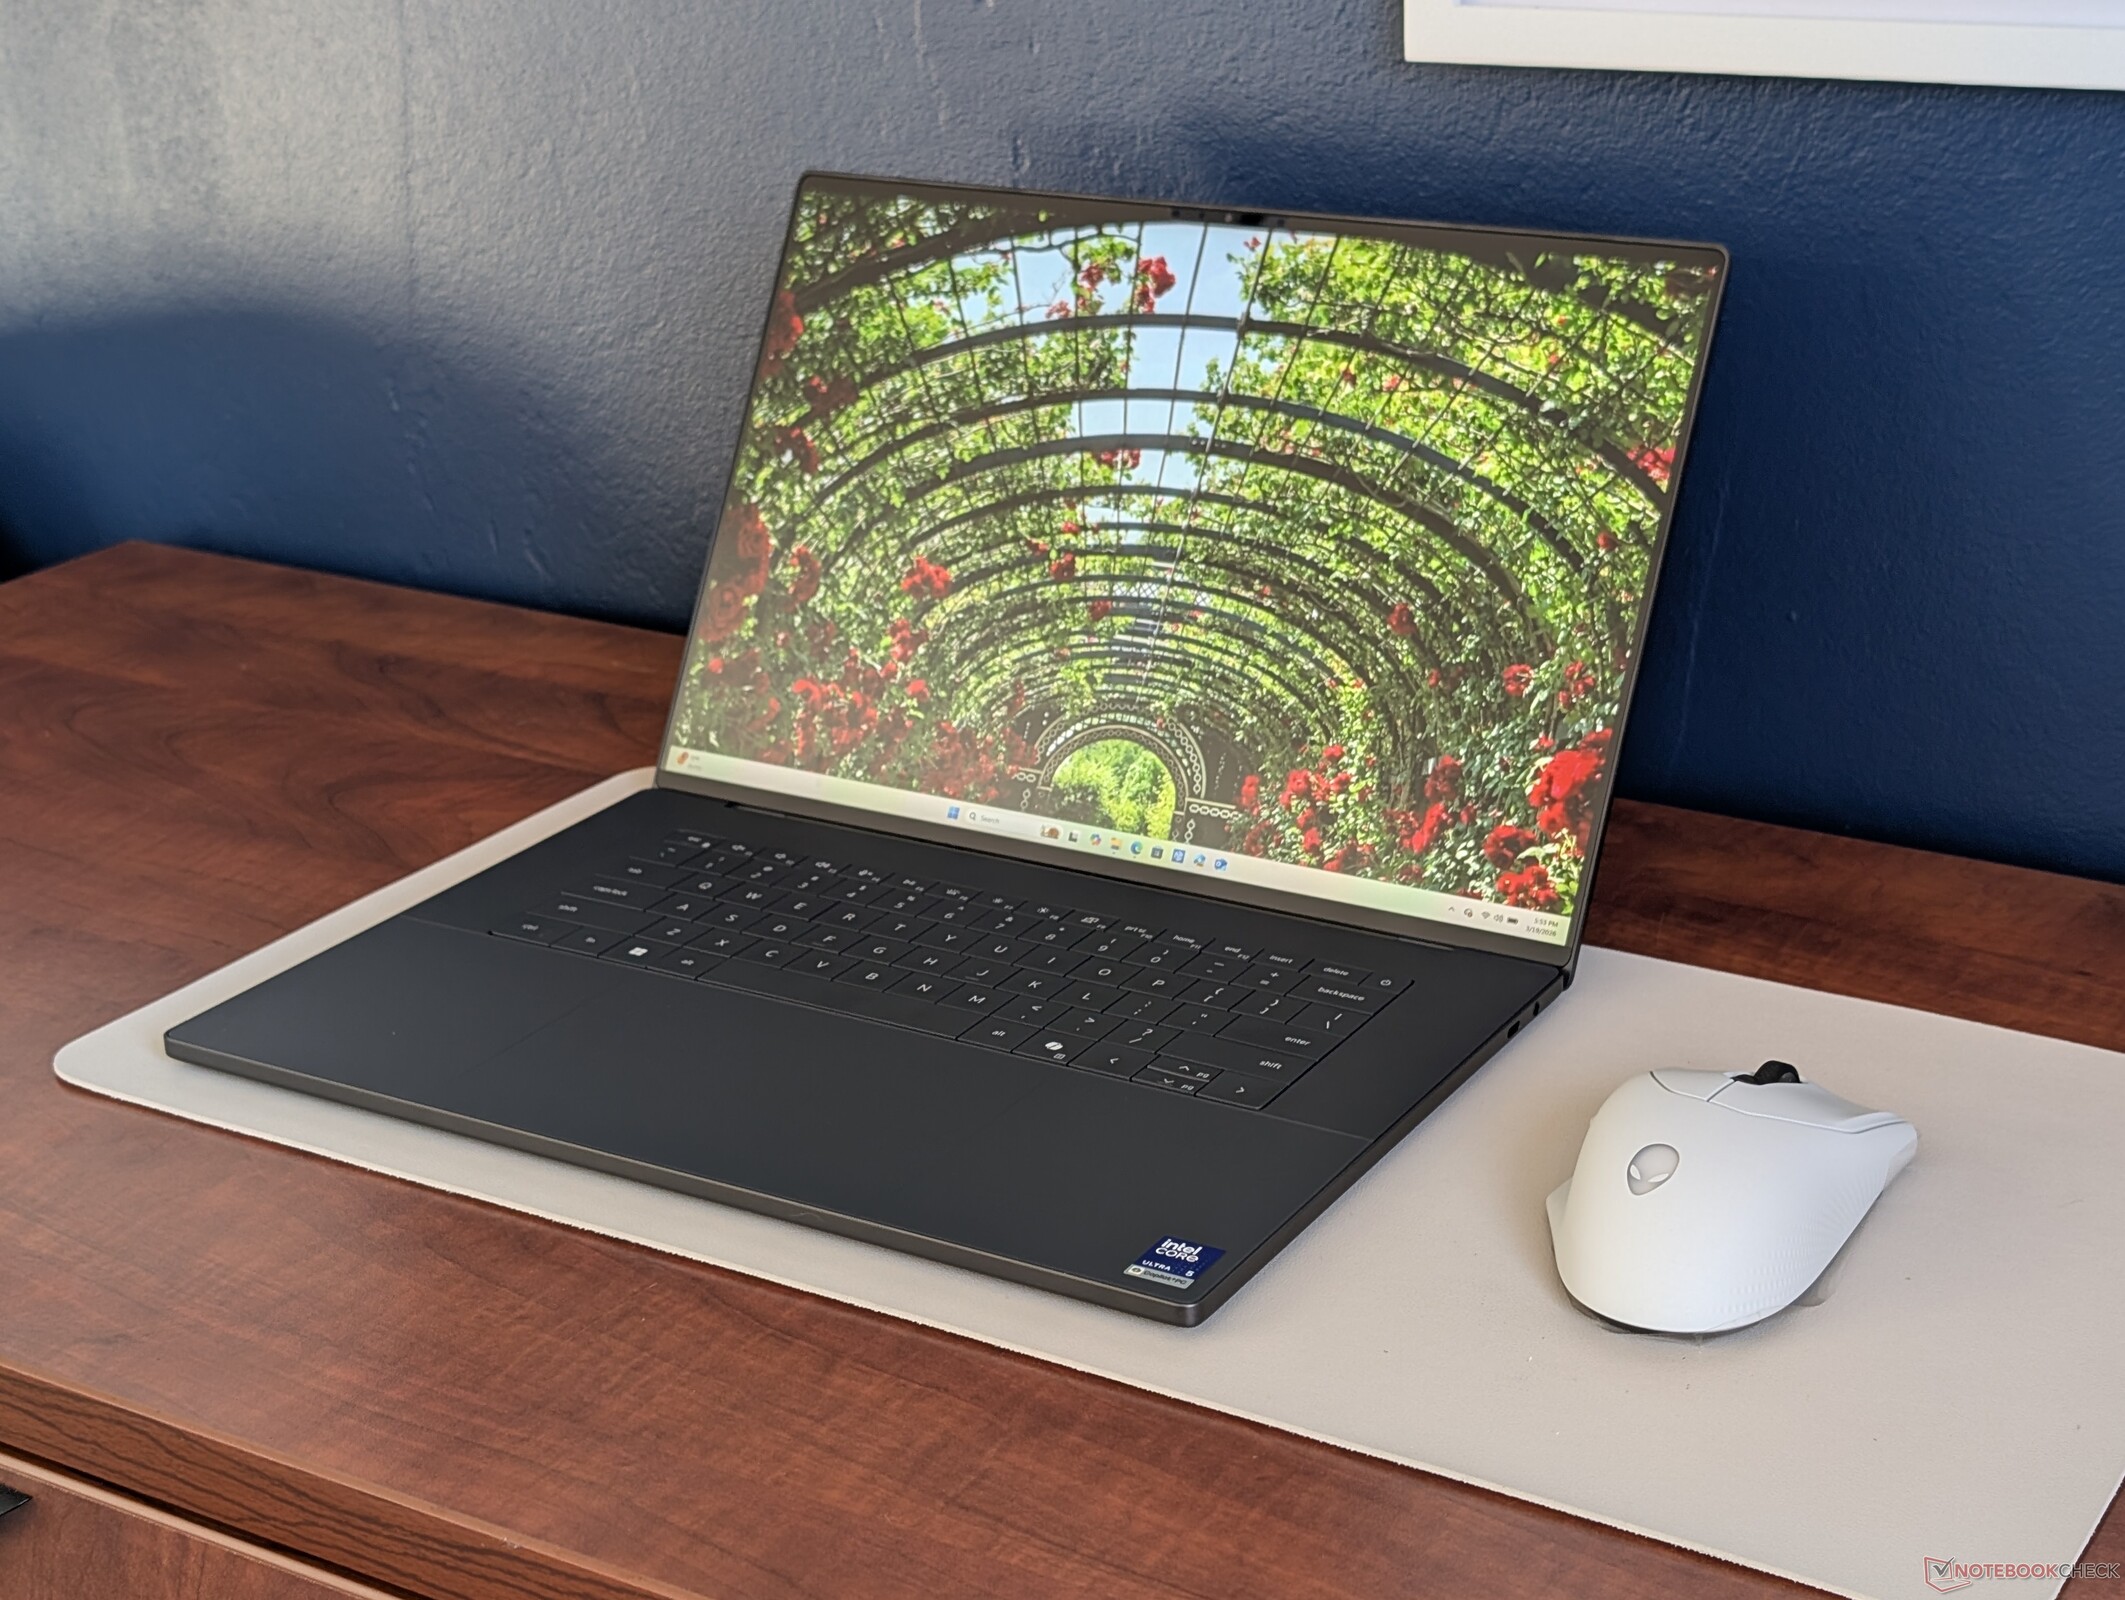
Dévoilé au CES 2026 aux côtés du nouveau XPS 14, le XPS 16 2026 est un renouveau pour la série après avoir abandonné la marque "XPS" l'année dernière en faveur de la marque "Dell 16 Premium". Le nouveau modèle propose non seulement les dernières options du processeur Intel Panther Lake, mais aussi un châssis mis à jour pour une expérience utilisateur renouvelée par rapport aux années précédentes.
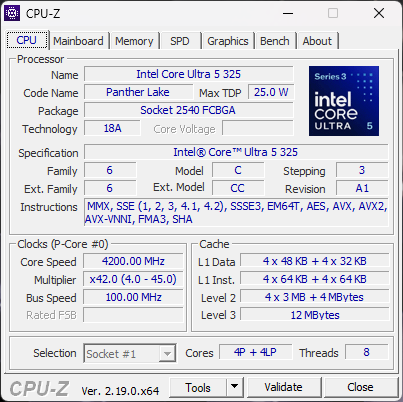
Notre unité de test est la configuration de base avec le CPU Core Ultra 5 325 et l'écran IPS FHD+ 120 Hz pour environ 1700 $. Les configurations plus haut de gamme comprennent le Core Ultra 7 355, le Core Ultra X7 358H et l'écran tactile OLED 120 Hz pour près de 2200 $. Au moment de la publication, toutes les options sont livrées avec des cartes graphiques intégrées.
Parmi les alternatives au Dell XPS 16 figurent d'autres appareils multimédias haut de gamme de 16 pouces, tels que le Samsung Galaxy Book6 Ultra, L'Asus Zenbook S16ou le Lenovo Yoga Pro 9 16.
Plus d'avis sur Dell :
Spécifications
Cas - Beaucoup plus léger qu'avant
Le châssis redessiné ne ressemble guère au modèle Dell 16 Premium ou au modèle Dell 2024 XPS 16 Premium 2024 XPS 16. Il est néanmoins composé des mêmes matériaux que le 2026 XPS 14 et nos impressions sur le XPS 14 sont donc très bonnes impressions sur le XPS 14 sur le XPS 14 se retrouvent sur le nouveau XPS 16. La rigidité est tout aussi bonne qu'auparavant, mais les bords et les angles sont plus arrondis et imitent mieux le style visuel du MacBook Pro 16.
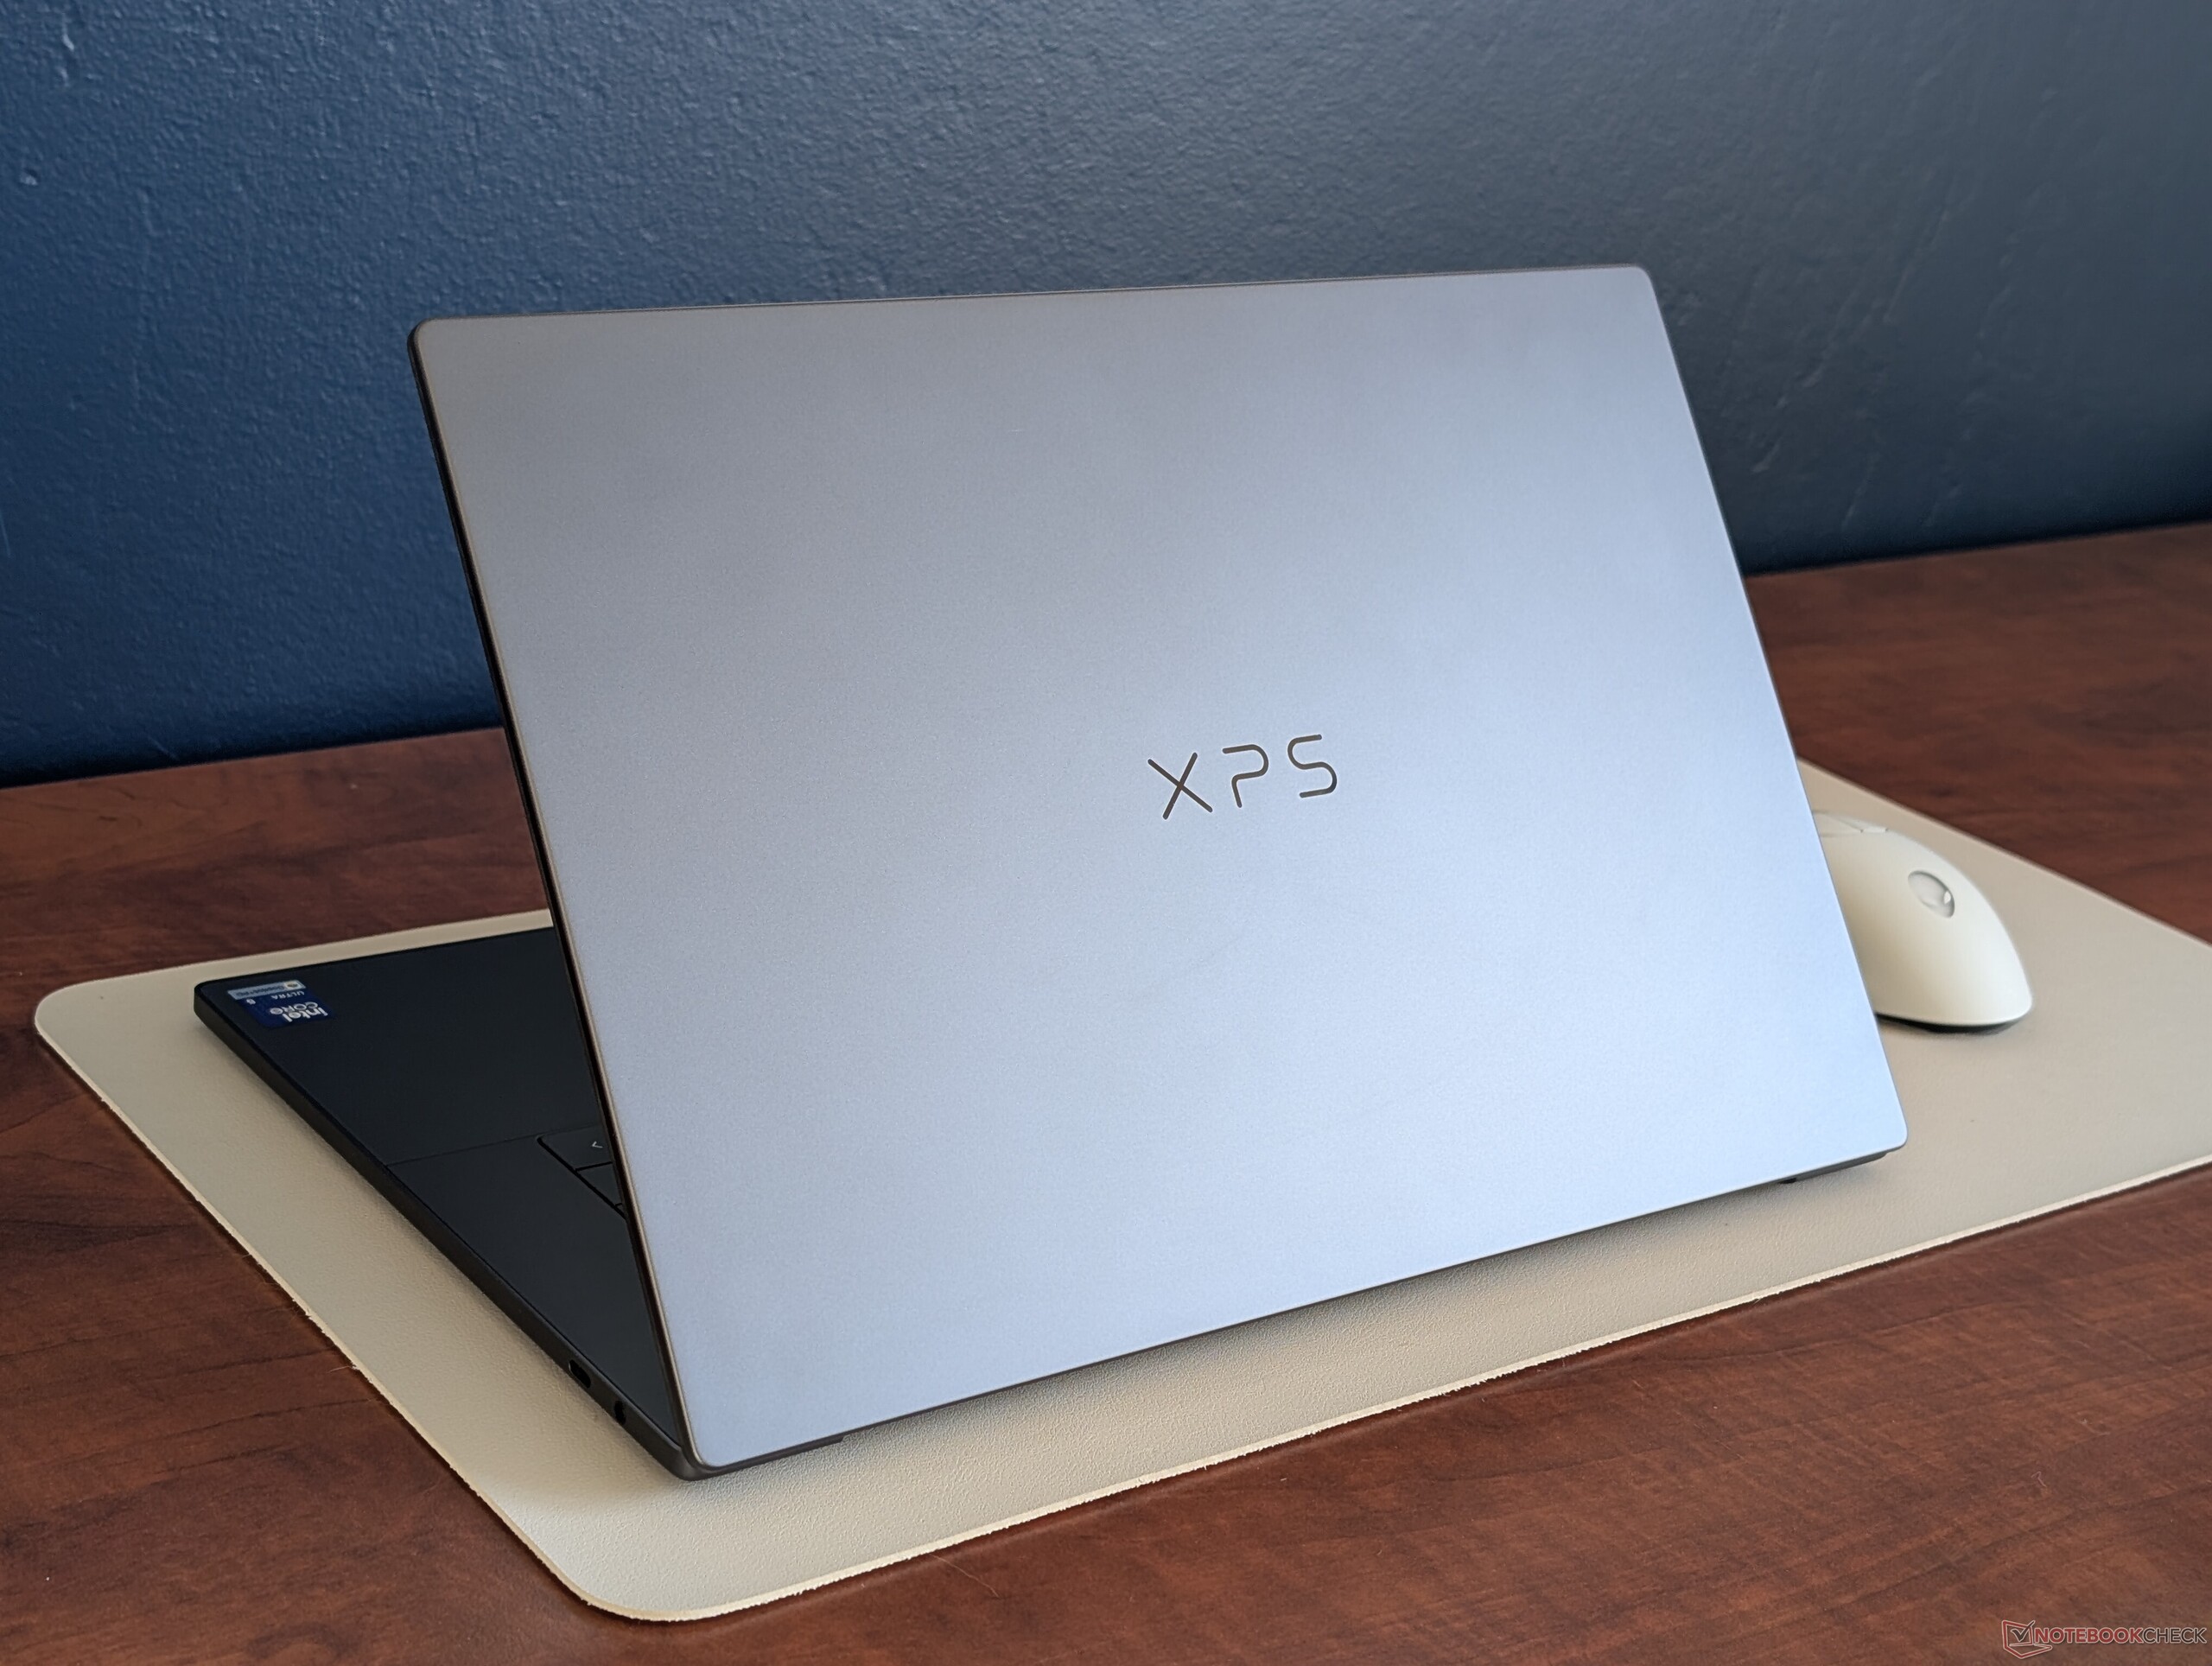
Les différences de taille et de poids entre le nouveau XPS 16 et l'ancien XPS 16 (ou Dell 16 Premium) sont significatives. Le nouveau modèle est nettement plus petit en longueur, en largeur et en hauteur, tout en étant beaucoup plus léger d'environ 600 grammes. Ces changements ont été rendus possibles en grande partie par l'abandon des options graphiques discrètes et du refroidissement par chambre à vapeur lors de la transition vers le nouveau design du XPS 16. La taille de l'écran a également été légèrement réduite, passant de 16,3 à 16,0 pouces.


Connectivité
Les trois ports USB-C prennent désormais en charge Thunderbolt 4 alors que ce n'était pas le cas sur le modèle de l'année dernière. Malheureusement, Dell a abandonné l'emplacement pour carte MicroSD, au grand dam des propriétaires de reflex numériques.
Des modèles concurrents comme l Asus Zenbook S16 ou le Lenovo Yoga Pro 9 16IAH10 ont tendance à avoir plus de ports et d'options intégrés que le Dell.


Communication

Webcam
L'appareil photo est passé de 2 MP sur le Dell 16 Premium à 8 MP sur le nouveau XPS 16. Bien que l'infrarouge soit pris en charge, il n'y a toujours pas d'obturateur physique pour l'appareil photo.


Maintenance
Les procédures d'entretien sont complètement différentes de celles du XPS 16 de l'année dernière, mais sont pratiquement identiques à celles du nouveau XPS 14 détaillée ici. Au lieu de retirer le panneau inférieur, les utilisateurs doivent retirer avec précaution le plateau du clavier pour accéder à la carte mère, ce qui rend le processus un peu plus complexe.
Les options de mise à jour sont malheureusement très limitées. Le modèle ne supporte qu'un seul SSD M.2 et aucun autre composant évolutif malgré son format 16 pouces.

Durabilité
Dell revendique 75 % d'aluminium recyclé pour les capots supérieur et inférieur, 50 % de cobalt recyclé pour la batterie, 90 % d'acier recyclé pour les touches, 100 % de cuivre recyclé pour le circuit imprimé de la batterie et 10 % de verre recyclé pour la configuration OLED. L'emballage est entièrement recyclable et sans plastique.
Accessoires et garantie
La boîte ne contient pas d'autres éléments que l'adaptateur secteur et la documentation. La garantie limitée habituelle d'un an du fabricant s'applique si l'appareil est acheté aux États-Unis, avec des options d'extension allant jusqu'à quatre ans.
Périphériques d'entrée - Dites adieu aux touches tactiles
Clavier
Dell a (heureusement) abandonné les touches tactiles controversées du modèle de l'année dernière pour une approche plus traditionnelle. En fait, la taille des touches et le retour d'information sont identiques à ceux du nouveau XPS 14 pour une expérience de frappe identique malgré le format plus grand de notre XPS 16.
Pavé tactile
Contrairement au clavier, le pavé tactile tire parti du format 16 pouces, car sa surface est légèrement plus grande que celle du pavé tactile du XPS 14 (~15,2 x 9 cm contre ~15,2 x 7,5 cm). La traction est ultra-fluide, mais les actions multi-touch ou le glisser-déposer sont encore difficiles à réaliser en raison de la faible profondeur du retour d'information. On peut dire que le pavé tactile "invisible" privilégie encore la forme à la fonction.


Écran - L'un des meilleurs écrans FHD+ IPS
Deux options d'affichage sont disponibles :
- 1920 x 1200, 100% sRGB, IPS, non tactile, 1 - 120 Hz, mat
- 3200 x 2000, 100% DCI-P3, OLED, écran tactile, 20 - 120 Hz, DisplayHDR 500, brillant
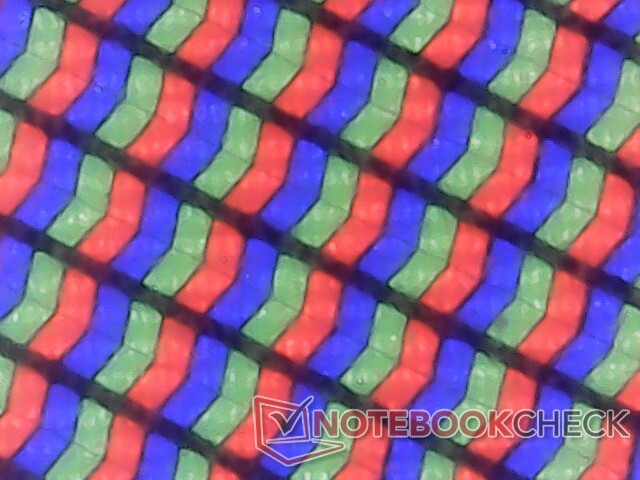
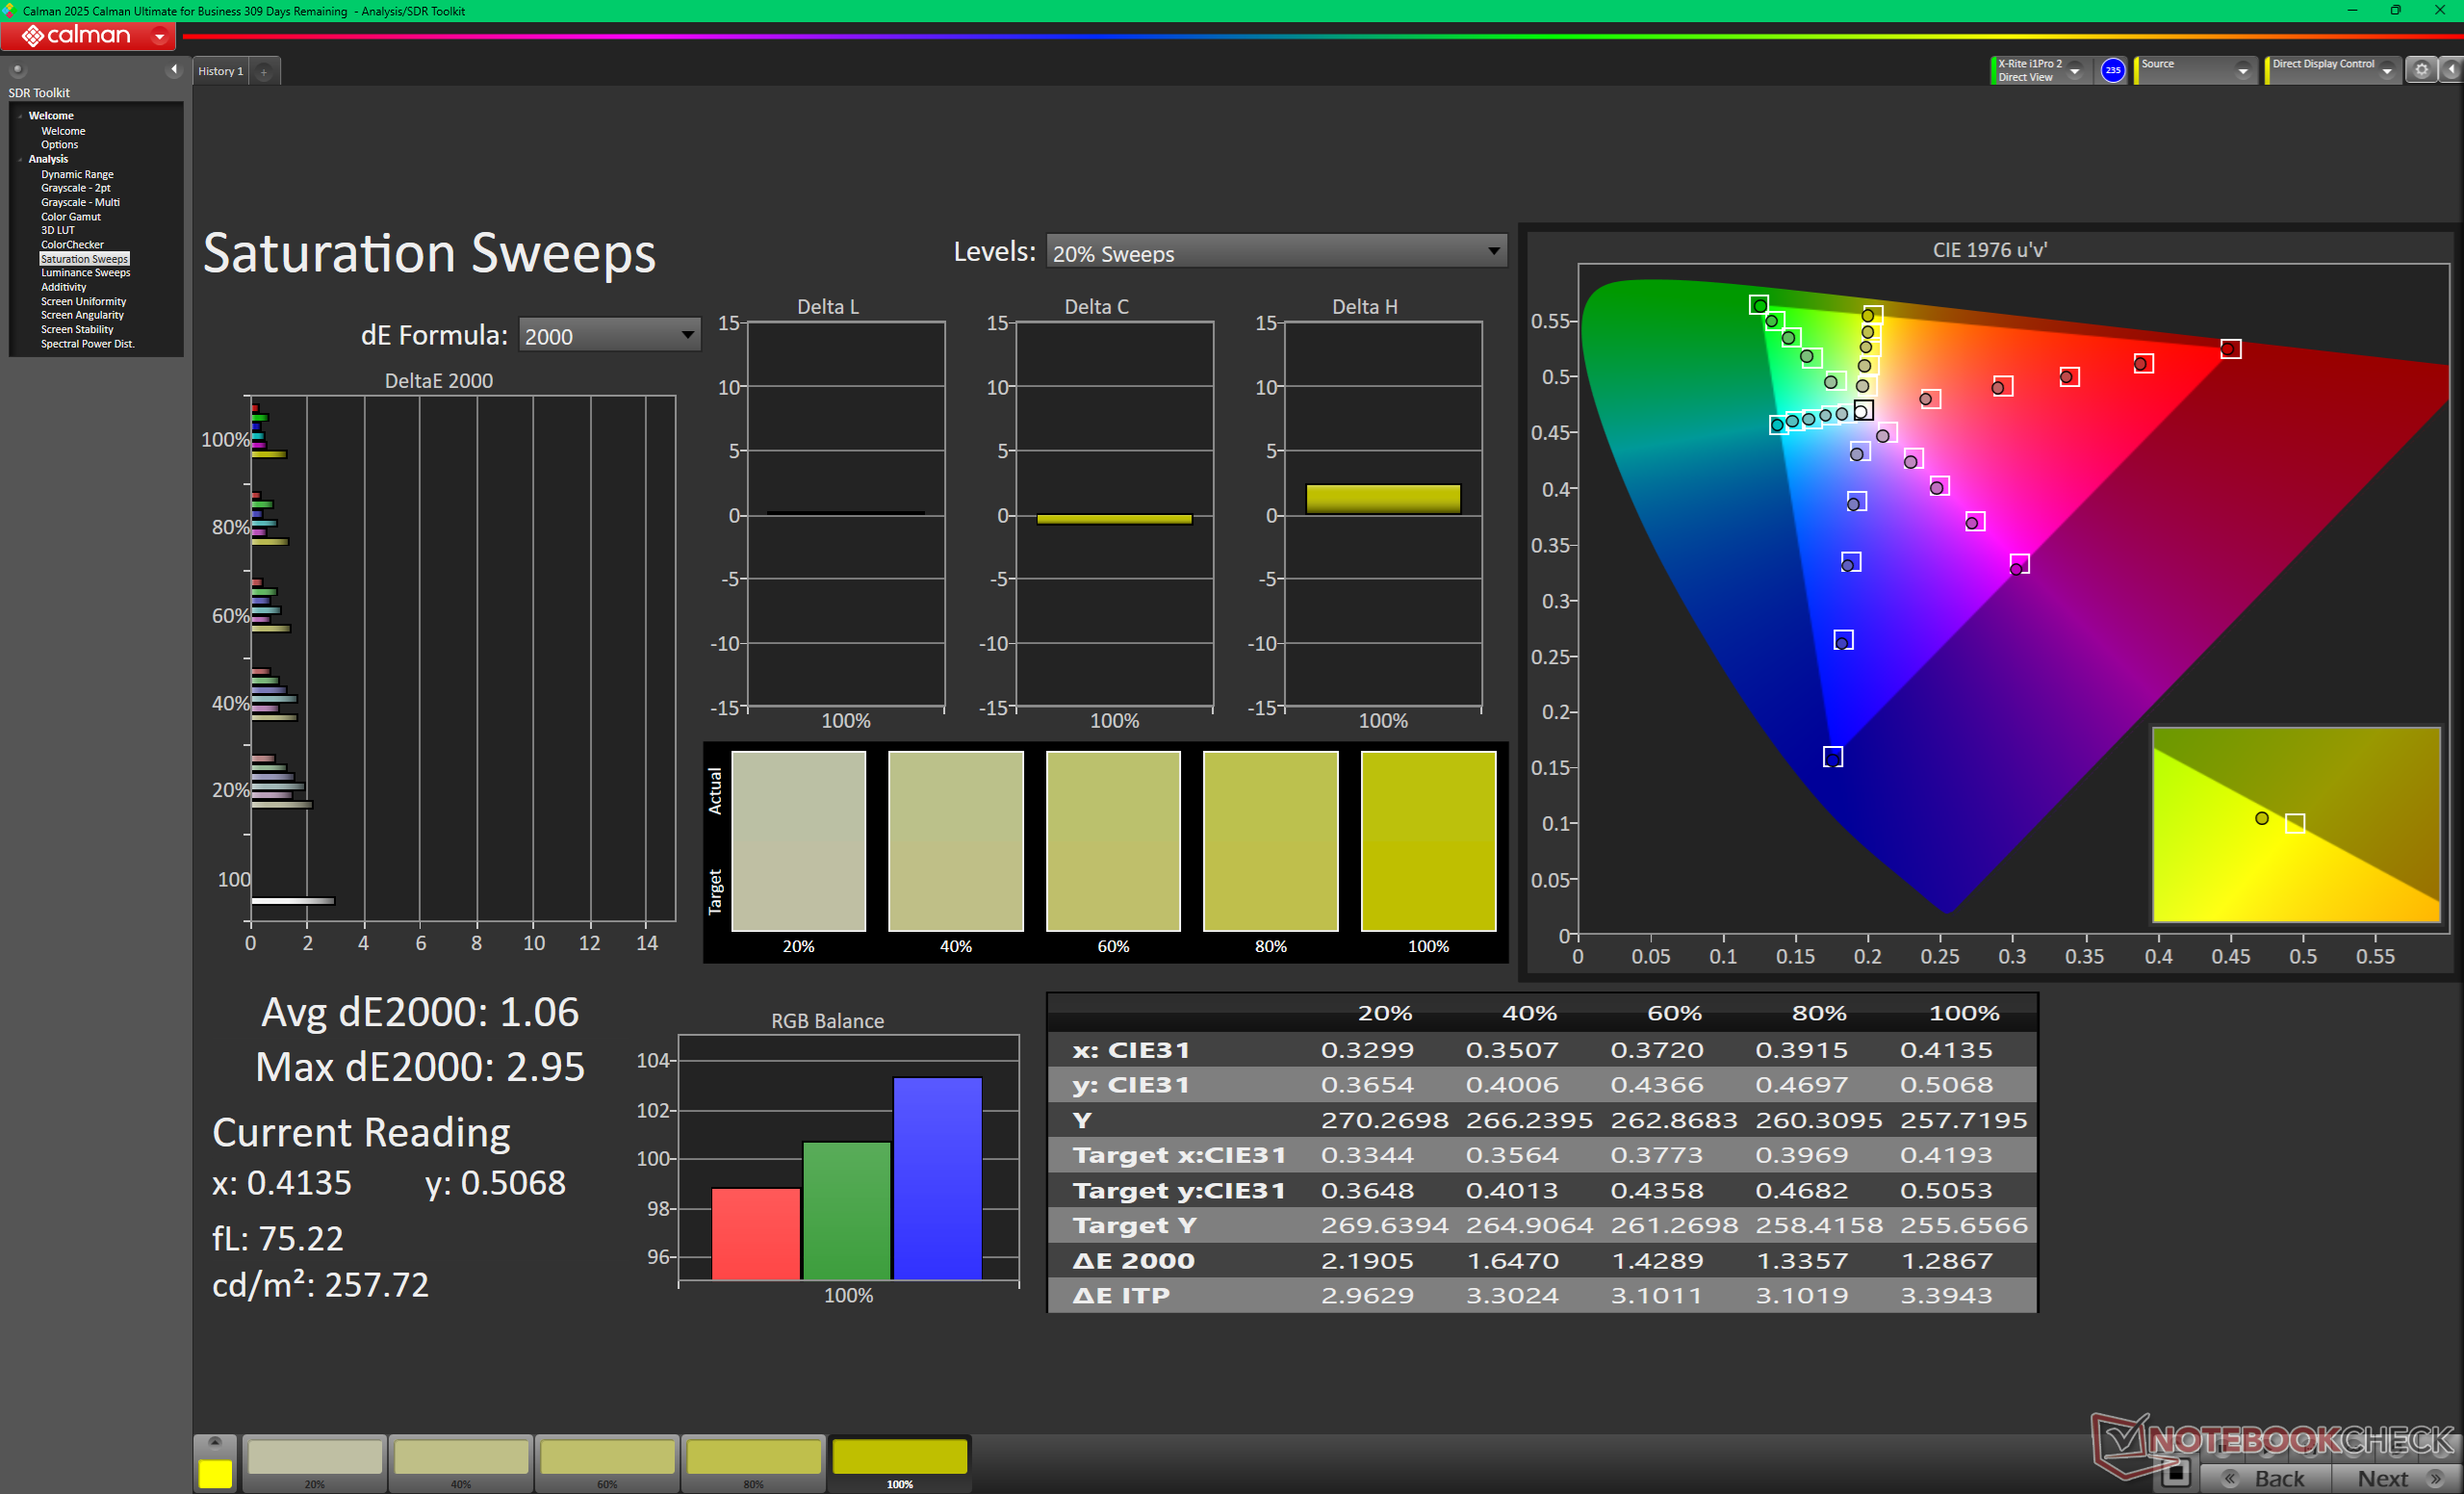
L'écran de base offre un rapport de contraste très élevé de ~2000:1, surtout pour un écran IPS. La qualité de l'image est étonnamment nette pour un écran mat, tandis que les couleurs sRGB complètes devraient satisfaire la plupart des utilisateurs généraux ou des créateurs de contenu occasionnels. Les couleurs P3 plus profondes, la prise en charge HDR ou les fonctionnalités tactiles ne sont disponibles que sur la configuration OLED la plus chère.
Notez que le VRR est désactivé par défaut. Les utilisateurs peuvent activer le VRR via les options d'affichage avancées de Windows. Le taux de rafraîchissement minimal de 1 Hz est une caractéristique unique de l'écran de base que l'on ne retrouve pas sur la plupart des autres ordinateurs portables.


| |||||||||||||||||||||||||
Homogénéité de la luminosité: 92 %
Valeur mesurée au centre, sur batterie: 534.6 cd/m²
Contraste: 2056:1 (Valeurs des noirs: 0.26 cd/m²)
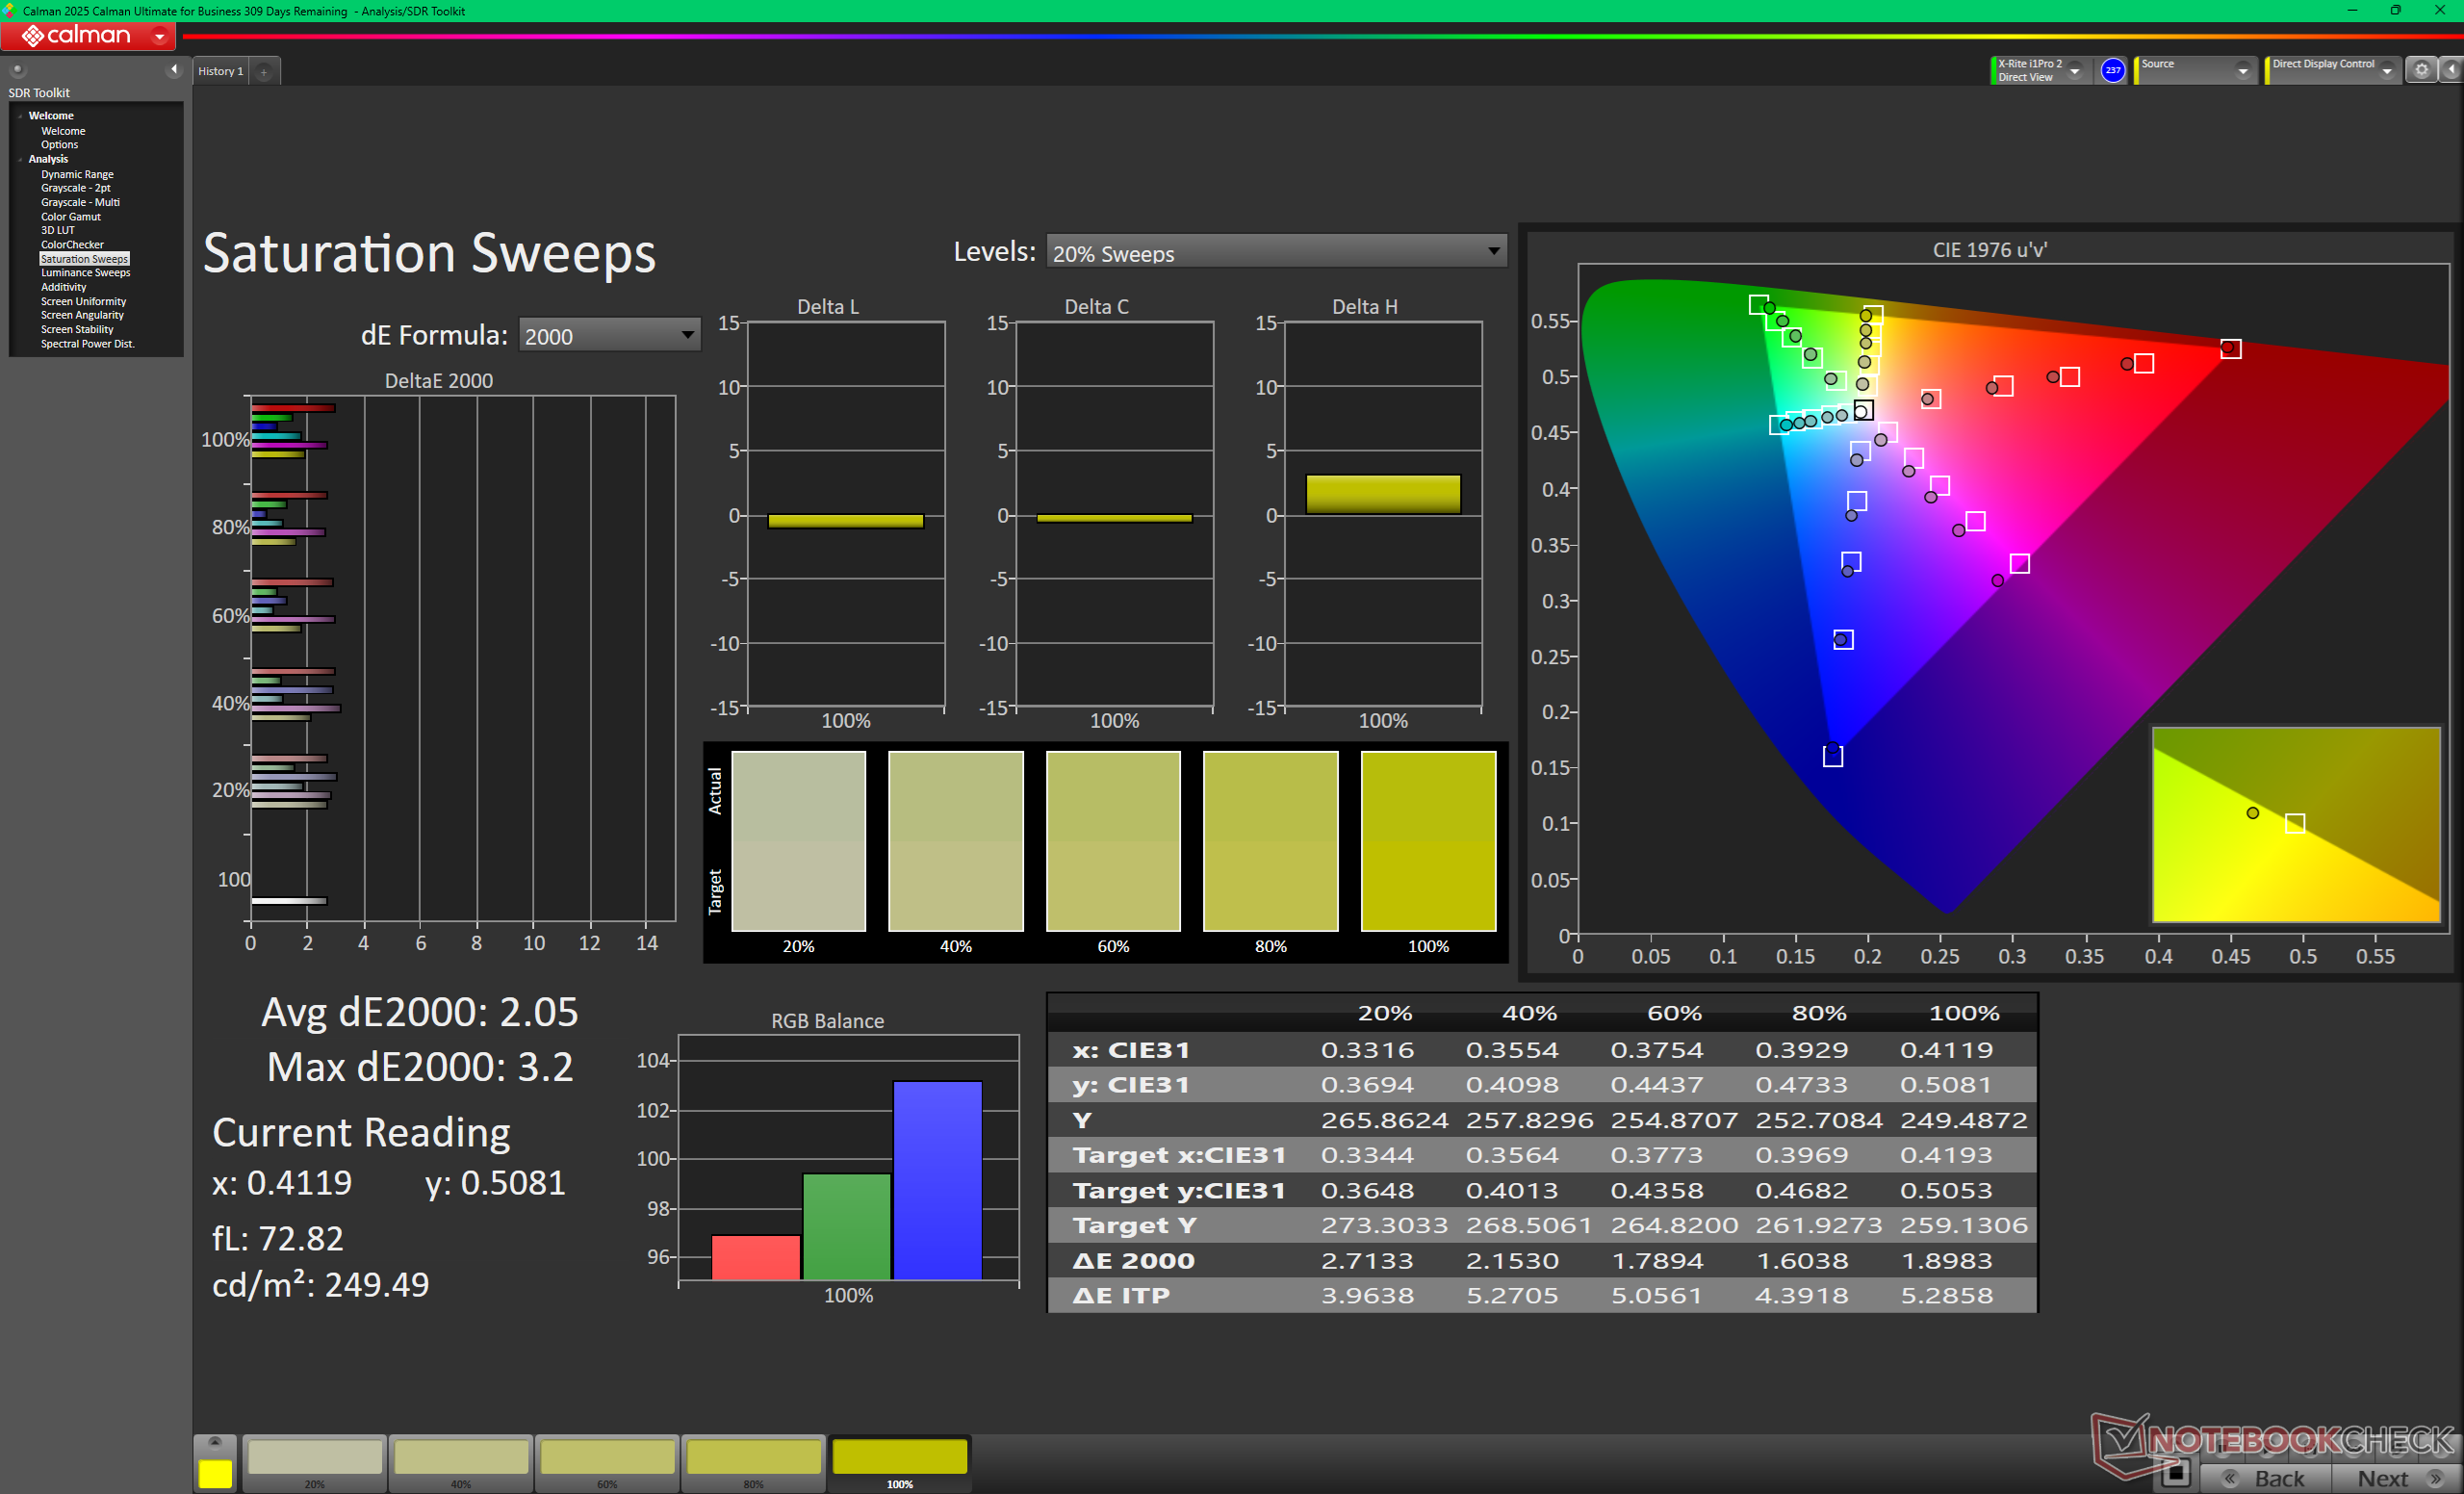
ΔE ColorChecker Calman: 2.53 | ∀{0.5-29.43 Ø4.74}
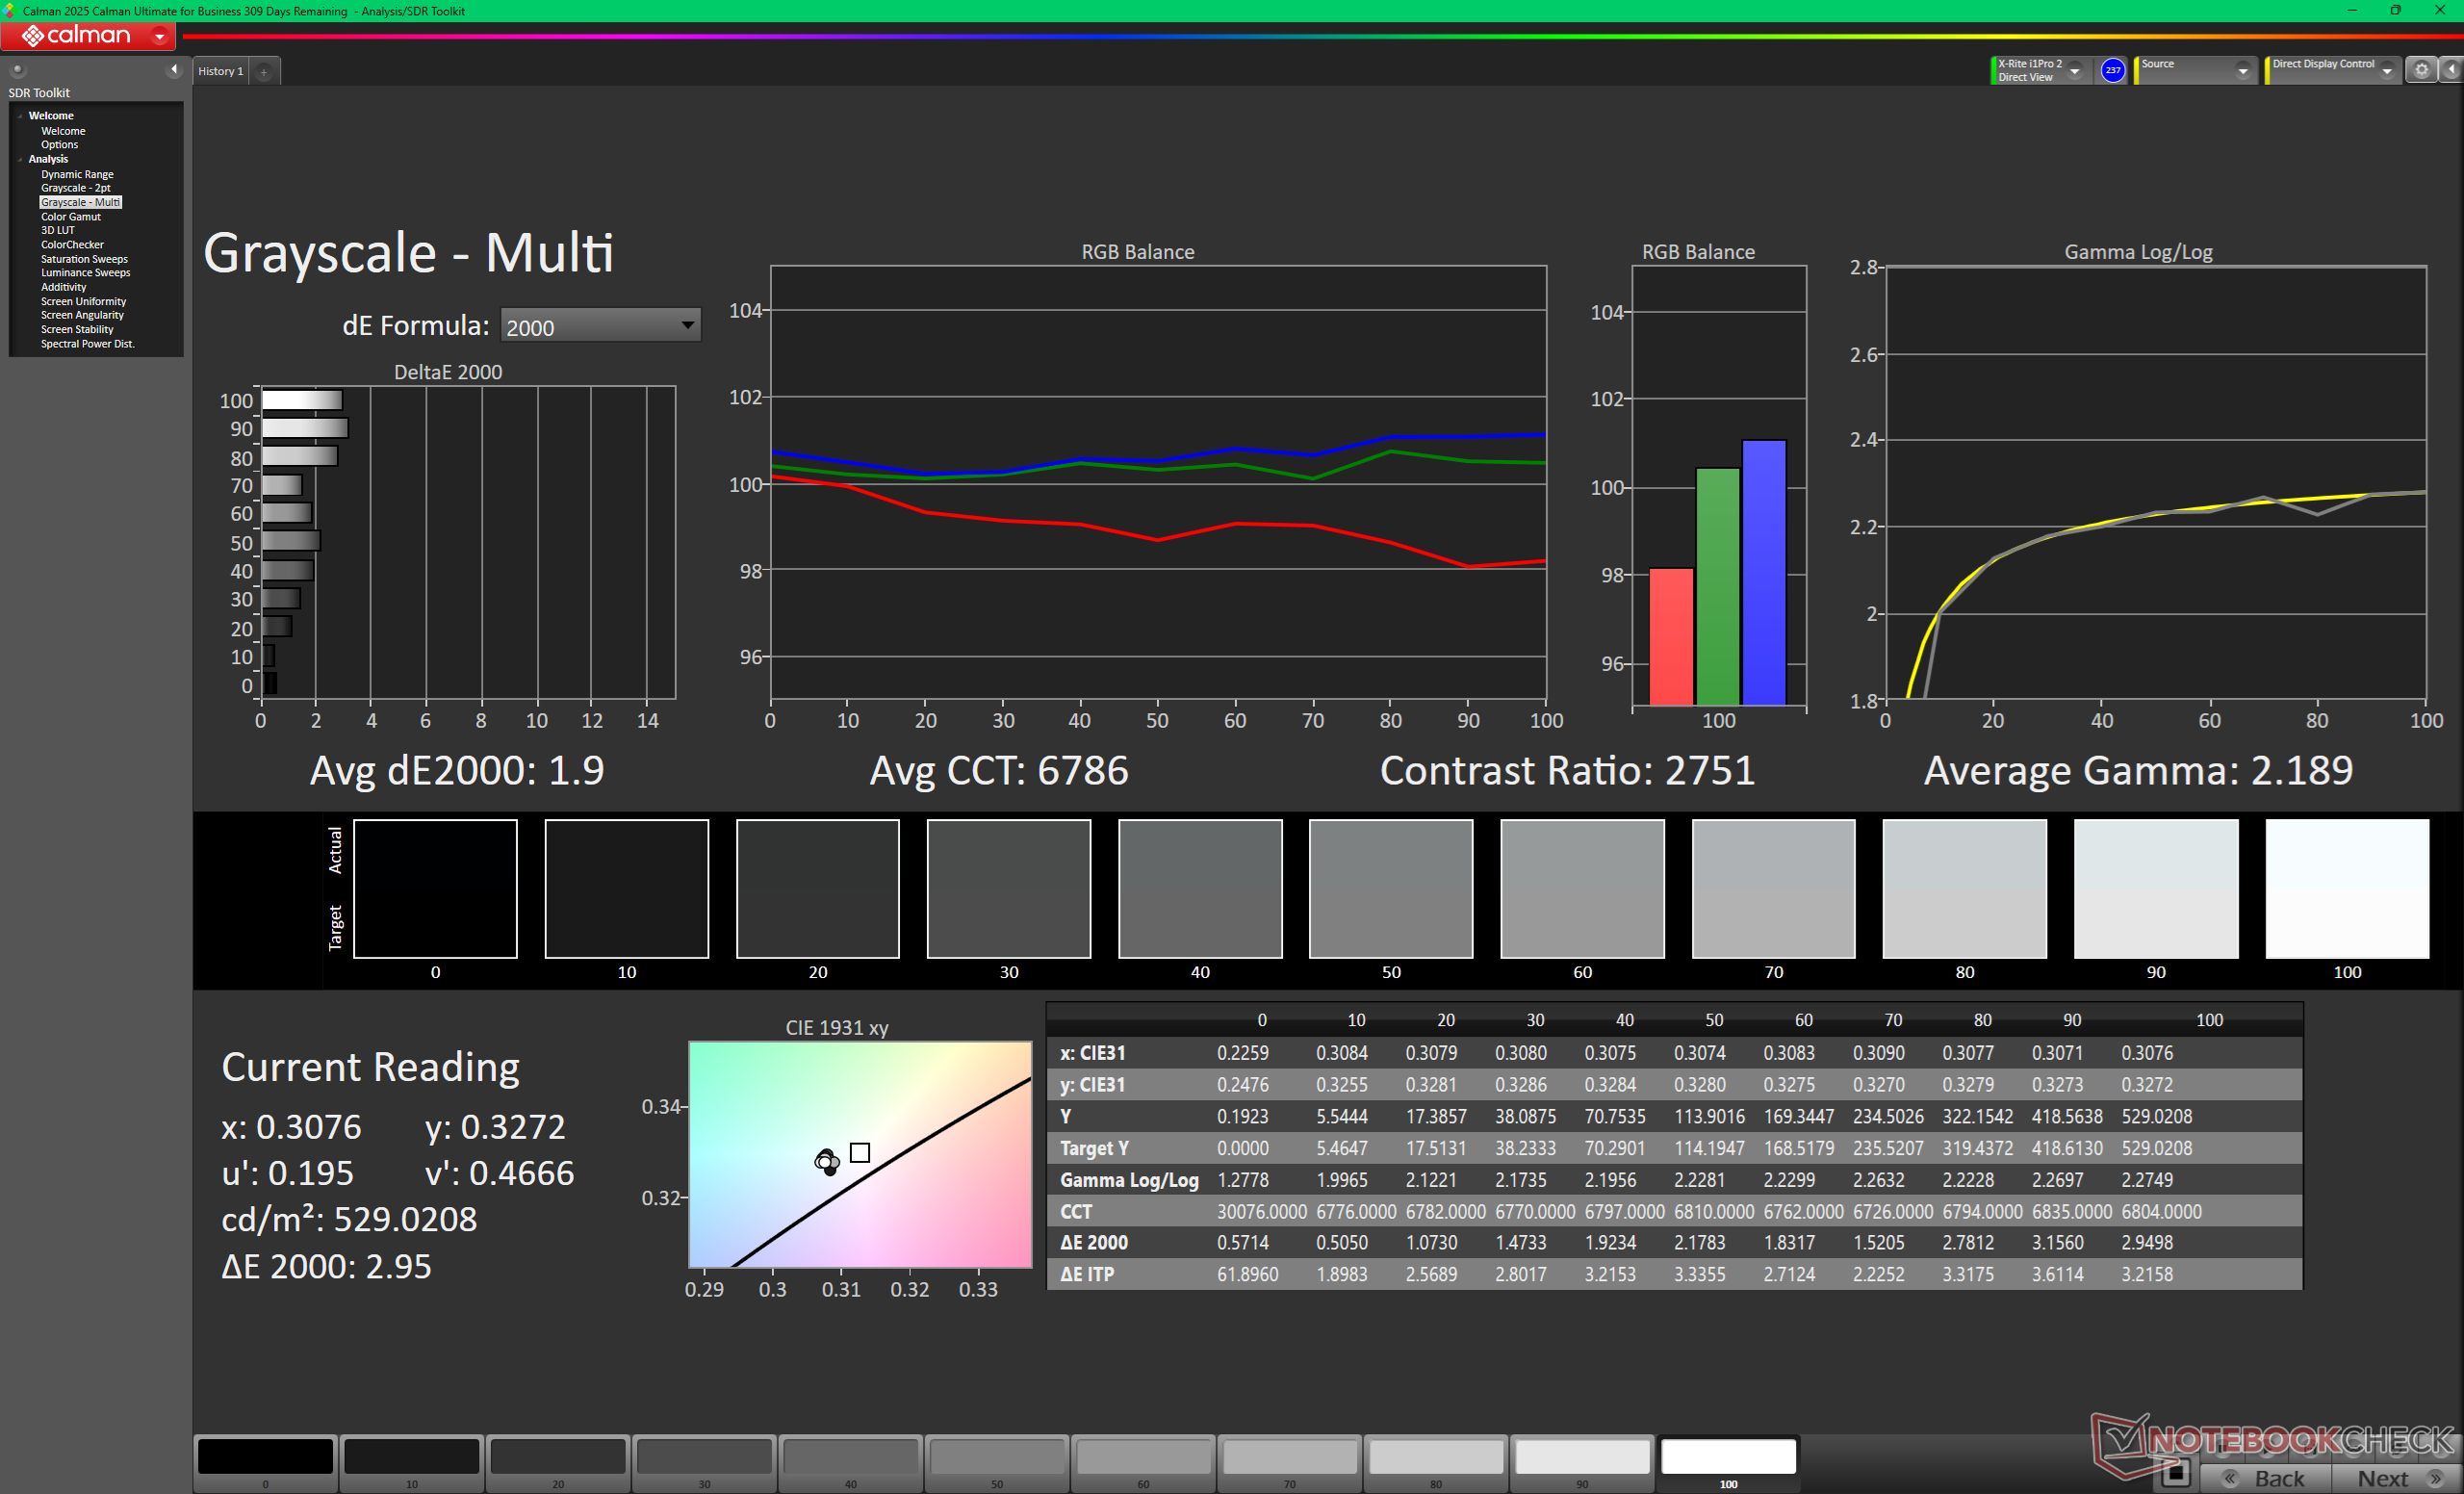
calibrated: 1.26
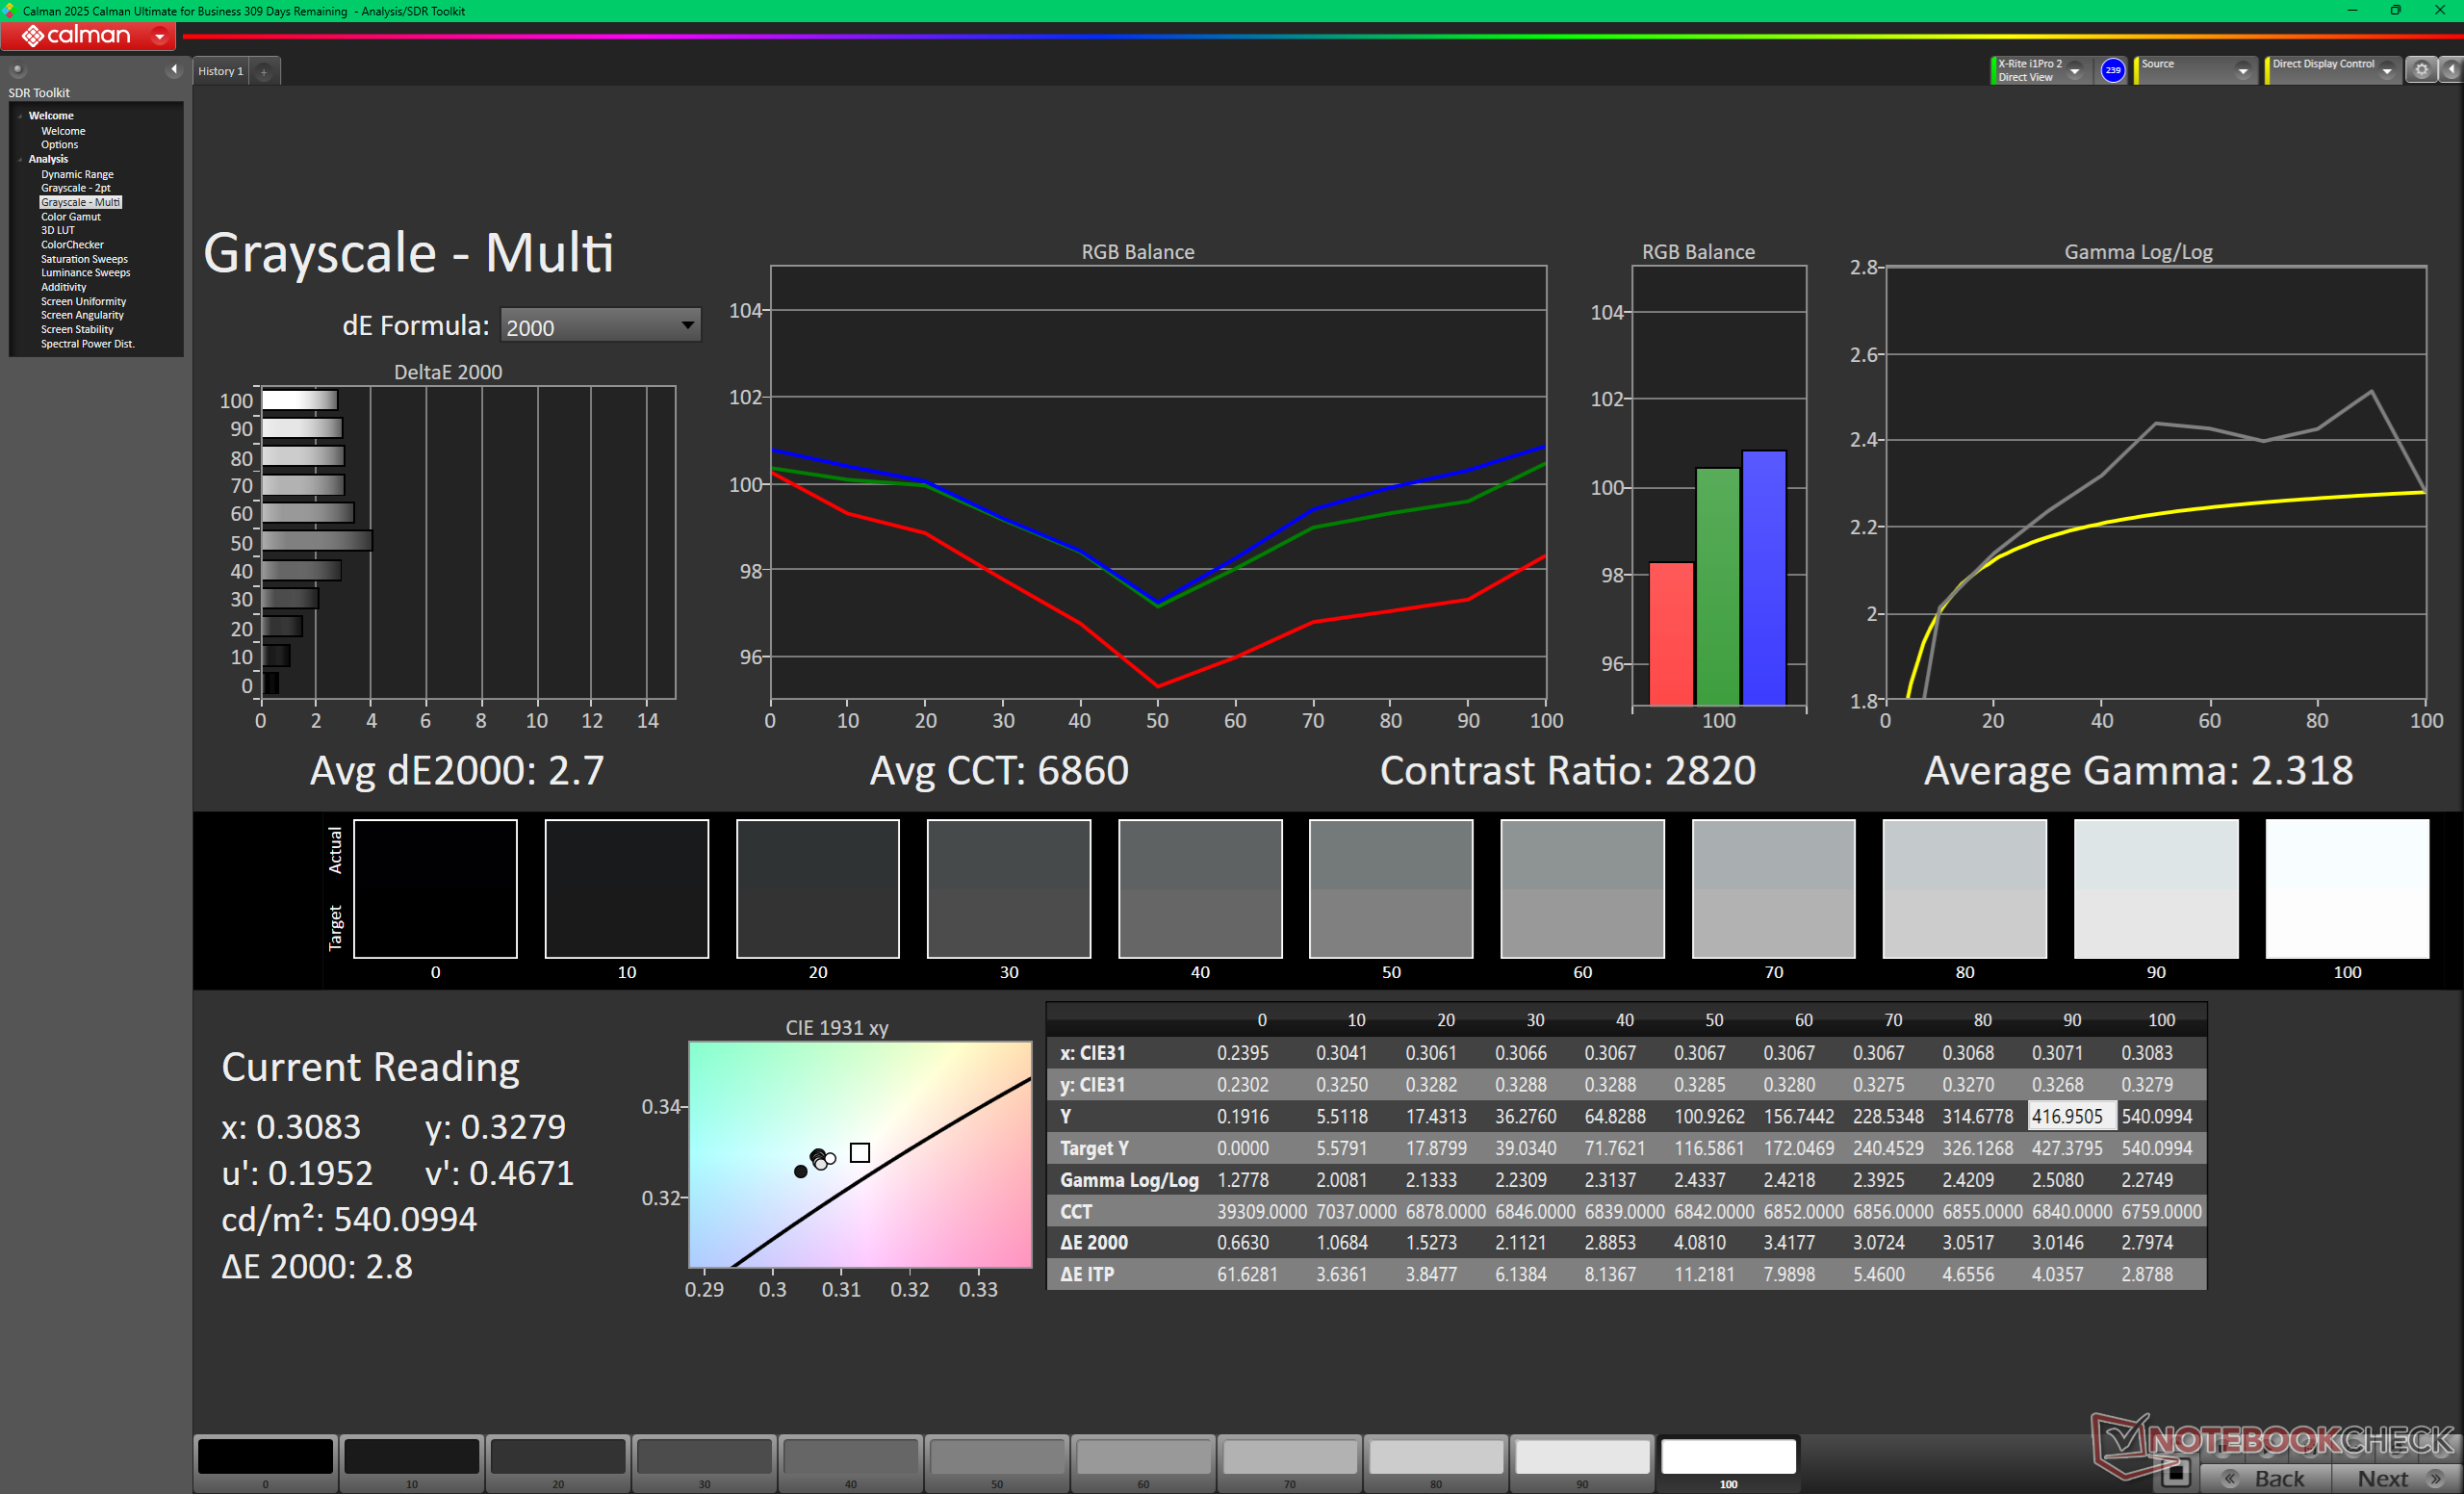
ΔE Greyscale Calman: 2.7 | ∀{0.09-98 Ø4.98}
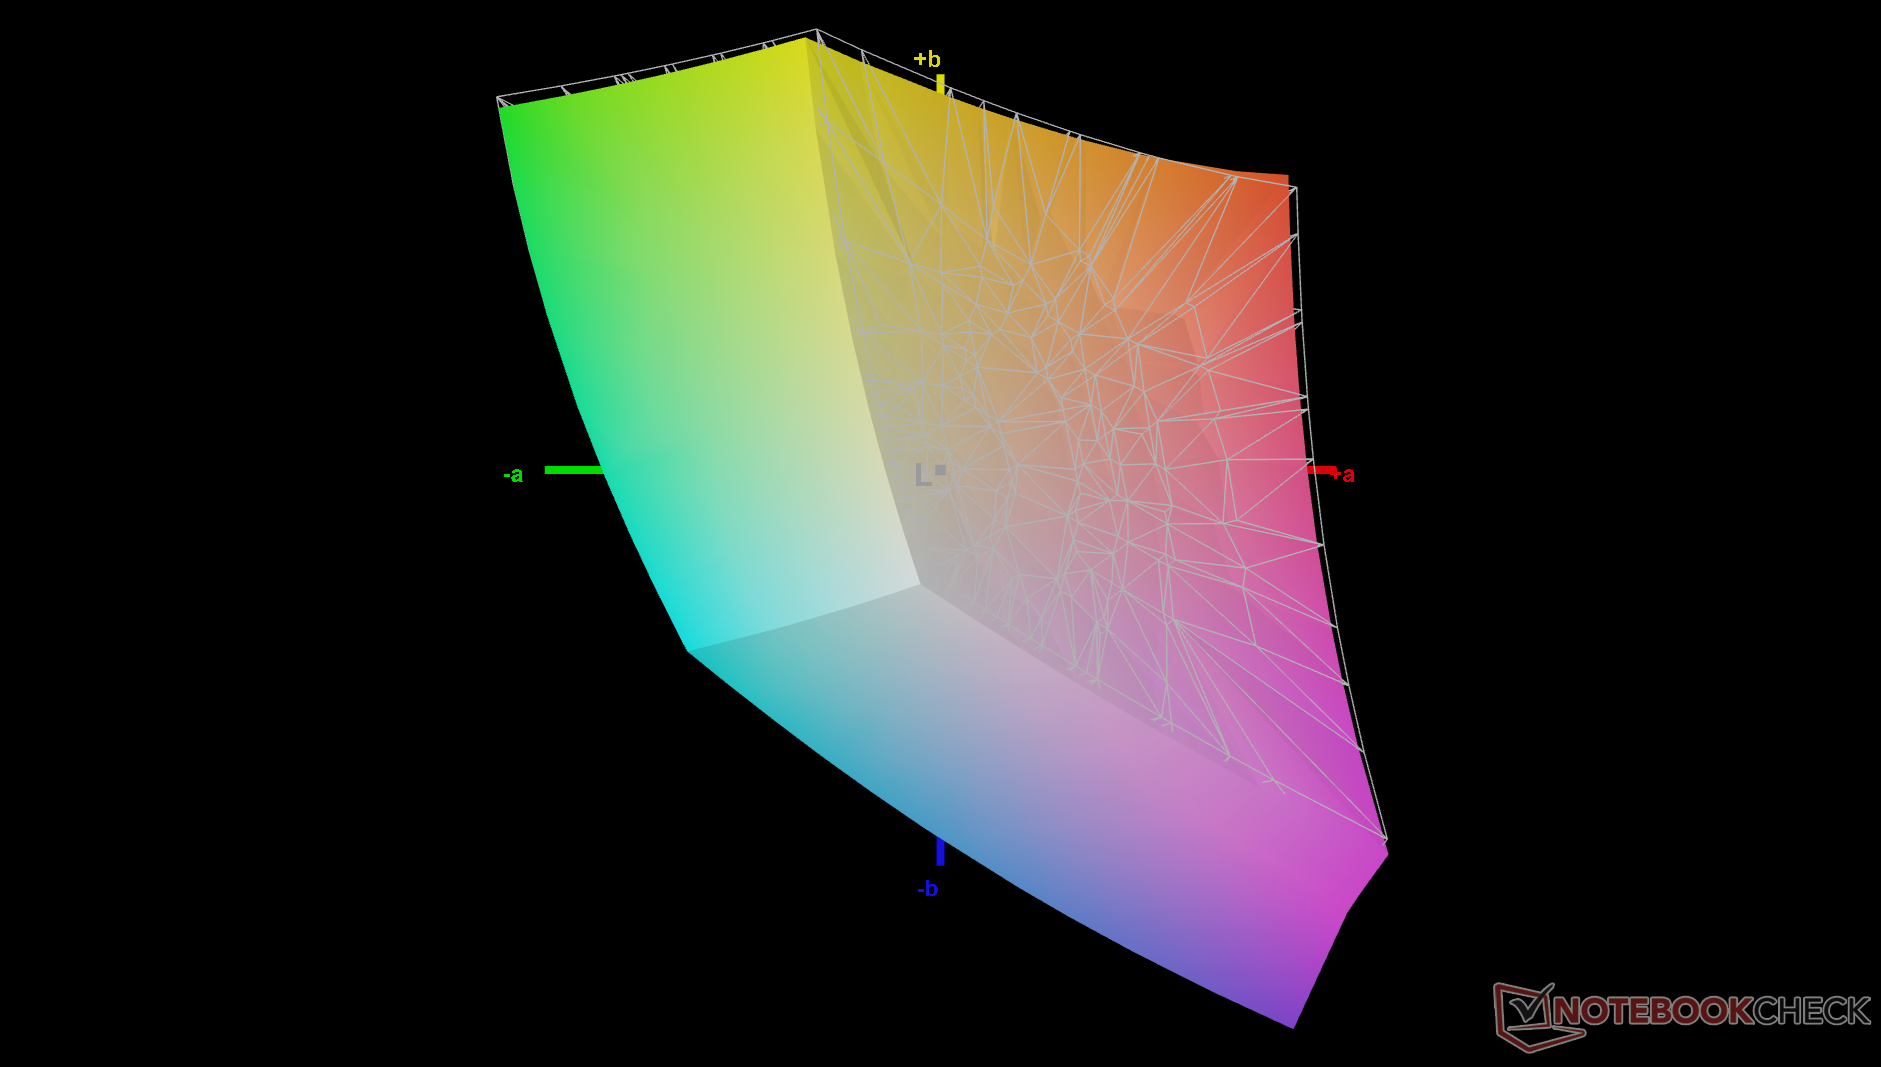
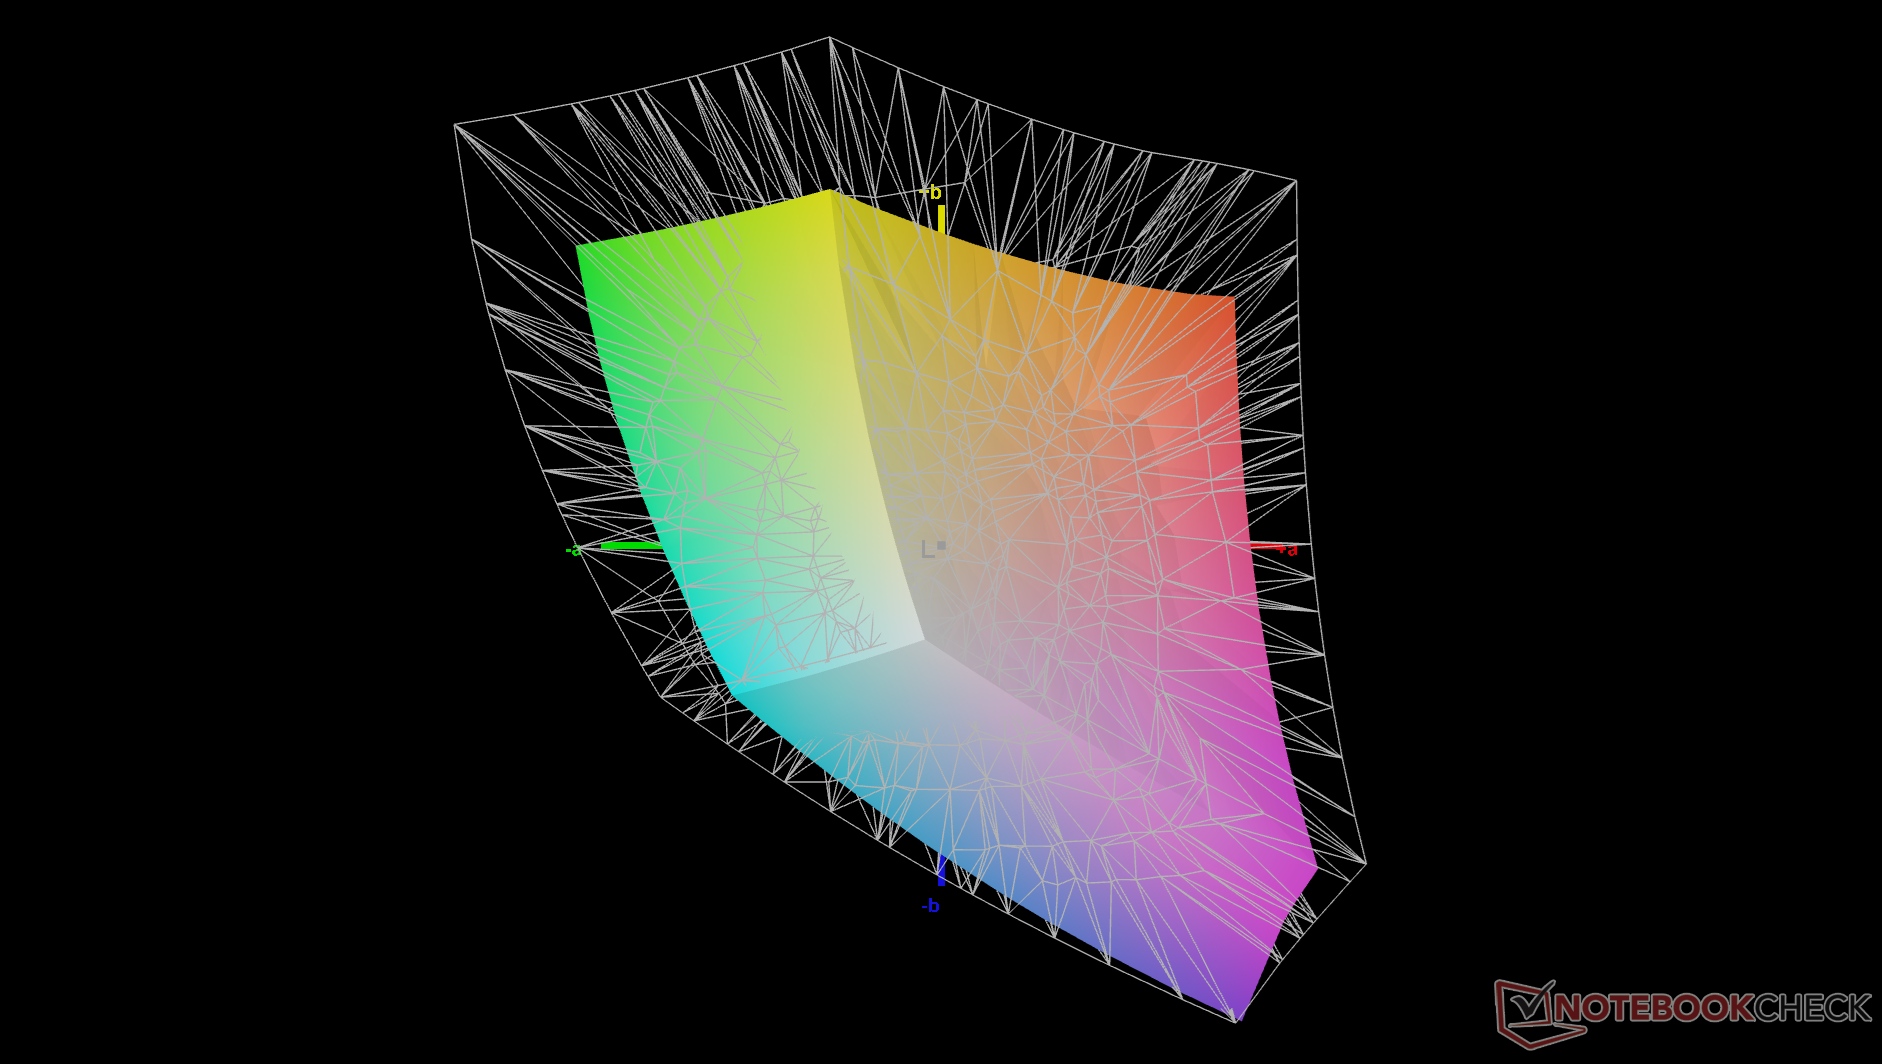
67.7% AdobeRGB 1998 (Argyll 3D)
97.4% sRGB (Argyll 3D)
66.2% Display P3 (Argyll 3D)
Gamma: 2.32
CCT: 6860 K
| Dell XPS 16 Core Ultra 5 325 LG Philips 160WUX, IPS, 1920x1200, 16", 120 Hz | Dell XPS 16 9640 SDC4196, OLED, 3840x2400, 16.3", 90 Hz | Lenovo Yoga Pro 9 16IAH10 RTX 5050 ATNA60HR04-0, OLED, 2880x1800, 16", 120 Hz | Samsung Galaxy Book6 Ultra ATNA60HR05-0, OLED, 2880x1800, 16", 120 Hz | Asus ZenBook S16 UM5606GA ATNA60HR07-0, OLED, 2880x1800, 16", 120 Hz | MSI Prestige 16 AI Evo B2HMG B160QAN03_R, IPS, 2560x1600, 16", 60 Hz | |
|---|---|---|---|---|---|---|
| Display | 27% | 25% | 31% | 24% | ||
| Display P3 Coverage (%) | 66.2 | 98.3 48% | 97 47% | 99.8 51% | 96.4 46% | |
| sRGB Coverage (%) | 97.4 | 100 3% | 99.9 3% | 100 3% | 99.7 2% | |
| AdobeRGB 1998 Coverage (%) | 67.7 | 87.8 30% | 85.3 26% | 94 39% | 84.3 25% | |
| Response Times | 98% | 99% | 98% | -12% | ||
| Response Time Grey 50% / Grey 80% * (ms) | 39.3 ? | 0.82 ? 98% | 0.5 ? 99% | 1.27 ? 97% | 51.5 ? -31% | |
| Response Time Black / White * (ms) | 26 ? | 0.85 ? 97% | 0.4 ? 98% | 0.43 ? 98% | 24.3 ? 7% | |
| PWM Frequency (Hz) | 360 ? | 1200 | 240 ? | 960 ? | ||
| PWM Amplitude * (%) | 37 | 100 | 56 | |||
| Screen | 8% | -15% | 26% | 18% | -55% | |
| Brightness middle (cd/m²) | 534.6 | 366 -32% | 471.7 -12% | 499 -7% | 465 -13% | 471 -12% |
| Brightness (cd/m²) | 515 | 367 -29% | 474 -8% | 505 -2% | 466 -10% | 455 -12% |
| Brightness Distribution (%) | 92 | 96 4% | 98 7% | 97 5% | 99 8% | 92 0% |
| Black Level * (cd/m²) | 0.26 | 0.2 23% | ||||
| Contrast (:1) | 2056 | 2355 15% | ||||
| Colorchecker dE 2000 * | 2.53 | 1.3 49% | 3.53 -40% | 0.9 64% | 1 60% | 5.8 -129% |
| Colorchecker dE 2000 max. * | 4.57 | 3.6 21% | 6.31 -38% | 2.1 54% | 3 34% | 10.8 -136% |
| Colorchecker dE 2000 calibrated * | 1.26 | 1 21% | 1.9 -51% | |||
| Greyscale dE 2000 * | 2.7 | 2.2 19% | 2.6 4% | 1.6 41% | 1.9 30% | 7.8 -189% |
| Gamma | 2.32 95% | 2.14 103% | 2.24 98% | 2.22 99% | 2.19 100% | 2.07 106% |
| CCT | 6860 95% | 6680 97% | 6292 103% | 6445 101% | 6458 101% | 7262 90% |
| Moyenne finale (programmes/paramètres) | 44% /
27% | -15% /
-15% | 50% /
39% | 49% /
36% | -14% /
-32% |
* ... Moindre est la valeur, meilleures sont les performances
L'écran est calibré de manière décente, mais il y a encore de la place pour l'amélioration. Un étalonnage avec notre propre colorimètre X-Rite, par exemple, améliorerait les valeurs moyennes de deltaE en niveaux de gris et en couleurs, déjà faibles, de 2,7 et 2,53 à seulement 1,9 et 1,26, respectivement. Notre profil ICM calibré ci-dessus peut être téléchargé gratuitement.


Temps de réponse de l'écran
| ↔ Temps de réponse noir à blanc | ||
|---|---|---|
| 26 ms ... hausse ↗ et chute ↘ combinées | ↗ 11.7 ms hausse | 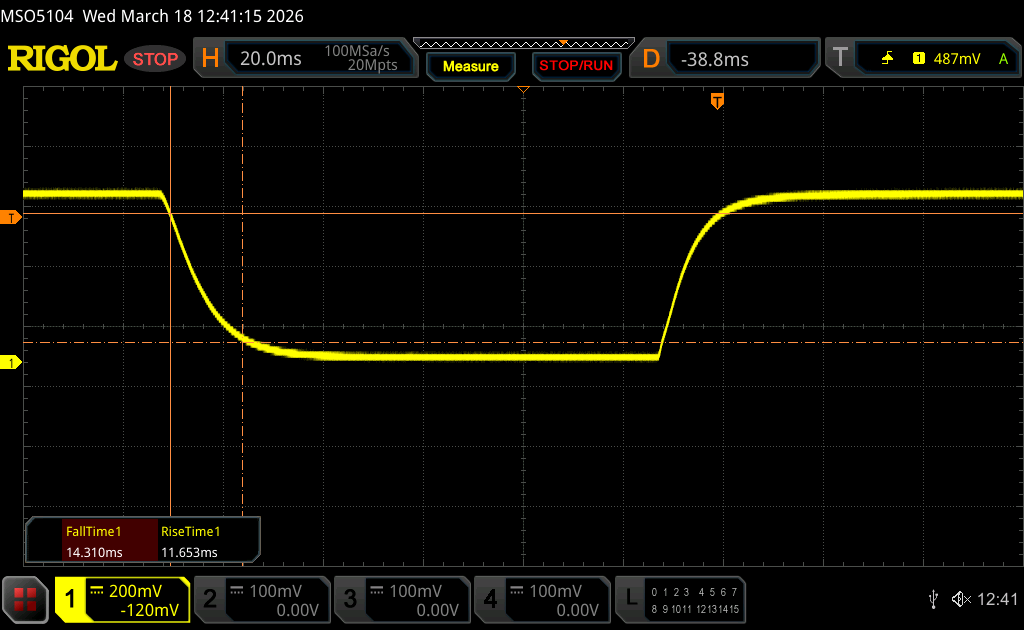 |
| ↘ 14.3 ms chute | ||
| L'écran souffre de latences relativement élevées, insuffisant pour le jeu. En comparaison, tous les appareils testés affichent entre 0.1 (minimum) et 240 (maximum) ms. » 62 % des appareils testés affichent de meilleures performances. Cela signifie que les latences relevées sont moins bonnes que la moyenne (19.9 ms) de tous les appareils testés. | ||
| ↔ Temps de réponse gris 50% à gris 80% | ||
| 39.3 ms ... hausse ↗ et chute ↘ combinées | ↗ 18.1 ms hausse | 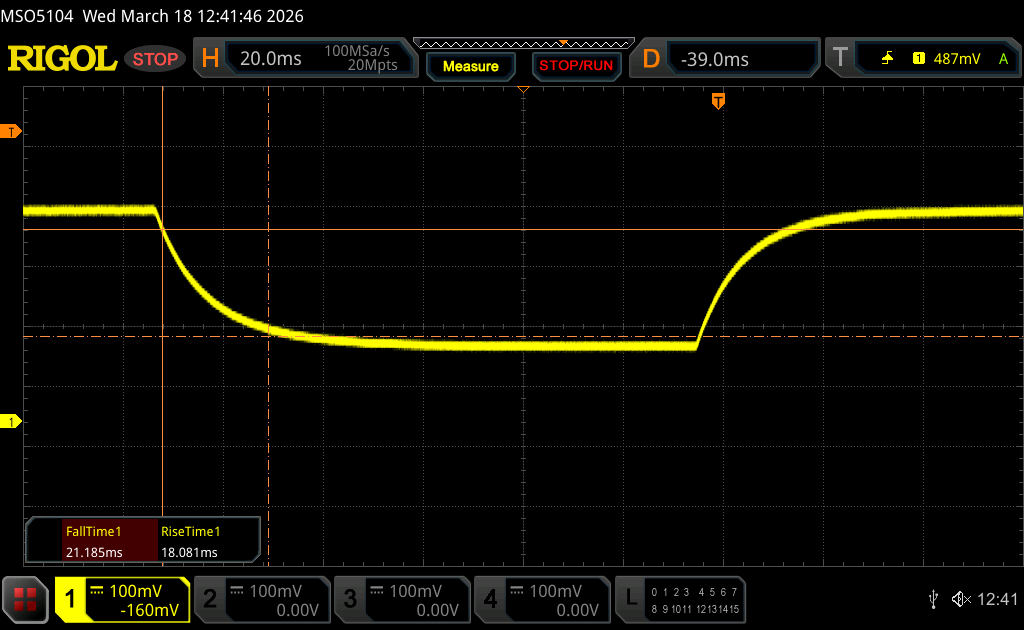 |
| ↘ 21.2 ms chute | ||
| L'écran souffre de latences très élevées, à éviter pour le jeu. En comparaison, tous les appareils testés affichent entre 0.165 (minimum) et 636 (maximum) ms. » 60 % des appareils testés affichent de meilleures performances. Cela signifie que les latences relevées sont moins bonnes que la moyenne (31.2 ms) de tous les appareils testés. | ||
Scintillement / MLI (Modulation de largeur d'impulsion)
| Scintillement / MLI (Modulation de largeur d'impulsion) non décelé | 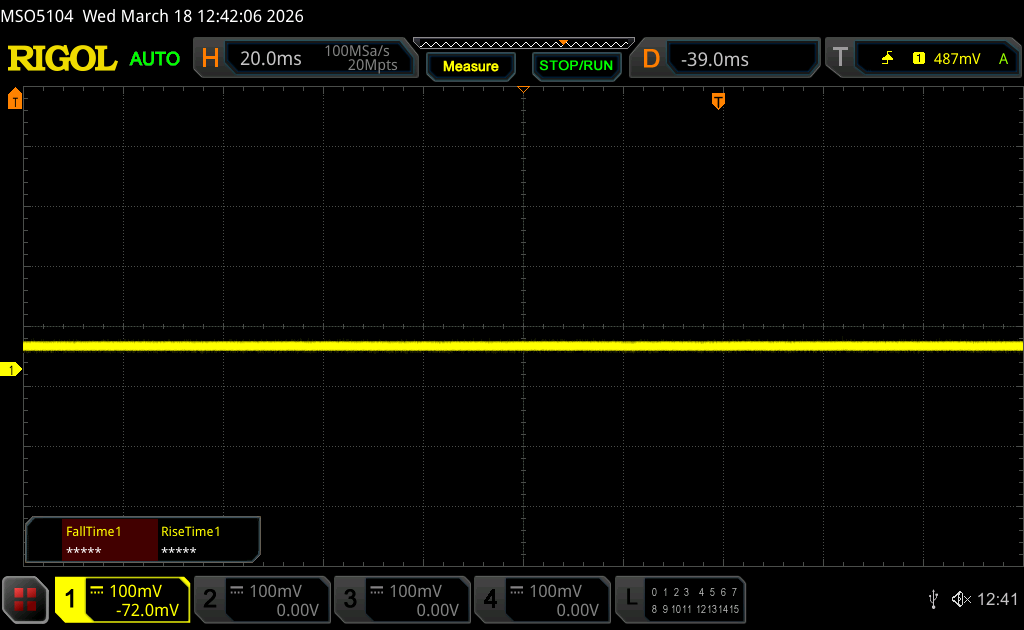 | ||
En comparaison, 52 % des appareils testés n'emploient pas MDI pour assombrir leur écran. Nous avons relevé une moyenne à 7860 (minimum : 5 - maximum : 343500) Hz dans le cas où une MDI était active. | |||
La visibilité en extérieur est correcte à l'ombre grâce au rétroéclairage relativement lumineux de 500 nits et à la surface mate. Dans le cas contraire, les couleurs deviennent trop délavées en cas d'exposition directe au soleil.


Performance - Tout miser sur le lac Panther
Conditions d'essai
Nous avons réglé Windows et Dell Optimizer sur le mode Performance avant d'effectuer les tests ci-dessous.
Processeur
La base Core Ultra 5 325 est un peu lent pour un processeur de la série H, puisqu'il n'est que 10 % plus rapide que le processeur ULV Core Ultra 7 258V en ce qui concerne les performances multithread. En fait, en passant du Core Ultra 5 325 au Core Ultra 7 355 ne devrait améliorer les performances que d'environ 5 %, puisque le nombre de cœurs et la taille de la mémoire cache sont identiques. Les utilisateurs devront passer à la configuration plus haut de gamme Core Ultra X7 358H pour bénéficier d'une augmentation beaucoup plus significative de 70 % des performances brutes du processeur.
Cinebench R15 Multi Loop
Cinebench R23: Multi Core | Single Core
Cinebench R20: CPU (Multi Core) | CPU (Single Core)
Cinebench R15: CPU Multi 64Bit | CPU Single 64Bit
Blender: v2.79 BMW27 CPU
7-Zip 18.03: 7z b 4 | 7z b 4 -mmt1
Geekbench 6.6: Multi-Core | Single-Core
Geekbench 5.5: Multi-Core | Single-Core
HWBOT x265 Benchmark v2.2: 4k Preset
LibreOffice : 20 Documents To PDF
R Benchmark 2.5: Overall mean
* ... Moindre est la valeur, meilleures sont les performances
AIDA64: FP32 Ray-Trace | FPU Julia | CPU SHA3 | CPU Queen | FPU SinJulia | FPU Mandel | CPU AES | CPU ZLib | FP64 Ray-Trace | CPU PhotoWorxx | CPU CheckMate
| Performance rating | |
| Asus ZenBook S16 UM5606GA -1! | |
| Lenovo Yoga Pro 9 16IAH10 RTX 5050 -1! | |
| Samsung Galaxy Book6 Ultra -1! | |
| Dell XPS 16 9640 -1! | |
| MSI Prestige 16 AI Evo B2HMG -1! | |
| Dell XPS 16 Core Ultra 5 325 -1! | |
| Moyenne Intel Core Ultra 5 325 -1! | |
| AIDA64 / FP32 Ray-Trace | |
| Asus ZenBook S16 UM5606GA (v6.92.6600) | |
| Lenovo Yoga Pro 9 16IAH10 RTX 5050 (v6.92.6600) | |
| Samsung Galaxy Book6 Ultra (v8.20.8100) | |
| MSI Prestige 16 AI Evo B2HMG (v6.92.6600) | |
| Dell XPS 16 9640 (v6.92.6600) | |
| Dell XPS 16 Core Ultra 5 325 (v8.20.8100) | |
| Moyenne Intel Core Ultra 5 325 (11016 - 11977, n=2) | |
| AIDA64 / FPU Julia | |
| Lenovo Yoga Pro 9 16IAH10 RTX 5050 (v6.92.6600) | |
| Samsung Galaxy Book6 Ultra (v8.20.8100) | |
| Asus ZenBook S16 UM5606GA (v6.92.6600) | |
| MSI Prestige 16 AI Evo B2HMG (v6.92.6600) | |
| Dell XPS 16 9640 (v6.92.6600) | |
| Dell XPS 16 Core Ultra 5 325 (v8.20.8100) | |
| Moyenne Intel Core Ultra 5 325 (57164 - 62102, n=2) | |
| AIDA64 / CPU SHA3 | |
| Samsung Galaxy Book6 Ultra (v8.20.8100) | |
| Lenovo Yoga Pro 9 16IAH10 RTX 5050 (v6.92.6600) | |
| Asus ZenBook S16 UM5606GA (v6.92.6600) | |
| MSI Prestige 16 AI Evo B2HMG (v6.92.6600) | |
| Dell XPS 16 9640 (v6.92.6600) | |
| Dell XPS 16 Core Ultra 5 325 (v8.20.8100) | |
| Moyenne Intel Core Ultra 5 325 (2508 - 2718, n=2) | |
| AIDA64 / CPU Queen | |
| Asus ZenBook S16 UM5606GA (v6.92.6600) | |
| Dell XPS 16 9640 (v6.92.6600) | |
| MSI Prestige 16 AI Evo B2HMG (v6.92.6600) | |
| Lenovo Yoga Pro 9 16IAH10 RTX 5050 (v6.92.6600) | |
| AIDA64 / FPU SinJulia | |
| Asus ZenBook S16 UM5606GA (v6.92.6600) | |
| Dell XPS 16 9640 (v6.92.6600) | |
| Lenovo Yoga Pro 9 16IAH10 RTX 5050 (v6.92.6600) | |
| MSI Prestige 16 AI Evo B2HMG (v6.92.6600) | |
| Samsung Galaxy Book6 Ultra (v8.20.8100) | |
| Dell XPS 16 Core Ultra 5 325 (v8.20.8100) | |
| Moyenne Intel Core Ultra 5 325 (4409 - 4414, n=2) | |
| AIDA64 / FPU Mandel | |
| Lenovo Yoga Pro 9 16IAH10 RTX 5050 (v6.92.6600) | |
| Samsung Galaxy Book6 Ultra (v8.20.8100) | |
| Asus ZenBook S16 UM5606GA (v6.92.6600) | |
| MSI Prestige 16 AI Evo B2HMG (v6.92.6600) | |
| Dell XPS 16 9640 (v6.92.6600) | |
| Dell XPS 16 Core Ultra 5 325 (v8.20.8100) | |
| Moyenne Intel Core Ultra 5 325 (30237 - 33224, n=2) | |
| AIDA64 / CPU AES | |
| Asus ZenBook S16 UM5606GA (v6.92.6600) | |
| Dell XPS 16 9640 (v6.92.6600) | |
| Lenovo Yoga Pro 9 16IAH10 RTX 5050 (v6.92.6600) | |
| MSI Prestige 16 AI Evo B2HMG (v6.92.6600) | |
| Samsung Galaxy Book6 Ultra (v8.20.8100) | |
| Dell XPS 16 Core Ultra 5 325 (v8.20.8100) | |
| Moyenne Intel Core Ultra 5 325 (37348 - 37641, n=2) | |
| AIDA64 / CPU ZLib | |
| Lenovo Yoga Pro 9 16IAH10 RTX 5050 (v6.92.6600) | |
| Dell XPS 16 9640 (v6.92.6600) | |
| Samsung Galaxy Book6 Ultra (v8.20.8100) | |
| Asus ZenBook S16 UM5606GA (v6.92.6600) | |
| MSI Prestige 16 AI Evo B2HMG (v6.92.6600) | |
| Dell XPS 16 Core Ultra 5 325 (v8.20.8100) | |
| Moyenne Intel Core Ultra 5 325 (596 - 627, n=2) | |
| AIDA64 / FP64 Ray-Trace | |
| Asus ZenBook S16 UM5606GA (v6.92.6600) | |
| Lenovo Yoga Pro 9 16IAH10 RTX 5050 (v6.92.6600) | |
| Samsung Galaxy Book6 Ultra (v8.20.8100) | |
| MSI Prestige 16 AI Evo B2HMG (v6.92.6600) | |
| Dell XPS 16 9640 (v6.92.6600) | |
| Dell XPS 16 Core Ultra 5 325 (v8.20.8100) | |
| Moyenne Intel Core Ultra 5 325 (5761 - 6324, n=2) | |
| AIDA64 / CPU PhotoWorxx | |
| Samsung Galaxy Book6 Ultra (v8.20.8100) | |
| Lenovo Yoga Pro 9 16IAH10 RTX 5050 (v6.92.6600) | |
| MSI Prestige 16 AI Evo B2HMG (v6.92.6600) | |
| Dell XPS 16 Core Ultra 5 325 (v8.20.8100) | |
| Moyenne Intel Core Ultra 5 325 (53916 - 58393, n=2) | |
| Asus ZenBook S16 UM5606GA (v6.92.6600) | |
| Dell XPS 16 9640 (v6.92.6600) | |
| AIDA64 / CPU CheckMate | |
| Samsung Galaxy Book6 Ultra (v8.20.8100) | |
| Dell XPS 16 Core Ultra 5 325 (v8.20.8100) | |
| Moyenne Intel Core Ultra 5 325 (2643 - 2730, n=2) | |
Performance du système
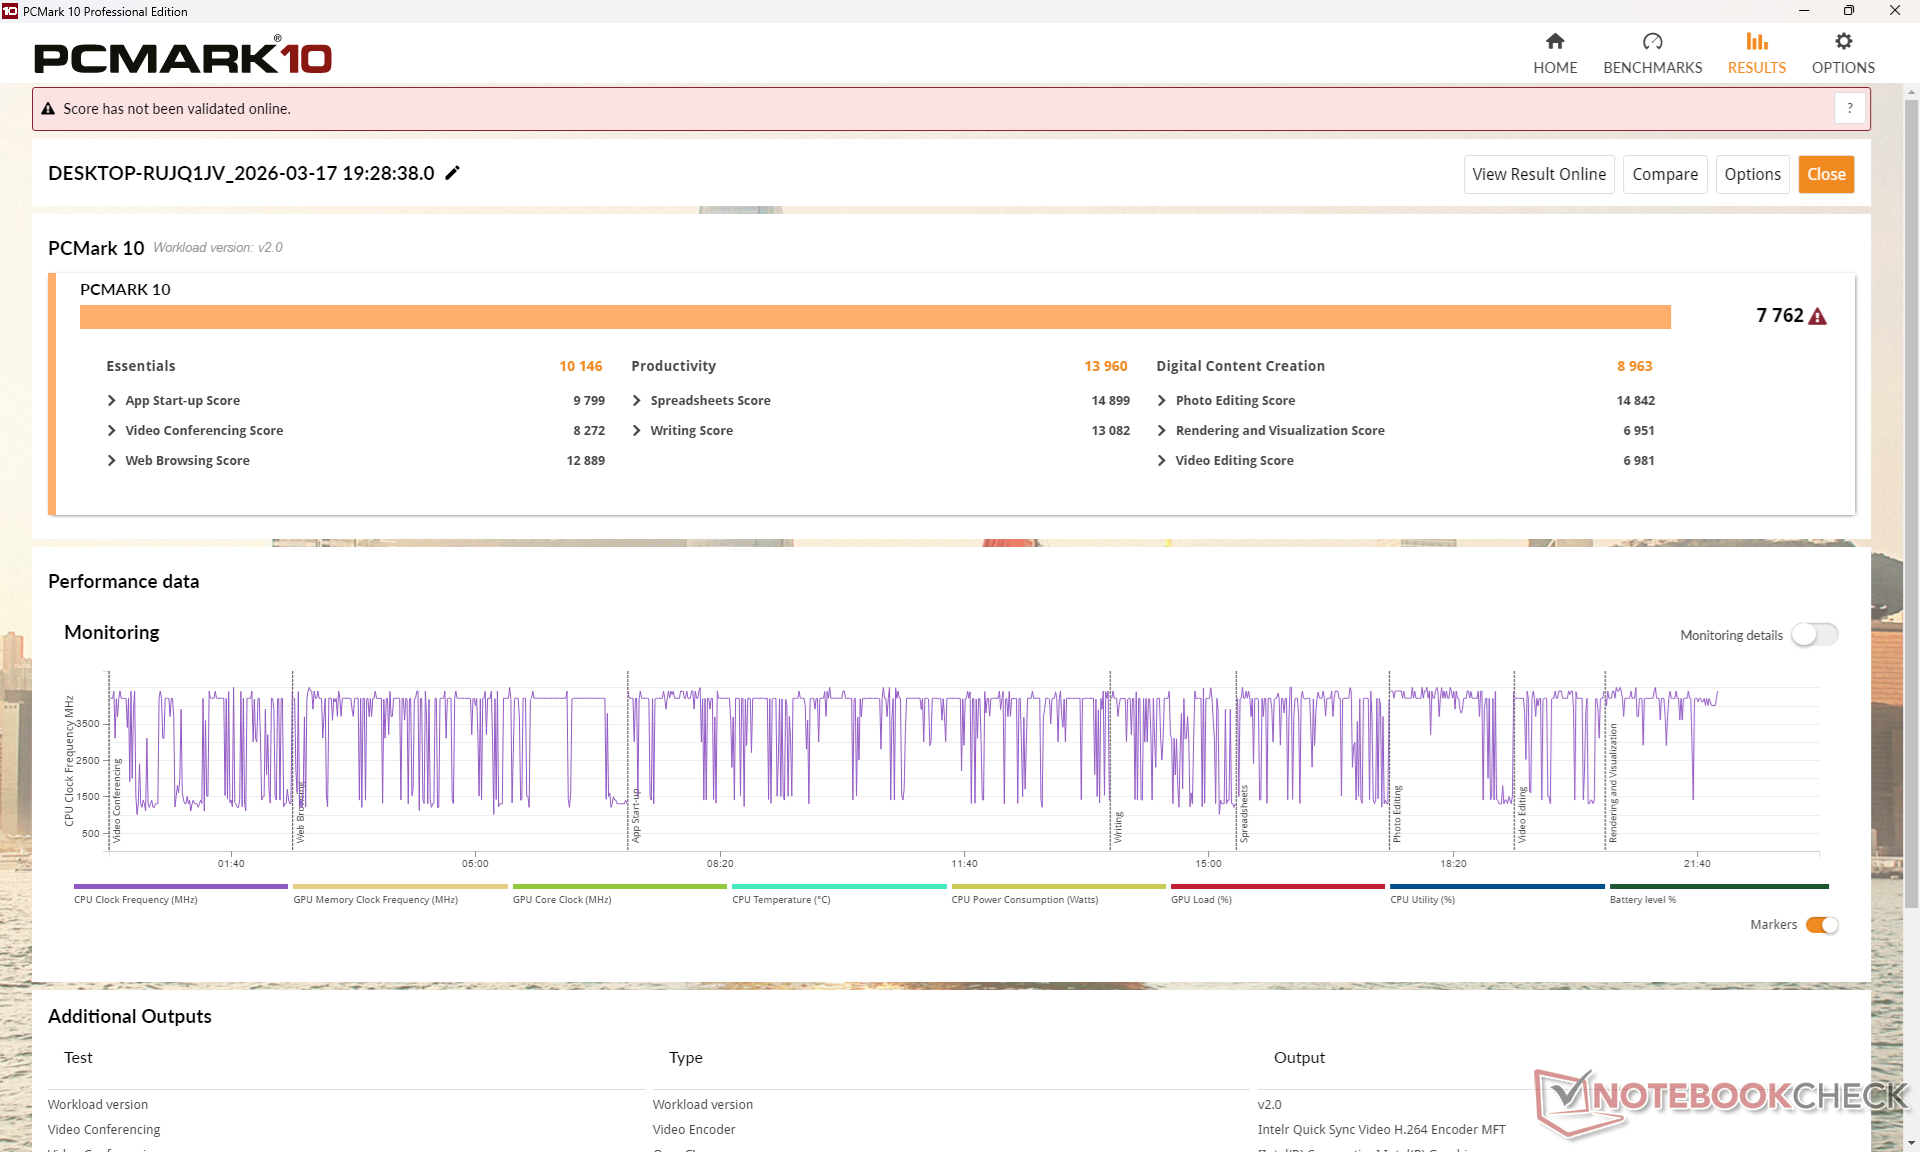
PCMark 10: Score | Essentials | Productivity | Digital Content Creation
CrossMark: Overall | Productivity | Creativity | Responsiveness
WebXPRT 3: Overall
WebXPRT 4: Overall
Mozilla Kraken 1.1: Total
Geekbench AI: Single Precision GPU 1.7 | Half Precision GPU 1.7 | Quantized GPU 1.7
| Performance rating | |
| Lenovo Yoga Pro 9 16IAH10 RTX 5050 | |
| Samsung Galaxy Book6 Ultra | |
| MSI Prestige 16 AI Evo B2HMG -3! | |
| Dell XPS 16 9640 -4! | |
| Asus ZenBook S16 UM5606GA -3! | |
| Moyenne Intel Core Ultra 5 325, Intel Graphics 4 Xe3 Panther Lake iGPU | |
| Dell XPS 16 Core Ultra 5 325 | |
| PCMark 10 / Score | |
| Lenovo Yoga Pro 9 16IAH10 RTX 5050 | |
| Samsung Galaxy Book6 Ultra | |
| Asus ZenBook S16 UM5606GA | |
| MSI Prestige 16 AI Evo B2HMG | |
| Dell XPS 16 Core Ultra 5 325 | |
| Moyenne Intel Core Ultra 5 325, Intel Graphics 4 Xe3 Panther Lake iGPU (7532 - 7762, n=2) | |
| Dell XPS 16 9640 | |
| PCMark 10 / Essentials | |
| MSI Prestige 16 AI Evo B2HMG | |
| Lenovo Yoga Pro 9 16IAH10 RTX 5050 | |
| Asus ZenBook S16 UM5606GA | |
| Dell XPS 16 9640 | |
| Moyenne Intel Core Ultra 5 325, Intel Graphics 4 Xe3 Panther Lake iGPU (10146 - 10402, n=2) | |
| Dell XPS 16 Core Ultra 5 325 | |
| Samsung Galaxy Book6 Ultra | |
| PCMark 10 / Productivity | |
| Samsung Galaxy Book6 Ultra | |
| Lenovo Yoga Pro 9 16IAH10 RTX 5050 | |
| Asus ZenBook S16 UM5606GA | |
| Dell XPS 16 Core Ultra 5 325 | |
| Moyenne Intel Core Ultra 5 325, Intel Graphics 4 Xe3 Panther Lake iGPU (12413 - 13960, n=2) | |
| MSI Prestige 16 AI Evo B2HMG | |
| Dell XPS 16 9640 | |
| PCMark 10 / Digital Content Creation | |
| Lenovo Yoga Pro 9 16IAH10 RTX 5050 | |
| Samsung Galaxy Book6 Ultra | |
| MSI Prestige 16 AI Evo B2HMG | |
| Dell XPS 16 9640 | |
| Asus ZenBook S16 UM5606GA | |
| Moyenne Intel Core Ultra 5 325, Intel Graphics 4 Xe3 Panther Lake iGPU (8963 - 8979, n=2) | |
| Dell XPS 16 Core Ultra 5 325 | |
| CrossMark / Overall | |
| MSI Prestige 16 AI Evo B2HMG | |
| Lenovo Yoga Pro 9 16IAH10 RTX 5050 | |
| Samsung Galaxy Book6 Ultra | |
| Dell XPS 16 9640 | |
| Moyenne Intel Core Ultra 5 325, Intel Graphics 4 Xe3 Panther Lake iGPU (1666 - 1772, n=2) | |
| Dell XPS 16 Core Ultra 5 325 | |
| Asus ZenBook S16 UM5606GA | |
| CrossMark / Productivity | |
| MSI Prestige 16 AI Evo B2HMG | |
| Lenovo Yoga Pro 9 16IAH10 RTX 5050 | |
| Dell XPS 16 9640 | |
| Samsung Galaxy Book6 Ultra | |
| Moyenne Intel Core Ultra 5 325, Intel Graphics 4 Xe3 Panther Lake iGPU (1581 - 1715, n=2) | |
| Asus ZenBook S16 UM5606GA | |
| Dell XPS 16 Core Ultra 5 325 | |
| CrossMark / Creativity | |
| MSI Prestige 16 AI Evo B2HMG | |
| Lenovo Yoga Pro 9 16IAH10 RTX 5050 | |
| Samsung Galaxy Book6 Ultra | |
| Dell XPS 16 9640 | |
| Asus ZenBook S16 UM5606GA | |
| Moyenne Intel Core Ultra 5 325, Intel Graphics 4 Xe3 Panther Lake iGPU (1889 - 1917, n=2) | |
| Dell XPS 16 Core Ultra 5 325 | |
| CrossMark / Responsiveness | |
| MSI Prestige 16 AI Evo B2HMG | |
| Dell XPS 16 9640 | |
| Samsung Galaxy Book6 Ultra | |
| Lenovo Yoga Pro 9 16IAH10 RTX 5050 | |
| Moyenne Intel Core Ultra 5 325, Intel Graphics 4 Xe3 Panther Lake iGPU (1338 - 1544, n=2) | |
| Asus ZenBook S16 UM5606GA | |
| Dell XPS 16 Core Ultra 5 325 | |
| WebXPRT 3 / Overall | |
| MSI Prestige 16 AI Evo B2HMG | |
| Lenovo Yoga Pro 9 16IAH10 RTX 5050 | |
| Samsung Galaxy Book6 Ultra | |
| Asus ZenBook S16 UM5606GA | |
| Moyenne Intel Core Ultra 5 325, Intel Graphics 4 Xe3 Panther Lake iGPU (282 - 308, n=2) | |
| Dell XPS 16 9640 | |
| Dell XPS 16 Core Ultra 5 325 | |
| WebXPRT 4 / Overall | |
| MSI Prestige 16 AI Evo B2HMG | |
| Lenovo Yoga Pro 9 16IAH10 RTX 5050 | |
| Samsung Galaxy Book6 Ultra | |
| Moyenne Intel Core Ultra 5 325, Intel Graphics 4 Xe3 Panther Lake iGPU (267 - 276, n=2) | |
| Dell XPS 16 Core Ultra 5 325 | |
| Dell XPS 16 9640 | |
| Asus ZenBook S16 UM5606GA | |
| Mozilla Kraken 1.1 / Total | |
| Dell XPS 16 Core Ultra 5 325 | |
| Moyenne Intel Core Ultra 5 325, Intel Graphics 4 Xe3 Panther Lake iGPU (492 - 497, n=2) | |
| Asus ZenBook S16 UM5606GA | |
| Samsung Galaxy Book6 Ultra | |
| Lenovo Yoga Pro 9 16IAH10 RTX 5050 | |
| MSI Prestige 16 AI Evo B2HMG | |
| Geekbench AI / Single Precision GPU 1.7 | |
| Samsung Galaxy Book6 Ultra | |
| Lenovo Yoga Pro 9 16IAH10 RTX 5050 | |
| Dell XPS 16 Core Ultra 5 325 | |
| Moyenne Intel Core Ultra 5 325, Intel Graphics 4 Xe3 Panther Lake iGPU (n=1) | |
| Geekbench AI / Half Precision GPU 1.7 | |
| Lenovo Yoga Pro 9 16IAH10 RTX 5050 | |
| Samsung Galaxy Book6 Ultra | |
| Dell XPS 16 Core Ultra 5 325 | |
| Moyenne Intel Core Ultra 5 325, Intel Graphics 4 Xe3 Panther Lake iGPU (n=1) | |
| Geekbench AI / Quantized GPU 1.7 | |
| Samsung Galaxy Book6 Ultra | |
| Lenovo Yoga Pro 9 16IAH10 RTX 5050 | |
| Dell XPS 16 Core Ultra 5 325 | |
| Moyenne Intel Core Ultra 5 325, Intel Graphics 4 Xe3 Panther Lake iGPU (n=1) | |
* ... Moindre est la valeur, meilleures sont les performances
| PCMark 10 Score | 7762 points | |
Aide | ||
| AIDA64 / Memory Copy | |
| Samsung Galaxy Book6 Ultra | |
| Dell XPS 16 Core Ultra 5 325 | |
| Lenovo Yoga Pro 9 16IAH10 RTX 5050 | |
| MSI Prestige 16 AI Evo B2HMG | |
| Asus ZenBook S16 UM5606GA | |
| Moyenne Intel Core Ultra 5 325 (89482 - 100226, n=2) | |
| Dell XPS 16 9640 | |
| AIDA64 / Memory Read | |
| Samsung Galaxy Book6 Ultra | |
| Asus ZenBook S16 UM5606GA | |
| Lenovo Yoga Pro 9 16IAH10 RTX 5050 | |
| Dell XPS 16 Core Ultra 5 325 | |
| Dell XPS 16 9640 | |
| Moyenne Intel Core Ultra 5 325 (74747 - 86178, n=2) | |
| MSI Prestige 16 AI Evo B2HMG | |
| AIDA64 / Memory Write | |
| Samsung Galaxy Book6 Ultra | |
| Asus ZenBook S16 UM5606GA | |
| Dell XPS 16 Core Ultra 5 325 | |
| Lenovo Yoga Pro 9 16IAH10 RTX 5050 | |
| Moyenne Intel Core Ultra 5 325 (92966 - 107858, n=2) | |
| Dell XPS 16 9640 | |
| MSI Prestige 16 AI Evo B2HMG | |
| AIDA64 / Memory Latency | |
| Dell XPS 16 9640 | |
| MSI Prestige 16 AI Evo B2HMG | |
| Lenovo Yoga Pro 9 16IAH10 RTX 5050 | |
| Moyenne Intel Core Ultra 5 325 (102 - 108.4, n=2) | |
| Asus ZenBook S16 UM5606GA | |
| Dell XPS 16 Core Ultra 5 325 | |
| Samsung Galaxy Book6 Ultra | |
* ... Moindre est la valeur, meilleures sont les performances
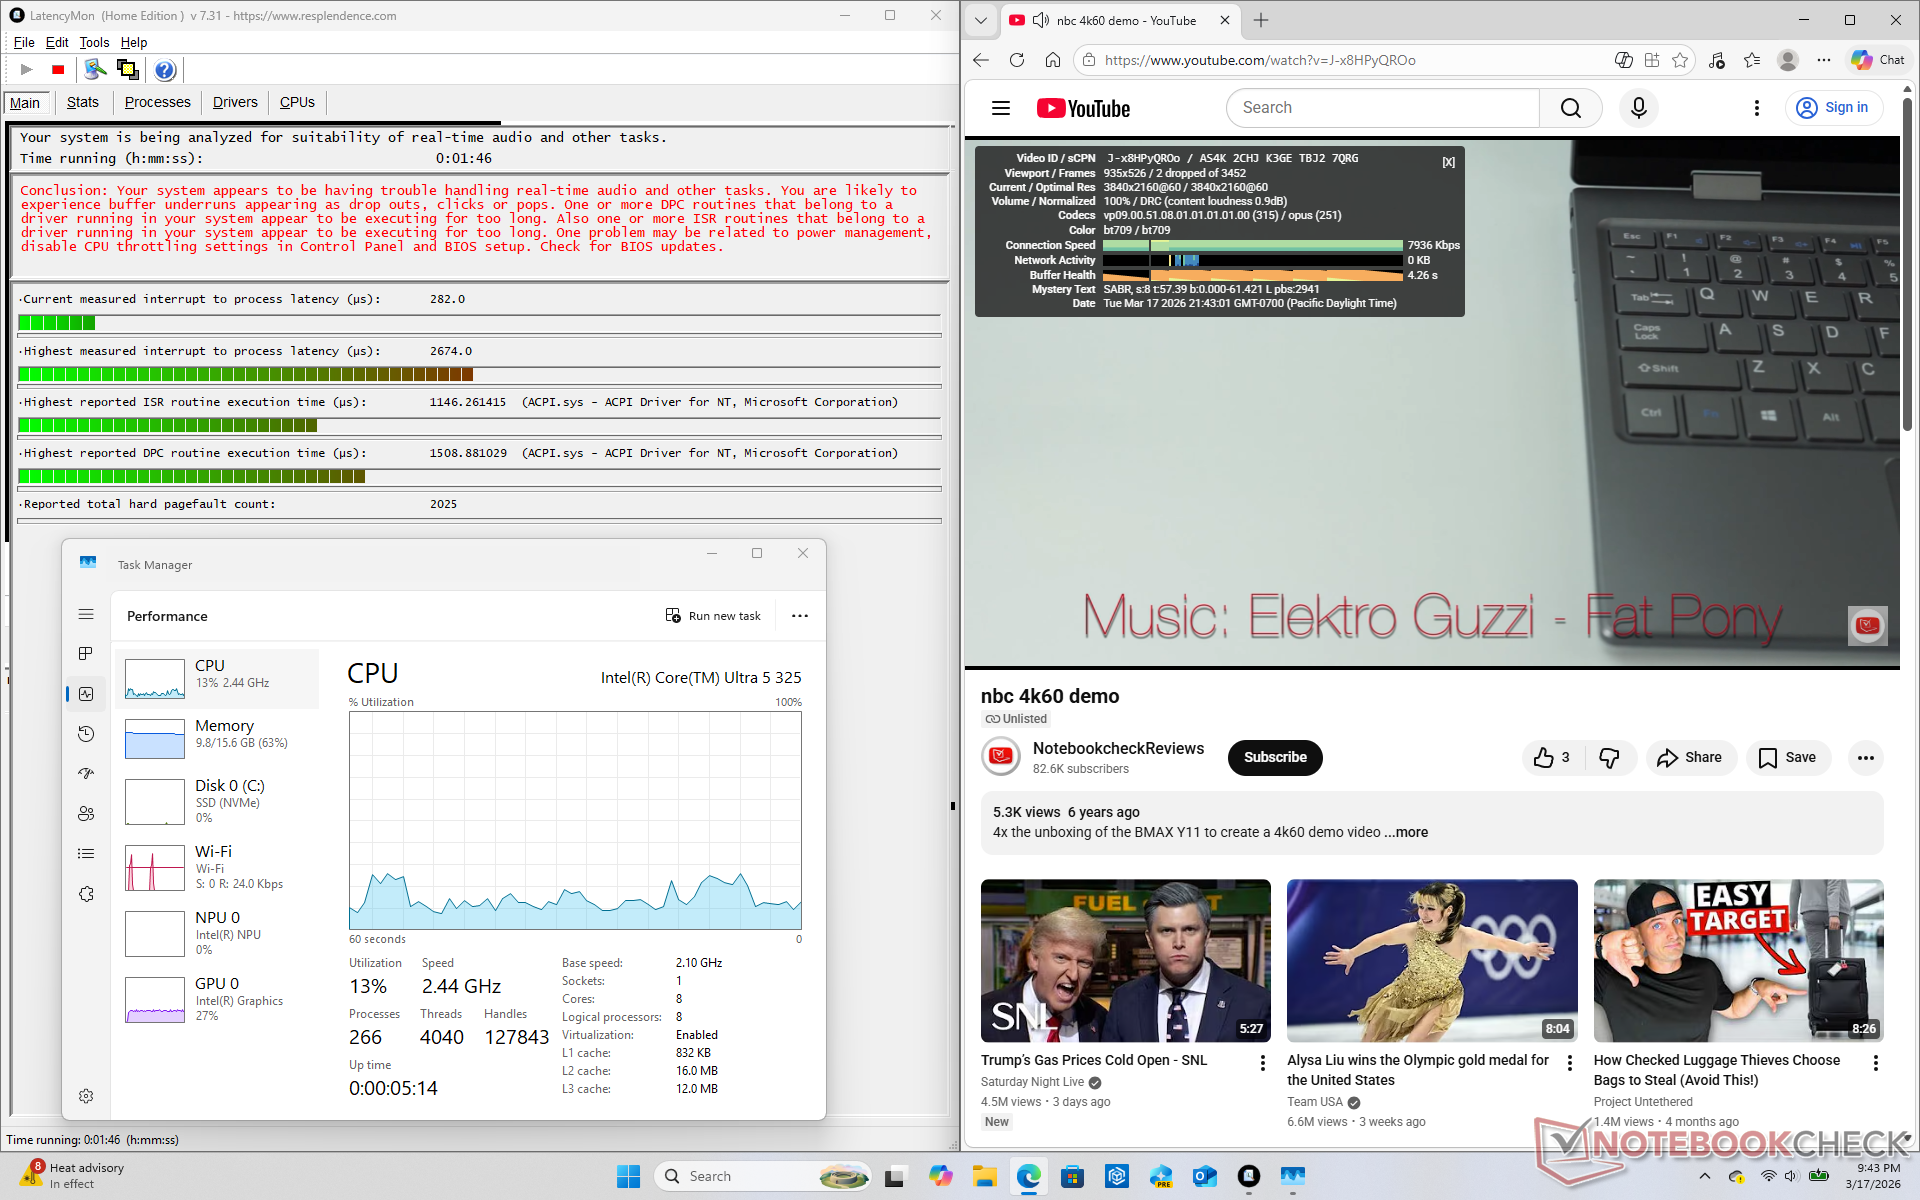
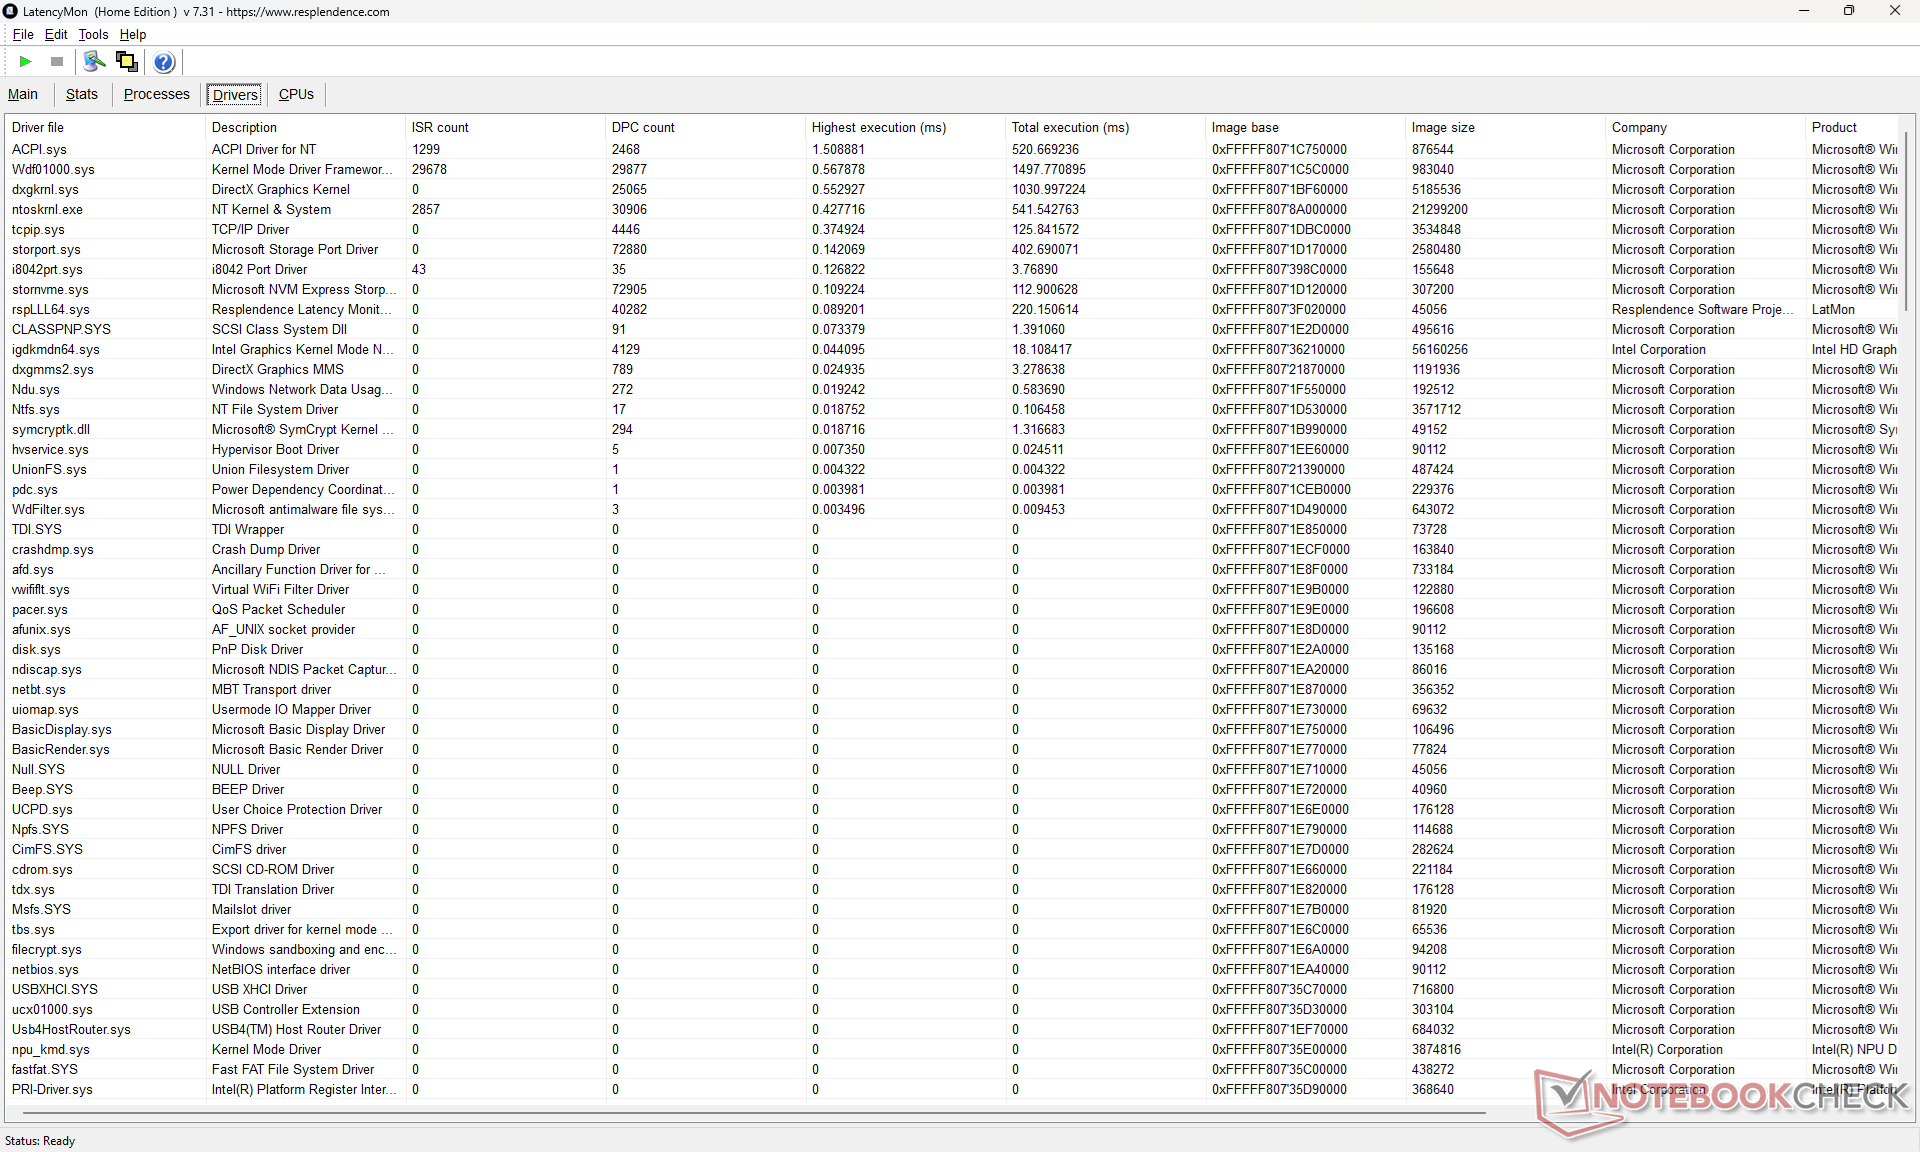
Latence DPC
| DPC Latencies / LatencyMon - interrupt to process latency (max), Web, Youtube, Prime95 | |
| Lenovo Yoga Pro 9 16IAH10 RTX 5050 | |
| Dell XPS 16 Core Ultra 5 325 | |
| MSI Prestige 16 AI Evo B2HMG | |
| Dell XPS 16 9640 | |
| Samsung Galaxy Book6 Ultra | |
| Asus ZenBook S16 UM5606GA | |
* ... Moindre est la valeur, meilleures sont les performances
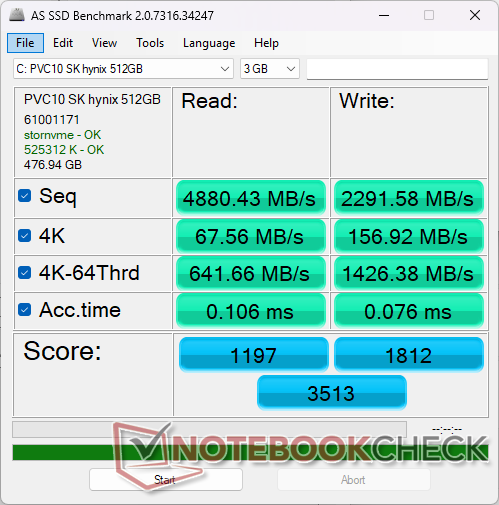
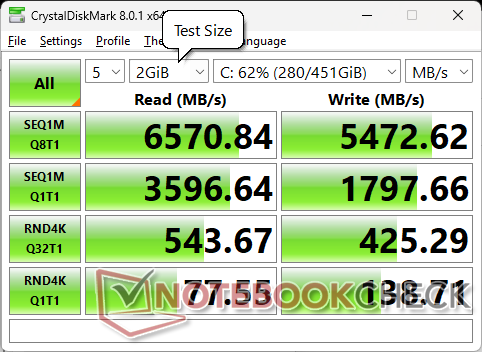
Dispositifs de stockage
Le SK Hynix PVC10 PCIe4 x4 NVMe SSD peut supporter des taux de transfert allant jusqu'à 6600 Mo/s sans aucun problème d'étranglement, comme le montrent les résultats du test en boucle DiskSpd ci-dessous. Notez que les configurations haut de gamme du XPS 16 sont équipées de disques SSD PCIe5 en option.


| Drive Performance rating - Percent | |
| MSI Prestige 16 AI Evo B2HMG | |
| Dell XPS 16 9640 | |
| Lenovo Yoga Pro 9 16IAH10 RTX 5050 | |
| Asus ZenBook S16 UM5606GA | |
| Samsung Galaxy Book6 Ultra | |
| Dell XPS 16 Core Ultra 5 325 | |
* ... Moindre est la valeur, meilleures sont les performances
Throttoir de disque : Boucle de lecture DiskSpd, profondeur de la file d'attente 8
Performance du GPU
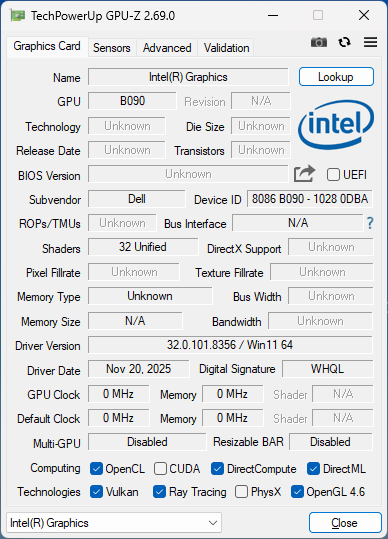
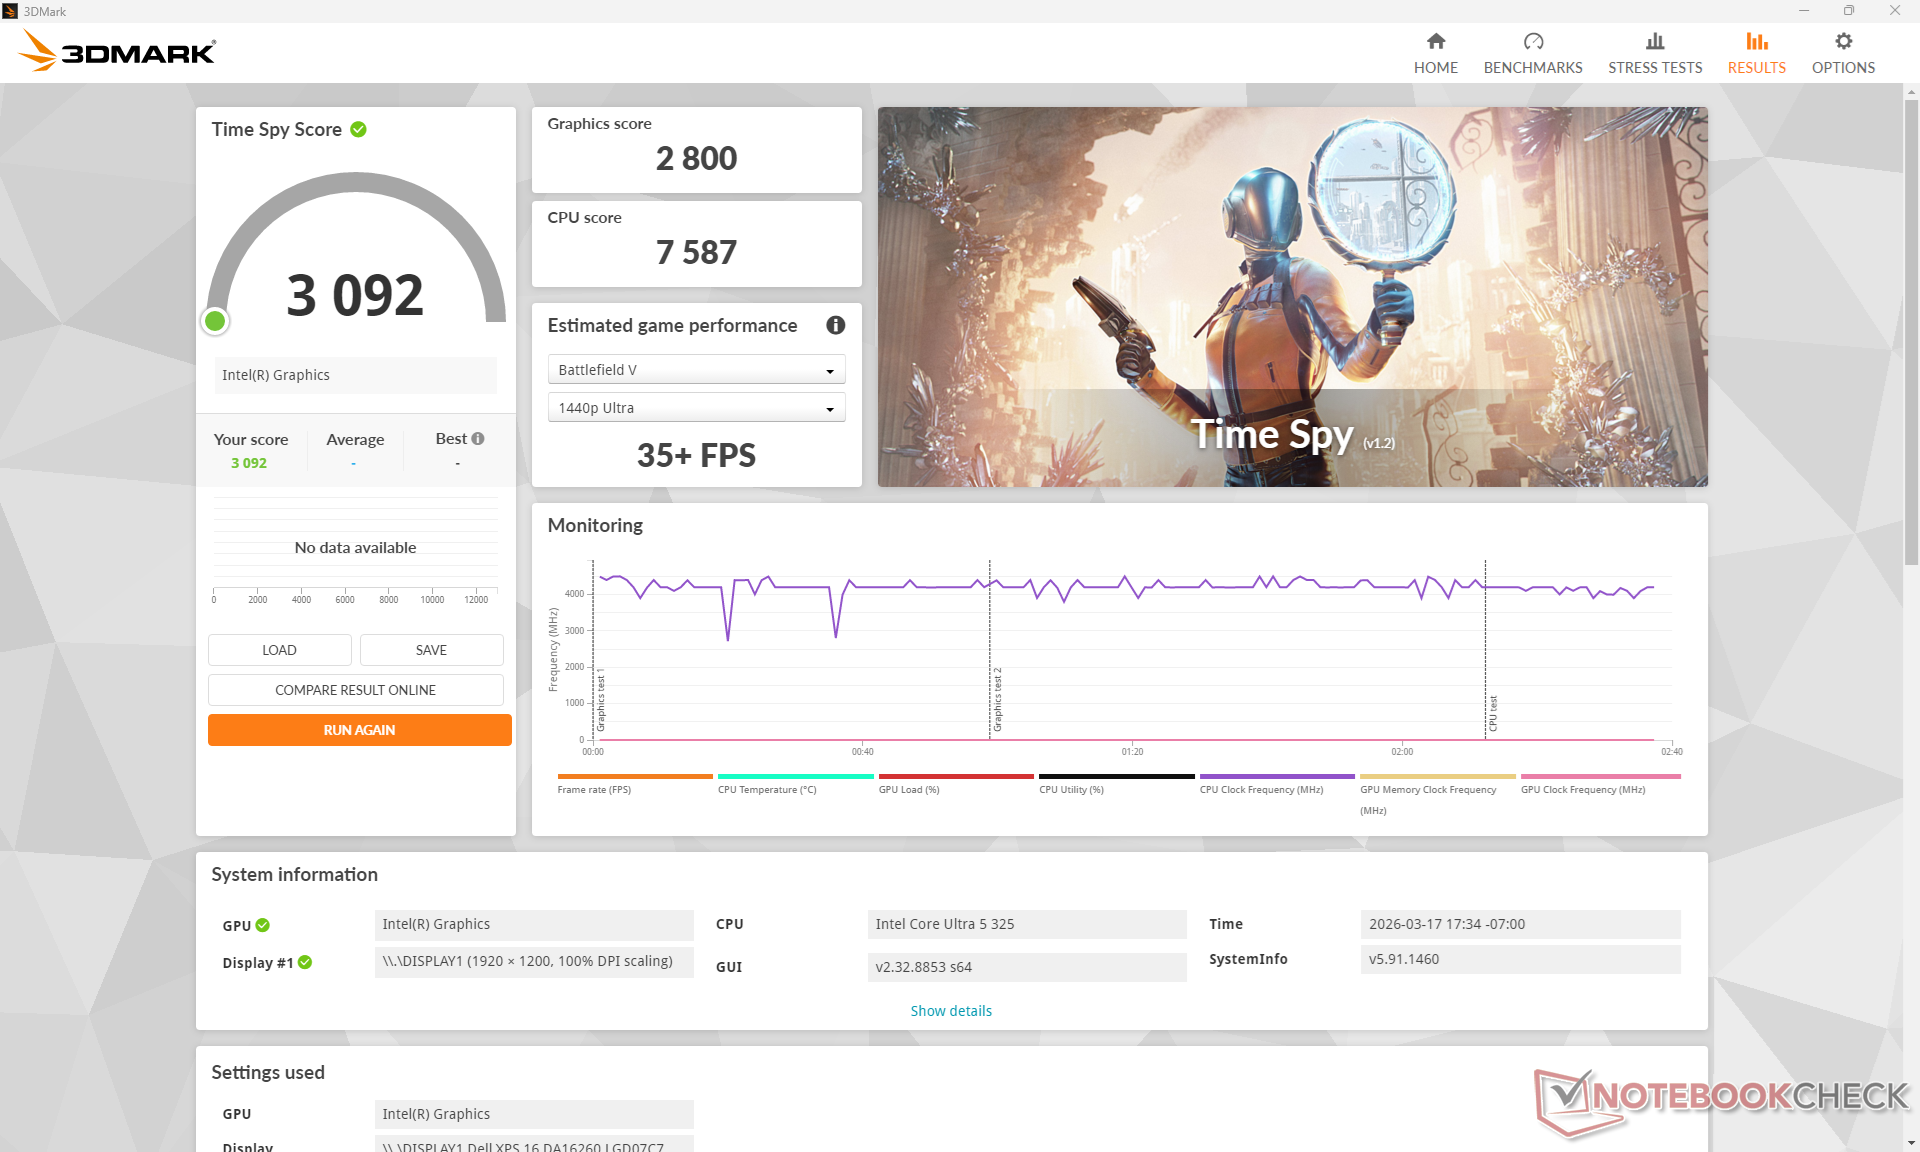
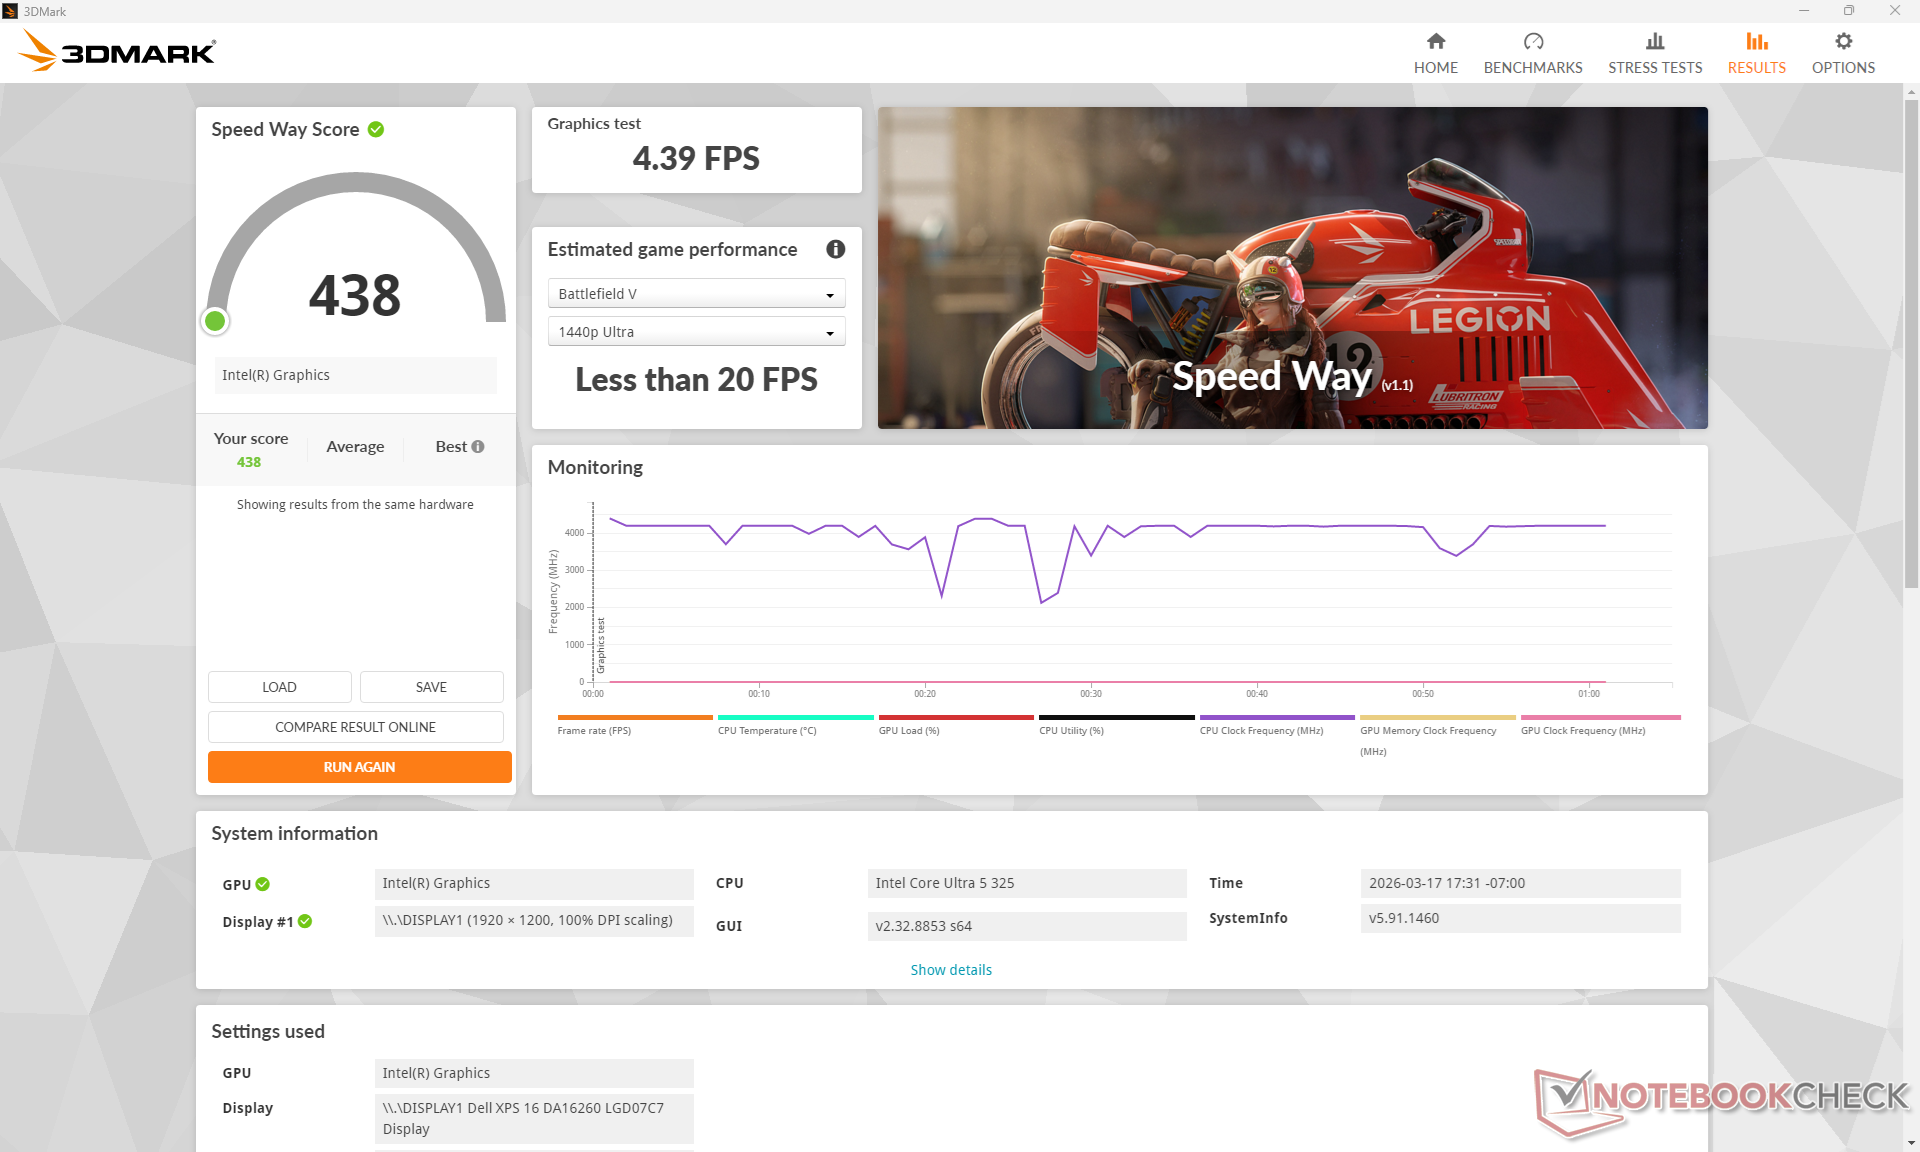
Le Panther Lake Xe3 4 est l'une des solutions intégrées les plus lentes de la gamme Panther Lake. Les niveaux de performance sont très similaires à ceux de l'ancienne solution de deux générations Arc 8 vieille de deux générations, ou à la AMD Radeon 680M. Le passage à la configuration Core Ultra 7 355 n'améliorera pas les performances graphiques de manière significative, car le CPU utilise le même iGPU Xe3 4. Au lieu de cela, les utilisateurs doivent passer à la configuration Core Ultra X7 358H avec iGPU Xe3 4 intégré Arc B390 pour bénéficier d'une augmentation des performances de 2,5 fois, comme le montrent les tableaux ci-dessous.
| Profil de puissance | Score graphique | Score physique | Score combiné |
| Mode Performance | 6815 | 17062 | 2174 |
| Mode équilibré | 6633 (-3%) | 16820 (-1%) | 2039 (-6%) |
| Alimentation par batterie | 6480 (-5%) | 17601 (+3%) | 2140 (-2%) |
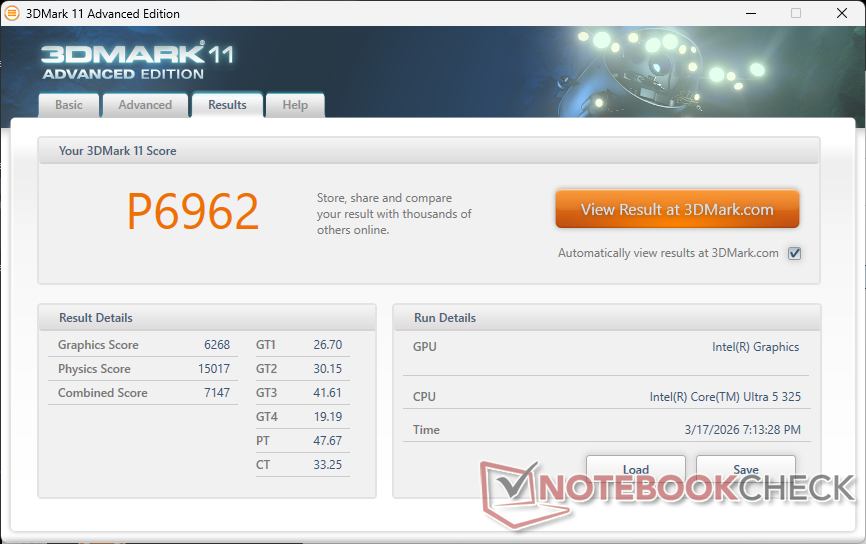
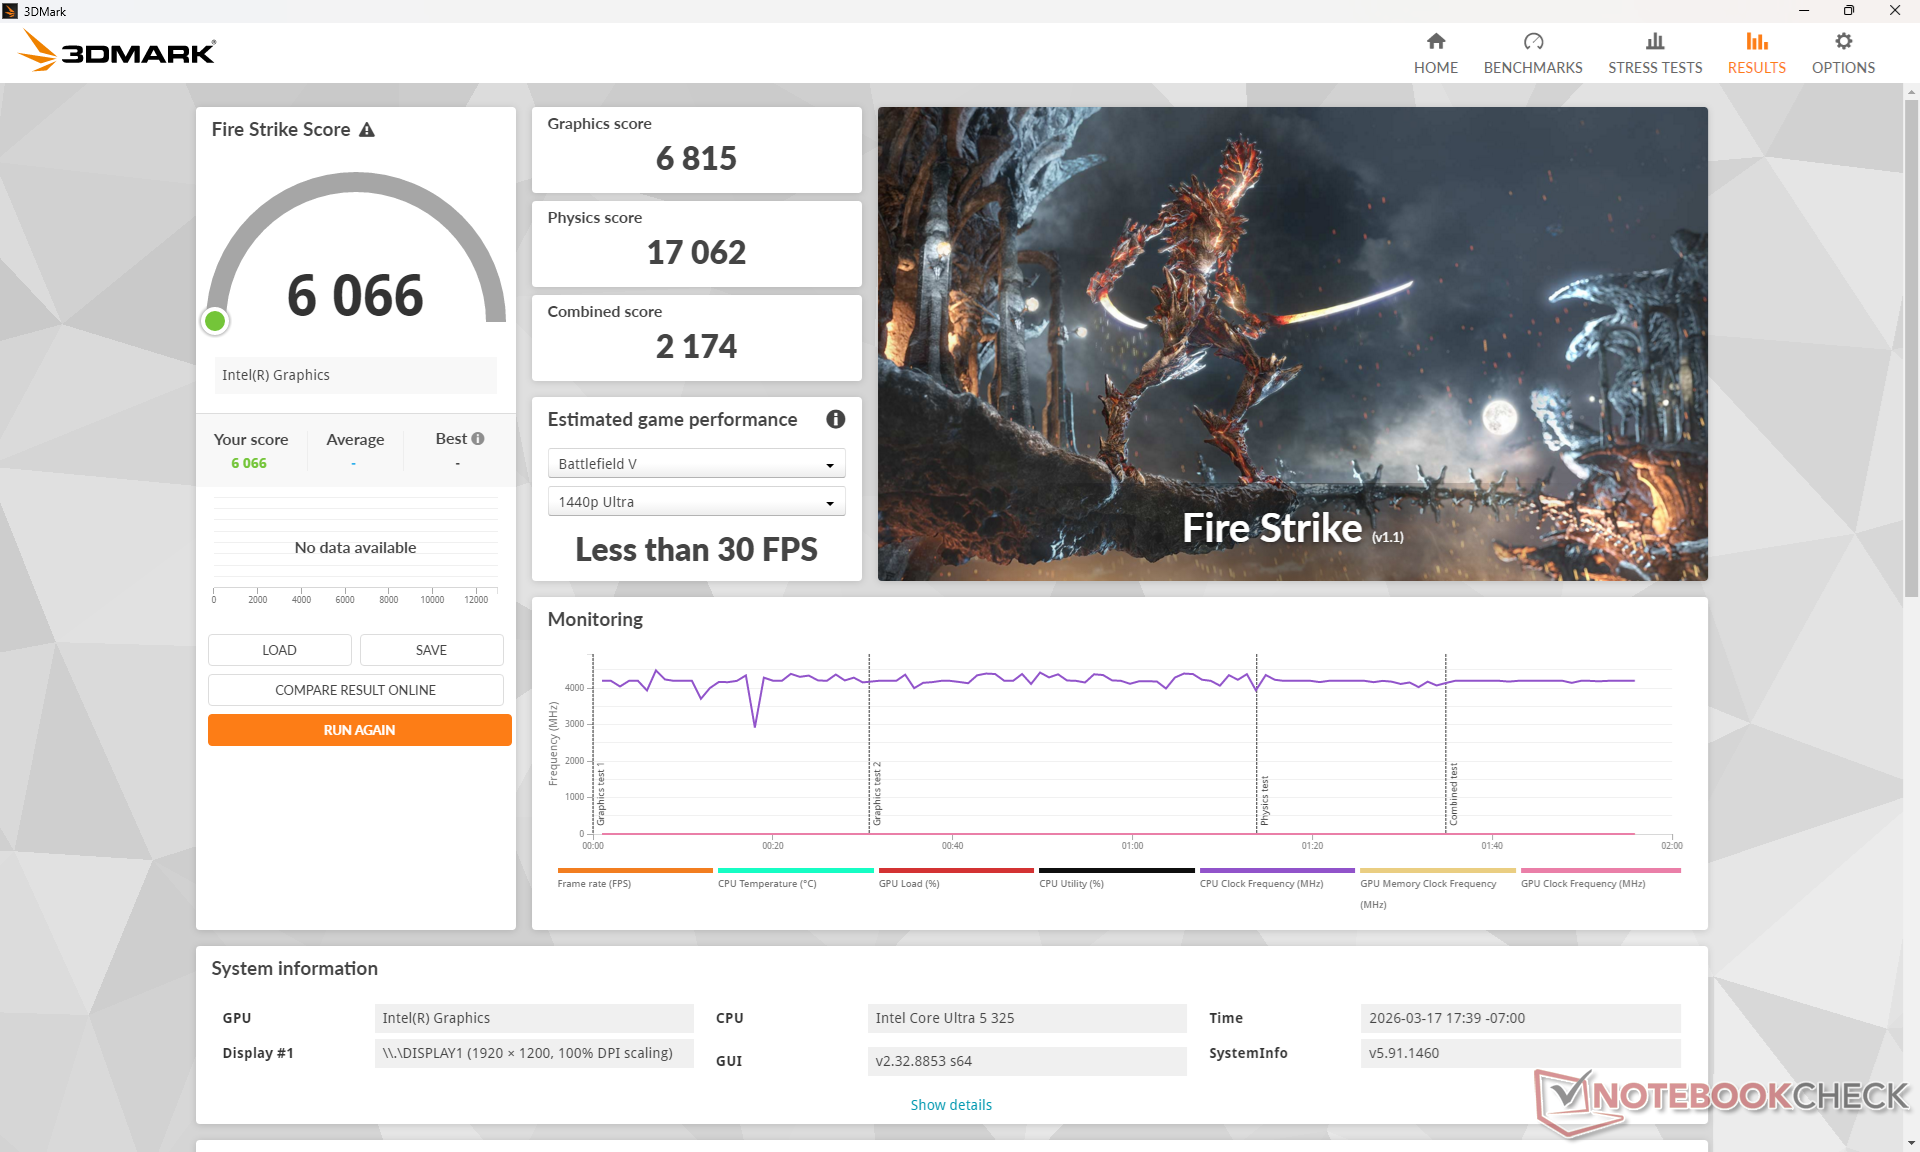
| 3DMark 11 Performance | 6962 points | |
| 3DMark Cloud Gate Standard Score | 26419 points | |
| 3DMark Fire Strike Score | 6066 points | |
| 3DMark Time Spy Score | 3092 points | |
Aide | ||
* ... Moindre est la valeur, meilleures sont les performances
| Performance rating - Percent | |
| Samsung Galaxy Book6 Ultra | |
| Lenovo Yoga Pro 9 16IAH10 RTX 5050 | |
| Dell XPS 16 9640 | |
| Asus ZenBook S16 UM5606GA | |
| MSI Prestige 16 AI Evo B2HMG | |
| Dell XPS 16 Core Ultra 5 325 | |
| Cyberpunk 2077 - 1920x1080 Ultra Preset (FSR off) | |
| Samsung Galaxy Book6 Ultra | |
| Lenovo Yoga Pro 9 16IAH10 RTX 5050 | |
| Dell XPS 16 9640 | |
| MSI Prestige 16 AI Evo B2HMG | |
| Asus ZenBook S16 UM5606GA | |
| Dell XPS 16 Core Ultra 5 325 | |
| Baldur's Gate 3 - 1920x1080 Ultra Preset AA:T | |
| Samsung Galaxy Book6 Ultra | |
| Lenovo Yoga Pro 9 16IAH10 RTX 5050 | |
| Dell XPS 16 9640 | |
| Asus ZenBook S16 UM5606GA | |
| MSI Prestige 16 AI Evo B2HMG | |
| Dell XPS 16 Core Ultra 5 325 | |
| GTA V - 1920x1080 Highest AA:4xMSAA + FX AF:16x | |
| Samsung Galaxy Book6 Ultra | |
| Lenovo Yoga Pro 9 16IAH10 RTX 5050 | |
| Dell XPS 16 9640 | |
| Asus ZenBook S16 UM5606GA | |
| Dell XPS 16 Core Ultra 5 325 | |
| MSI Prestige 16 AI Evo B2HMG | |
| Final Fantasy XV Benchmark - 1920x1080 High Quality | |
| Samsung Galaxy Book6 Ultra | |
| Lenovo Yoga Pro 9 16IAH10 RTX 5050 | |
| Dell XPS 16 9640 | |
| MSI Prestige 16 AI Evo B2HMG | |
| Asus ZenBook S16 UM5606GA | |
| Dell XPS 16 Core Ultra 5 325 | |
| Strange Brigade - 1920x1080 ultra AA:ultra AF:16 | |
| Samsung Galaxy Book6 Ultra | |
| Lenovo Yoga Pro 9 16IAH10 RTX 5050 | |
| Dell XPS 16 9640 | |
| MSI Prestige 16 AI Evo B2HMG | |
| Asus ZenBook S16 UM5606GA | |
| Dell XPS 16 Core Ultra 5 325 | |
| Dota 2 Reborn - 1920x1080 ultra (3/3) best looking | |
| Lenovo Yoga Pro 9 16IAH10 RTX 5050 | |
| Samsung Galaxy Book6 Ultra | |
| Dell XPS 16 9640 | |
| Asus ZenBook S16 UM5606GA | |
| MSI Prestige 16 AI Evo B2HMG | |
| Dell XPS 16 Core Ultra 5 325 | |
| X-Plane 11.11 - 1920x1080 high (fps_test=3) | |
| Lenovo Yoga Pro 9 16IAH10 RTX 5050 | |
| Dell XPS 16 9640 | |
| Dell XPS 16 9640 | |
| Samsung Galaxy Book6 Ultra | |
| Asus ZenBook S16 UM5606GA | |
| MSI Prestige 16 AI Evo B2HMG | |
| Dell XPS 16 Core Ultra 5 325 | |
Cyberpunk 2077 ultra FPS Chart
| Bas | Moyen | Élevé | Ultra | |
|---|---|---|---|---|
| GTA V (2015) | 162.4 | 158.1 | 51.8 | 20.8 |
| Dota 2 Reborn (2015) | 102.9 | 89 | 72.6 | 68.4 |
| Final Fantasy XV Benchmark (2018) | 66.3 | 35.4 | 25.1 | |
| X-Plane 11.11 (2018) | 37.8 | 30.6 | 22.9 | |
| Strange Brigade (2018) | 107.3 | 38.2 | 35.9 | 43.3 |
| Baldur's Gate 3 (2023) | 27.4 | 22.2 | 19 | 18.7 |
| Cyberpunk 2077 (2023) | 35.2 | 27 | 23.8 | 19.9 |
| F1 24 (2024) | 55.6 | 52.7 | 40.8 | 13.2 |
Émissions - Plus silencieuses, mais encore assez chaudes
Bruit du système
Le bruit du ventilateur est beaucoup plus silencieux que celui du Dell 16 Premium sortant dans pratiquement tous les scénarios. Le système est capable de rester silencieux ou inaudible pendant des périodes plus longues que la plupart des autres ordinateurs portables. Par exemple, le bruit du ventilateur n'est pas audible lors de l'exécution de 3DMark06 jusqu'à plus de deux tiers de la première scène de référence, alors que le bruit se fait entendre beaucoup plus tôt et plus fort sur le ZenBook S16.
Le bruit du ventilateur dans les jeux se situe entre 38 et 44 dB(A), ce qui reste plus silencieux que le modèle de l'année dernière ou que l'Asus susmentionné dans des conditions similaires.


Degré de la nuisance sonore
| Au repos |
| 22.9 / 22.9 / 23.9 dB(A) |
| Fortement sollicité |
| 34.8 / 43.3 dB(A) |
 | ||
30 dB silencieux 40 dB(A) audible 50 dB(A) bruyant |
||
min: | ||
| Dell XPS 16 Core Ultra 5 325 Ultra 5 325, Intel Graphics 4 Xe3 PTL | Dell XPS 16 9640 Ultra 7 155H, GeForce RTX 4070 Laptop GPU | Lenovo Yoga Pro 9 16IAH10 RTX 5050 Ultra 9 285H, GeForce RTX 5050 Laptop | Samsung Galaxy Book6 Ultra Ultra 7 356H, GeForce RTX 5070 Laptop | Asus ZenBook S16 UM5606GA Ryzen AI 9 465, Radeon 880M | MSI Prestige 16 AI Evo B2HMG Ultra 9 285H, Arc 140T | |
|---|---|---|---|---|---|---|
| Noise | -11% | -12% | -12% | -15% | -5% | |
| arrêt / environnement * (dB) | 22.8 | 24.5 -7% | 24.6 -8% | 25.1 -10% | 24.9 -9% | 23.6 -4% |
| Idle Minimum * (dB) | 22.9 | 24.5 -7% | 24.6 -7% | 25.1 -10% | 24.9 -9% | 23.6 -3% |
| Idle Average * (dB) | 22.9 | 24.5 -7% | 24.6 -7% | 25.1 -10% | 24.9 -9% | 23.6 -3% |
| Idle Maximum * (dB) | 23.9 | 27.5 -15% | 26.8 -12% | 25.1 -5% | 24.9 -4% | 26.2 -10% |
| Load Average * (dB) | 34.8 | 39.6 -14% | 32.8 6% | 36.9 -6% | 45.7 -31% | 37.1 -7% |
| Cyberpunk 2077 ultra * (dB) | 38 | 51.8 -36% | 48.5 -28% | 49 -29% | 42.1 -11% | |
| Load Maximum * (dB) | 43.3 | 49.7 -15% | 51.8 -20% | 48.5 -12% | 50.4 -16% | 42.1 3% |
| Witcher 3 ultra * (dB) | 49.7 |
* ... Moindre est la valeur, meilleures sont les performances
Température
Les températures de surface sont plus élevées que prévu, d'autant plus que le nouveau XPS 16 n'est pas équipé d'une carte graphique discrète. Les points chauds peuvent atteindre plus de 43°C lors de l'exécution de charges exigeantes comme les jeux, contre seulement 37°C sur le modèle plus lourd de l'année dernière Dell 16 Premium plus lourd de l'année dernière, équipé d'une carte graphique discrète GeForce RTX 5070.


(±) La température maximale du côté supérieur est de 43.8 °C / 111 F, par rapport à la moyenne de 36.8 °C / 98 F, allant de 21 à 71 °C pour la classe Multimedia.
(±) Le fond chauffe jusqu'à un maximum de 42 °C / 108 F, contre une moyenne de 39.1 °C / 102 F
(+) En utilisation inactive, la température moyenne du côté supérieur est de 22.4 °C / 72 F, par rapport à la moyenne du dispositif de 31.3 °C / 88 F.
(±) 3: The average temperature for the upper side is 35.3 °C / 96 F, compared to the average of 31.3 °C / 88 F for the class Multimedia.
(+) Les repose-poignets et le pavé tactile sont plus froids que la température de la peau avec un maximum de 31.6 °C / 88.9 F et sont donc froids au toucher.
(-) La température moyenne de la zone de l'appui-paume de dispositifs similaires était de 28.7 °C / 83.7 F (-2.9 °C / #-5.2 F).


| Dell XPS 16 Core Ultra 5 325 Ultra 5 325, Intel Graphics 4 Xe3 PTL | Dell XPS 16 9640 Ultra 7 155H, GeForce RTX 4070 Laptop GPU | Lenovo Yoga Pro 9 16IAH10 RTX 5050 Ultra 9 285H, GeForce RTX 5050 Laptop | Samsung Galaxy Book6 Ultra Ultra 7 356H, GeForce RTX 5070 Laptop | Asus ZenBook S16 UM5606GA Ryzen AI 9 465, Radeon 880M | MSI Prestige 16 AI Evo B2HMG Ultra 9 285H, Arc 140T | |
|---|---|---|---|---|---|---|
| Heat | -4% | -9% | -8% | -9% | -13% | |
| Maximum Upper Side * (°C) | 43.8 | 39.4 10% | 34.4 21% | 42.7 3% | 43.4 1% | 48.1 -10% |
| Maximum Bottom * (°C) | 42 | 36.9 12% | 41.4 1% | 49.1 -17% | 46.2 -10% | 51.6 -23% |
| Idle Upper Side * (°C) | 23.2 | 28.2 -22% | 28.6 -23% | 25.4 -9% | 26.5 -14% | 25.9 -12% |
| Idle Bottom * (°C) | 23.6 | 27.4 -16% | 31.8 -35% | 25.5 -8% | 27 -14% | 25.2 -7% |
* ... Moindre est la valeur, meilleures sont les performances
Test de stress
Le processeur peut devenir très chaud lorsqu'il est sollicité. Lors de l'exécution de Prime95, par exemple, le processeur monte à 3,6 GHz, 54 W et 100 C pendant quelques secondes avant de redescendre et de se stabiliser à 3,0 GHz et 32 W afin de maintenir une température plus raisonnable de 86 C. En comparaison, le Core Ultra 7 du Dell 16 Premium 2025 se stabilise à une température plus élevée de 93 C dans des conditions similaires. Il est probable que le nouveau XPS 16 se stabilise également à des températures supérieures à 90°C lorsqu'il est configuré avec le Core Ultra X7, beaucoup plus rapide, au lieu de notre Core Ultra 5.
Lorsque vous exécutez Cyberpunk 2077 pour représenter une charge CPU-GPU plus équilibrée, la température du cœur se stabilise à 89°C contre 75°C sur le XPS 16 2025 avec les cartes graphiques RTX GeForce plus rapides. Les températures de cœur généralement plus chaudes sont probablement responsables des températures de surface plus chaudes mentionnées ci-dessus.
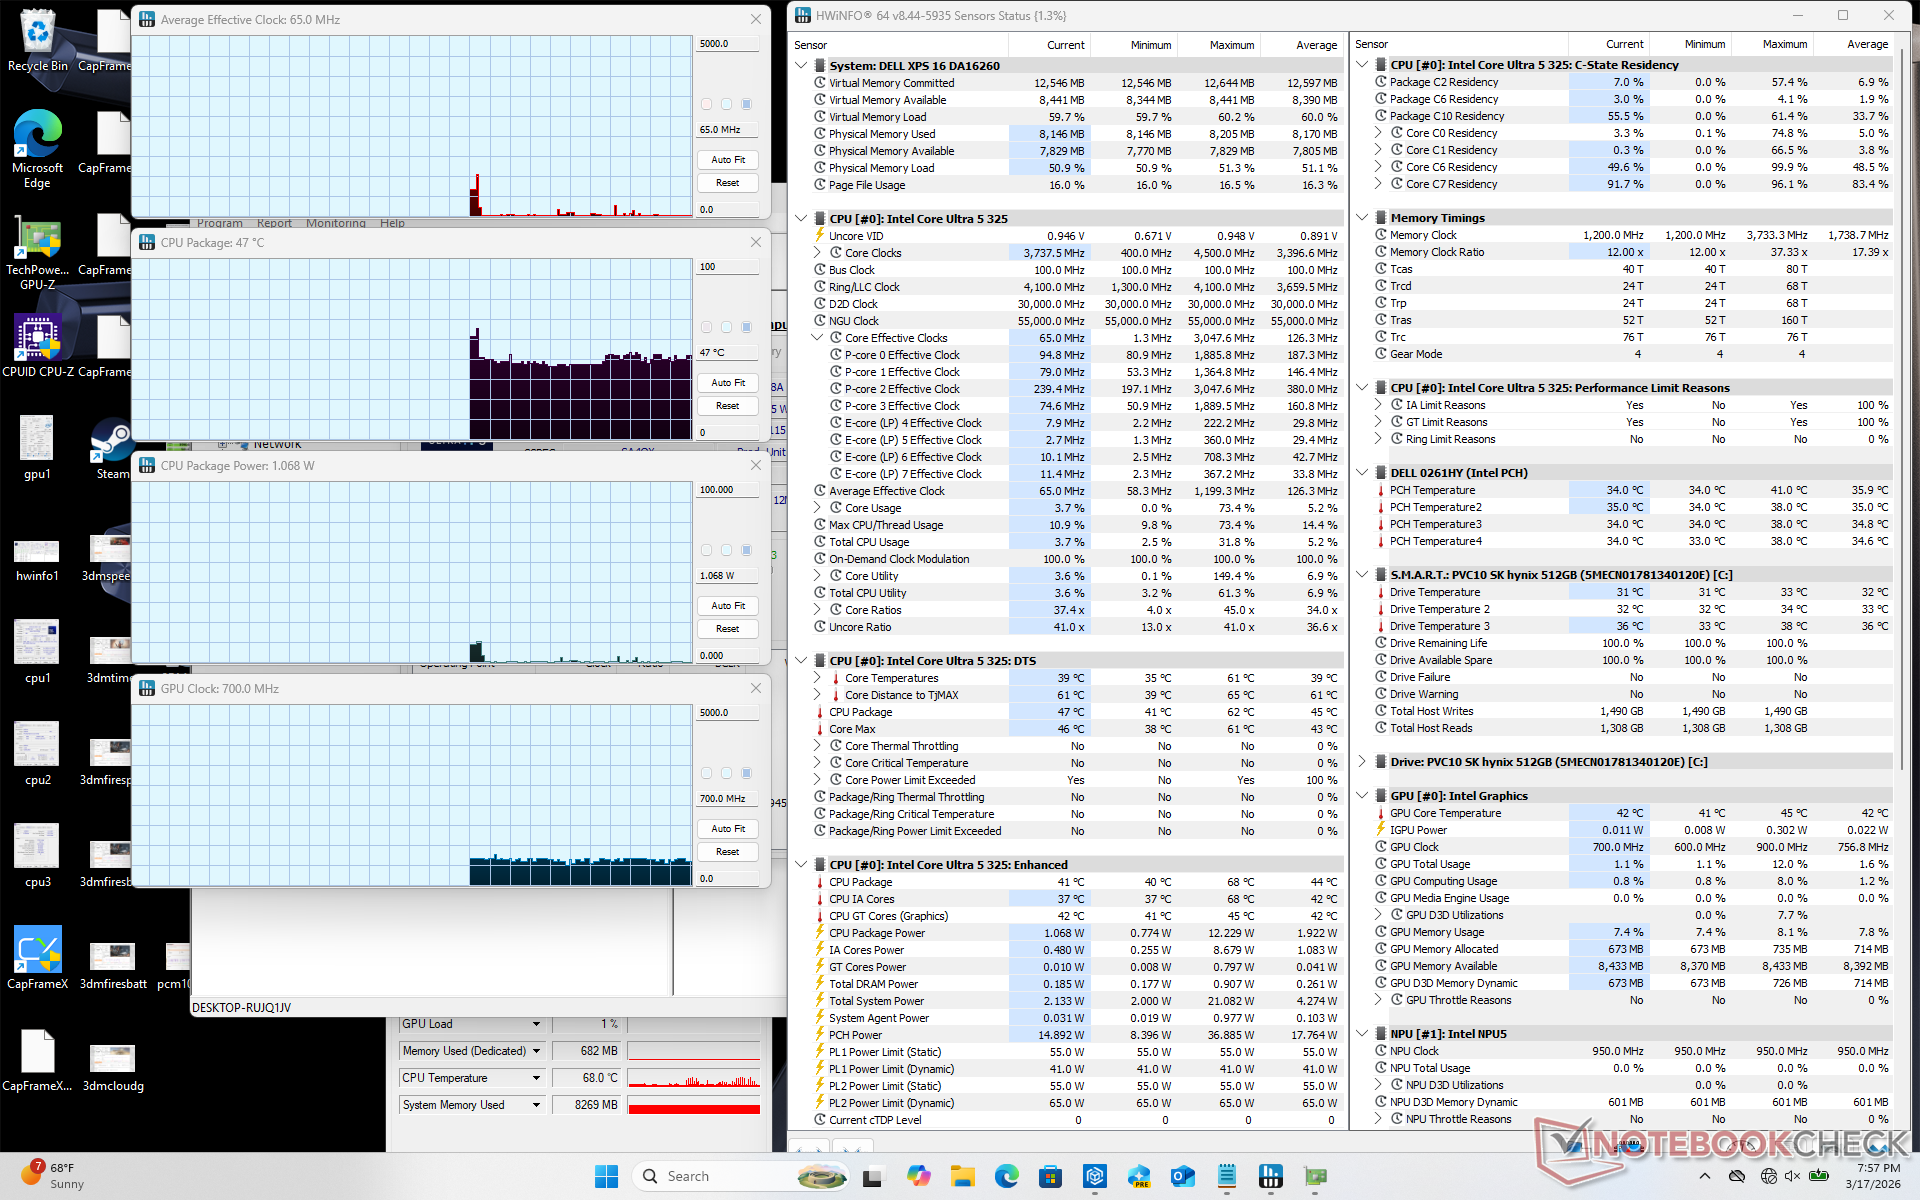
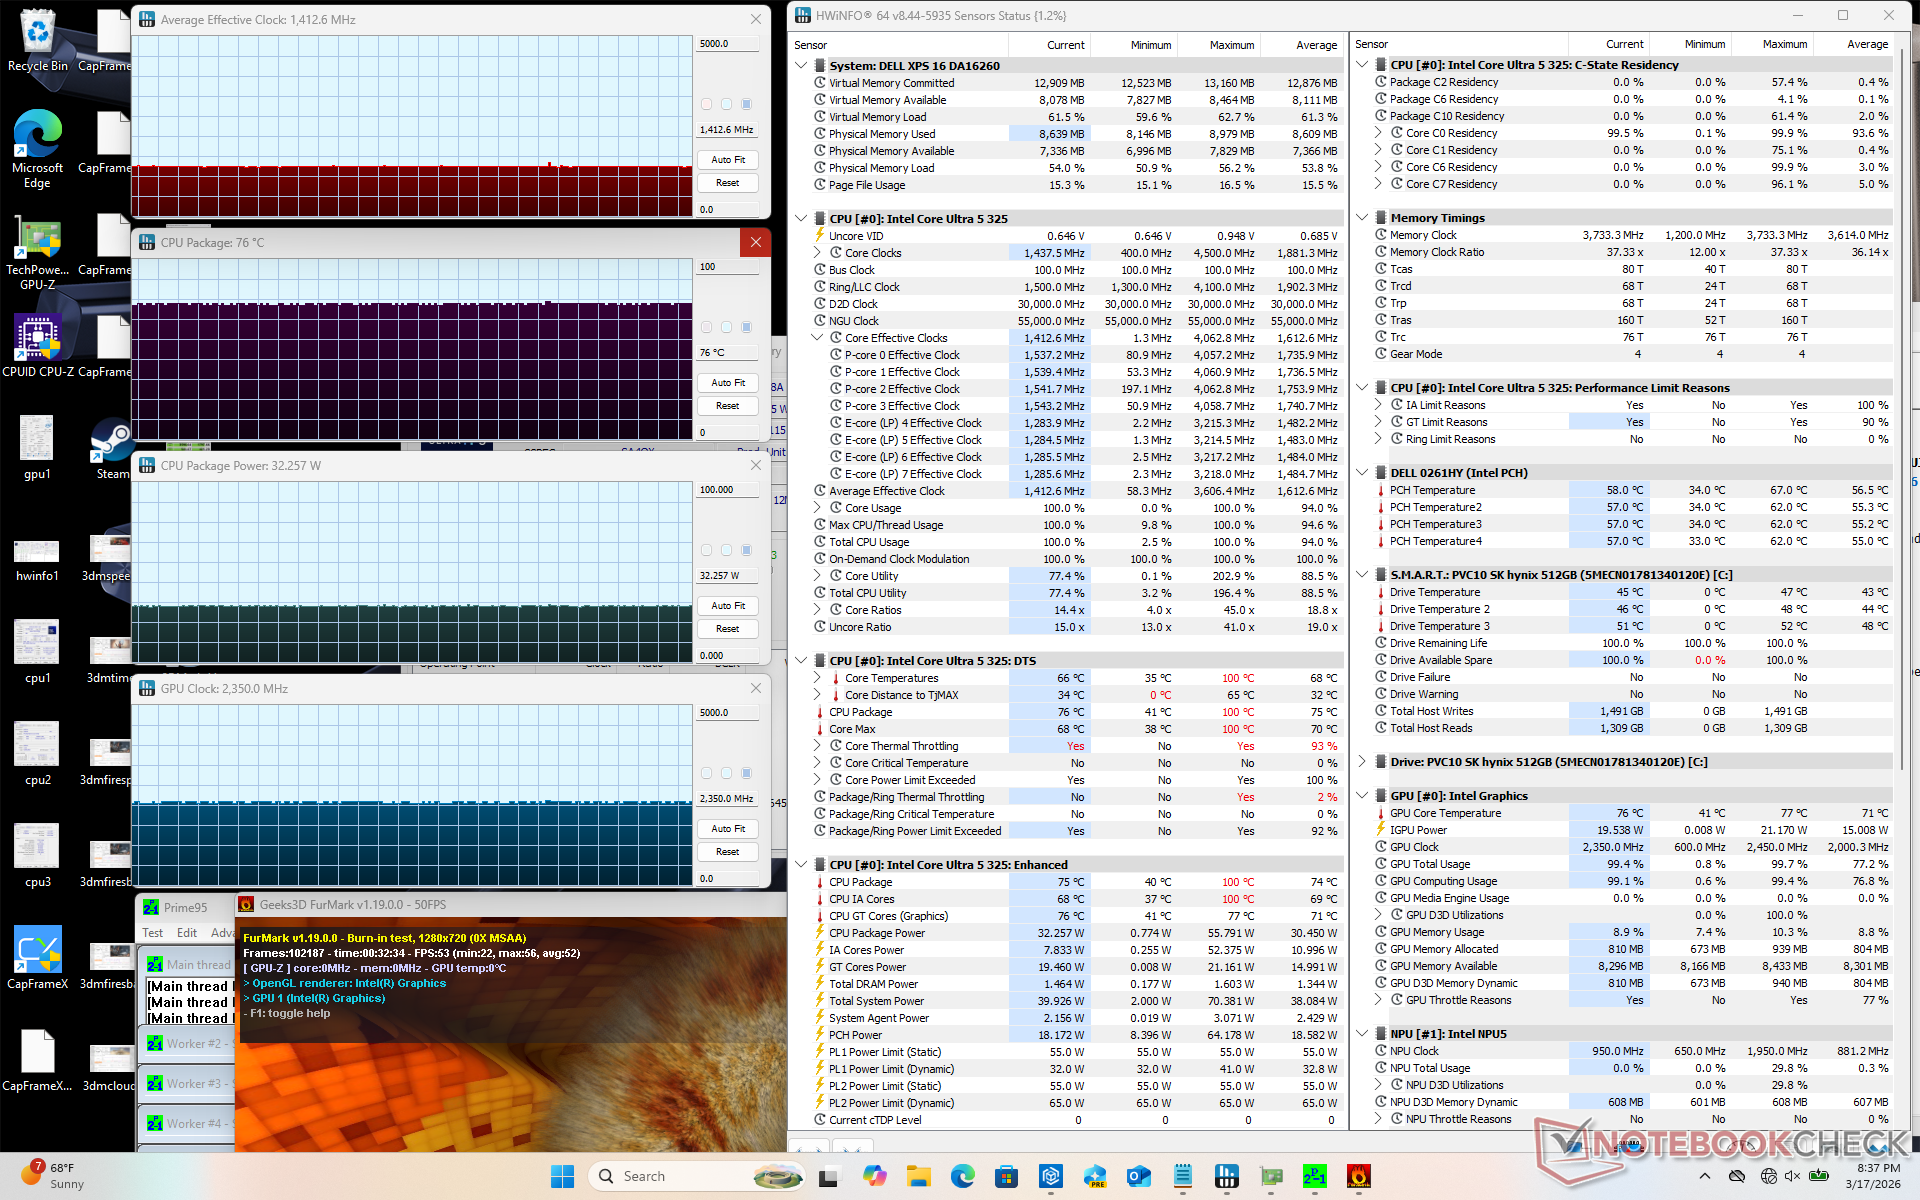
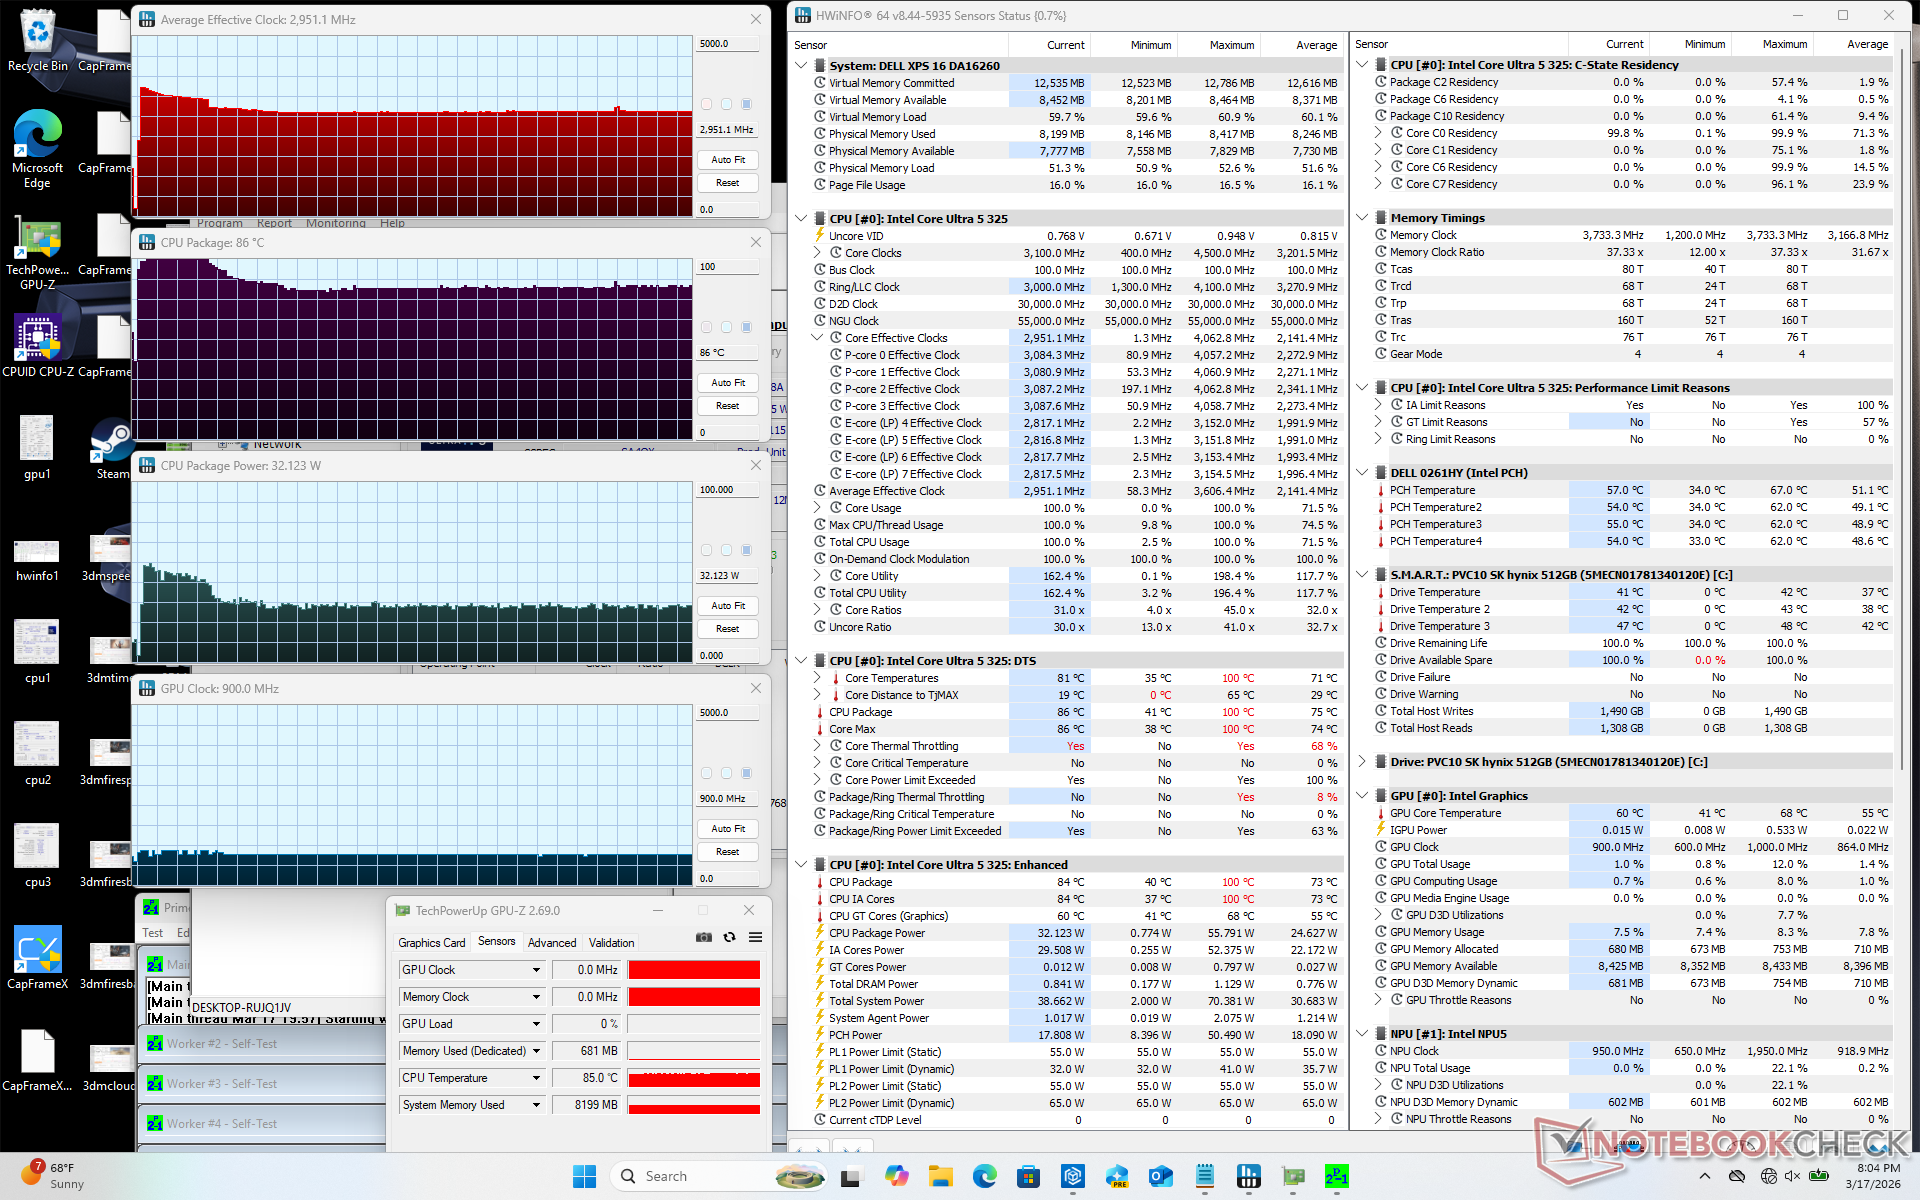
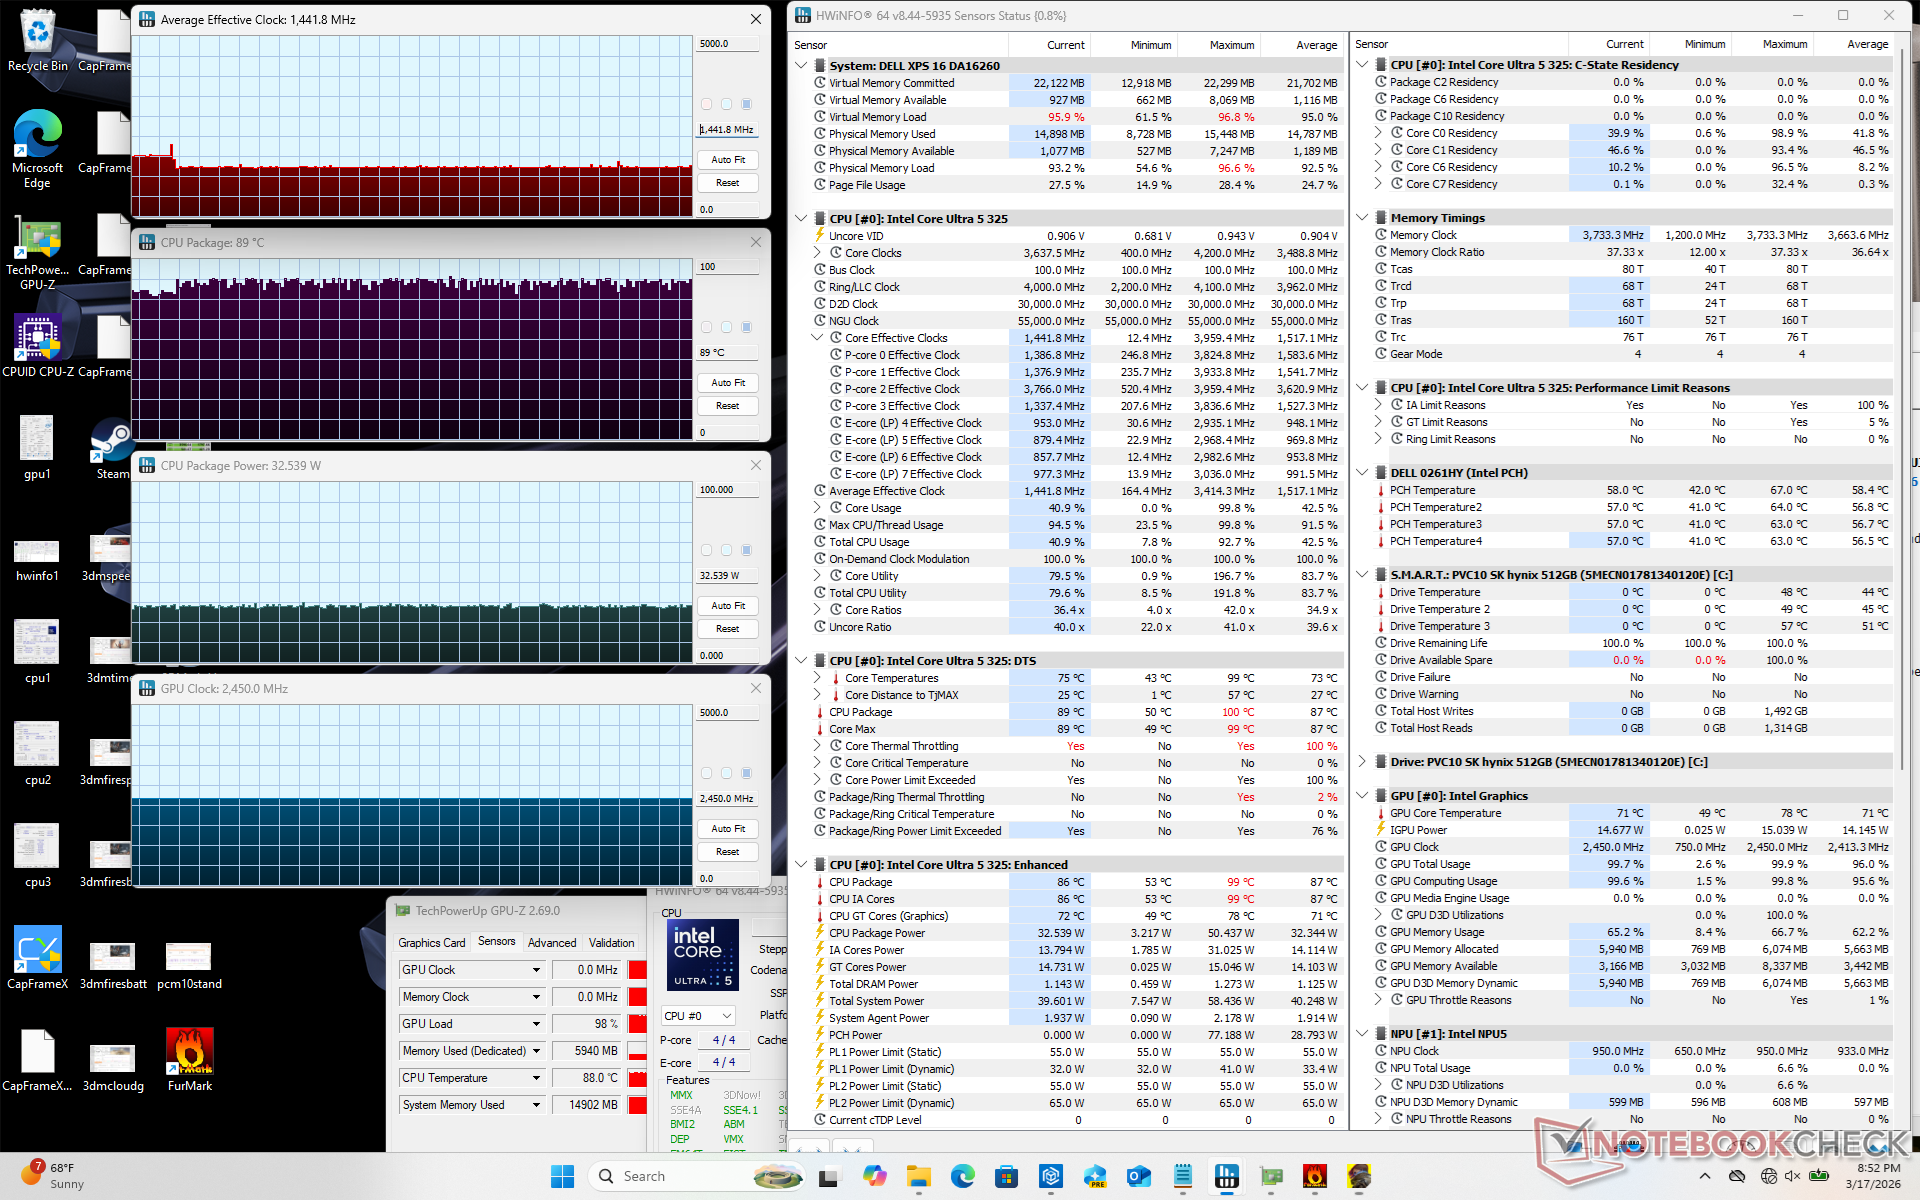
| Horloge moyenne du CPU (GHz) | Horloge du GPU (MHz) | Température moyenne du CPU (°C) | |
| Système au repos | -- | -- | 47 |
| Prime95 Stress | 3.0 | -- | 86 |
| Prime95 + FurMark Stress | 1.4 | 2350 | 76 |
| Cyberpunk 2077 Stress | 1.4 | 2450 | 89 |
Intervenants

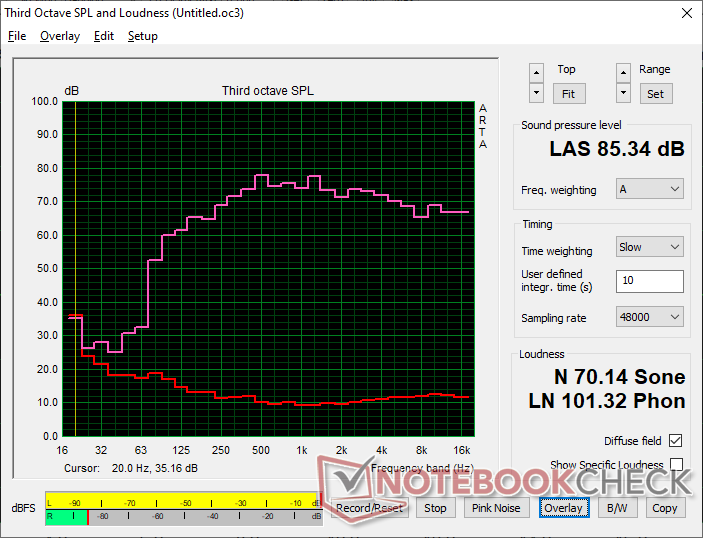
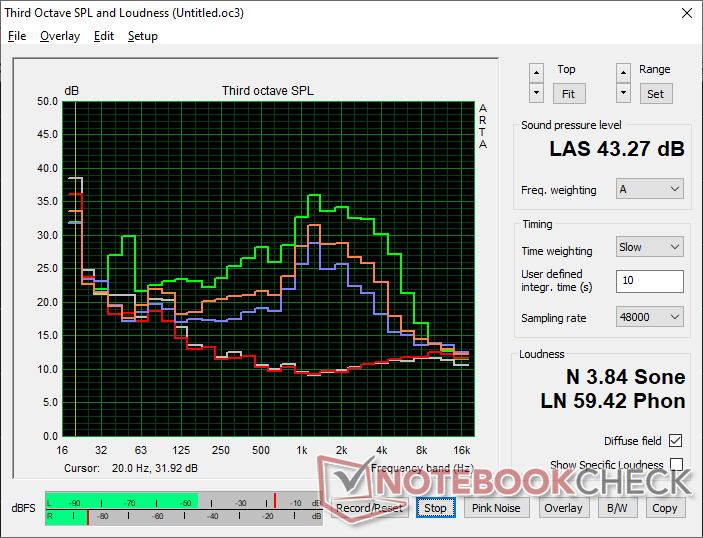
Dell XPS 16 Core Ultra 5 325 analyse audio
(+) | les haut-parleurs peuvent jouer relativement fort (85.3# dB)
Basses 100 - 315 Hz
(±) | basse réduite - en moyenne 6.1% inférieure à la médiane
(+) | les basses sont linéaires (5.6% delta à la fréquence précédente)
Médiums 400 - 2000 Hz
(+) | médiane équilibrée - seulement 3.2% de la médiane
(+) | les médiums sont linéaires (4.6% delta à la fréquence précédente)
Aiguës 2 - 16 kHz
(+) | des sommets équilibrés - à seulement 2.4% de la médiane
(+) | les aigus sont linéaires (3.3% delta à la fréquence précédente)
Globalement 100 - 16 000 Hz
(+) | le son global est linéaire (7% différence à la médiane)
Par rapport à la même classe
» 5% de tous les appareils testés de cette catégorie étaient meilleurs, 1% similaires, 94% pires
» Le meilleur avait un delta de 5%, la moyenne était de 17%, le pire était de 45%.
Par rapport à tous les appareils testés
» 1% de tous les appareils testés étaient meilleurs, 0% similaires, 99% pires
» Le meilleur avait un delta de 4%, la moyenne était de 24%, le pire était de 134%.
Apple MacBook Pro 16 2021 M1 Pro analyse audio
(+) | les haut-parleurs peuvent jouer relativement fort (84.7# dB)
Basses 100 - 315 Hz
(+) | bonne basse - seulement 3.8% loin de la médiane
(+) | les basses sont linéaires (5.2% delta à la fréquence précédente)
Médiums 400 - 2000 Hz
(+) | médiane équilibrée - seulement 1.3% de la médiane
(+) | les médiums sont linéaires (2.1% delta à la fréquence précédente)
Aiguës 2 - 16 kHz
(+) | des sommets équilibrés - à seulement 1.9% de la médiane
(+) | les aigus sont linéaires (2.7% delta à la fréquence précédente)
Globalement 100 - 16 000 Hz
(+) | le son global est linéaire (4.6% différence à la médiane)
Par rapport à la même classe
» 0% de tous les appareils testés de cette catégorie étaient meilleurs, 0% similaires, 100% pires
» Le meilleur avait un delta de 5%, la moyenne était de 17%, le pire était de 45%.
Par rapport à tous les appareils testés
» 0% de tous les appareils testés étaient meilleurs, 0% similaires, 100% pires
» Le meilleur avait un delta de 4%, la moyenne était de 24%, le pire était de 134%.
Gestion de l'énergie - Panther Lake est le roi de l'efficacité
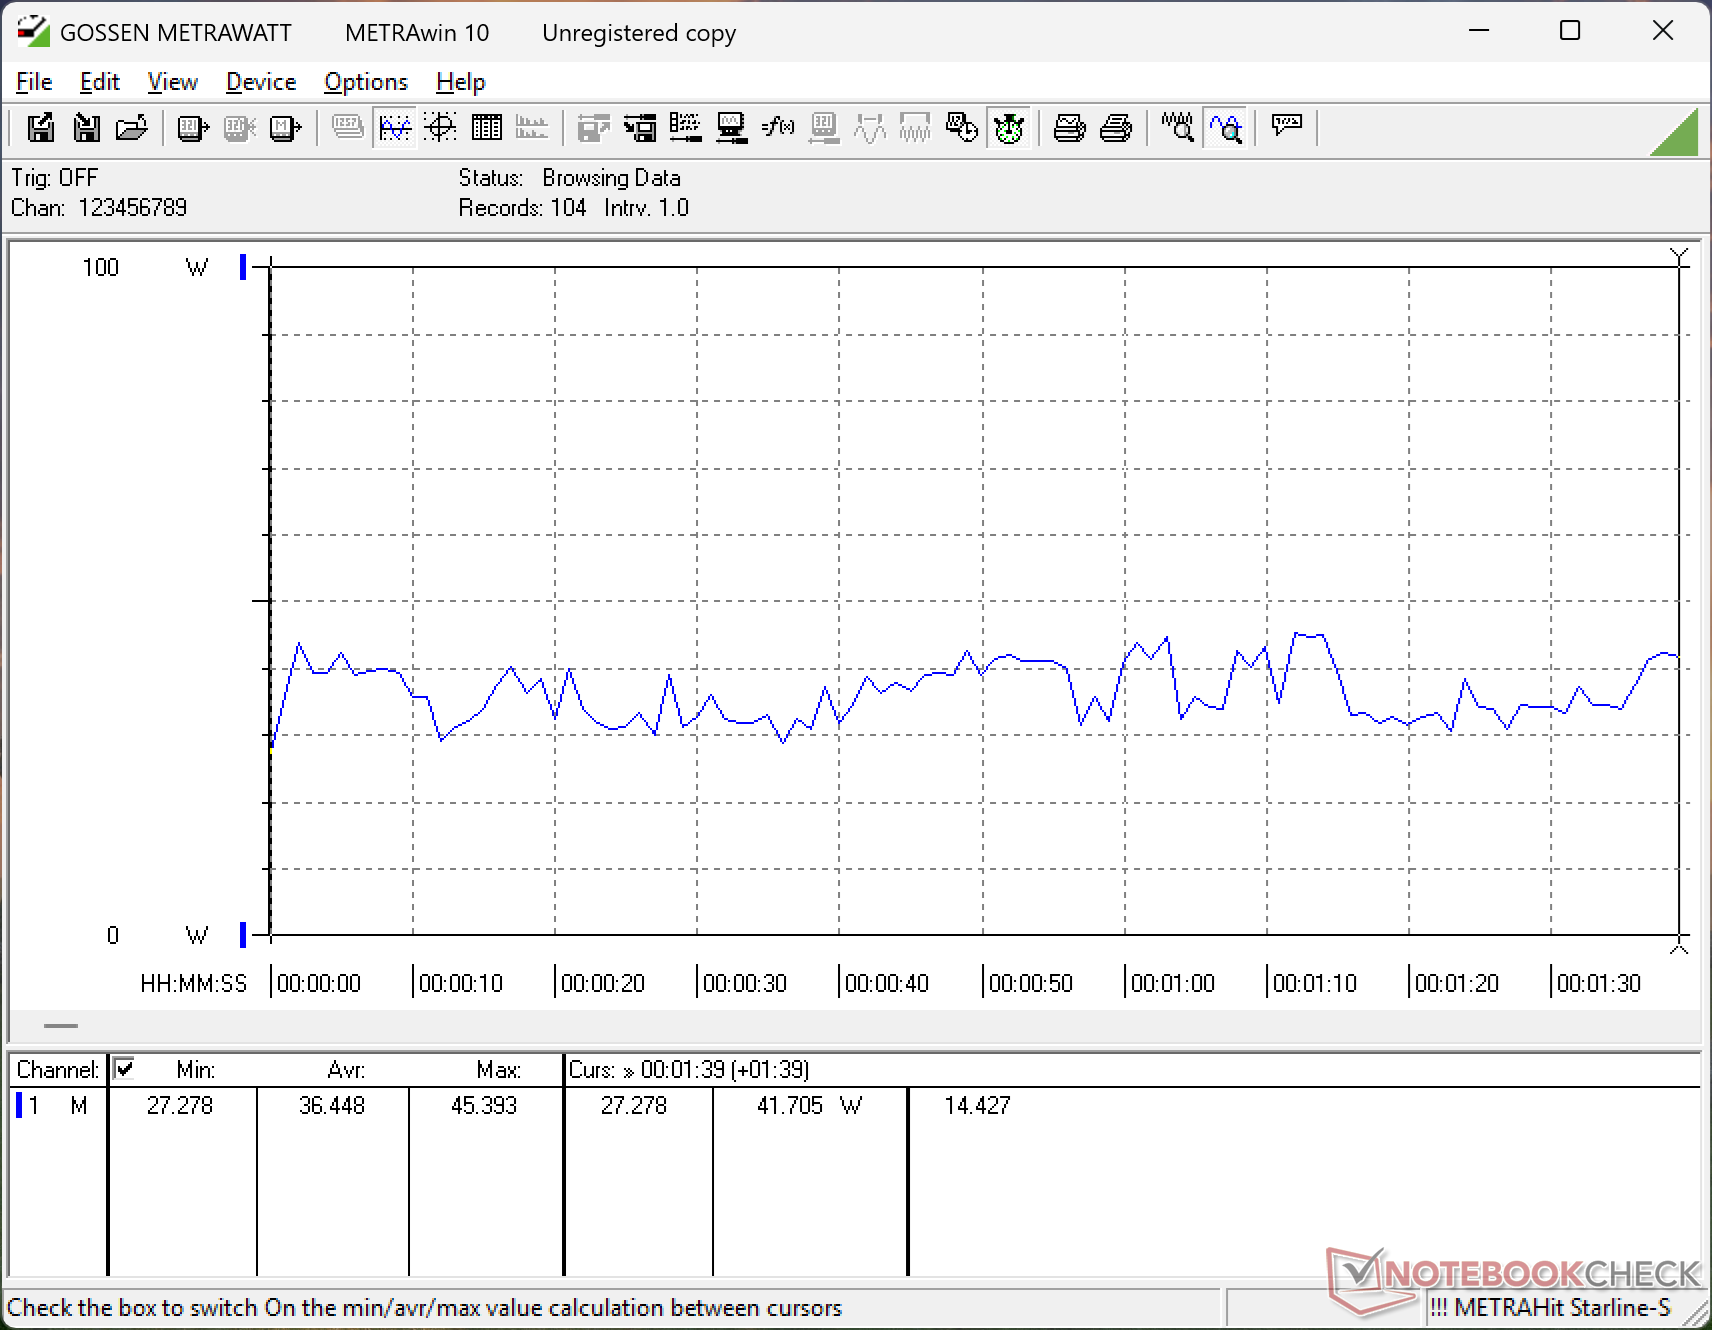
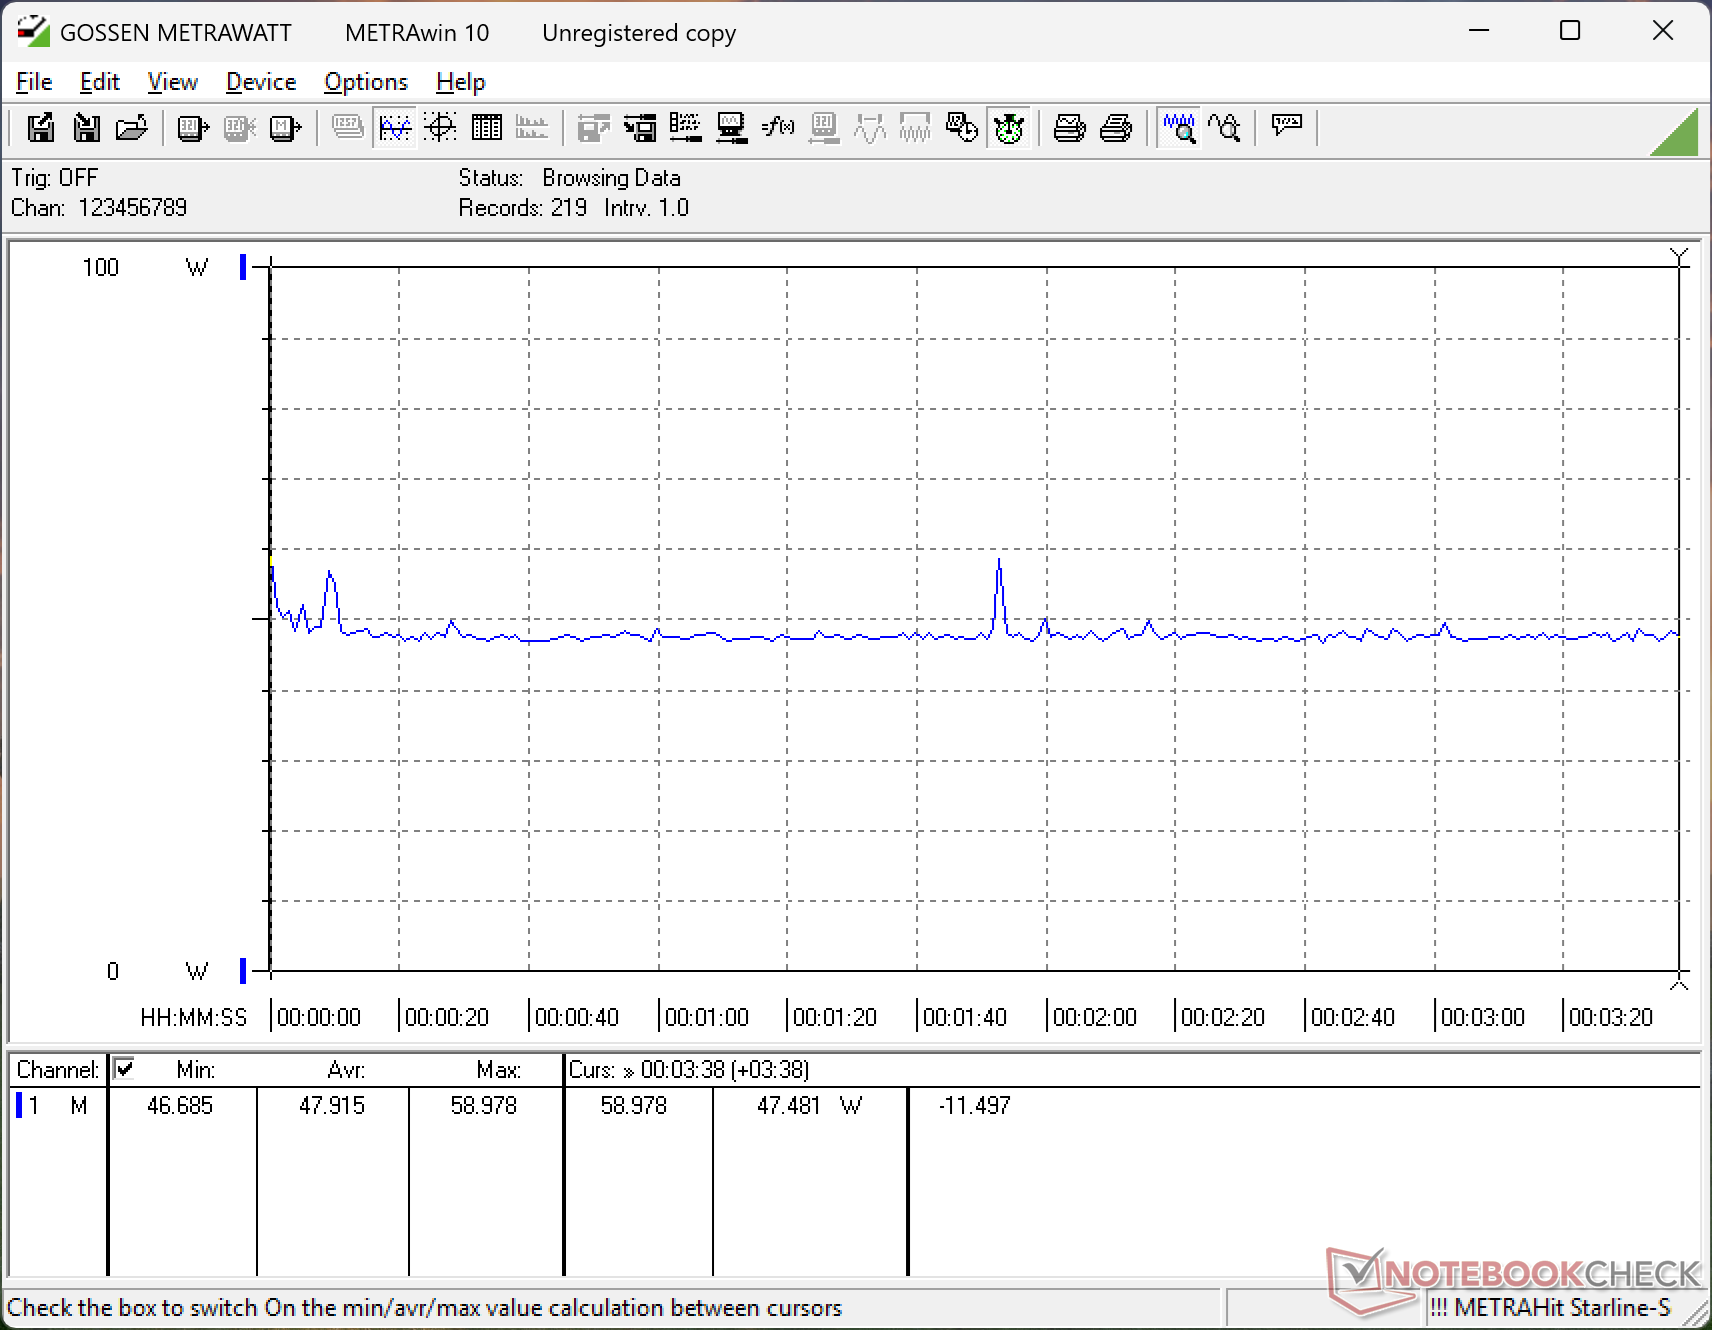
Consommation électrique
Panther Lake adopte l'efficacité de Lunar Lake-V avec les performances brutes d'Arrow Lake-H pour le meilleur des deux mondes. L'ordinateur de bureau au ralenti, avec la luminosité la plus faible, ne consomme que 1,3 W, ce qui est extrêmement faible, en particulier pour un ordinateur de 16 pouces. La consommation reste très faible, à un peu moins de 50 W, lors de l'exécution de jeux, en raison de l'absence d'un GPU discret. Si elle était configurée avec le Core Ultra X7 à la place, la consommation pour les jeux serait supérieure de quelques watts, d'après notre expérience avec le XPS 14 pour des performances par watt parmi les plus élevées de tous les portables iGPU.
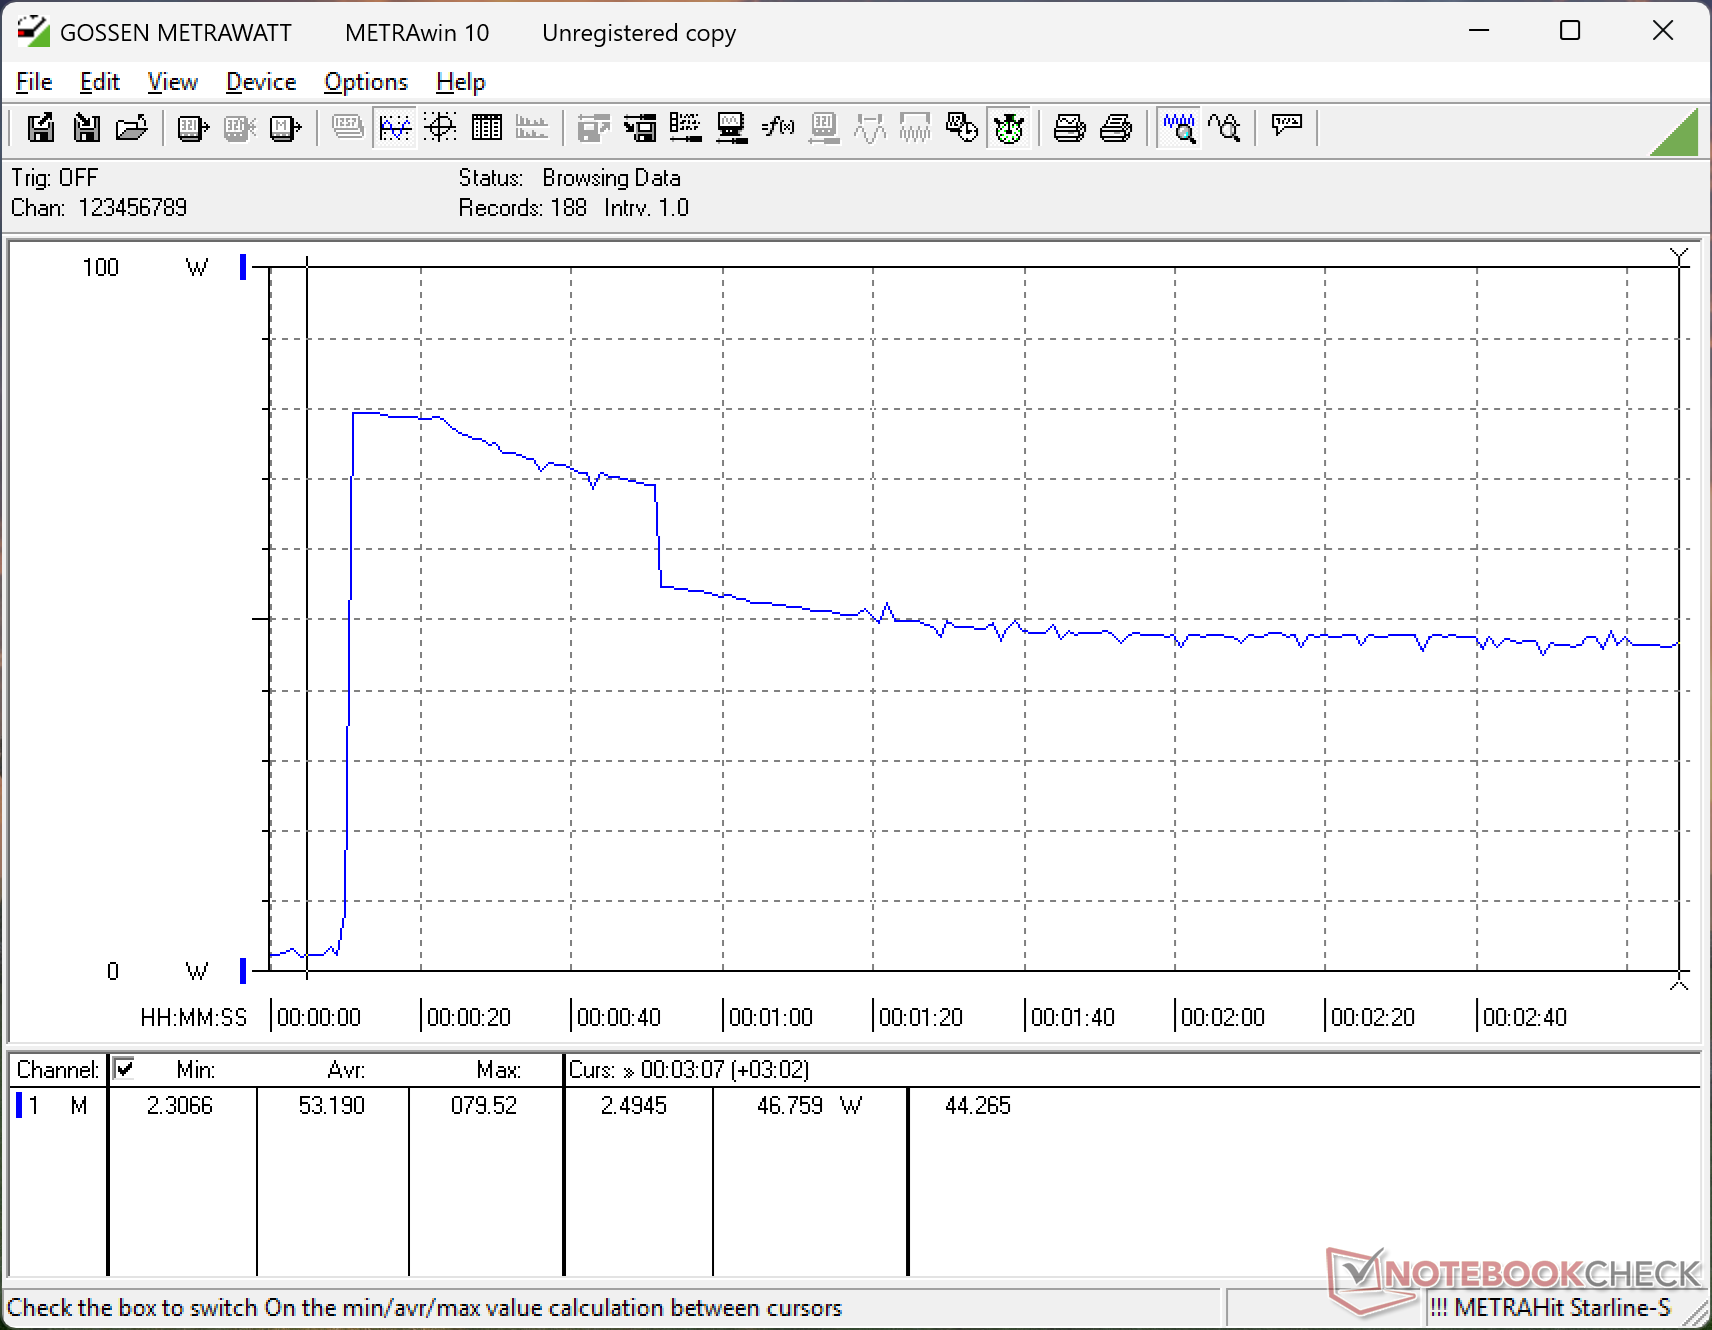
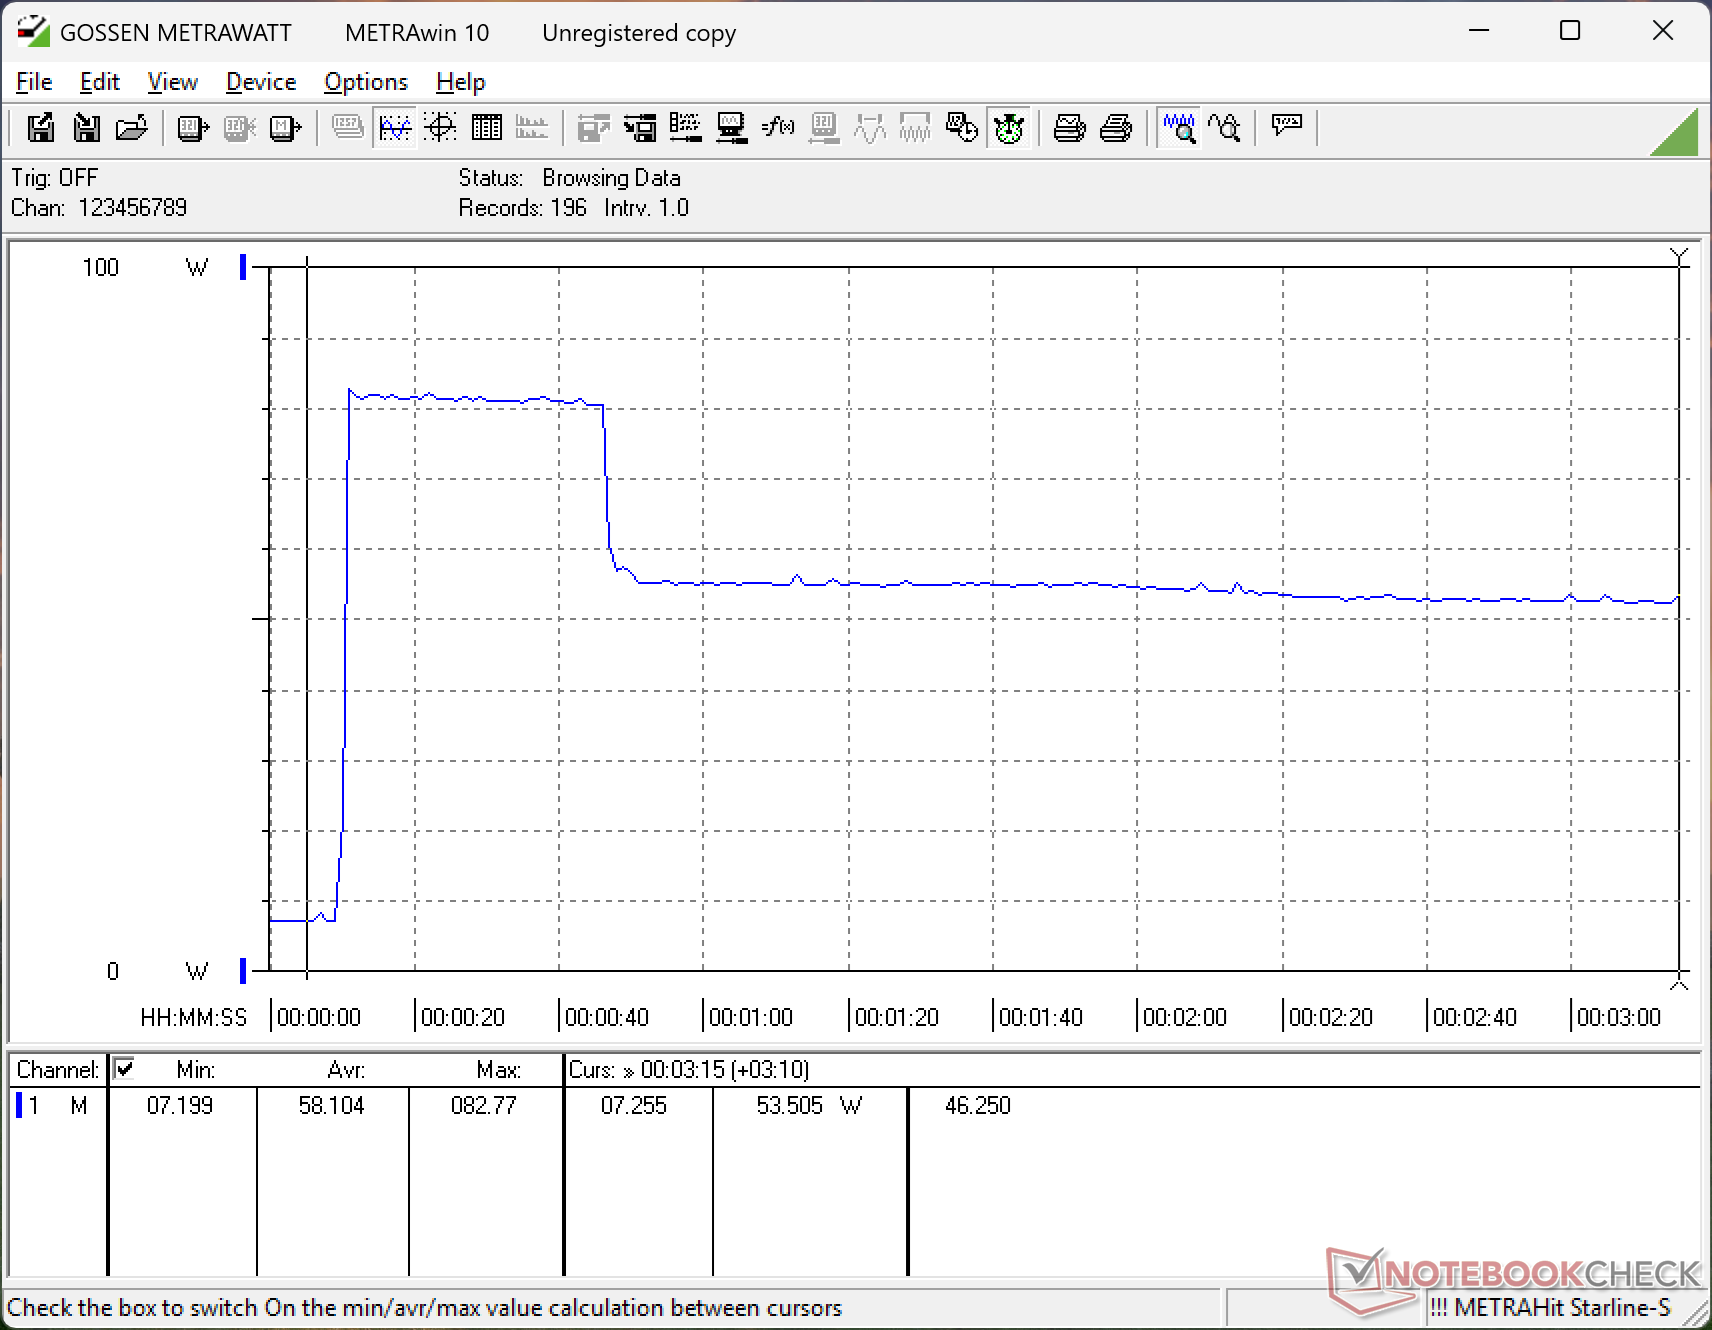
Nous sommes en mesure d'enregistrer une consommation maximale temporaire de 83 W à partir du petit (~10,2 x 5,5 x 2,2 cm) adaptateur secteur USB-C universel de 100 W lorsque le CPU est pleinement sollicité.
| Éteint/en veille | |
| Au repos | |
| Fortement sollicité |
|
Légende:
min: | |
| Dell XPS 16 Core Ultra 5 325 Ultra 5 325, Intel Graphics 4 Xe3 PTL, SK hynix PVC10 HFS512GEM4X182N, IPS, 1920x1200, 16" | Dell 16 Premium DA16250 Ultra 7 255H, GeForce RTX 5070 Laptop, Kioxia BG6 KBG6AZNV1T02, OLED, 3840x2400, 16.3" | Lenovo Yoga Pro 9 16IAH10 RTX 5050 Ultra 9 285H, GeForce RTX 5050 Laptop, WD PC SN7100S SDFPMSL-1T00-1101, OLED, 2880x1800, 16" | Samsung Galaxy Book6 Ultra Ultra 7 356H, GeForce RTX 5070 Laptop, Samsung PM9C1b MZVL81T0HFLB-00BH1, OLED, 2880x1800, 16" | Asus ZenBook S16 UM5606GA Ryzen AI 9 465, Radeon 880M, SanDisk PC SN5100S, OLED, 2880x1800, 16" | MSI Prestige 16 AI Evo B2HMG Ultra 9 285H, Arc 140T, Micron 2500 1TB MTFDKBA1T0QGN, IPS, 2560x1600, 16" | |
|---|---|---|---|---|---|---|
| Power Consumption | -225% | -261% | -119% | -65% | -93% | |
| Idle Minimum * (Watt) | 1.3 | 6.5 -400% | 6.8 -423% | 4.4 -238% | 3.7 -185% | 4.4 -238% |
| Idle Average * (Watt) | 4.5 | 8.1 -80% | 20.1 -347% | 6.4 -42% | 7.4 -64% | 9.2 -104% |
| Idle Maximum * (Watt) | 4.6 | 33 -617% | 21.6 -370% | 7.1 -54% | 9.5 -107% | 9.5 -107% |
| Load Average * (Watt) | 36.5 | 88.9 -144% | 87.6 -140% | 55.1 -51% | 57.9 -59% | 66.9 -83% |
| Cyberpunk 2077 ultra external monitor * (Watt) | 45.4 | 108.9 -140% | 147.9 -226% | 133 -193% | 57 -26% | 67.4 -48% |
| Cyberpunk 2077 ultra * (Watt) | 47.9 | 108.7 -127% | 148.2 -209% | 134.3 -180% | 58.5 -22% | 68.8 -44% |
| Load Maximum * (Watt) | 82.8 | 138.3 -67% | 173.5 -110% | 143.9 -74% | 76.9 7% | 102.9 -24% |
* ... Moindre est la valeur, meilleures sont les performances
Consommation électrique Cyberpunk / Stress Test
Consommation électrique du moniteur externe
Autonomie de la batterie

Dell annonce une autonomie de 31 heures sur la base de ses critères de test WLAN internes. Cependant, lors de nos tests dans nos propres conditions WLAN, nous avons pu enregistrer une autonomie de près de 27 heures, ce qui reste incroyablement impressionnant étant donné que la capacité de la batterie de 70 Wh est en fait un peu faible pour un format de 16 pouces.
| Dell XPS 16 Core Ultra 5 325 Ultra 5 325, Intel Graphics 4 Xe3 PTL, 70 Wh | Dell XPS 16 9640 Ultra 7 155H, GeForce RTX 4070 Laptop GPU, 99.5 Wh | Lenovo Yoga Pro 9 16IAH10 RTX 5050 Ultra 9 285H, GeForce RTX 5050 Laptop, 84 Wh | Samsung Galaxy Book6 Ultra Ultra 7 356H, GeForce RTX 5070 Laptop, 80.2 Wh | Asus ZenBook S16 UM5606GA Ryzen AI 9 465, Radeon 880M, 83 Wh | MSI Prestige 16 AI Evo B2HMG Ultra 9 285H, Arc 140T, 99.9 Wh | |
|---|---|---|---|---|---|---|
| Autonomie de la batterie | -61% | -60% | -37% | -51% | -38% | |
| WiFi v1.3 (h) | 26.6 | 10.5 -61% | 10.7 -60% | 16.8 -37% | 13.1 -51% | 16.5 -38% |
| H.264 (h) | 16.5 | 20.8 | ||||
| Load (h) | 1.5 | 2.4 |
Notebookcheck Rating
Le XPS 16 2026 sacrifie les options GPU discrètes au profit d'une conception plus fine, plus légère, plus silencieuse, plus durable et plus efficace.
Dell XPS 16 Core Ultra 5 325
- 03/20/2026 v8
Allen Ngo
 Total Sustainability Score:
 Comparaison avec des concurrents potentiels
Image | Modèle | Prix | Poids | Épaisseur | Écran |
|---|---|---|---|---|---|
1. 84.2% 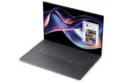 | Dell XPS 16 Core Ultra 5 325 Intel Core Ultra 5 325 ⎘ Intel Graphics 4 Xe3 Panther Lake iGPU ⎘ 16 Go Mémoire, 512 Go SSD | Amazon: 1. $2,999.00 Dell Premium 16 (XPS 16 2025... 2. $2,699.99 Dell XPS 16 9640 Laptop | In... 3. $2,999.00 Dell Premium 16 (Previously ... Prix de liste: 1600 USD | 1.7 kg | 15.4 mm | 16.00" 1920x1200 142 PPI IPS |
2. 87.9%  | Dell 16 Premium DA16250 Intel Core Ultra 7 255H ⎘ NVIDIA GeForce RTX 5070 Laptop ⎘ 32 Go Mémoire, 1024 Go SSD | Amazon: Prix de liste: 3300 USD | 2.3 kg | 18.7 mm | 16.30" 3840x2400 278 PPI OLED |
3. 88.8%  | Lenovo Yoga Pro 9 16IAH10 RTX 5050 Intel Core Ultra 9 285H ⎘ NVIDIA GeForce RTX 5050 Laptop ⎘ 32 Go Mémoire, 1024 Go SSD | Amazon: Prix de liste: 1800 USD | 2 kg | 17.9 mm | 16.00" 2880x1800 212 PPI OLED |
4. 90.7%  | Samsung Galaxy Book6 Ultra Intel Core Ultra 7 356H ⎘ NVIDIA GeForce RTX 5070 Laptop ⎘ 32 Go Mémoire, 1000 Go SSD | Amazon: 1. $2,999.99 Samsung 16” Galaxy Book6 U... 2. $2,449.99 Samsung 16” Galaxy Book6 U... 3. $3,087.99 Samsung 16” Galaxy Book6 U... Prix de liste: 3599€ | 1.9 kg | 15.4 mm | 16.00" 2880x1800 212 PPI OLED |
5. 86.6%  | Asus ZenBook S16 UM5606GA AMD Ryzen AI 9 465 ⎘ AMD Radeon 880M ⎘ 32 Go Mémoire, 1024 Go SSD | Amazon: 1. $1,299.99 ASUS Zenbook S 16 AI Laptop ... 2. $1,299.99 ASUS Zenbook S 16 Touchscree... 3. $1,229.99 ASUS Zenbook S 16 Laptop, AM... Prix de liste: 1799€ | 1.5 kg | 12.9 mm | 16.00" 2880x1800 212 PPI OLED |
6. 82.8%  | MSI Prestige 16 AI Evo B2HMG Intel Core Ultra 9 285H ⎘ Intel Arc Graphics 140T ⎘ 32 Go Mémoire, 1024 Go SSD | Amazon: 1. $1,484.99 MSI Prestige 16 AI+ Evo 16" ... 2. $1,399.99 MSI Prestige 14 AI+ EVO PRE1... 3. $1,247.39 msi Prestige A16 AI+ (2025) ... | 1.6 kg | 18.95 mm | 16.00" 2560x1600 189 PPI IPS |
Transparency
La sélection des appareils à examiner est effectuée par notre équipe éditoriale. L'échantillon de test a été acheté gratuitement par l'auteur, à ses propres frais. Le prêteur n'a eu aucune influence sur cette évaluation et le fabricant n'a pas reçu de copie de cette évaluation avant sa publication. Il n'y avait aucune obligation de publier cet article. En tant que média indépendant, Notebookcheck n'est pas soumis à l'autorité des fabricants, des détaillants ou des éditeurs.
Voici comment Notebookcheck teste
Chaque année, Notebookcheck examine de manière indépendante des centaines d'ordinateurs portables et de smartphones en utilisant des procédures standardisées afin de garantir que tous les résultats sont comparables. Nous avons continuellement développé nos méthodes de test depuis environ 20 ans et avons établi des normes industrielles dans le processus. Dans nos laboratoires de test, des équipements de mesure de haute qualité sont utilisés par des techniciens et des rédacteurs expérimentés. Ces tests impliquent un processus de validation en plusieurs étapes. Notre système d'évaluation complexe repose sur des centaines de mesures et de points de référence bien fondés, ce qui garantit l'objectivité.
