Verdict - Un concentré d'énergie équilibré pour le travail et le jeu
L'Alienware 16X Aurora est remarquable pour sa construction de haute qualité et son écran IPS 240 Hz avec des couleurs P3 dans toutes les configurations actuelles. Les autres ordinateurs portables de jeu d'entrée ou de milieu de gamme ont tendance à utiliser plus de plastique ou à être livrés avec des écrans IPS moins chers afin de réduire les coûts et nous apprécions donc les normes plus élevées que Dell établit avec le 16X Aurora. Même le 16 Aurora, moins cher (non X), promet des couleurs sRGB complètes.
Le comportement des ventilateurs est un autre point fort, car ils ne pulsent pas lorsqu'ils fonctionnent avec des charges peu exigeantes. Bien qu'il soit courant sur les subnotebooks avec des CPU ULV, ce comportement est quelque chose que nous aimerions voir plus souvent sur les ordinateurs portables de jeu plus grands.
De nombreux inconvénients de l'Aurora 16X sont similaires à ceux de l'Aurora 16X Area-51. La construction de qualité supérieure signifie une unité plus lourde, tandis que la consommation d'énergie peut être assez élevée, ce qui conduit à une autonomie moyenne au mieux, même pour un ordinateur portable de jeu. Pendant ce temps, les options de GPU s'arrêtent à la GeForce RTX 5070 au lieu de la RTX 5070 Ti qui aurait été bien mieux adaptée au jeu en 1600p. Dell réserve ses options RTX 5070 Ti à la série Area-51, beaucoup plus chère, afin d'inciter les acheteurs potentiels à passer à la vitesse supérieure.
Points positifs
Points négatifs
Prix et disponibilité
Dell commercialise actuellement l'Alienware Aurora 16X, tel que configuré dans cette revue, au prix de $1600 USD. Une version similaire avec plus de mémoire vive et de stockage est également disponible sur Amazon au prix de 2270 USD.
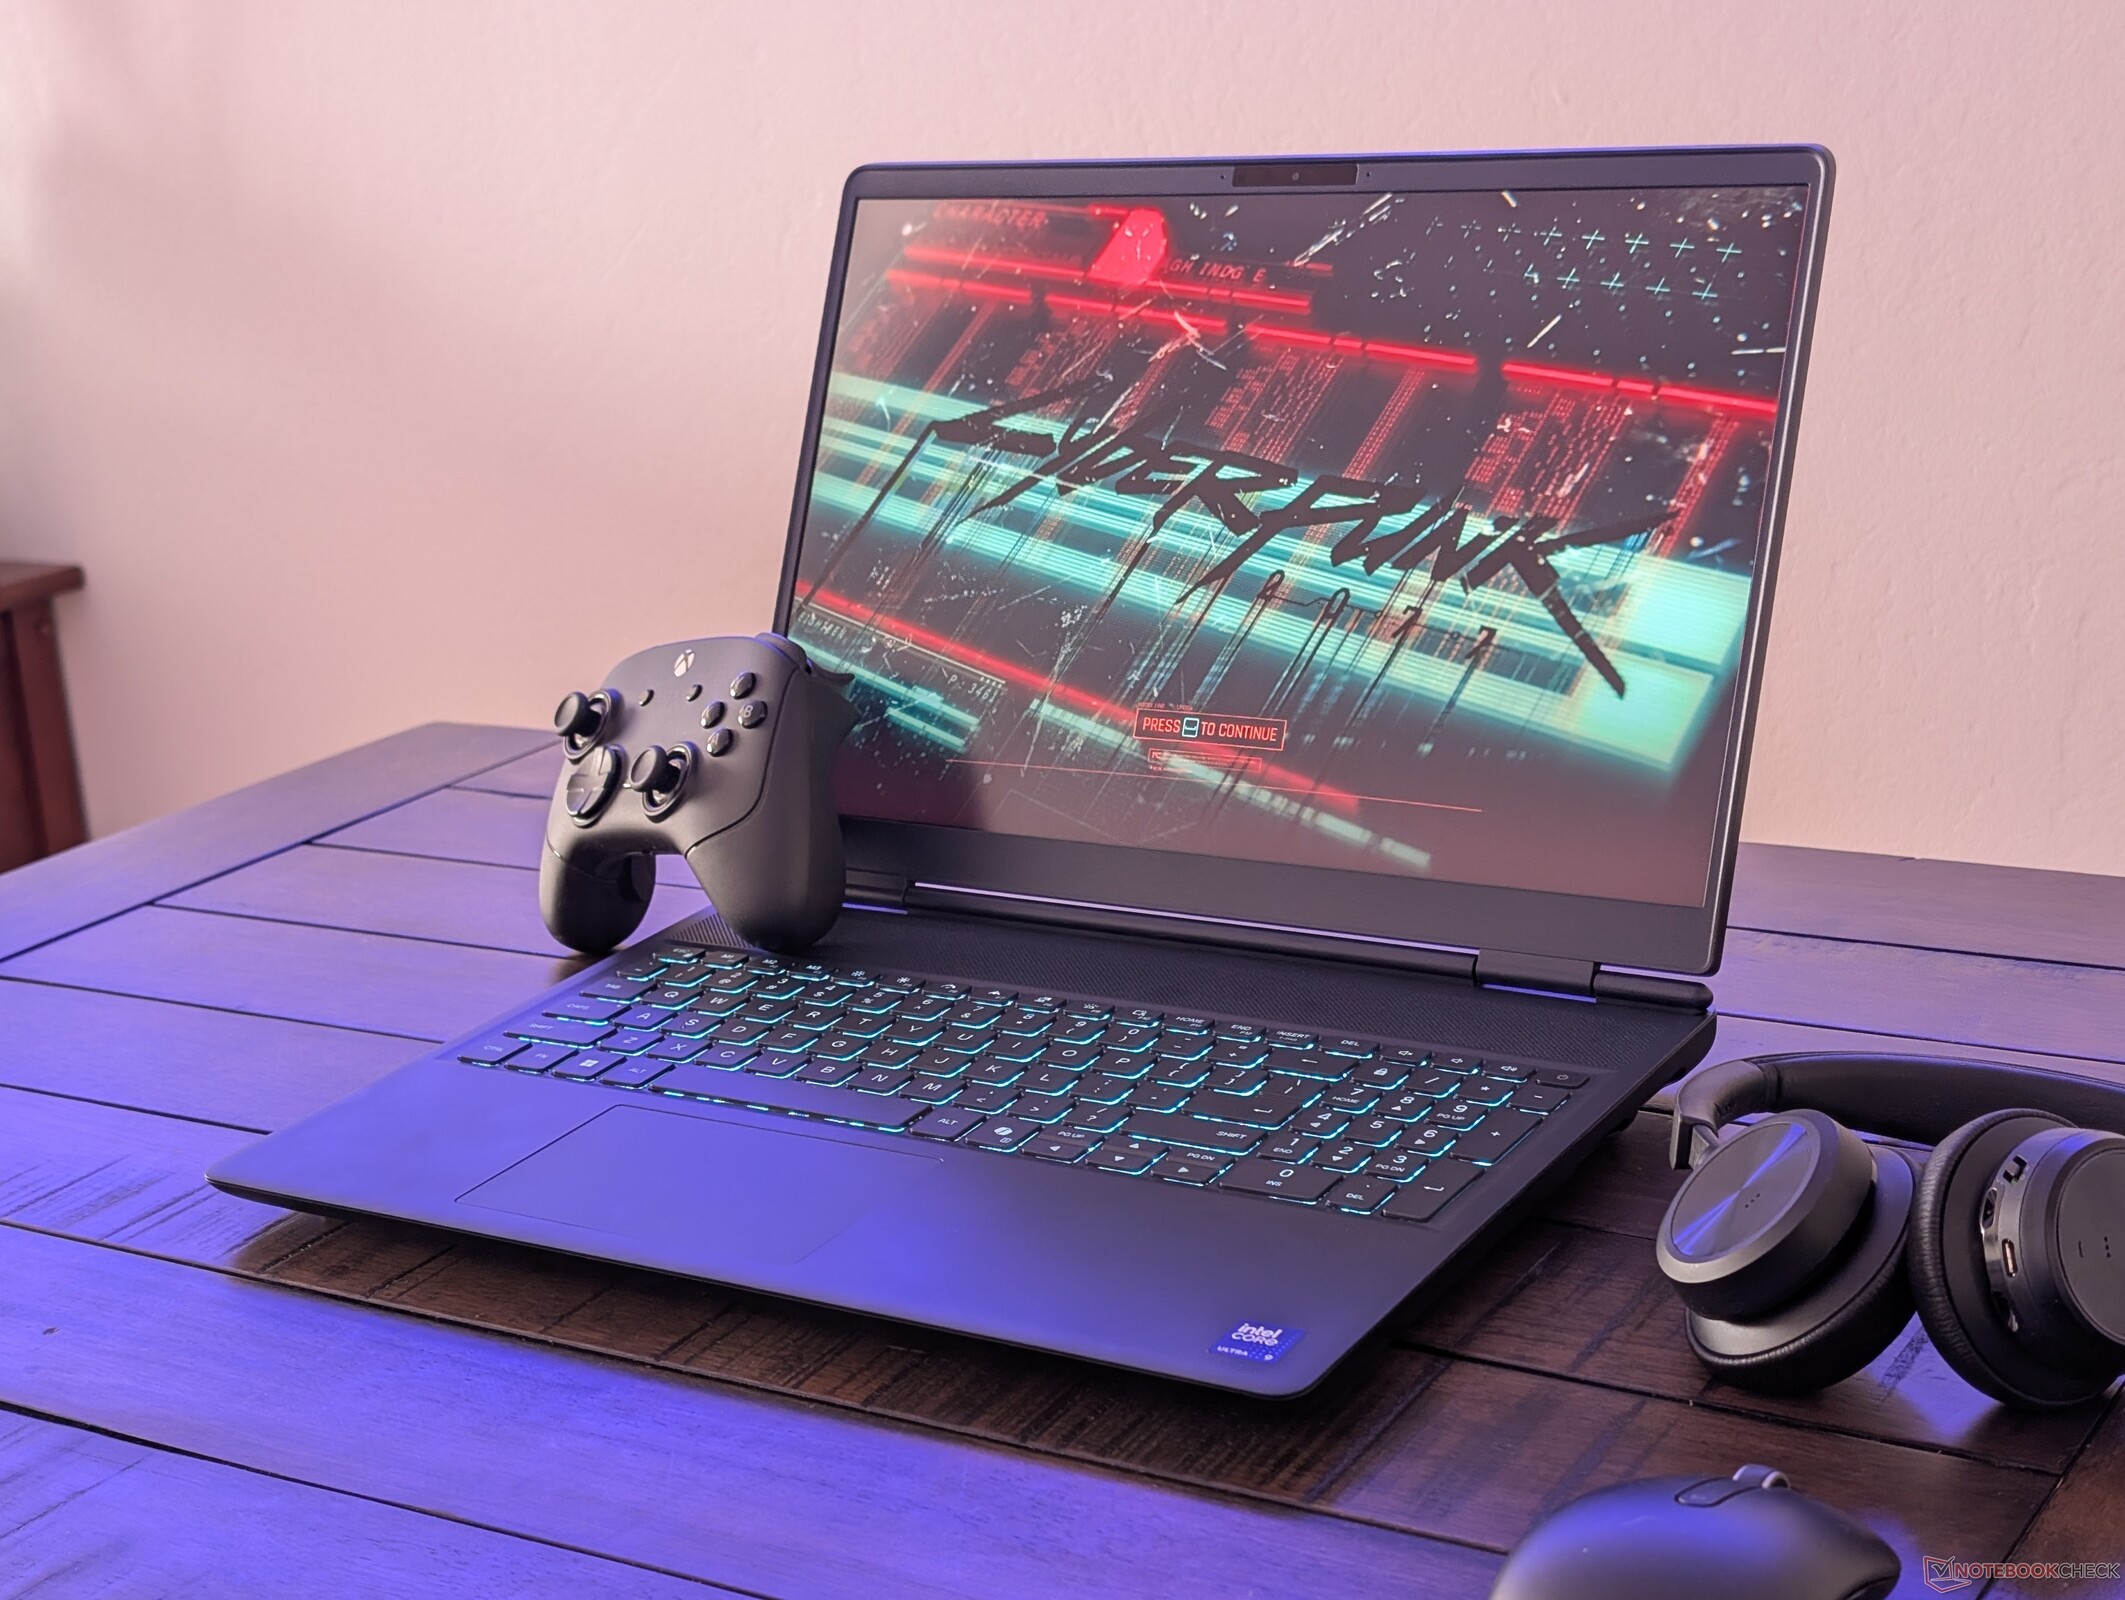
L'Alienware Aurora 16X est un ordinateur portable de jeu de milieu de gamme de Dell, situé juste en dessous des modèles haut de gamme de la série Area-51 de Dell Alienware Area-51 haut de gamme. Il est équipé des mêmes processeurs Intel Arrow Lake-HX que ceux de l'Area-51, mais avec des options Nvidia Blackwell bas de gamme fonctionnant à des plafonds de puissance inférieurs pour réduire les coûts. L'Aurora 16X peut être considéré comme le successeur de l'ancienne série Série Alienware m16.
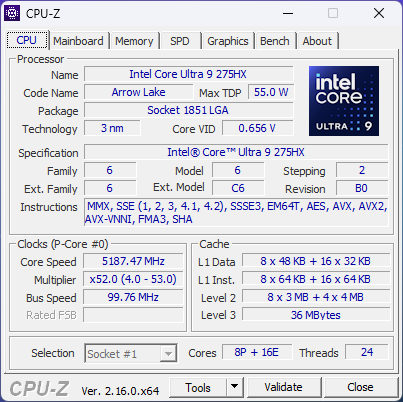
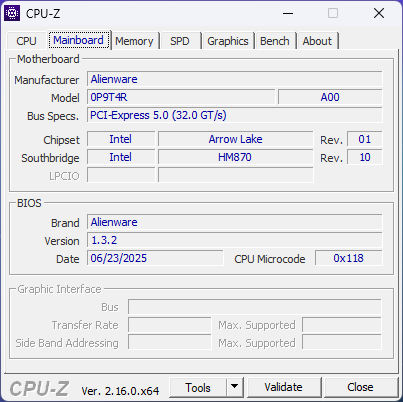
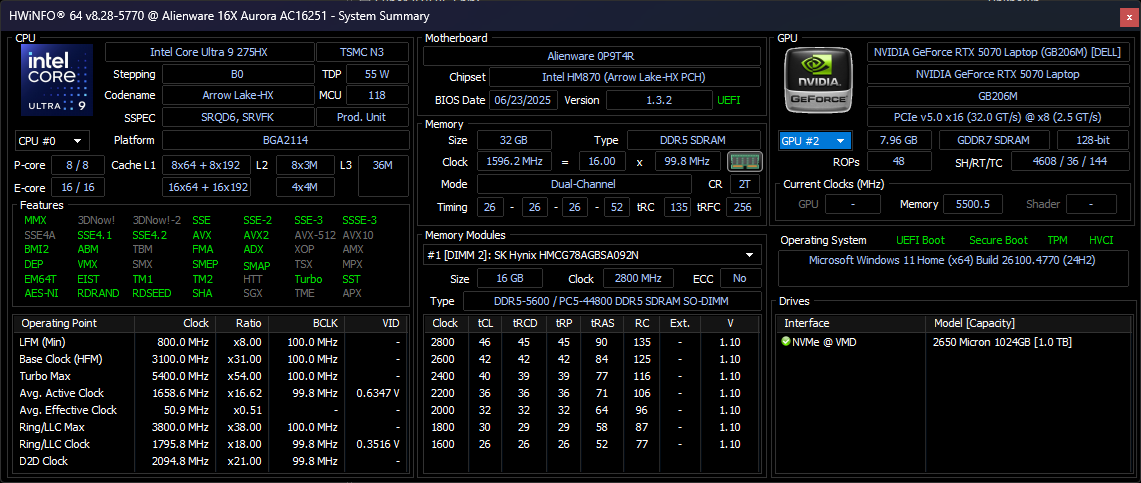
Notre unité de test est une configuration haut de gamme avec un processeur Core Ultra 9 275HX, un GPU RTX 5070 de 115 W GeForce et un écran IPS P3 de 1600p240 Hz pour un prix d'environ 1600 USD. Les SKUs plus bas de gamme (appelés 16 Aurora) sont livrés avec le Core Ultra 7 255HX et/ou la RTX 5060 avec un écran 1600p120 IPS sRGB.
Les alternatives à l'Aurora 16X comprennent d'autres ordinateurs portables de jeu de 16 pouces de milieu de gamme comme le MSI Vector 16 HX, Asus TUF Gaming A16asus TUF Gaming A16 Lenovo Legion 5 Pro.
Plus de commentaires sur Dell :
Spécifications
Cas
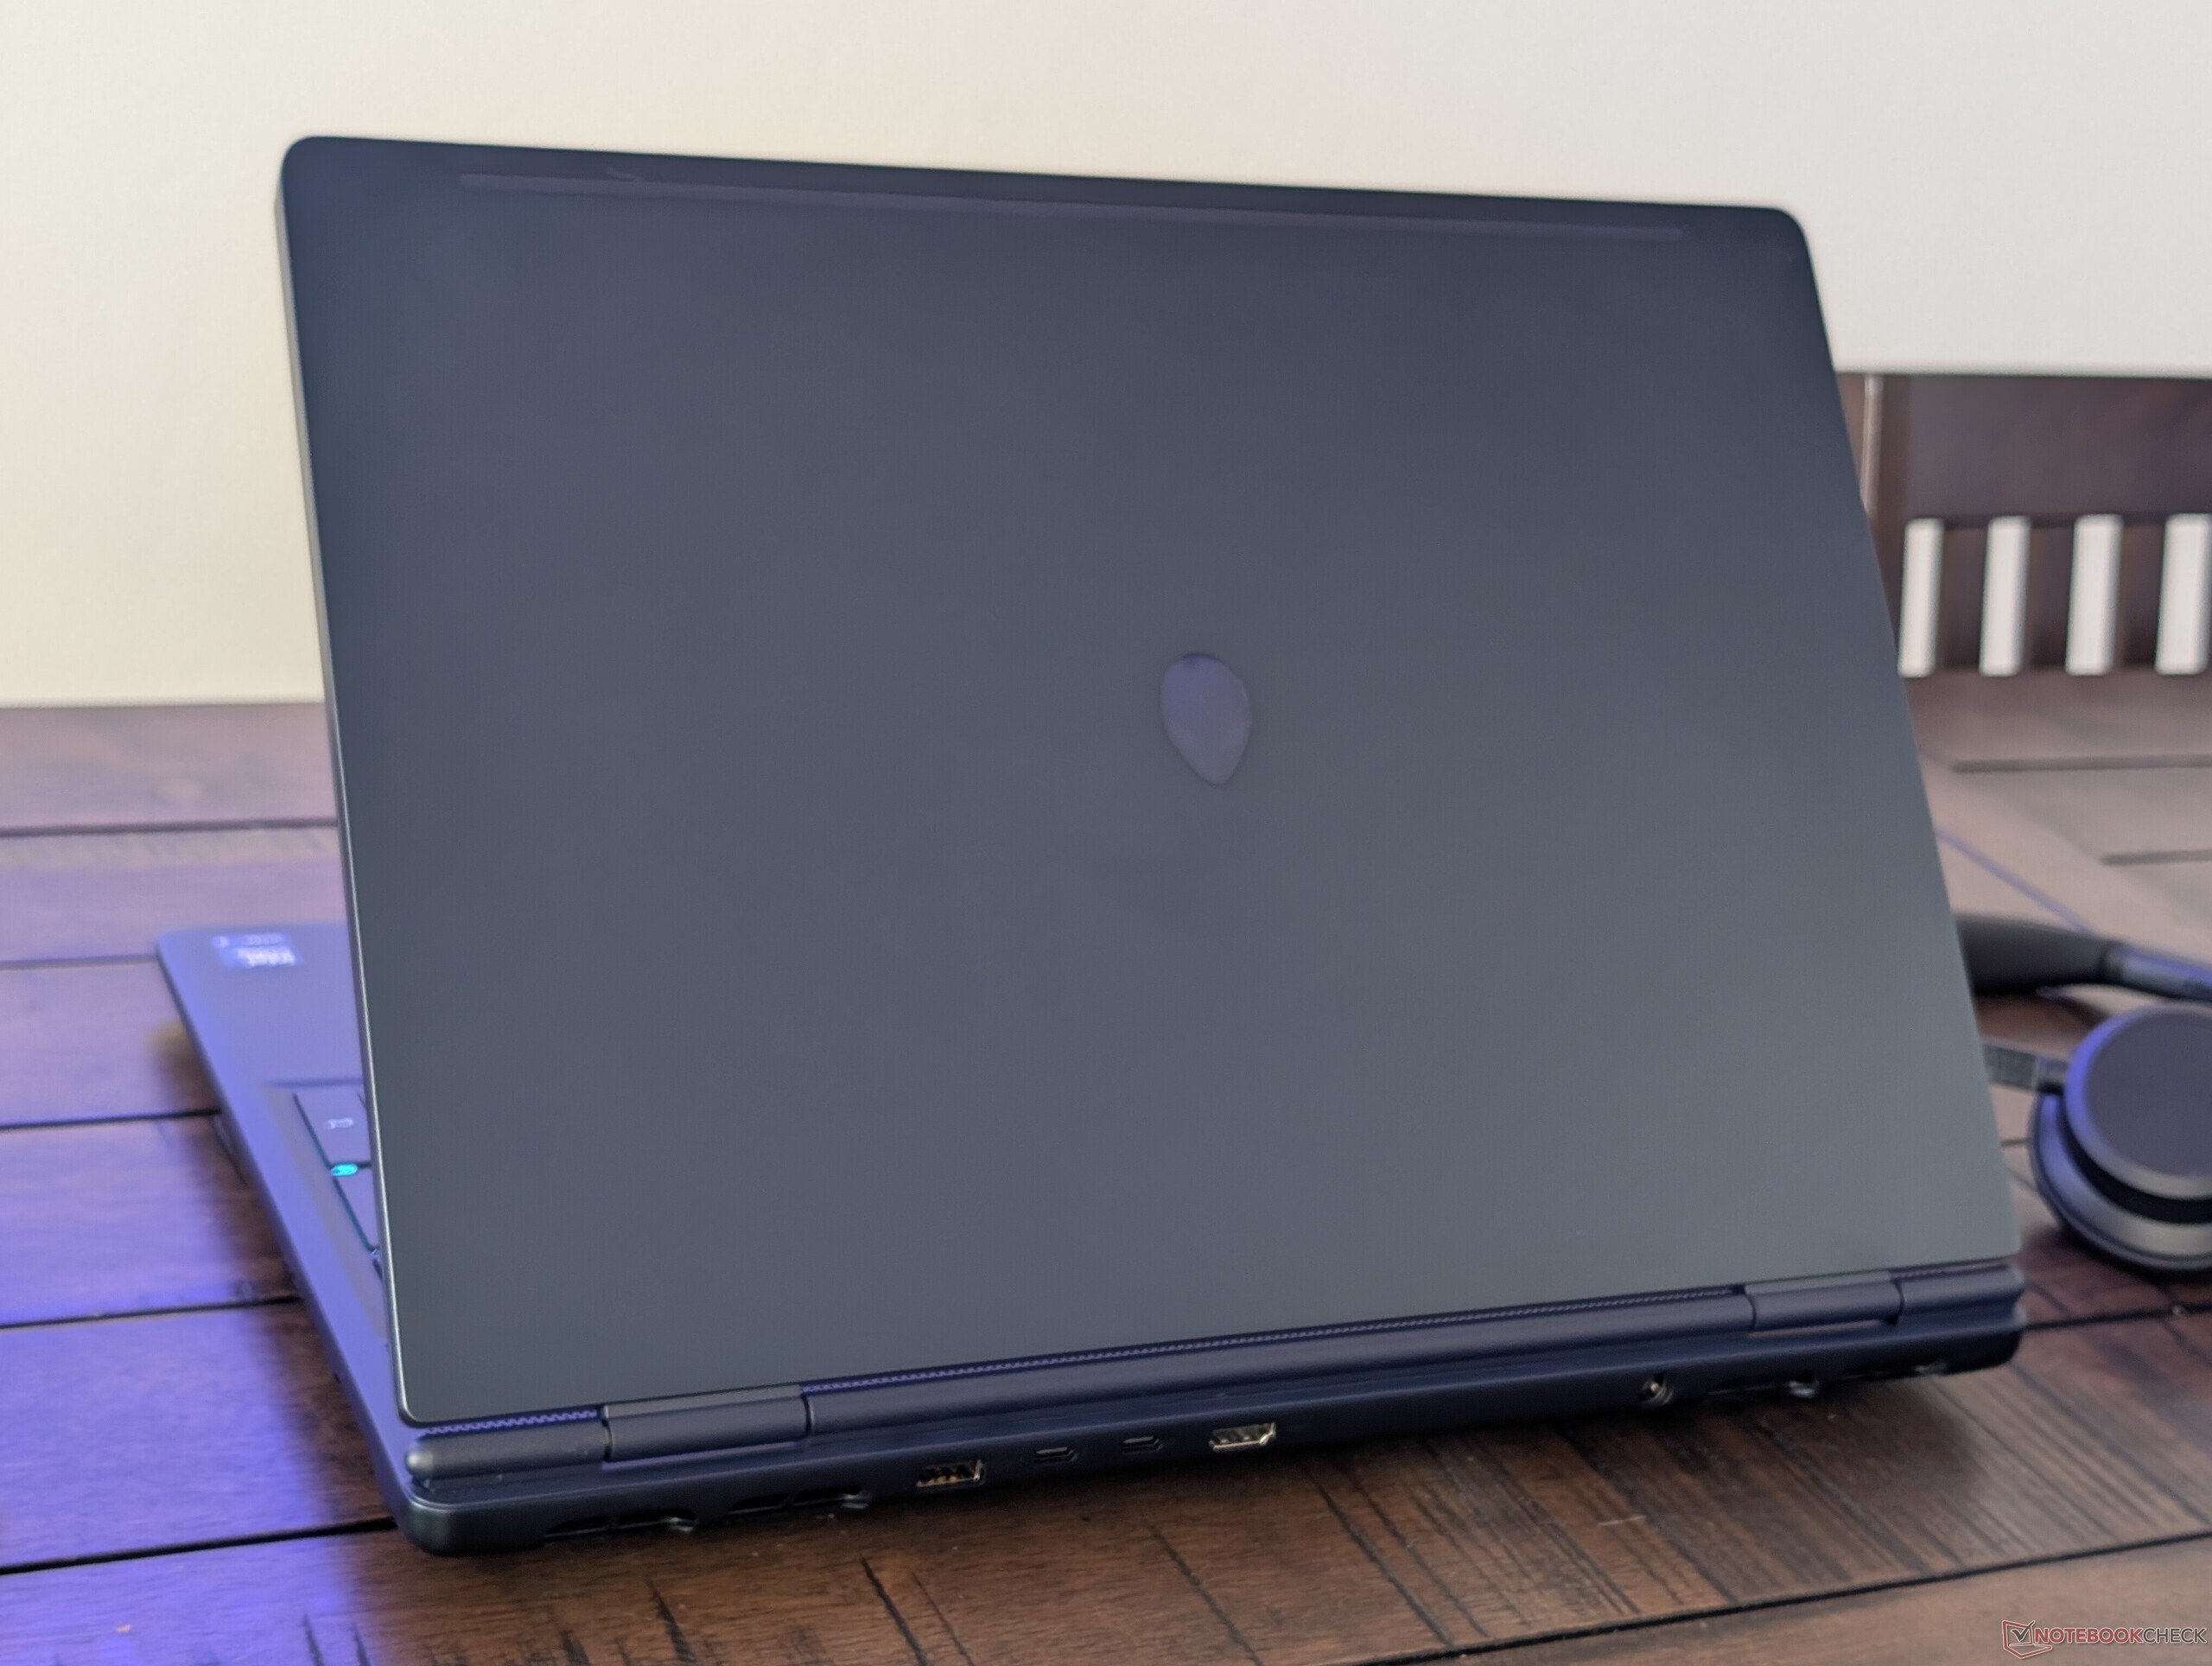
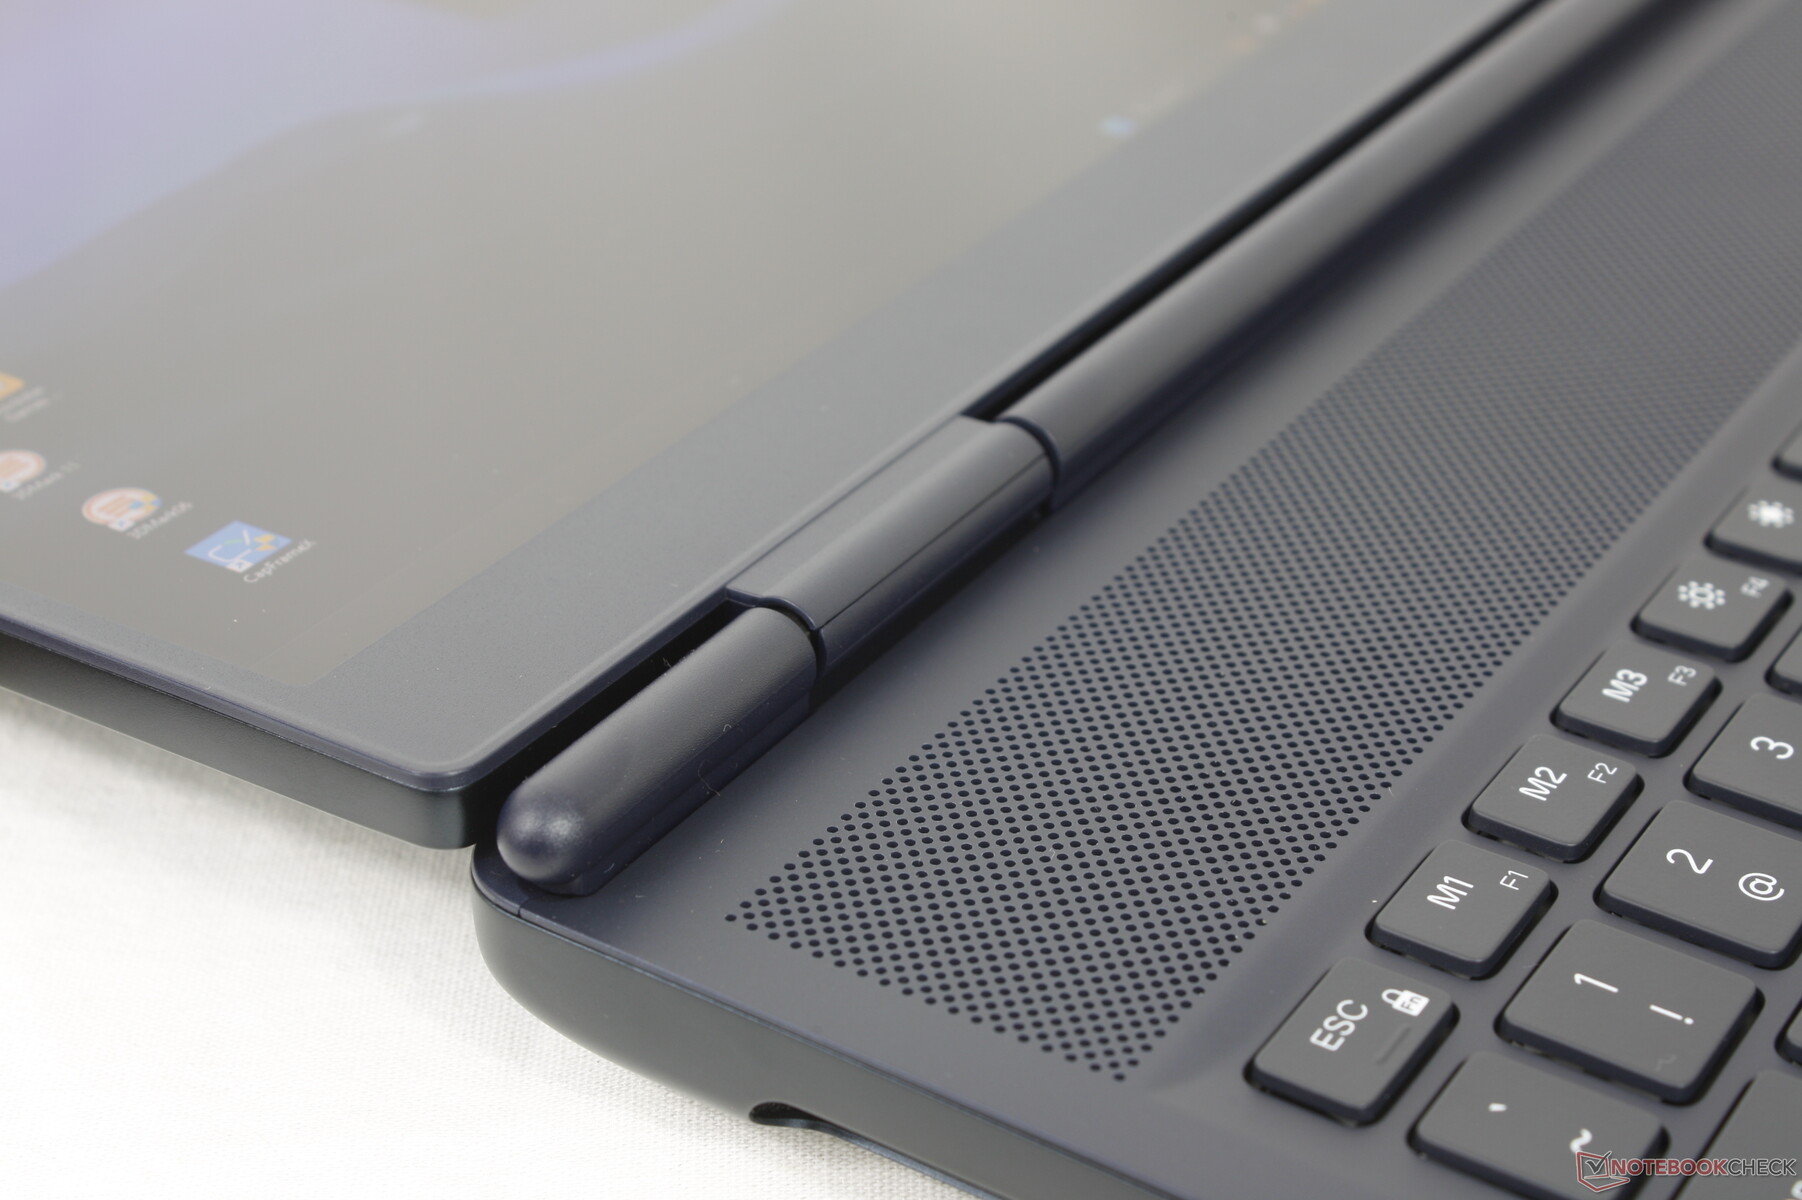
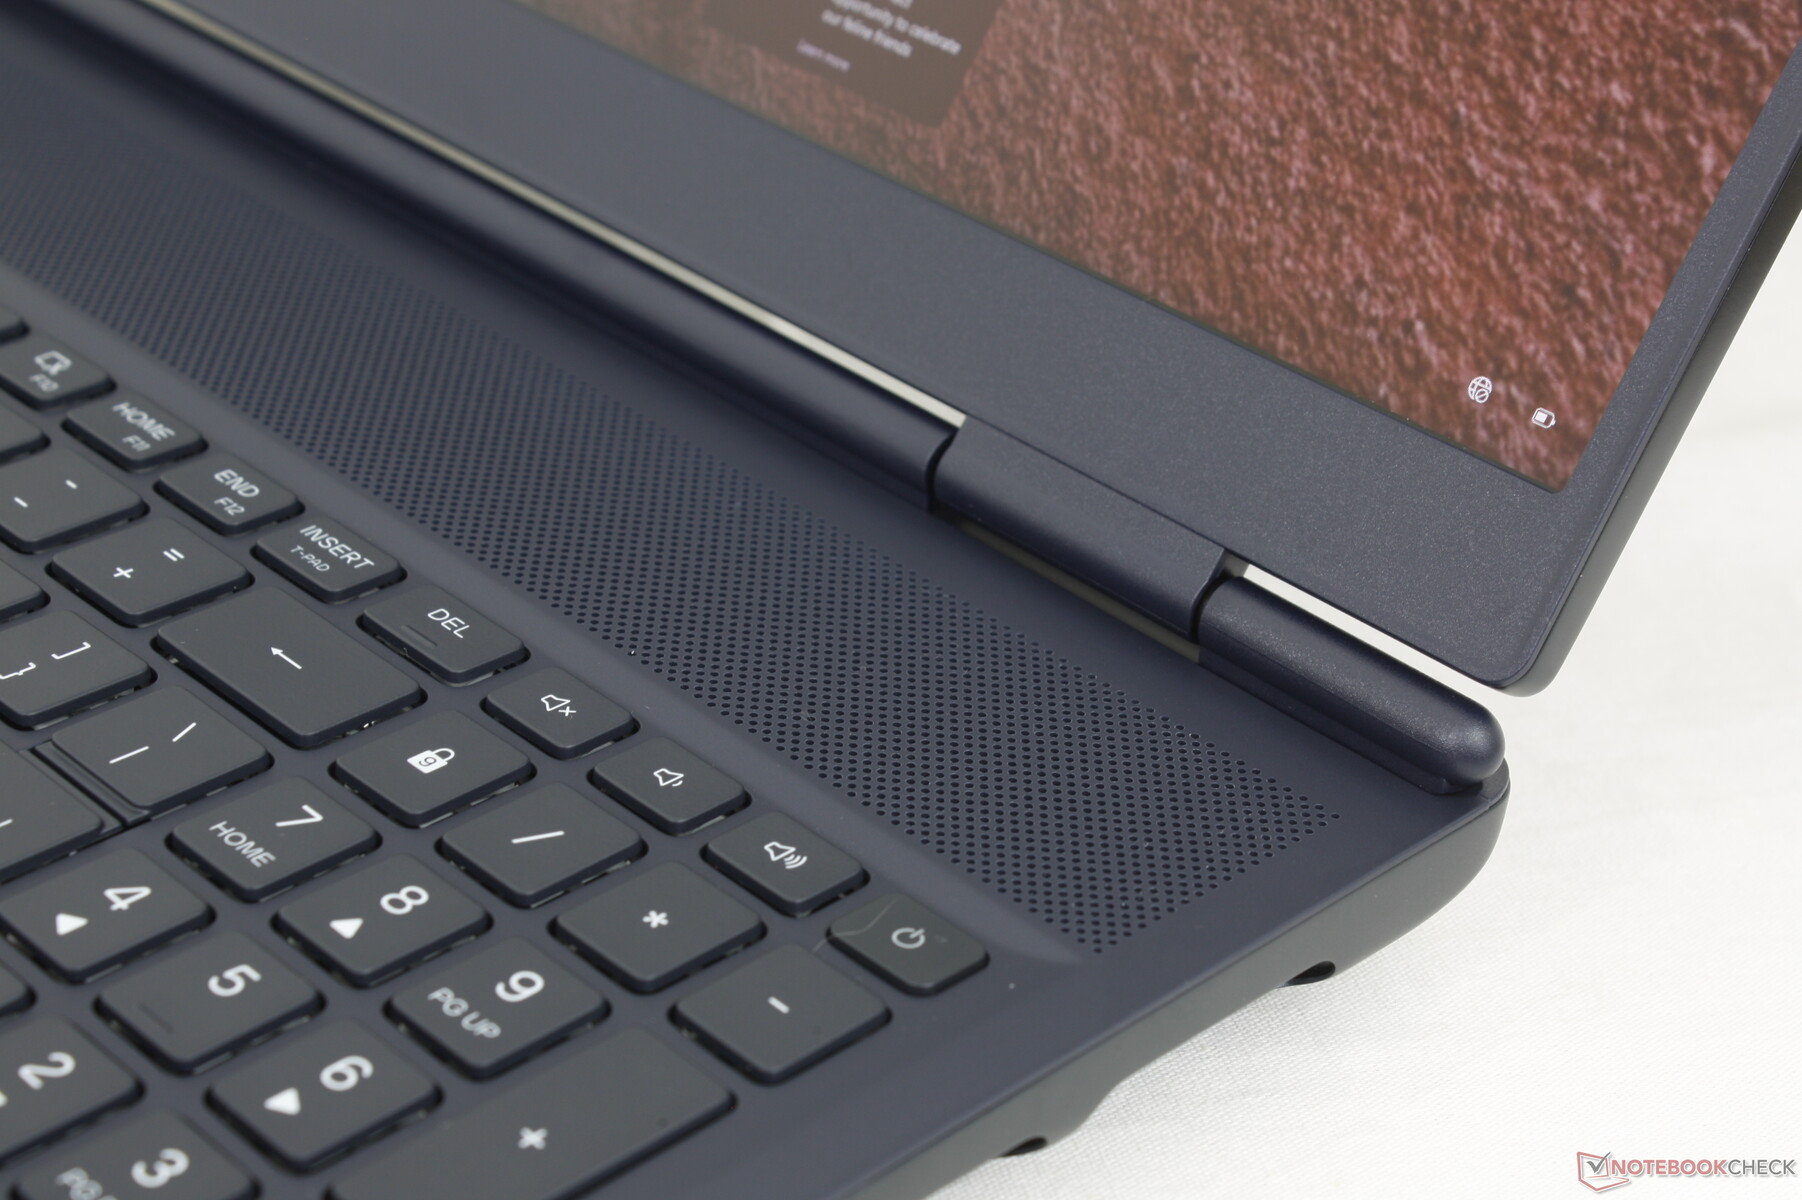
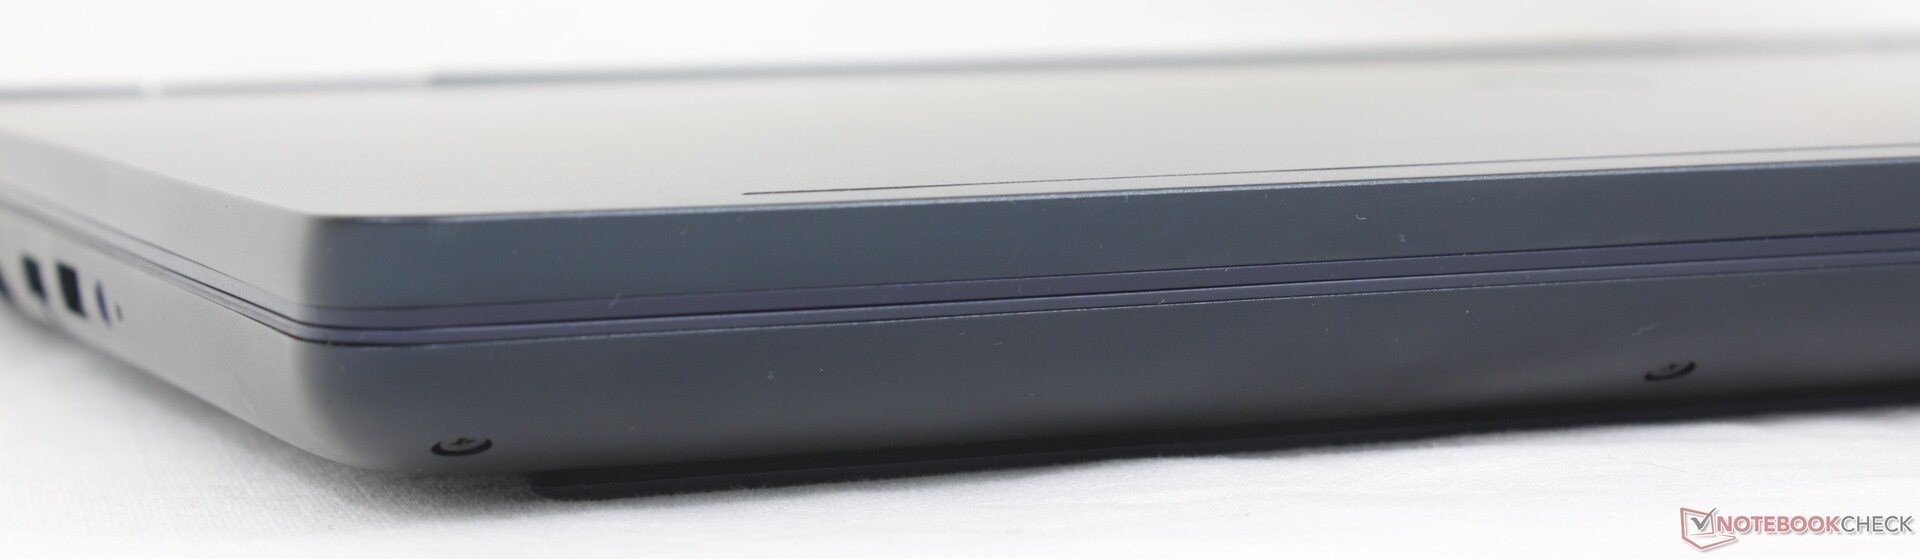
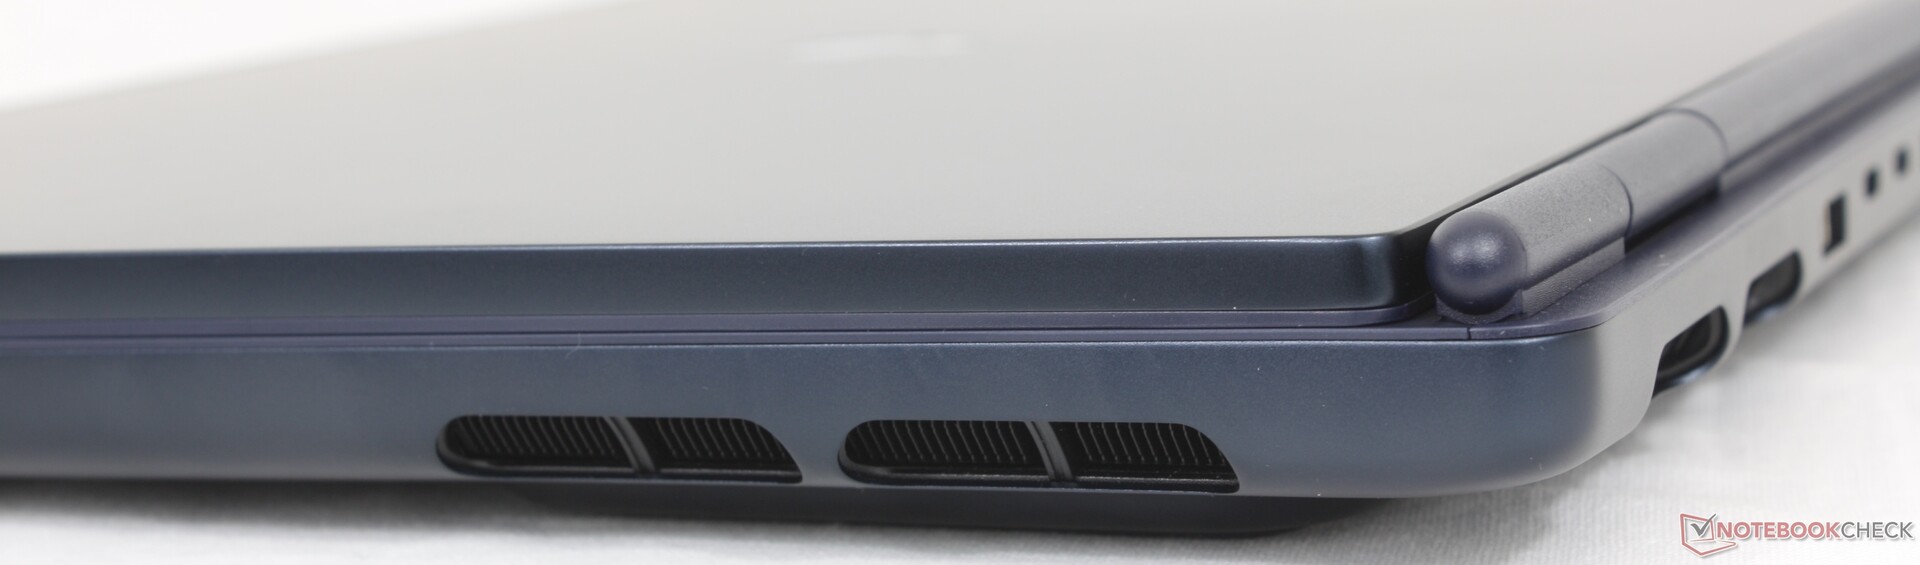
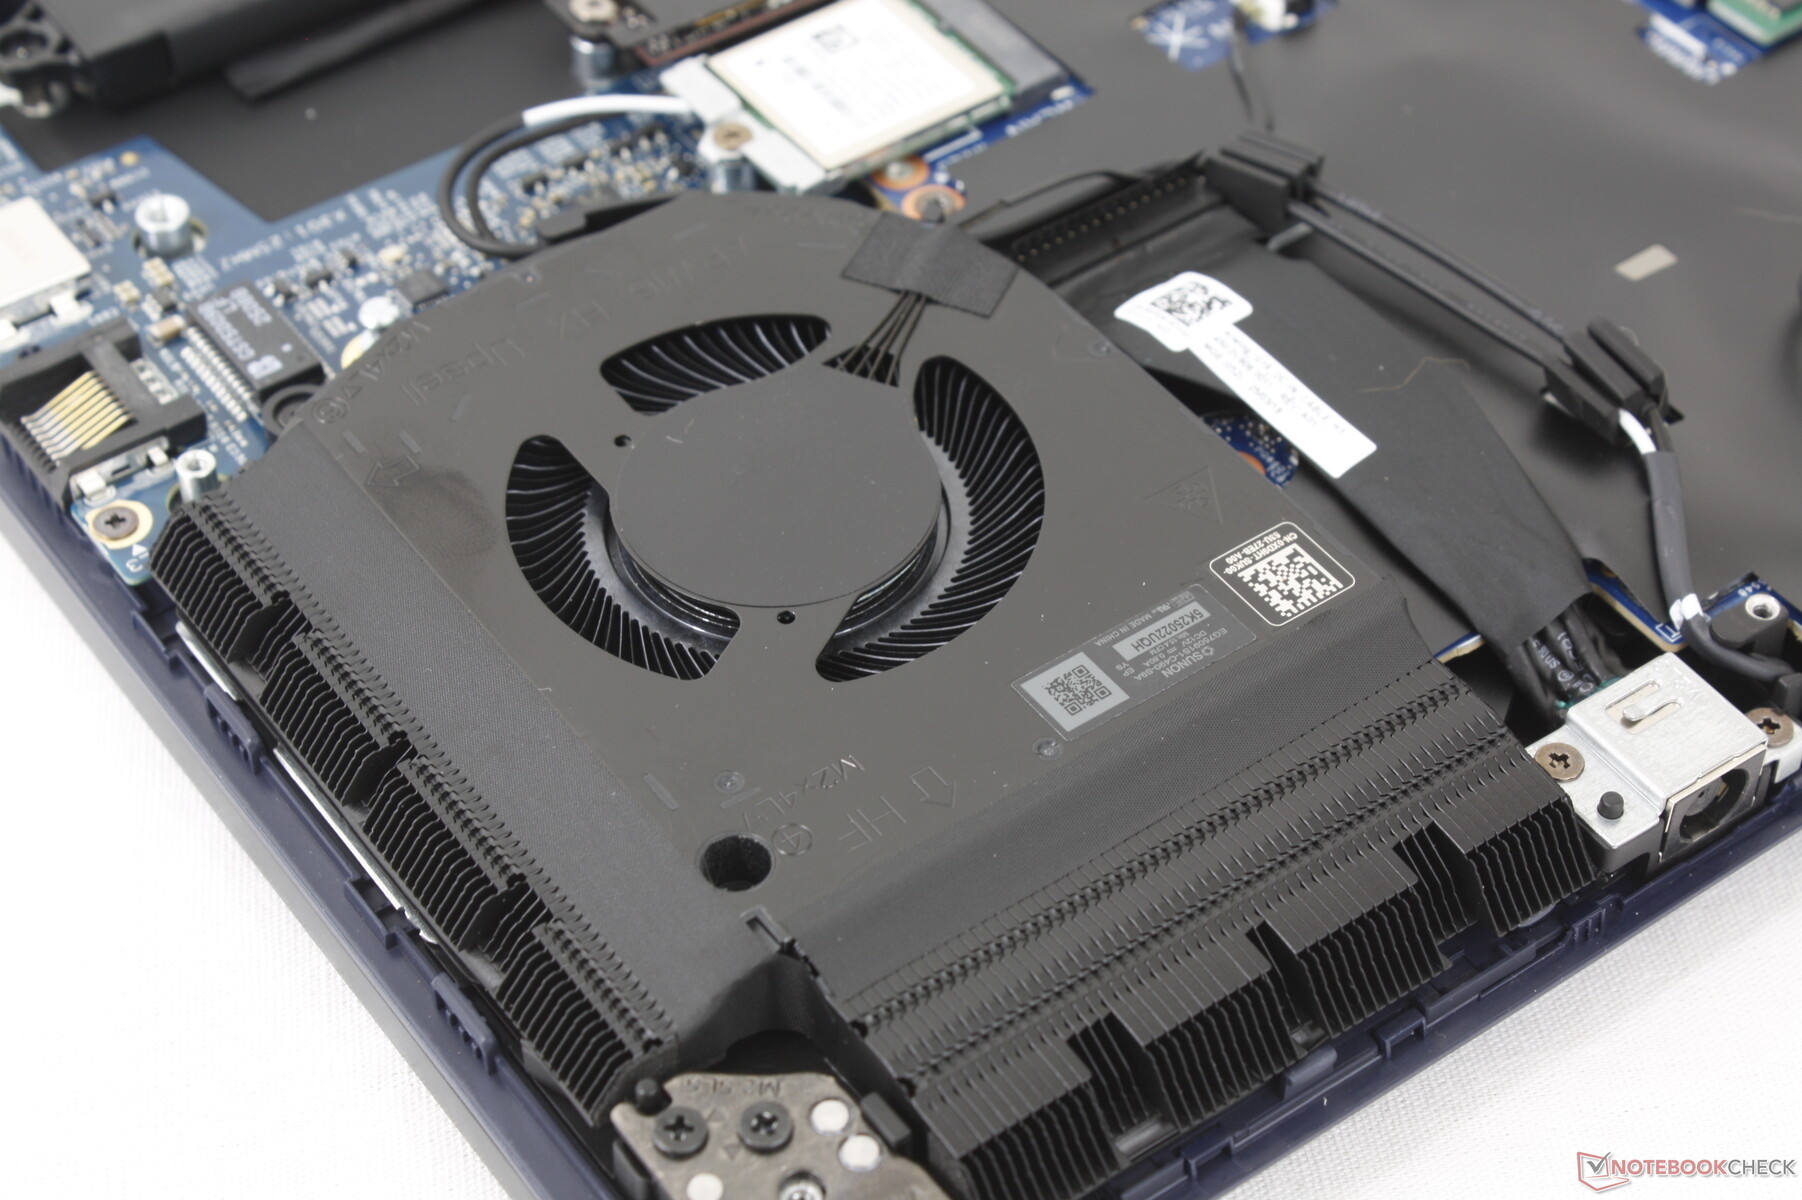
Le boîtier peut être décrit comme une version atténuée de l'Alienware 16 Area-51. Les lumières RGB à l'arrière, la fenêtre en verre Gorilla sur le fond, l'éclairage RGB par touche et les options de couleurs bicolores ont disparu au profit d'un look noir de jais. Le plastique est heureusement réduit au minimum, la majeure partie du châssis étant constituée d'alliage de magnésium et d'aluminium anodisé, ce qui n'est pas toujours le cas pour les ordinateurs portables de jeu de budget ou de milieu de gamme. La rigidité du châssis est très bonne pour le prix.
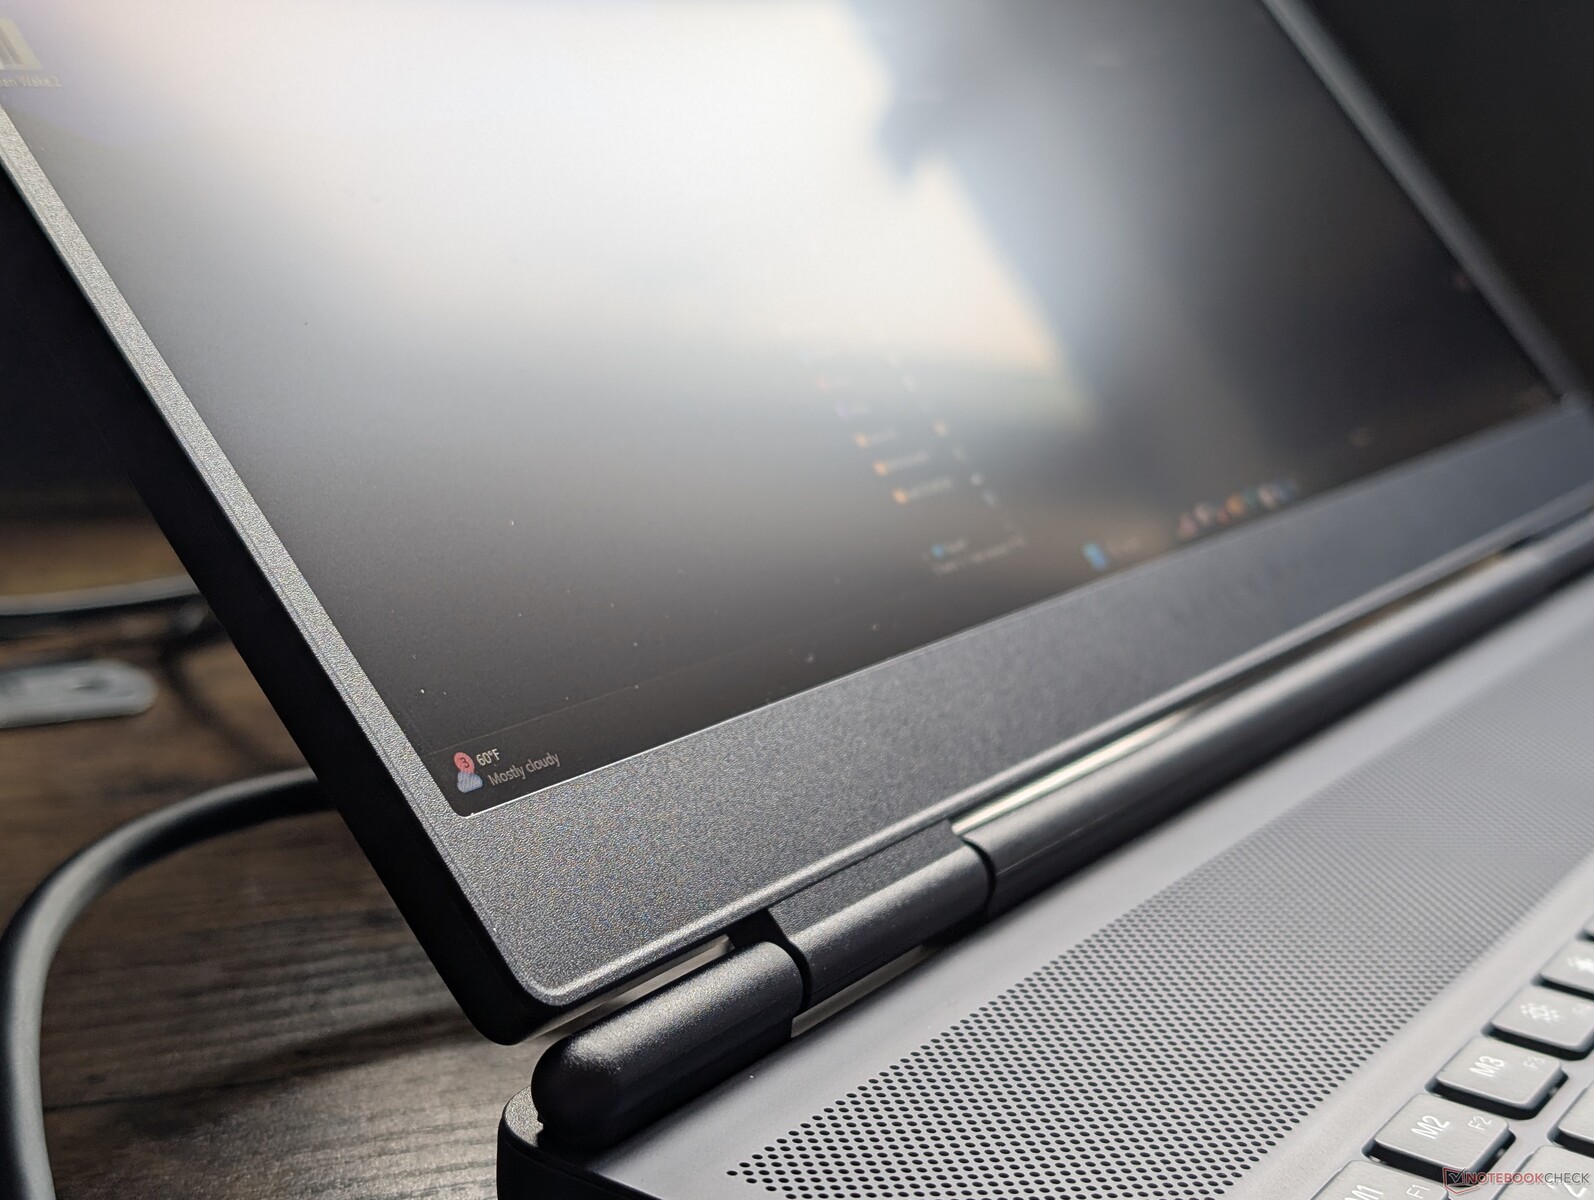
La rigidité des charnières pourrait néanmoins être plus importante pour une meilleure longévité car elles peuvent s'ouvrir à 180 degrés contrairement à l'Area-51. Préparez-vous à nettoyer souvent le repose-paume et les touches, car les empreintes digitales s'accumulent facilement sur toute la machine.
Bien qu'il soit loin d'être aussi lourd que l'Area-51, l'Aurora 16X est tout de même assez lourd pour un ordinateur portable de jeu de 16 pouces. Des alternatives comme l'Asus TUF Gaming A16 ou le Gigabyte Gaming A16 GA6H sont chacune plus légères de quelques centaines de grammes, bien que la première option soit aussi légèrement plus épaisse.
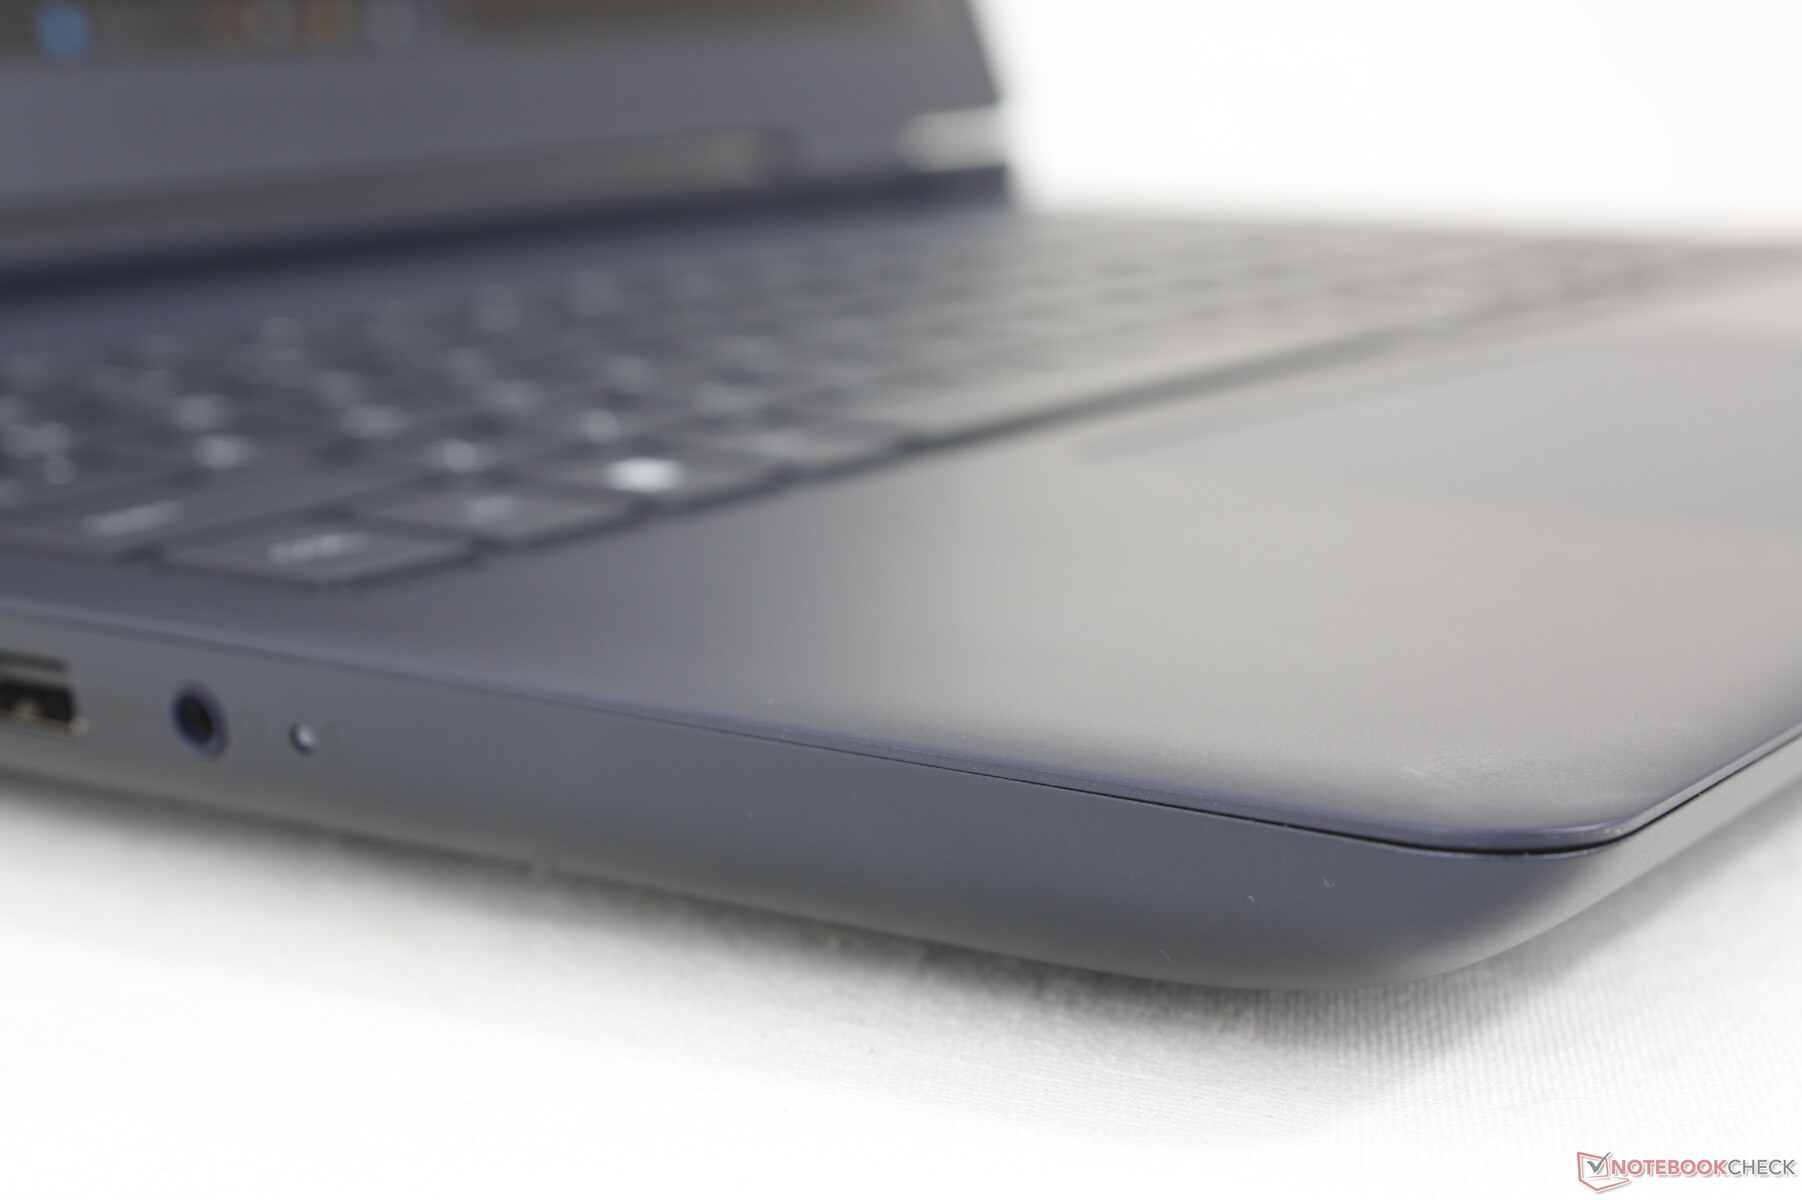
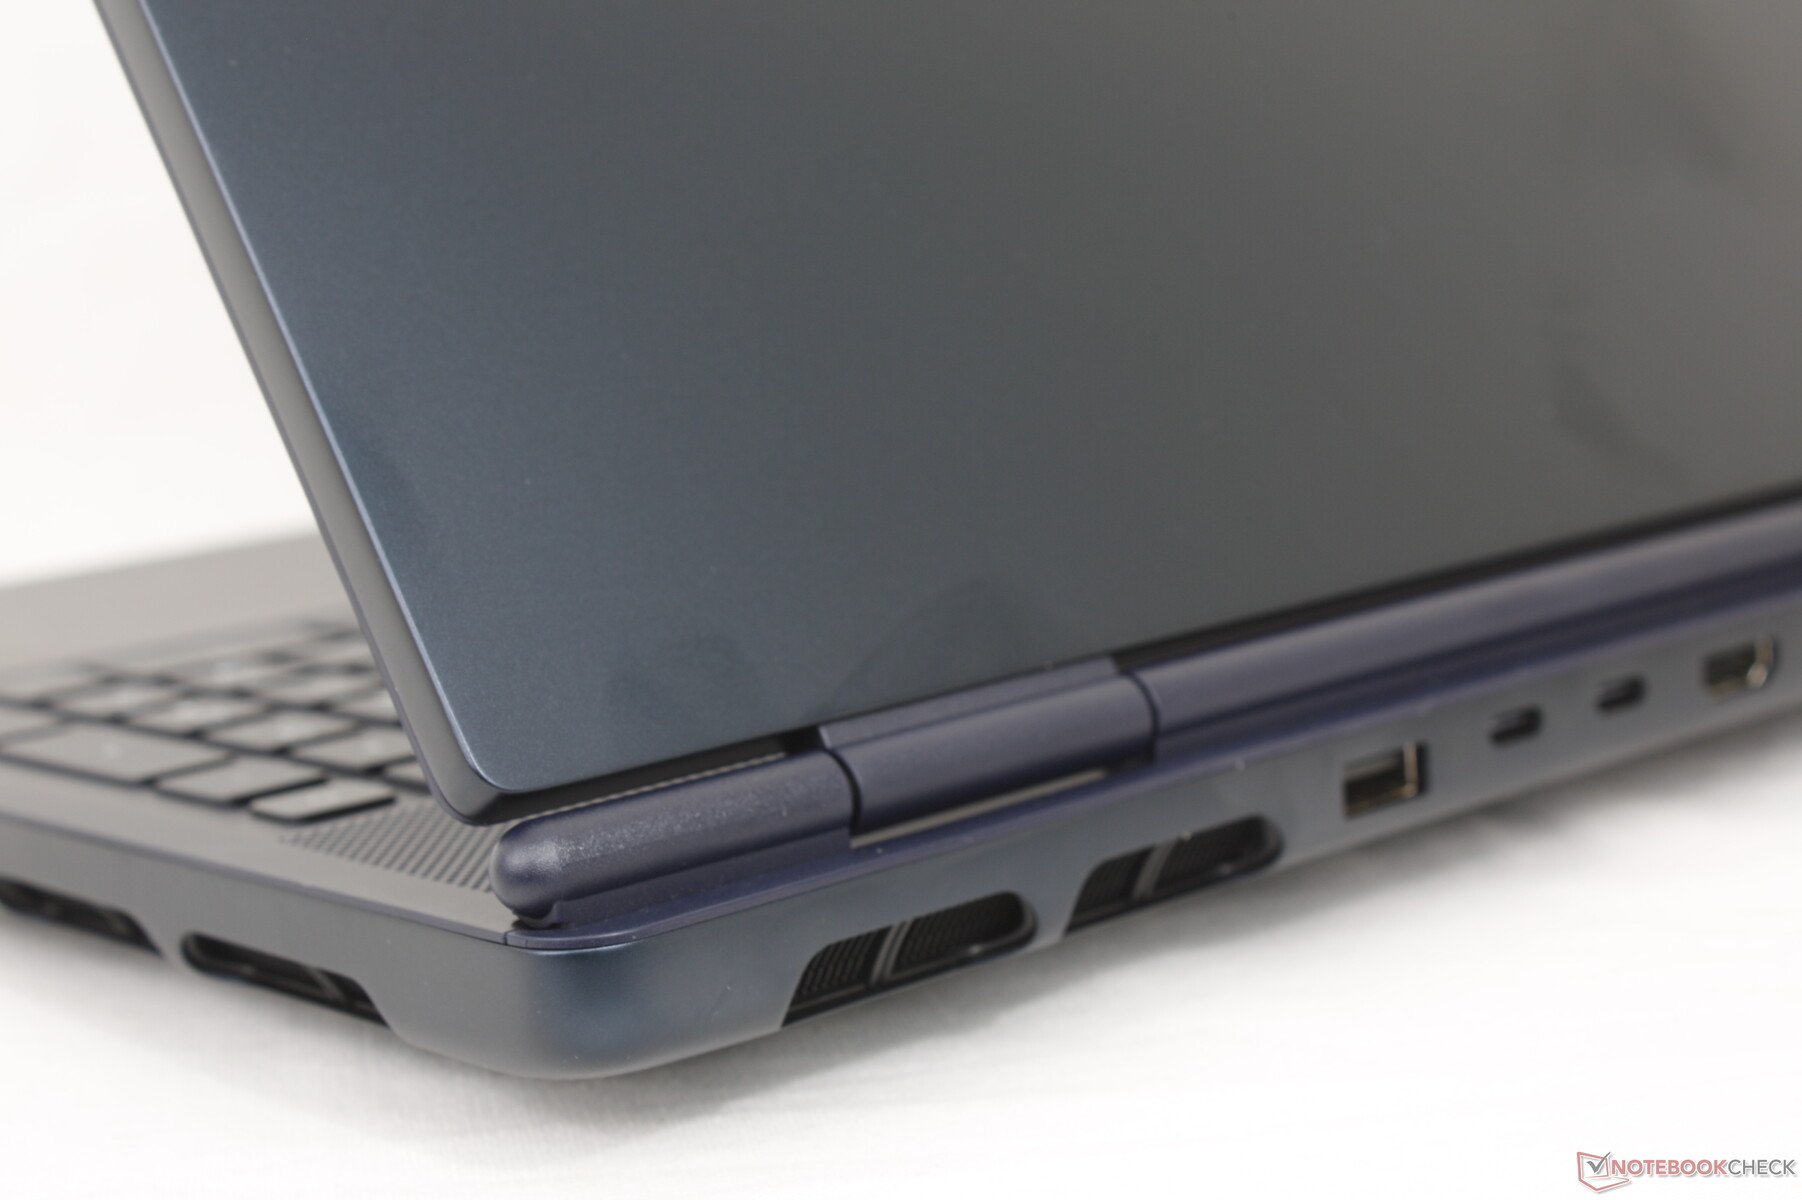
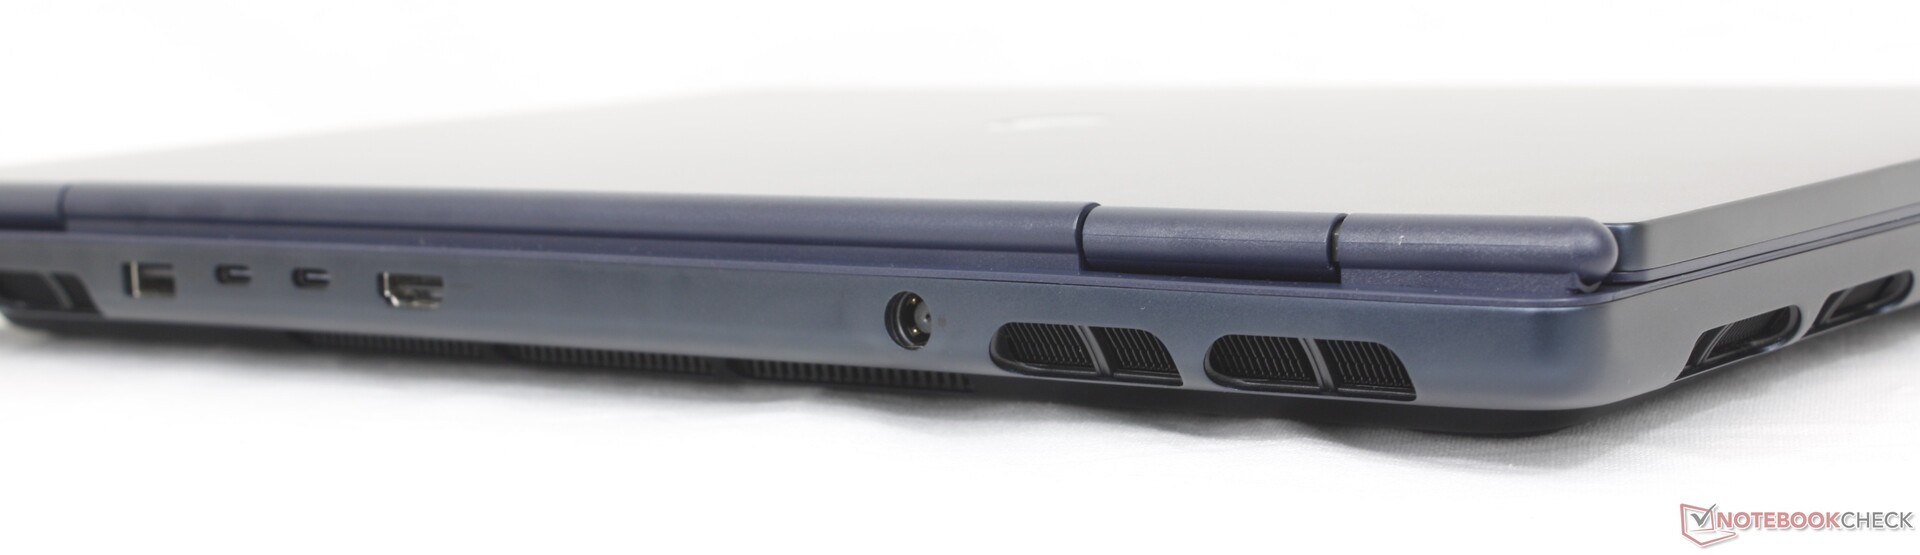
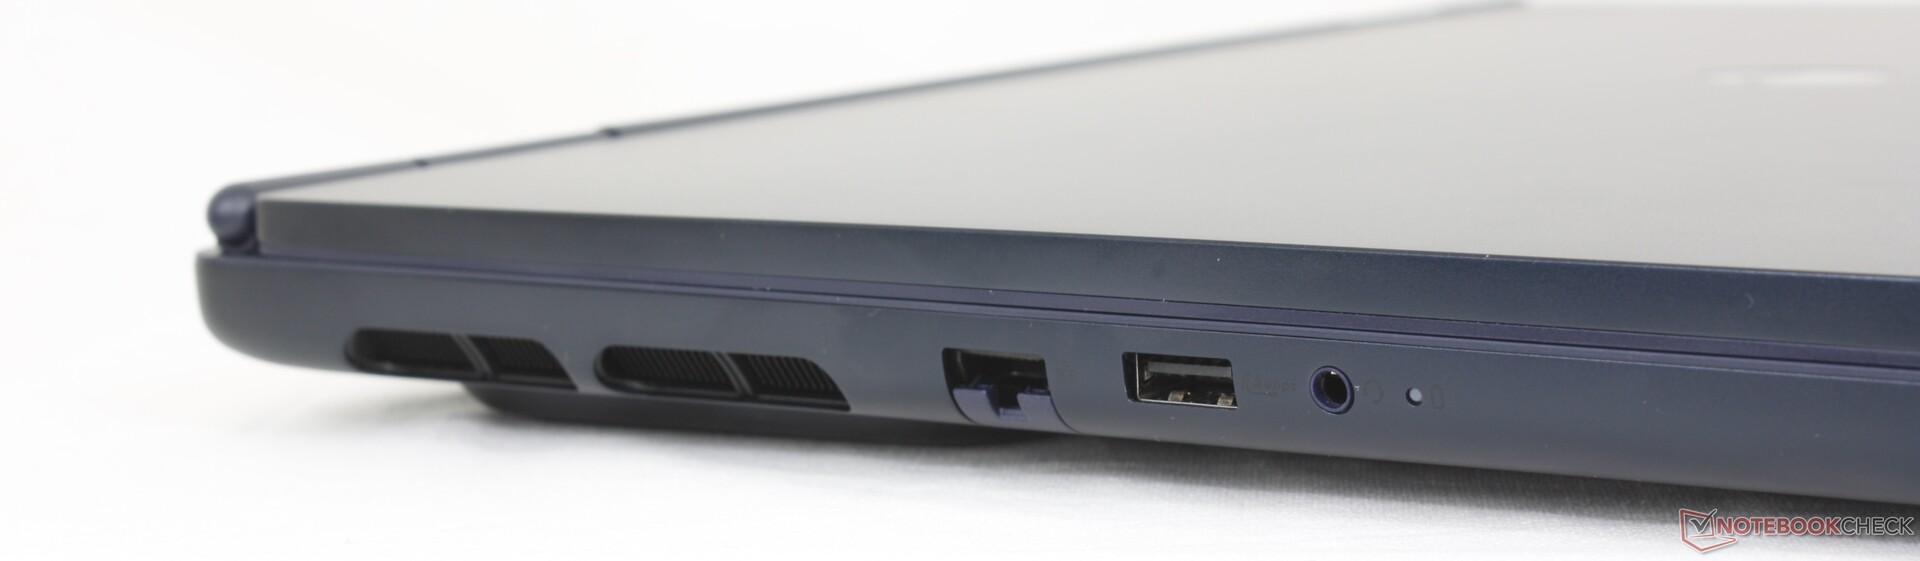
Connectivité
Un port RJ-45 est fourni en standard alors qu'il est absent sur l'Alienware Area-51. Ce modèle comporte néanmoins moins de ports USB-A et aucun lecteur de carte SD, dans un souci d'économie.
Notez que Power Delivery ou la charge avec des adaptateurs secteur USB-C tiers n'est prise en charge que sur le port USB-C 3.2 Gen. 2 et non sur le port Thunderbolt 4.
Communication
| Networking | |
| iperf3 transmit AXE11000 | |
| Asus TUF Gaming A16 FA608WV | |
| Gigabyte Gaming A16 GA6H | |
| Alienware 16 Area-51 | |
| MSI Vector 16 HX AI A2XWHG | |
| Lenovo Legion 5 Pro 16IAX10H | |
| Alienware 16X Aurora, RTX 5070 | |
| iperf3 receive AXE11000 | |
| Asus TUF Gaming A16 FA608WV | |
| MSI Vector 16 HX AI A2XWHG | |
| Gigabyte Gaming A16 GA6H | |
| Alienware 16 Area-51 | |
| Alienware 16X Aurora, RTX 5070 | |
| Lenovo Legion 5 Pro 16IAX10H | |
| iperf3 transmit AXE11000 6GHz | |
| Asus TUF Gaming A16 FA608WV | |
| Alienware 16X Aurora, RTX 5070 | |
| Alienware 16 Area-51 | |
| iperf3 receive AXE11000 6GHz | |
| Asus TUF Gaming A16 FA608WV | |
| Alienware 16X Aurora, RTX 5070 | |
| Alienware 16 Area-51 | |
Webcam
Une webcam de 2 mégapixels est fournie en standard, avec infrarouge, mais pas d'obturateur de confidentialité.


Maintenance
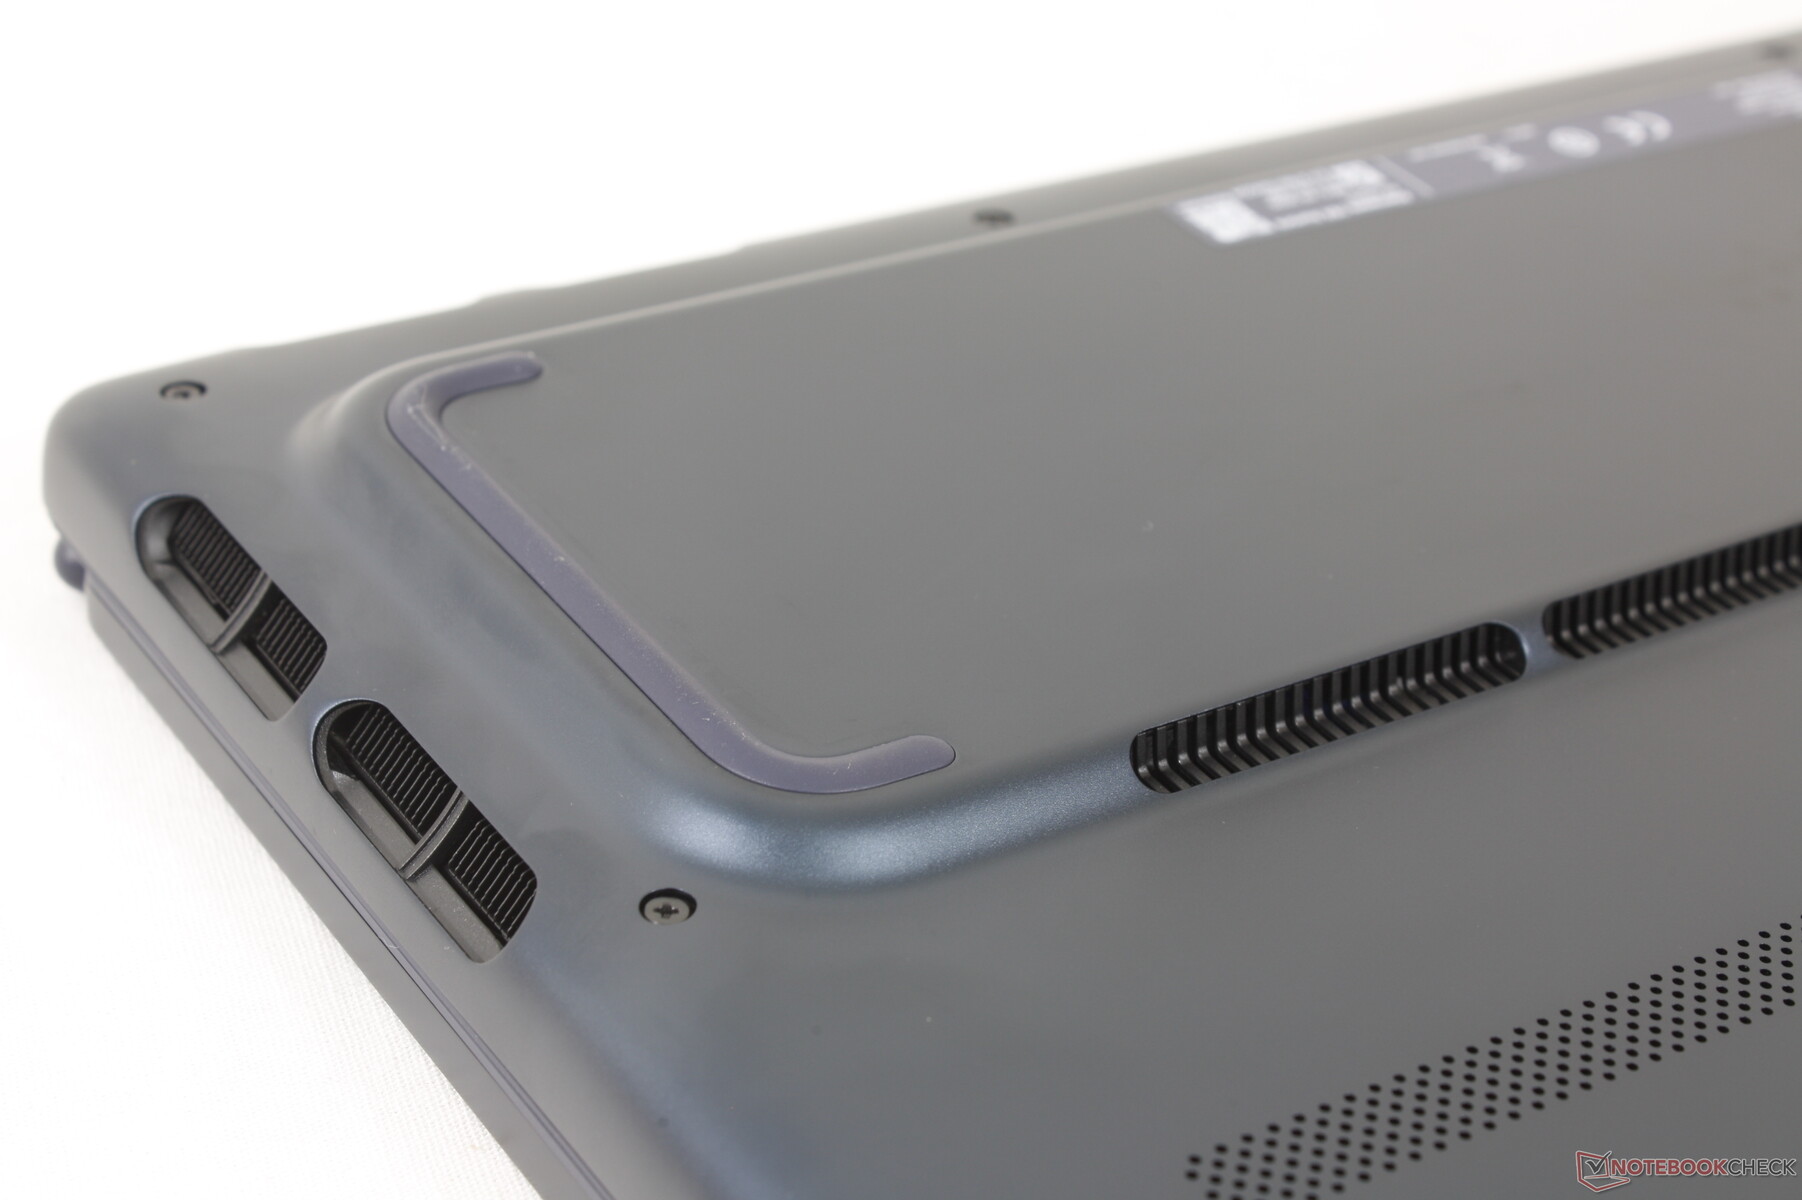
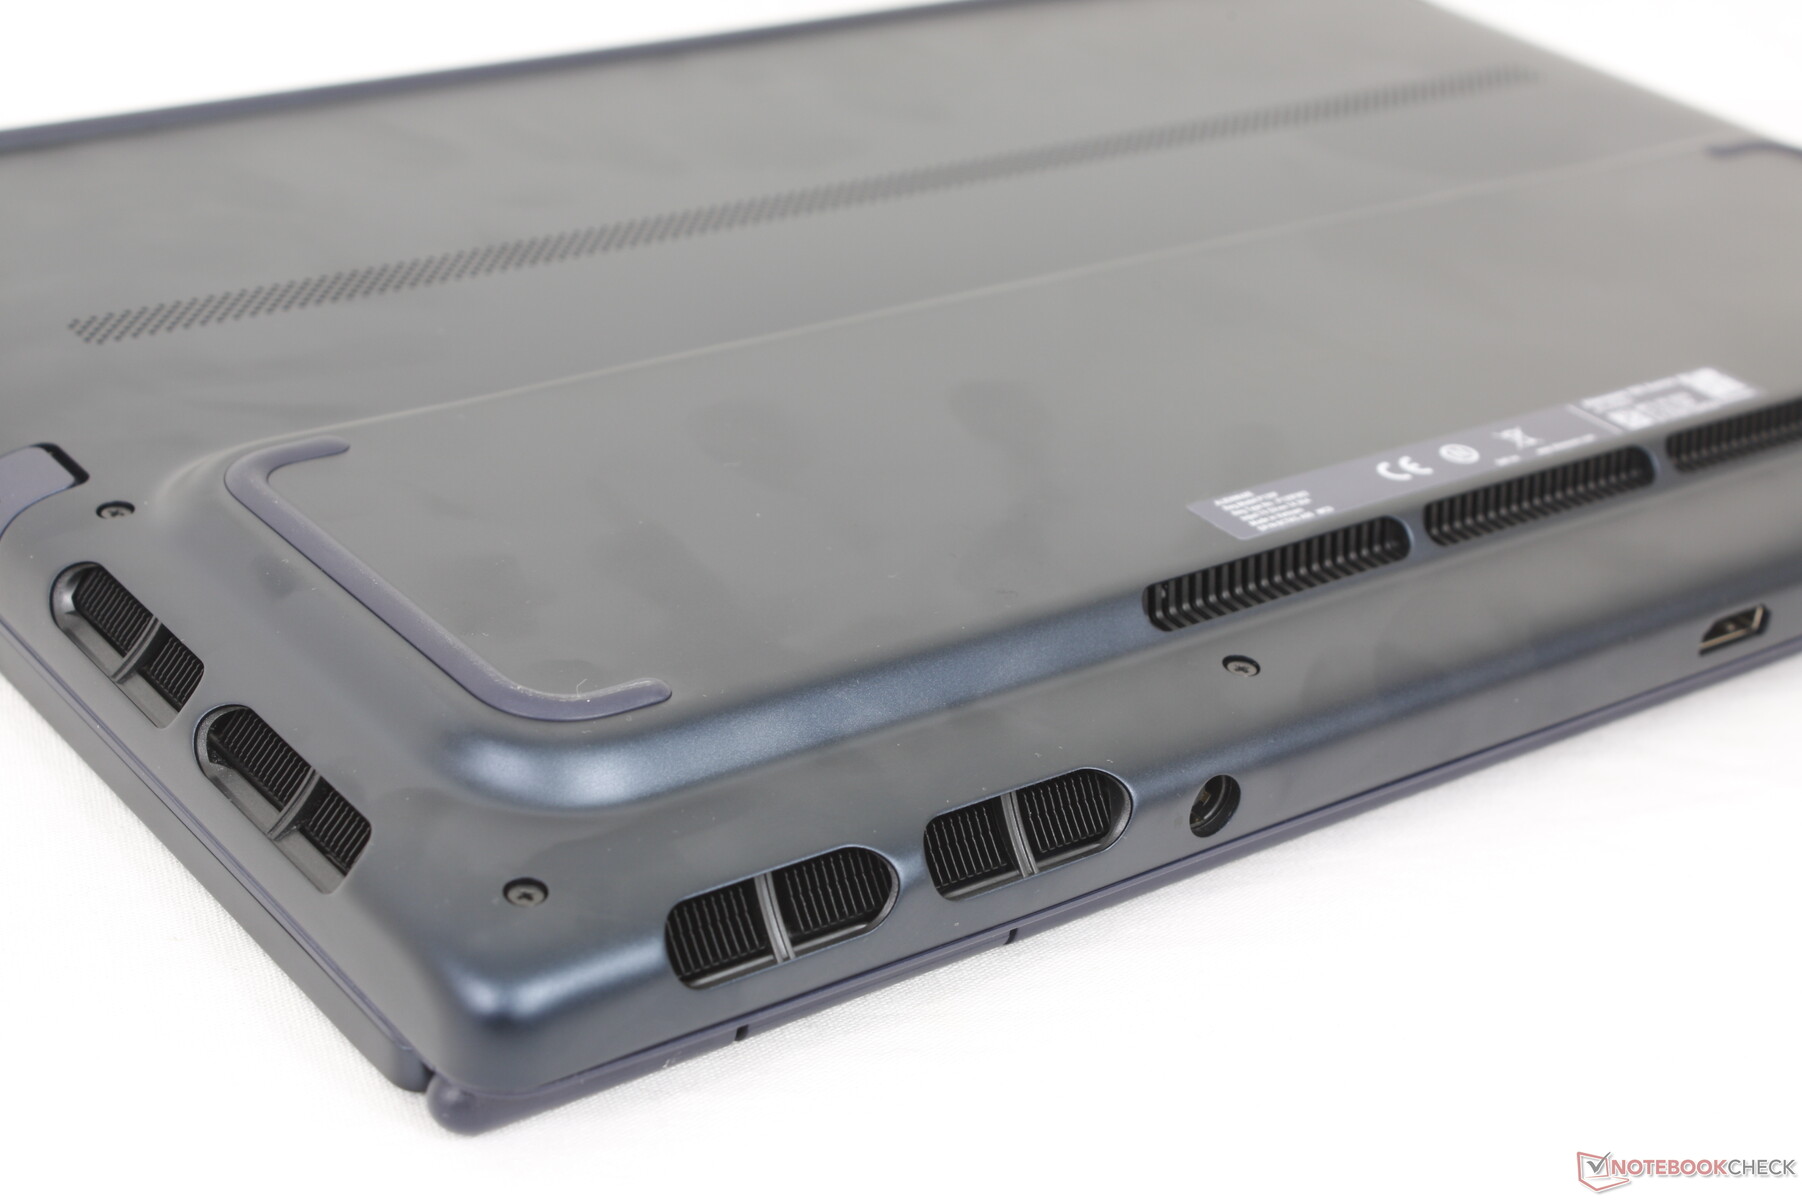
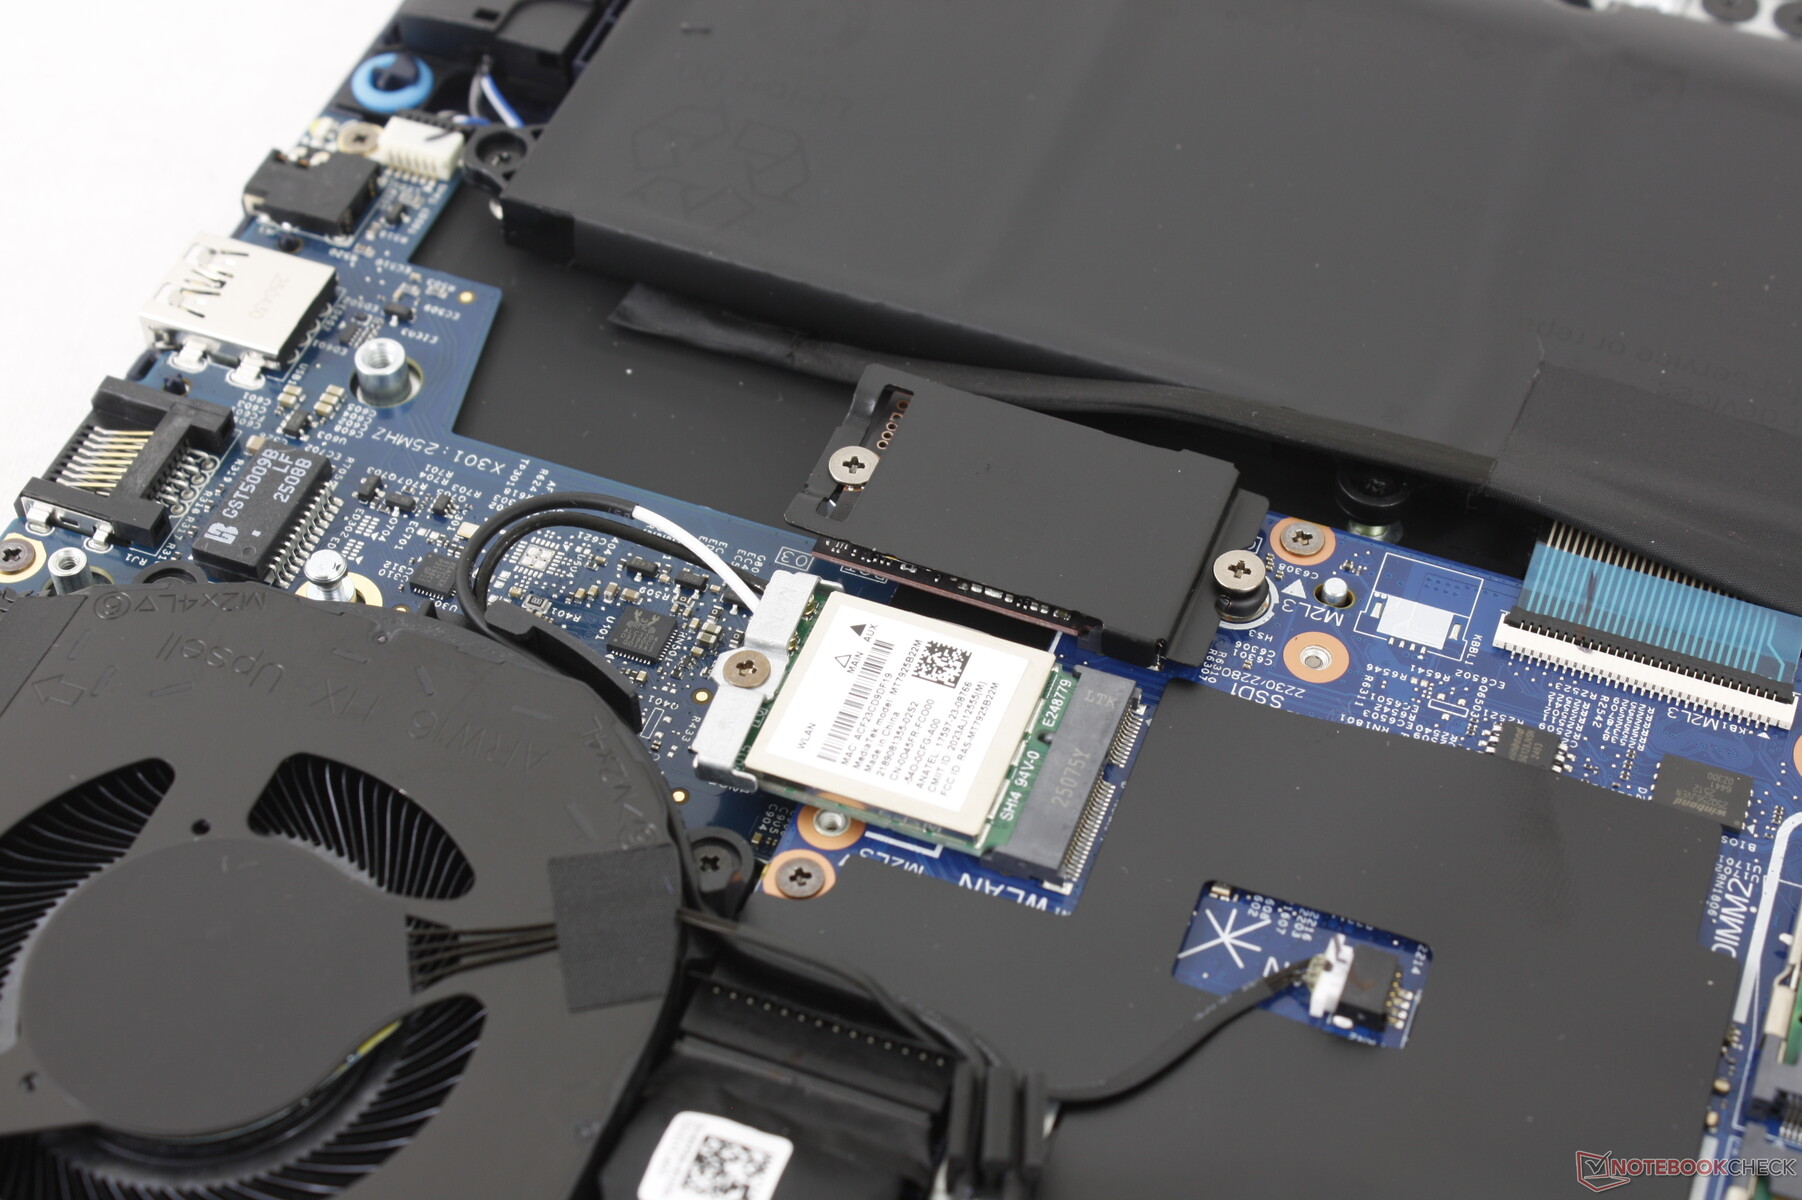
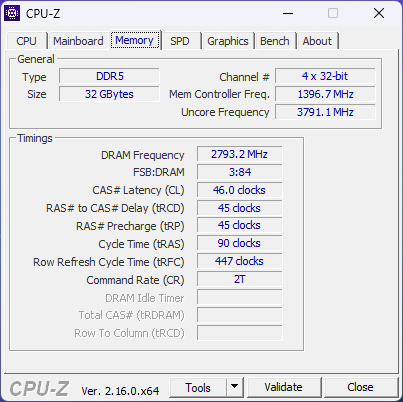
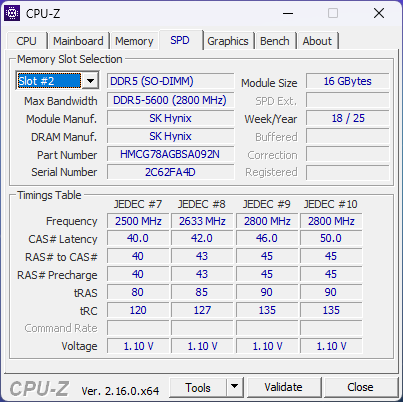
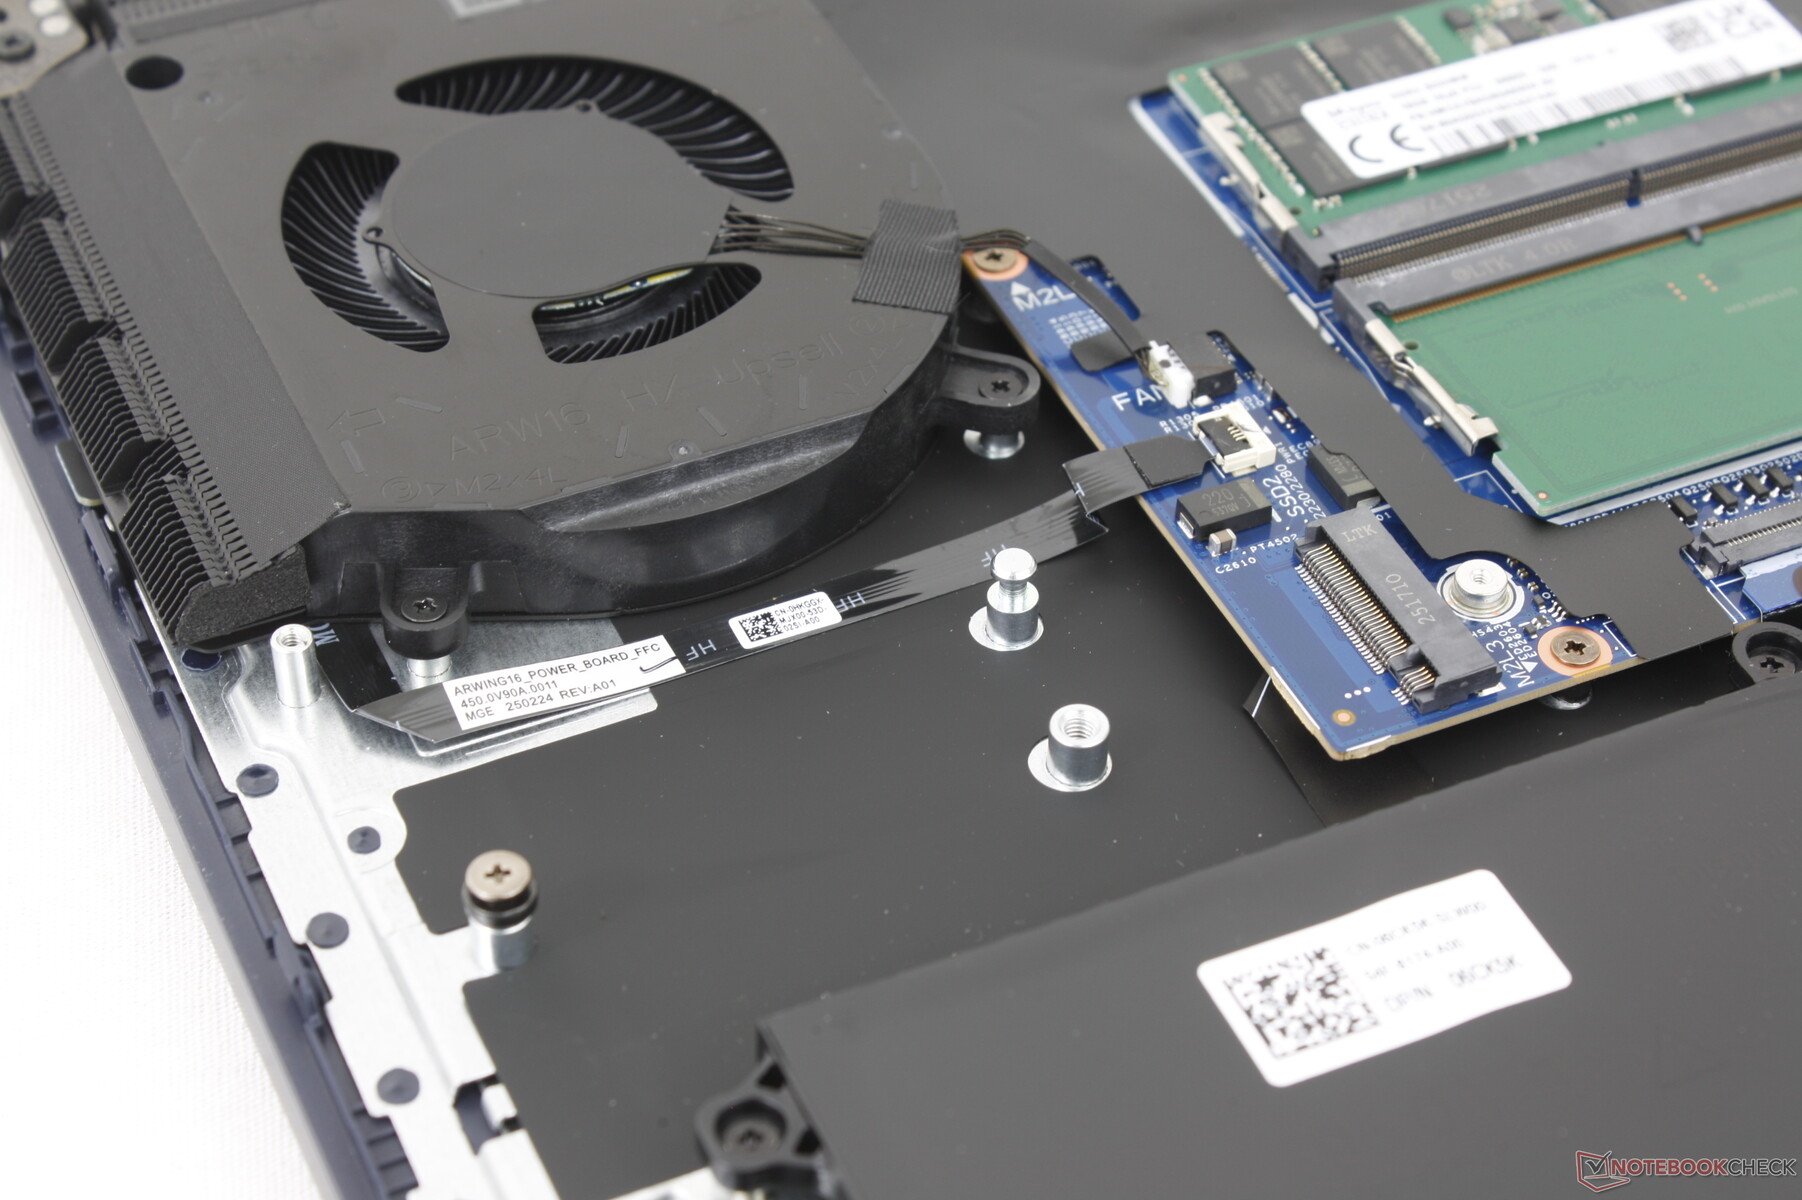
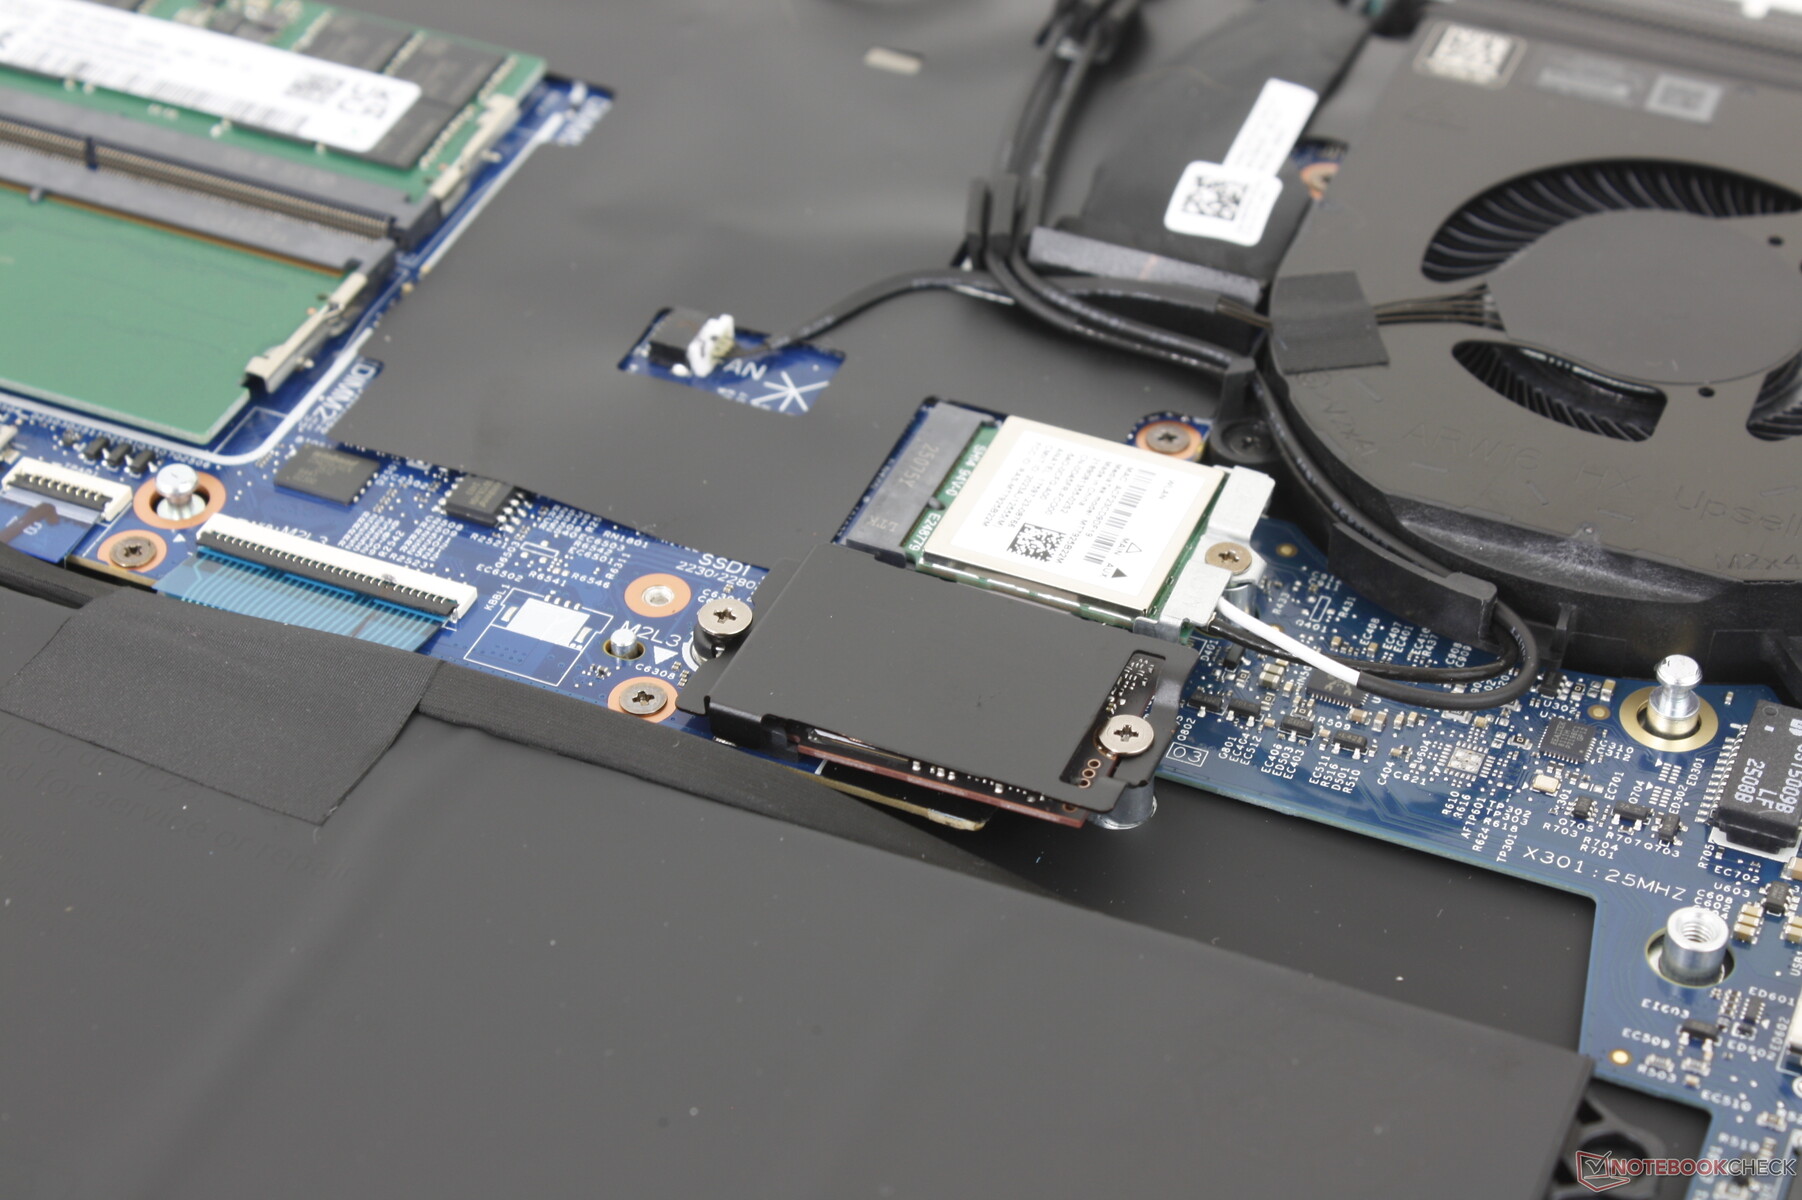
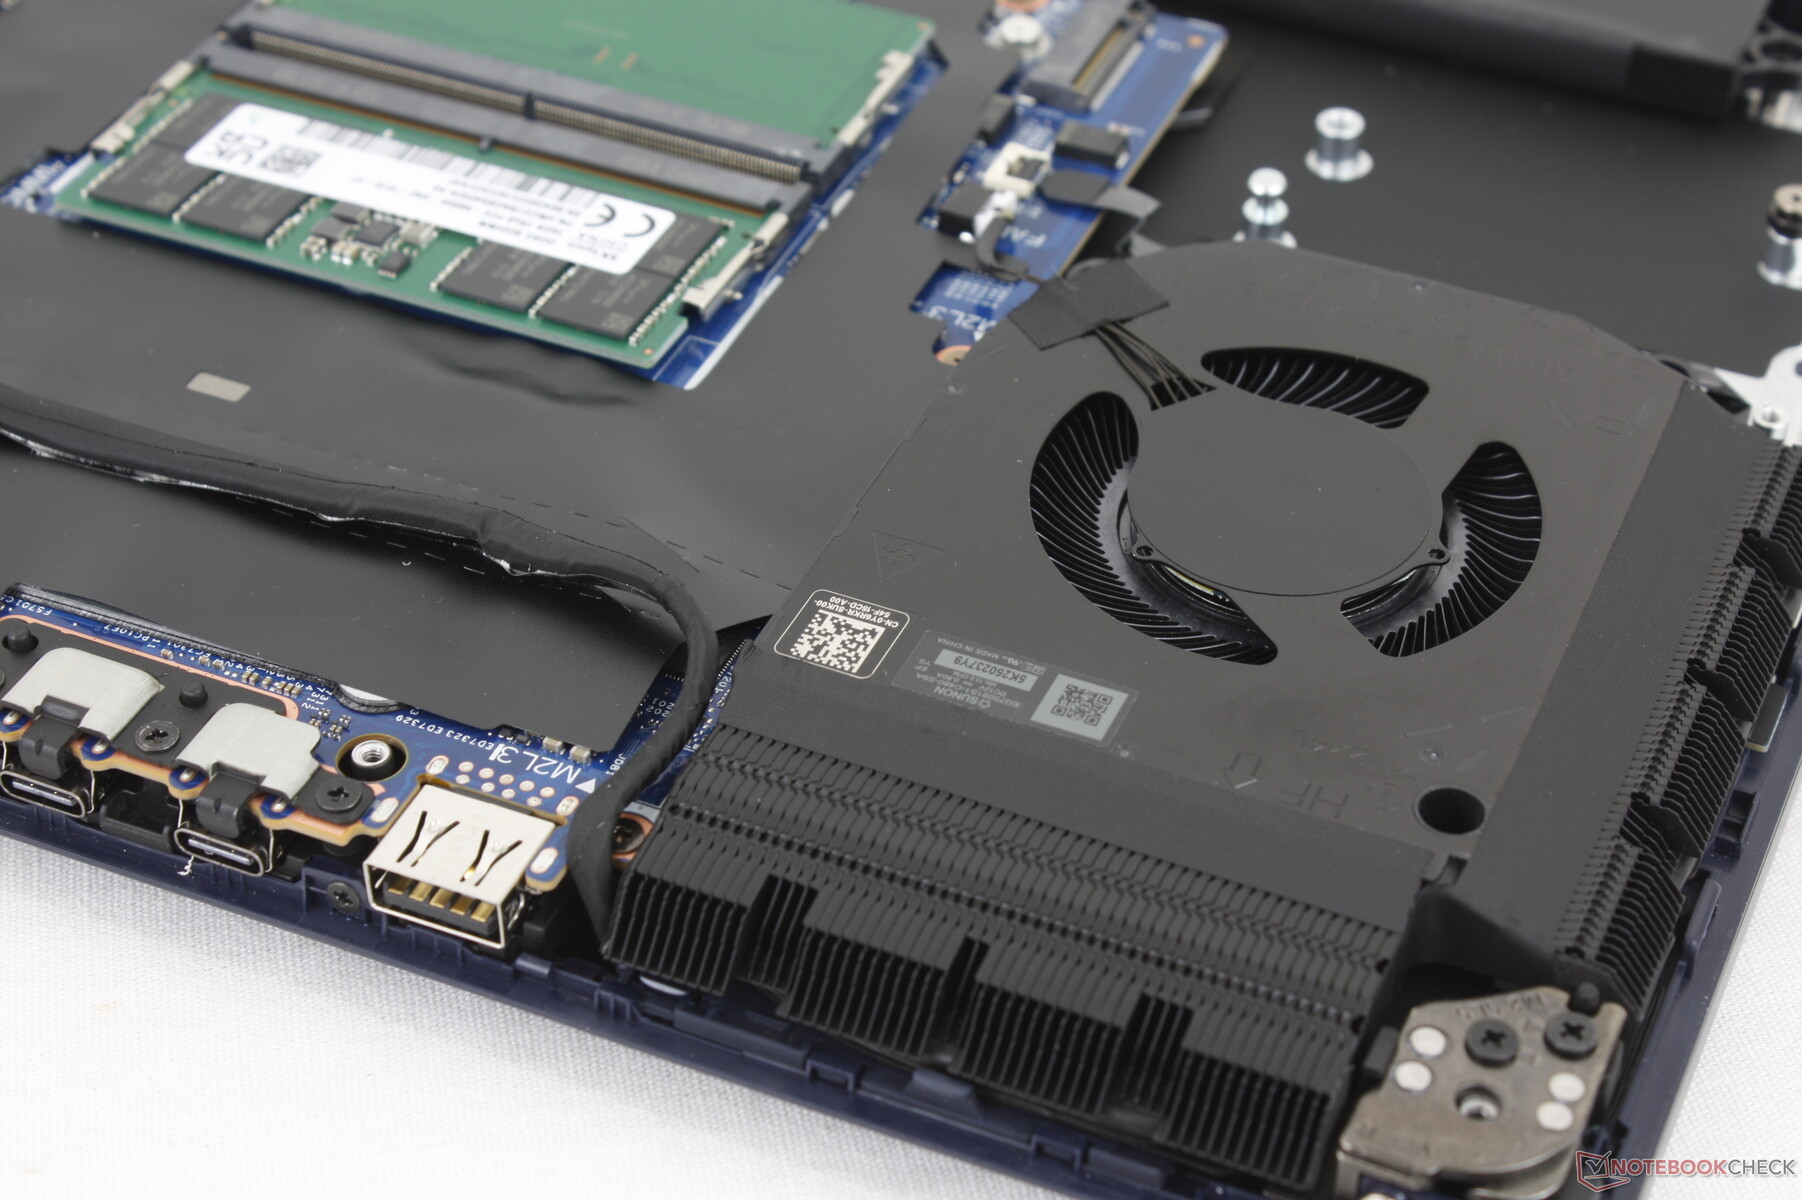
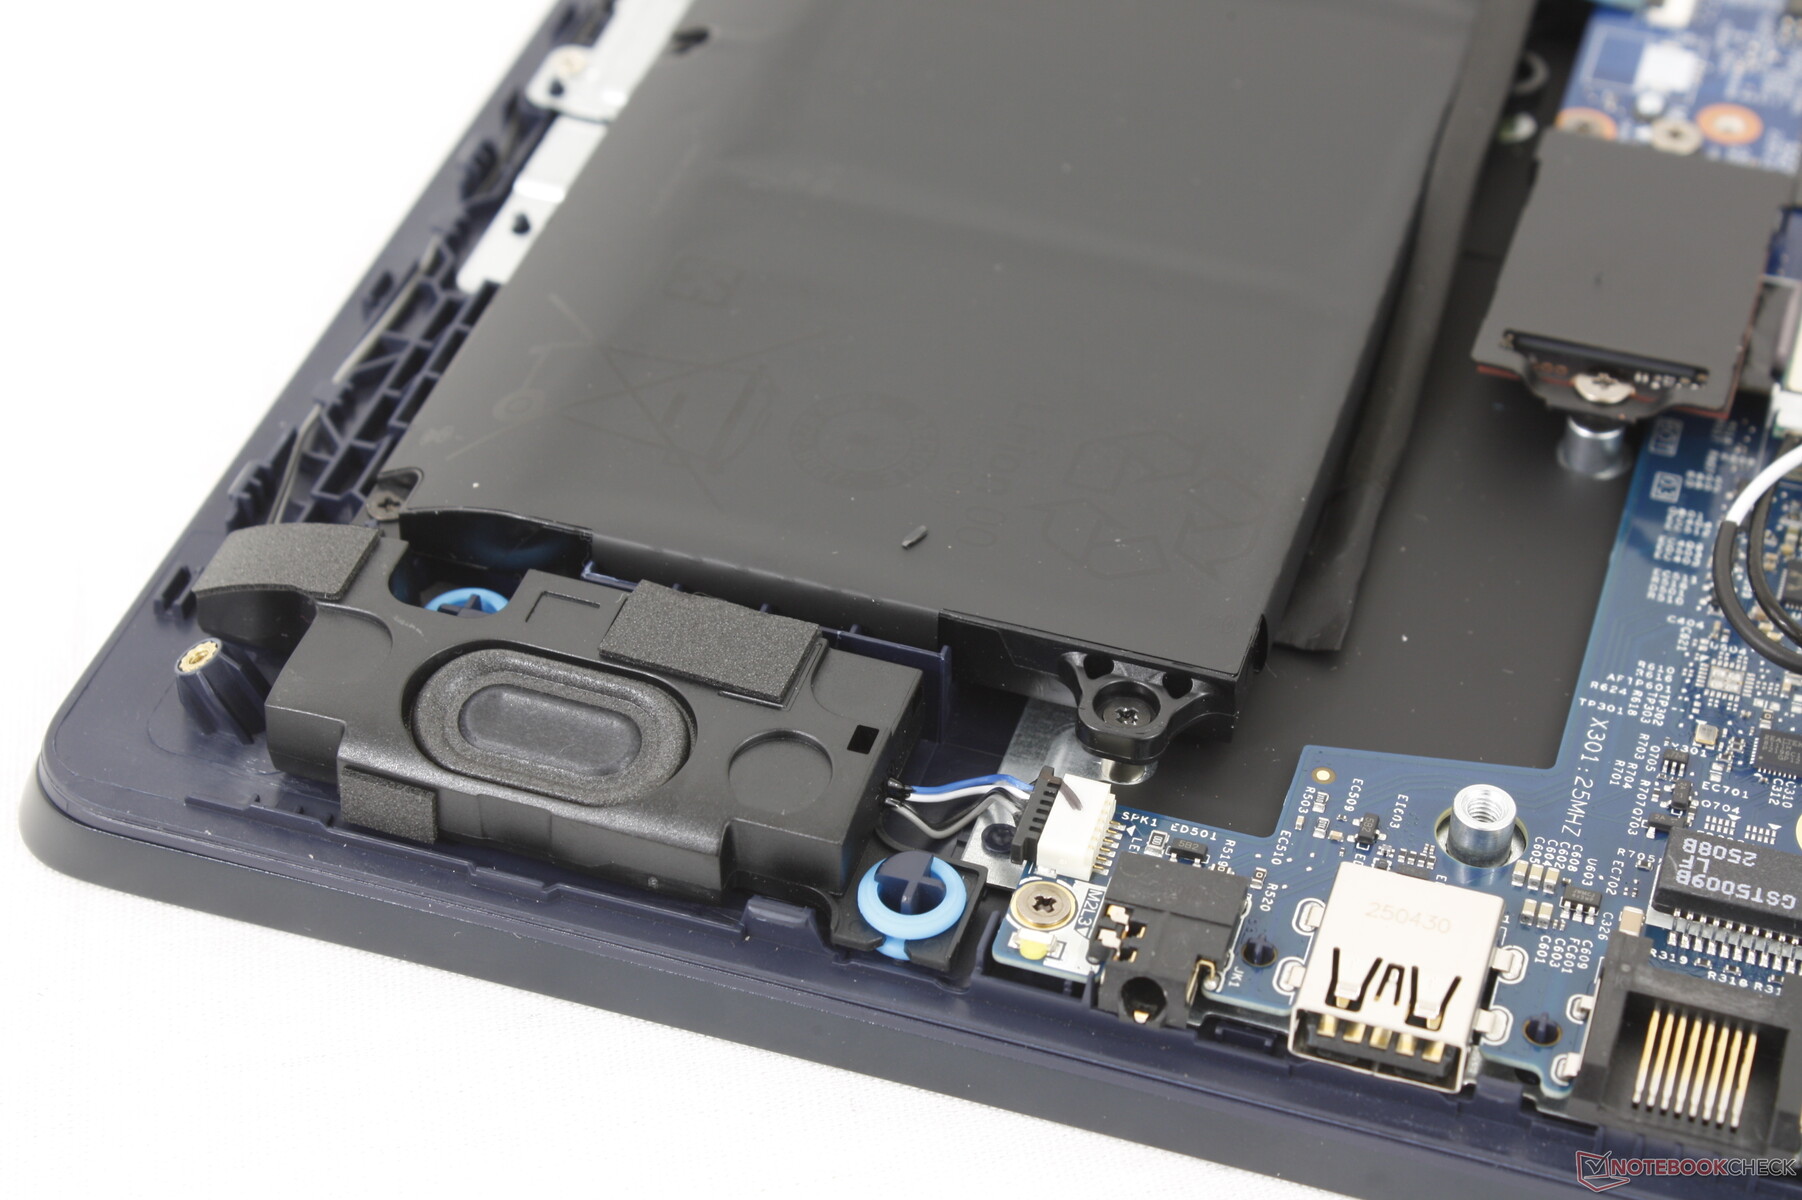
Le panneau inférieur ne nécessite qu'un tournevis Phillips pour être retiré, ce qui facilite l'entretien. Les utilisateurs ont accès à deux emplacements M.2 2280 SSD, à deux emplacements DDR5 SODIMM et au module WLAN amovible une fois à l'intérieur pour un bon niveau d'évolutivité.

Durabilité
Dell utilise des plastiques et des métaux recyclés pour fabriquer sa gamme d'ordinateurs portables, avec des pourcentages croissants au fil du temps. Cela dit, Dell n'a pas précisé les pourcentages exacts de matériaux recyclés utilisés pour sa série 16X Aurora. L'emballage est par ailleurs entièrement recyclable et ne contient pas de plastique.
Accessoires et garantie
La boîte ne contient pas d'autres éléments que l'adaptateur secteur et la documentation. La garantie limitée habituelle d'un an du fabricant s'applique si l'appareil est acheté aux États-Unis.
Périphériques d'entrée
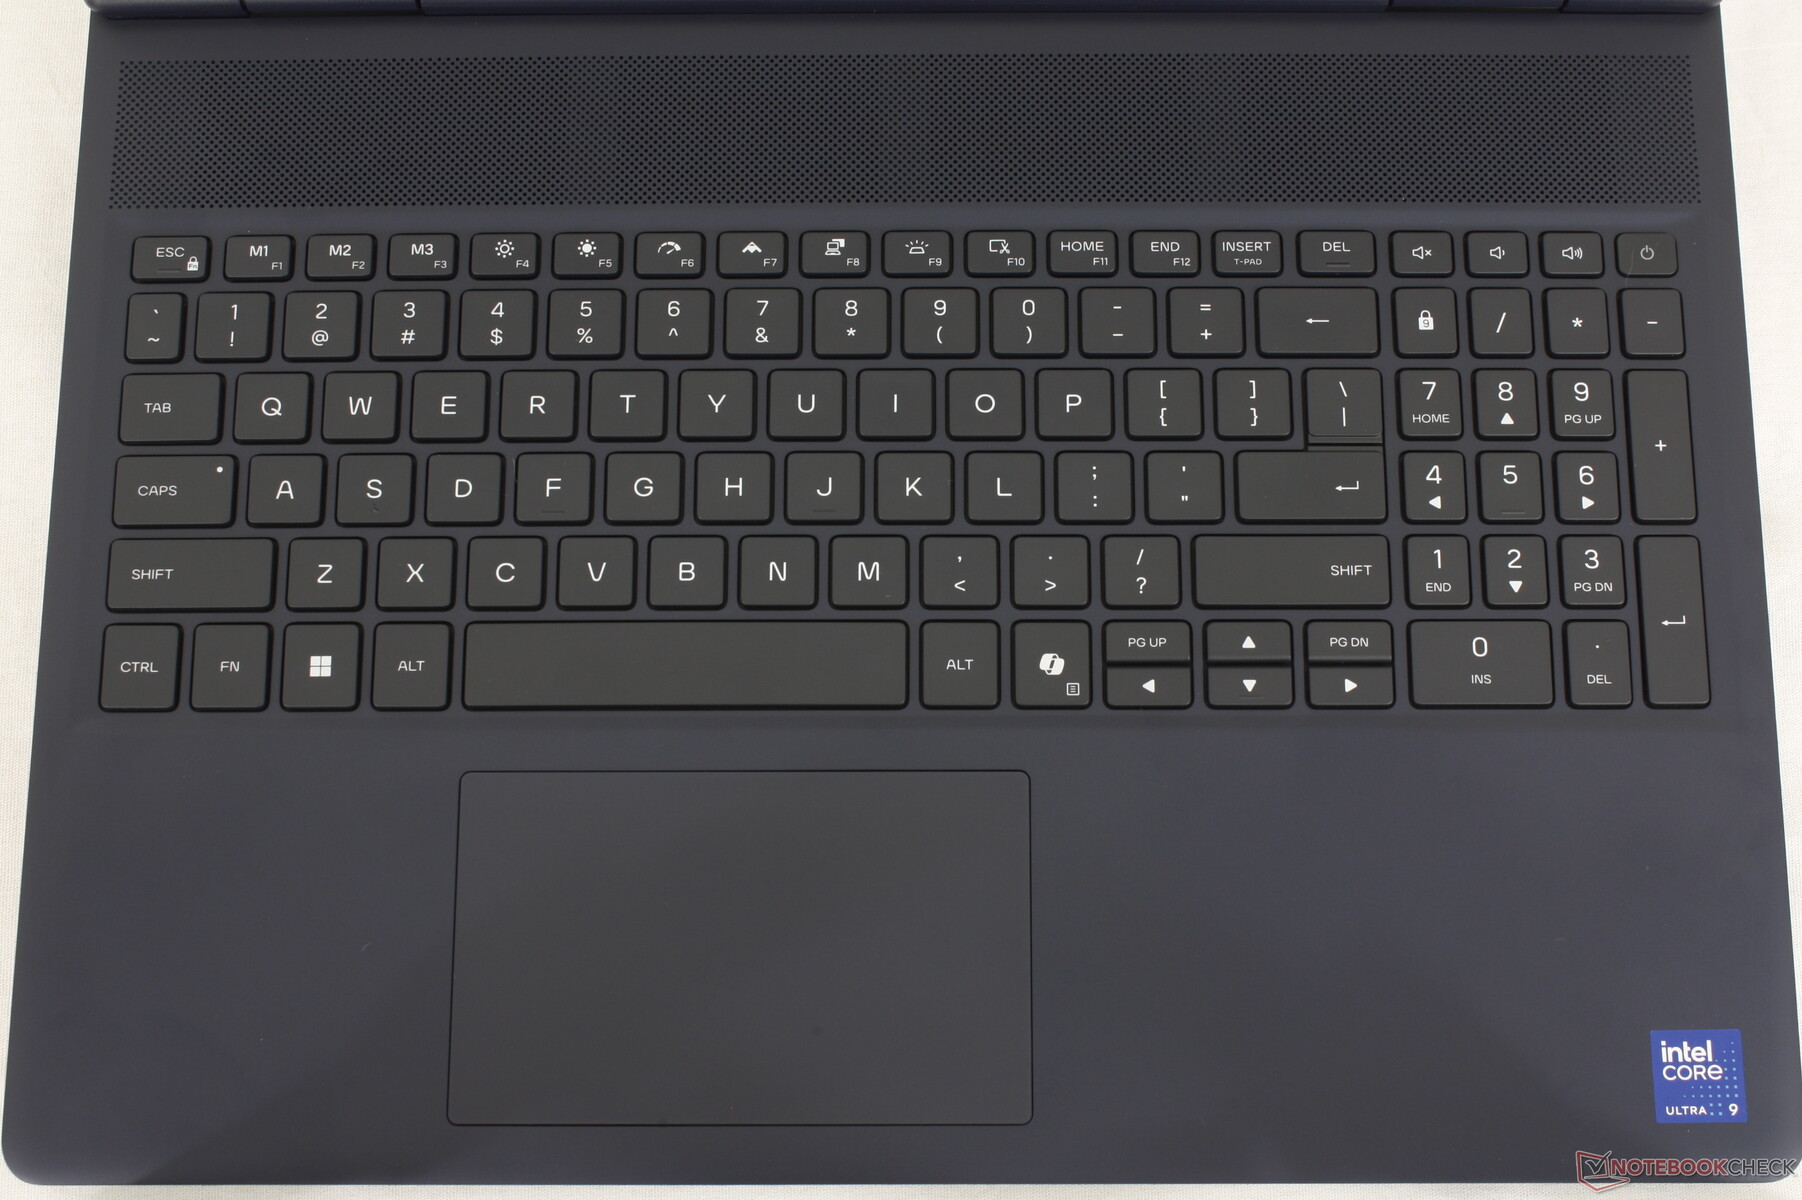
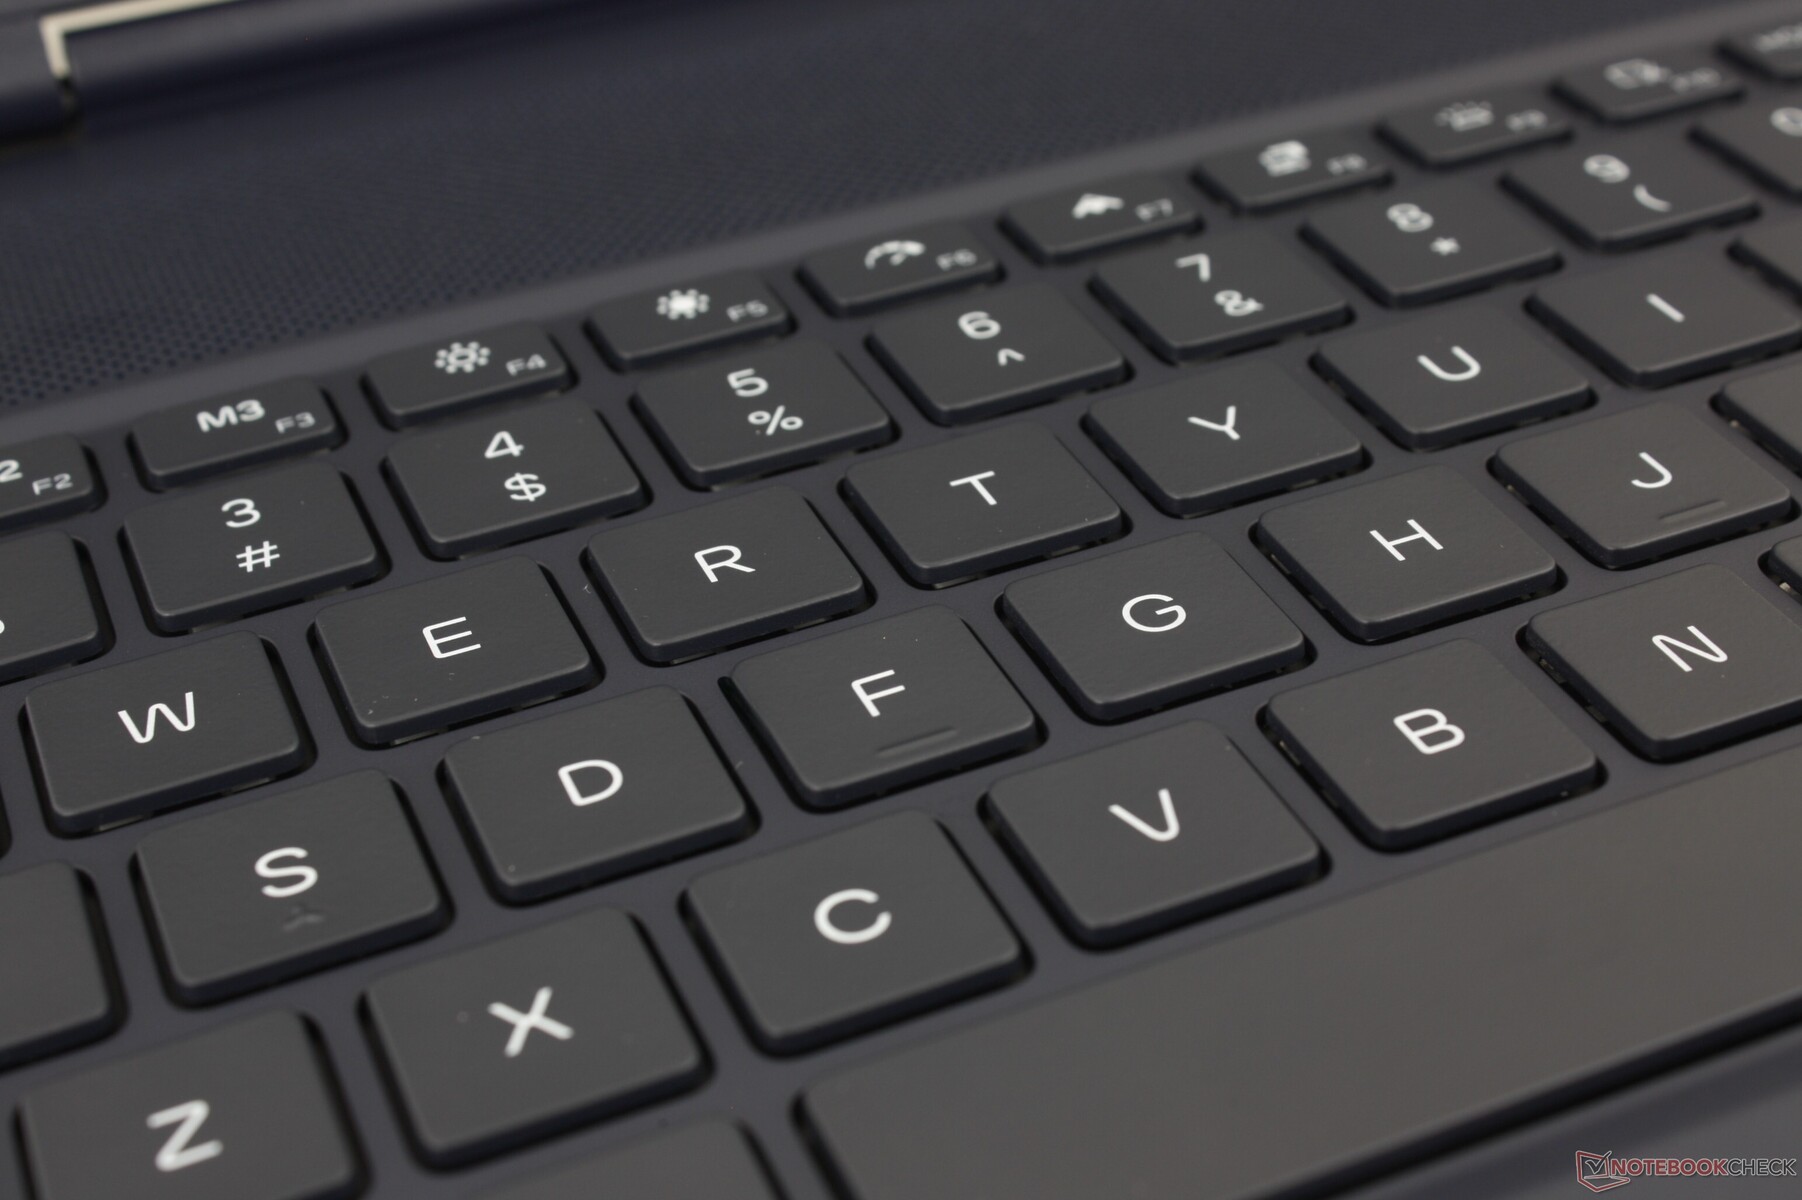
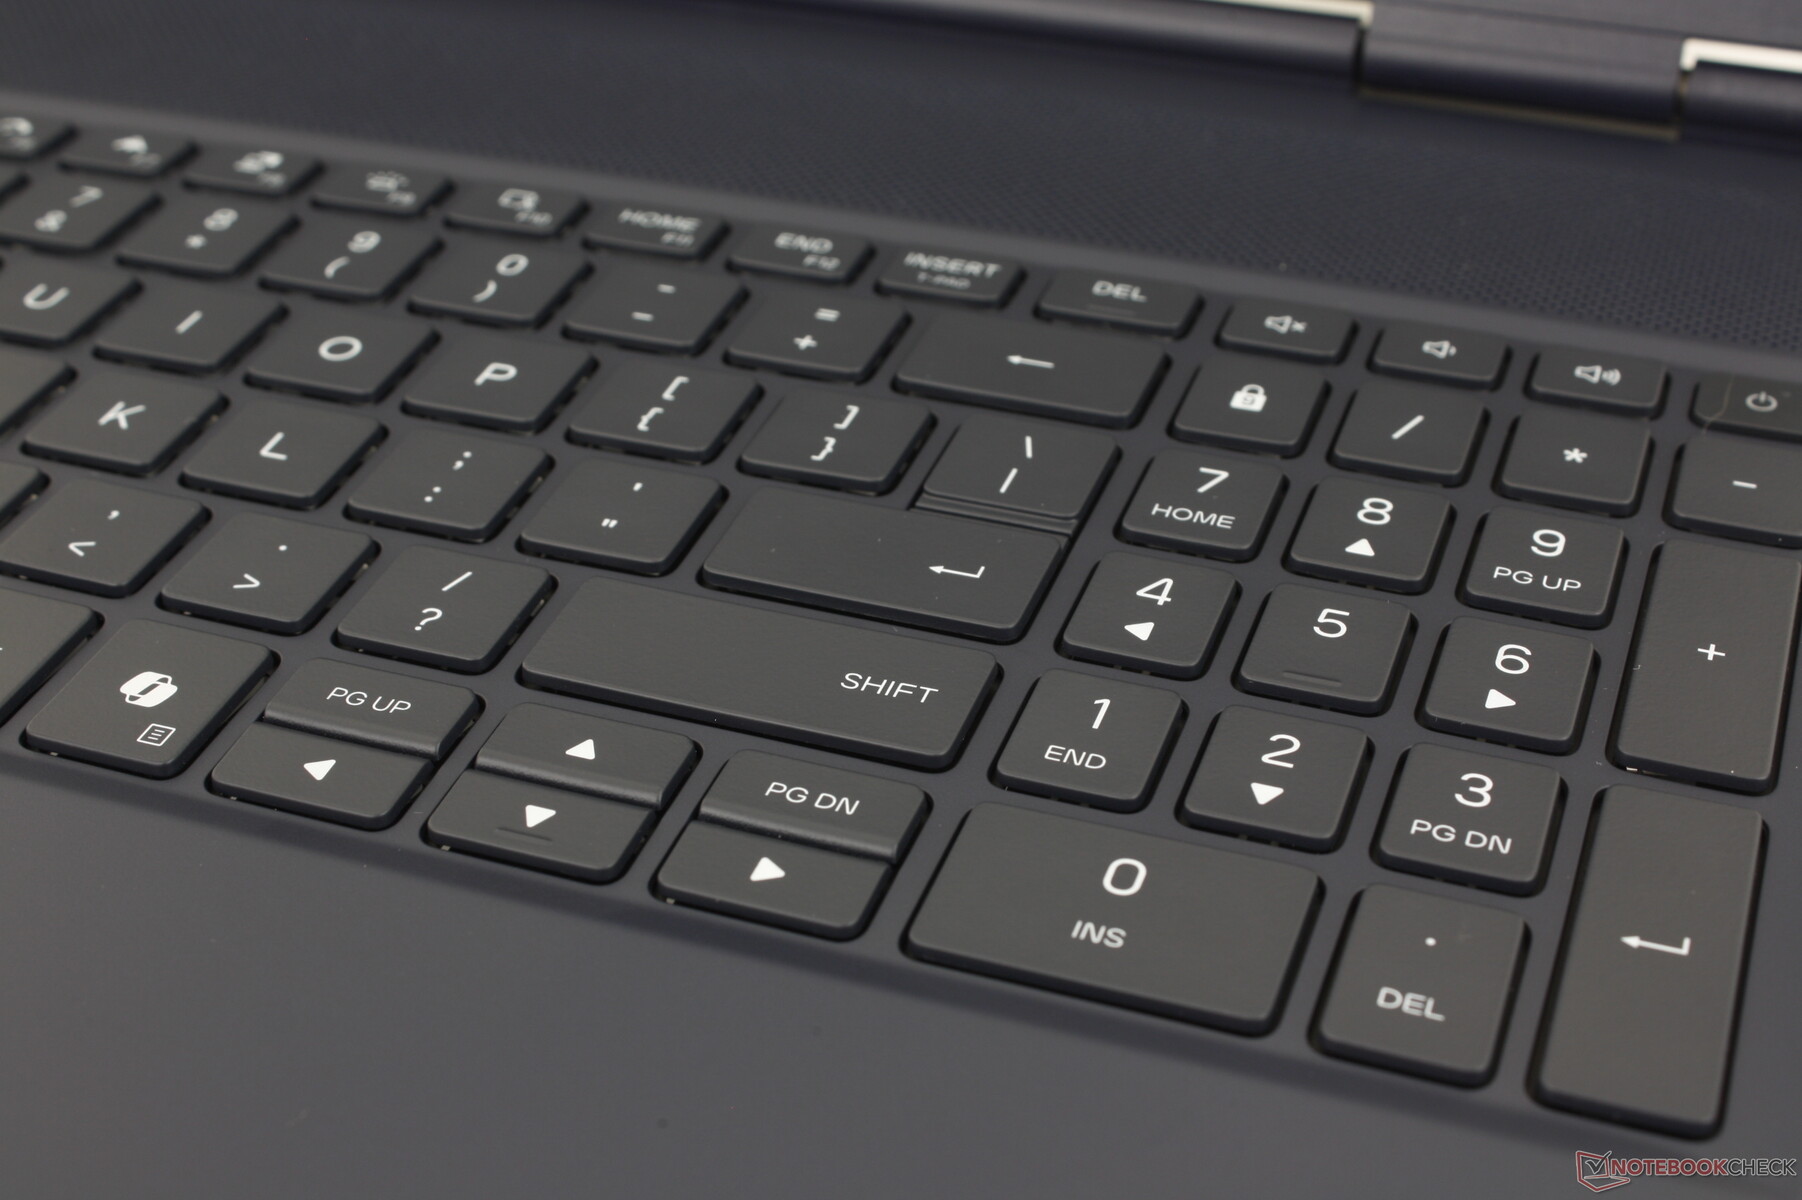
Clavier
Les touches sont plus silencieuses que prévu tout en offrant un retour d'information décent pour une expérience de frappe similaire à celle d'un Ultrabook. Cependant, la frappe ressemble un peu trop à celle d'un Dell Inspiron, l'un des modèles d'ordinateurs portables les moins chers de Dell. La touche Enter, en particulier, aurait pu bénéficier d'un retour d'information plus profond et/ou plus ferme.
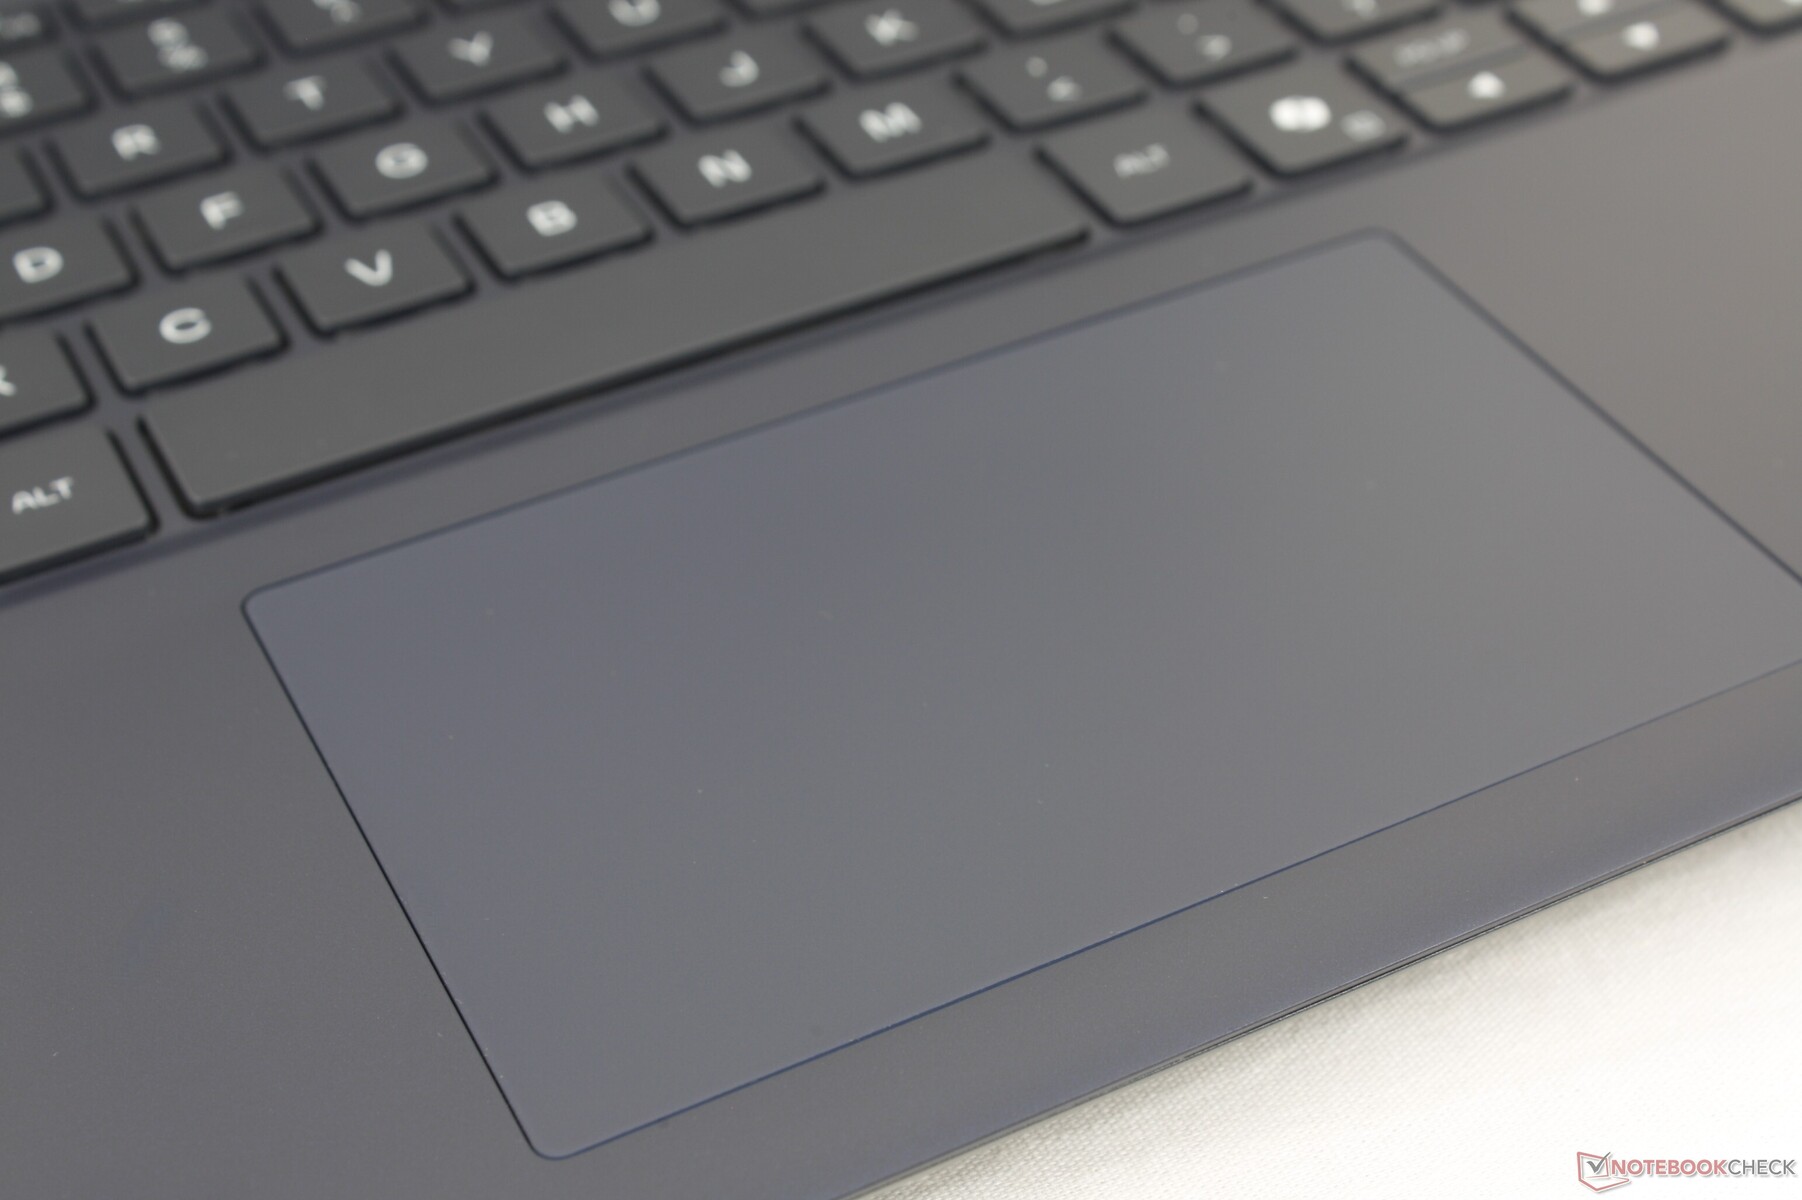
Pavé tactile
Le clickpad est légèrement plus grand que celui de l'Alienware Area-51 (11,5 x 7 cm contre 11,2 x 6,5 cm). Il est néanmoins assez petit par rapport à celui de concurrents comme le Gigabyte Aero X16. Alors que le contrôle du curseur est fluide et fiable à toutes les vitesses, le retour d'information lors du clic est beaucoup trop doux avec une sensation spongieuse insatisfaisante.
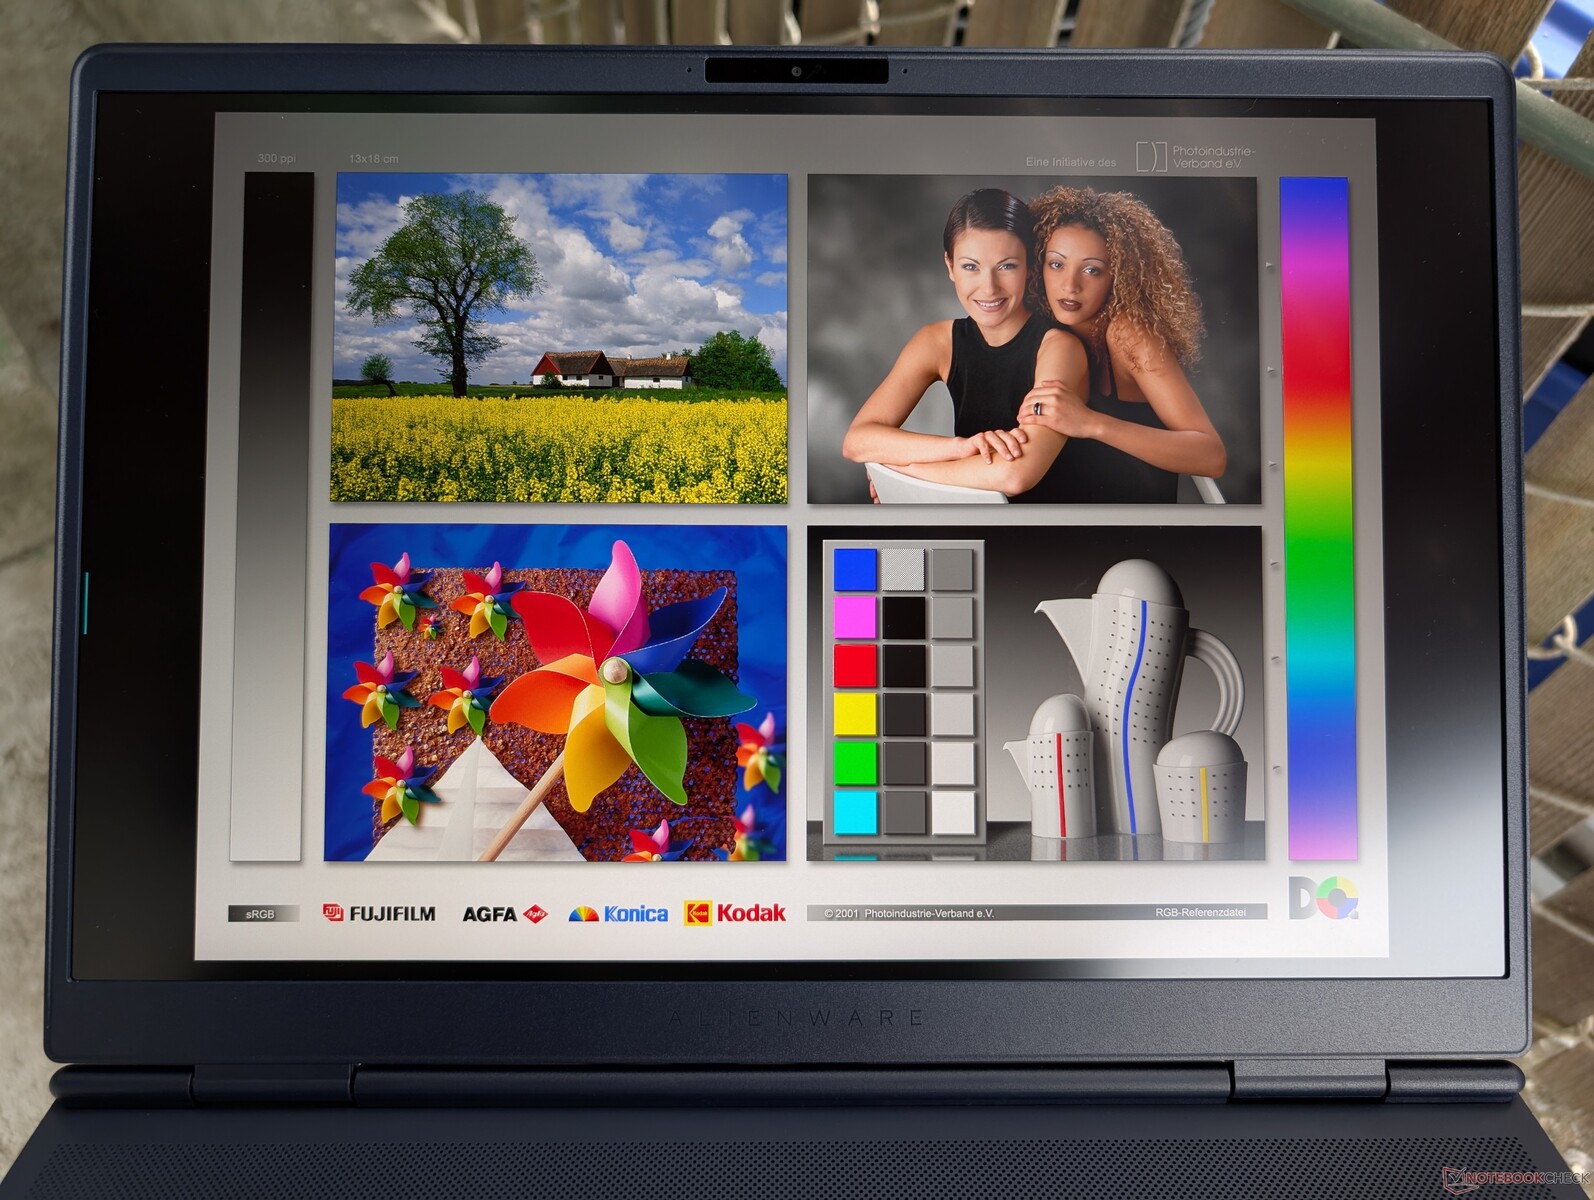
Affichage - Plutôt bon pour un IPS
La dalle IPS QHD+ offre des couleurs DCI-P3, des temps de réponse rapides et un taux de rafraîchissement de 240 Hz, ce qui lui permet d'être adaptée aux jeux et aux tâches d'édition. Ses caractéristiques sont essentiellement identiques à celles de l'écran 1600p240 d'AU Optronics disponible en option sur l Alienware Area-51 même si la dalle de notre Aurora 16X est de LG Philips.
Le pire aspect de l'écran est sans doute son faible taux de contraste de seulement ~1000:1 pour des niveaux de noir médiocres et pas de support HDR. Il n'y a pas d'options Mini-LED ou OLED à proprement parler, probablement pour maintenir les coûts bas pour la série Aurora 16X.

| |||||||||||||||||||||||||
Homogénéité de la luminosité: 93 %
Valeur mesurée au centre, sur batterie: 493.2 cd/m²
Contraste: 986:1 (Valeurs des noirs: 0.5 cd/m²)
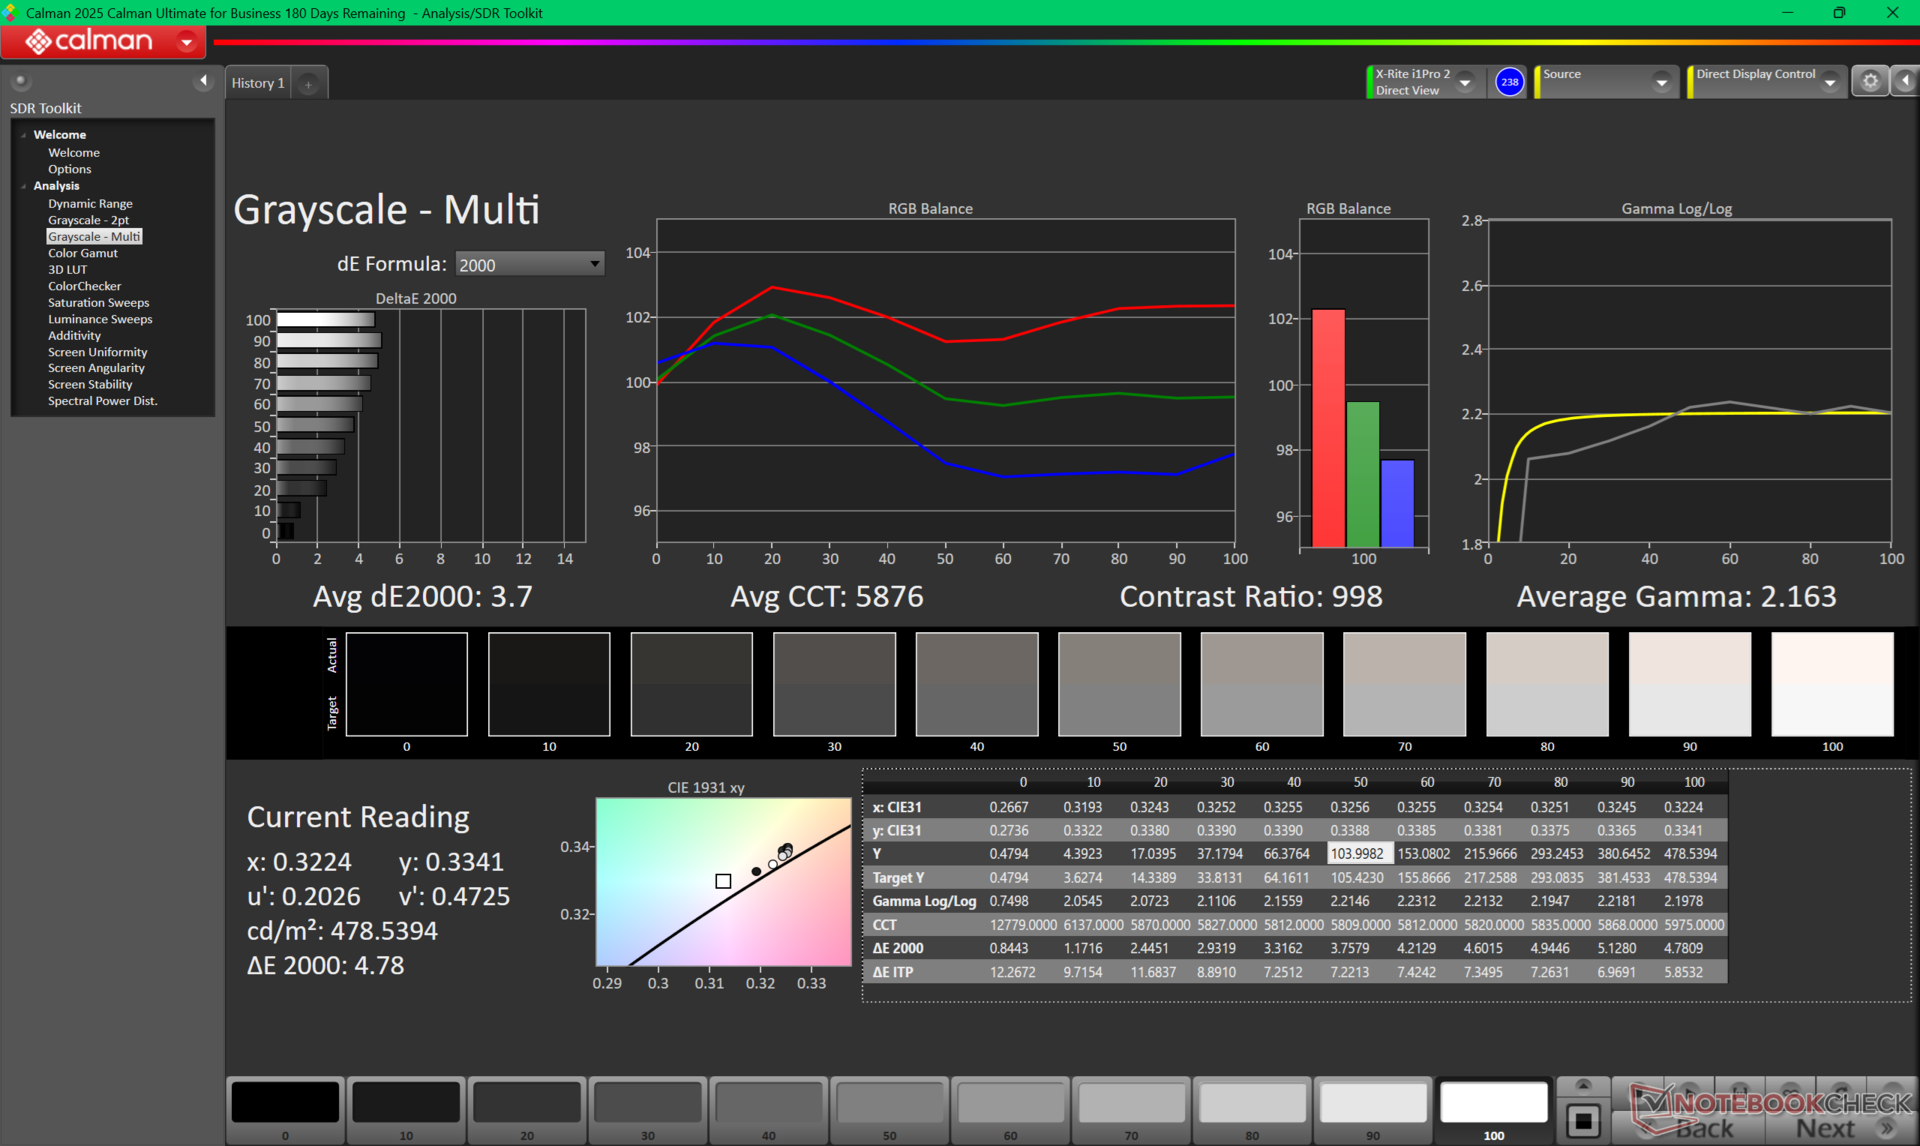
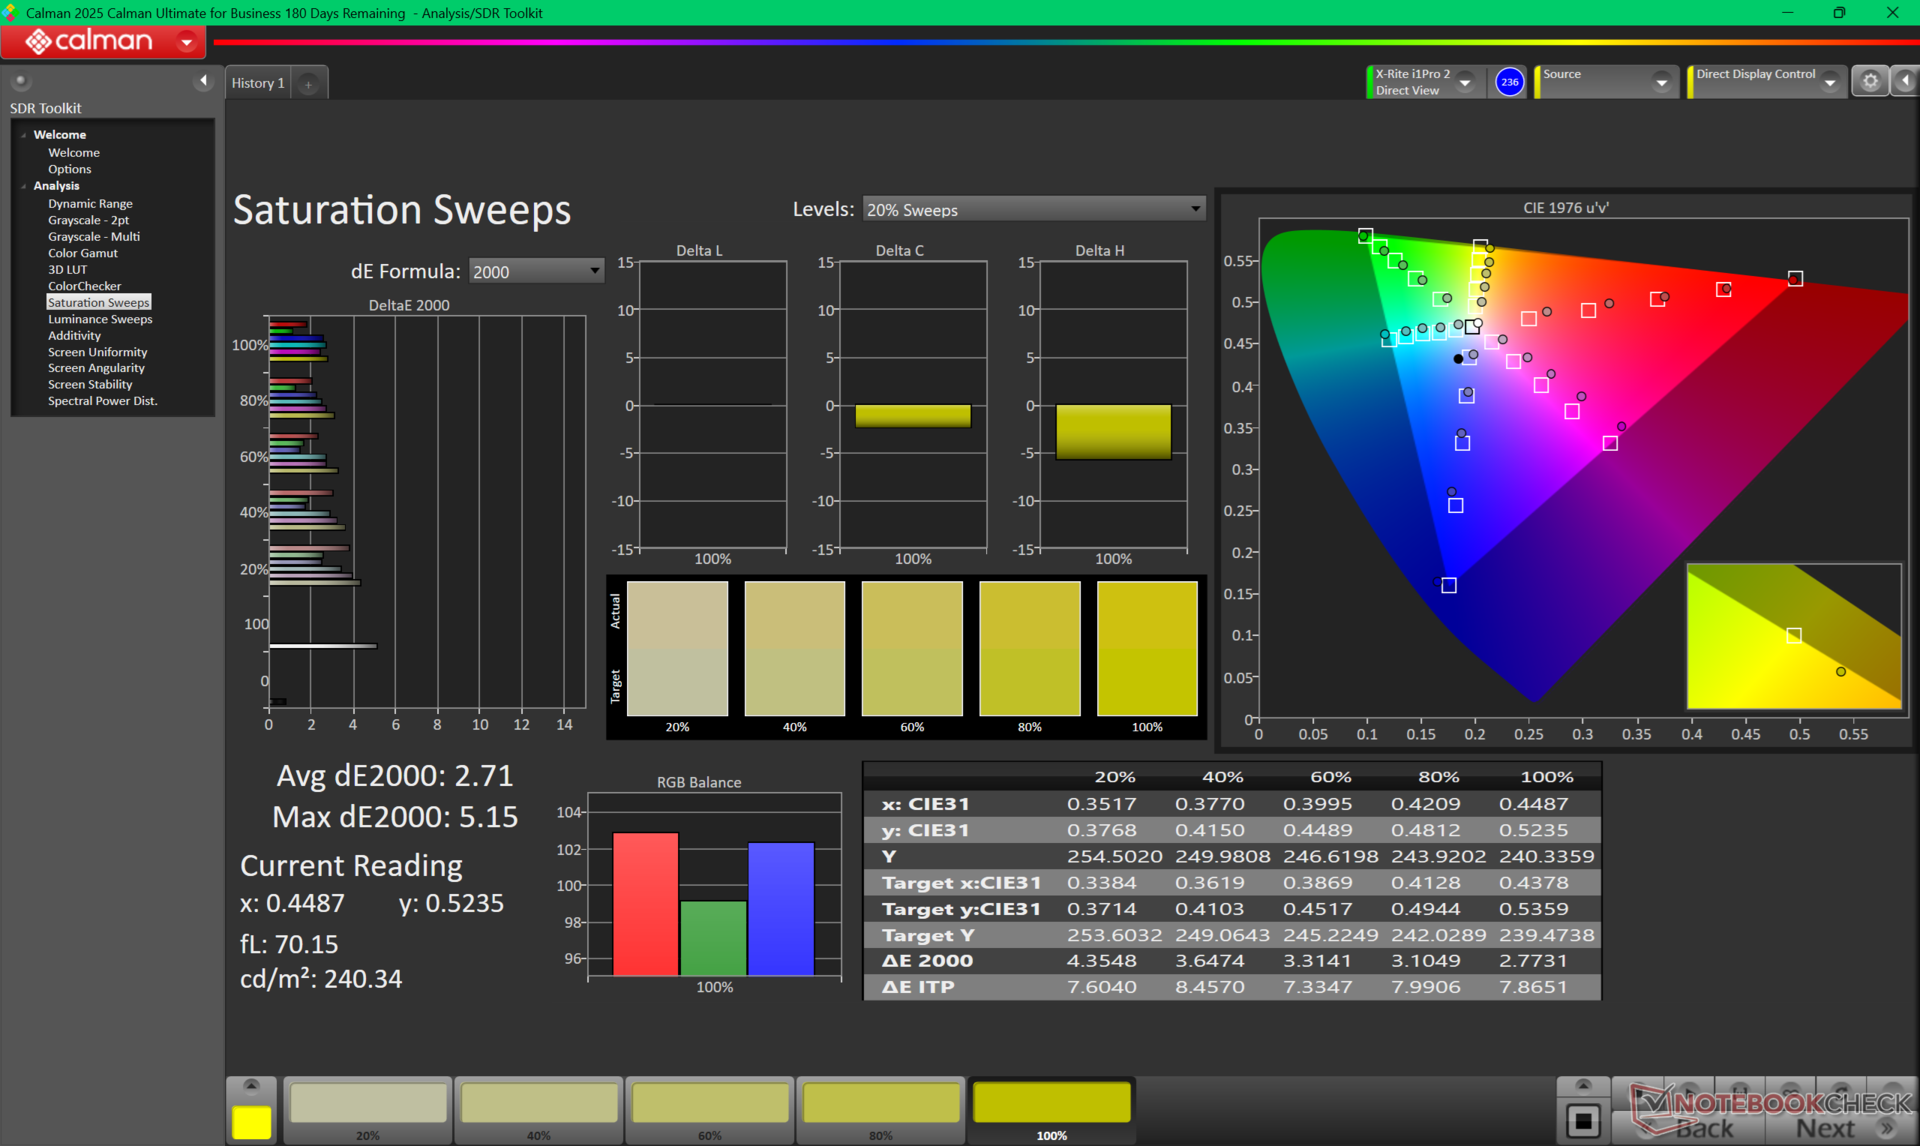
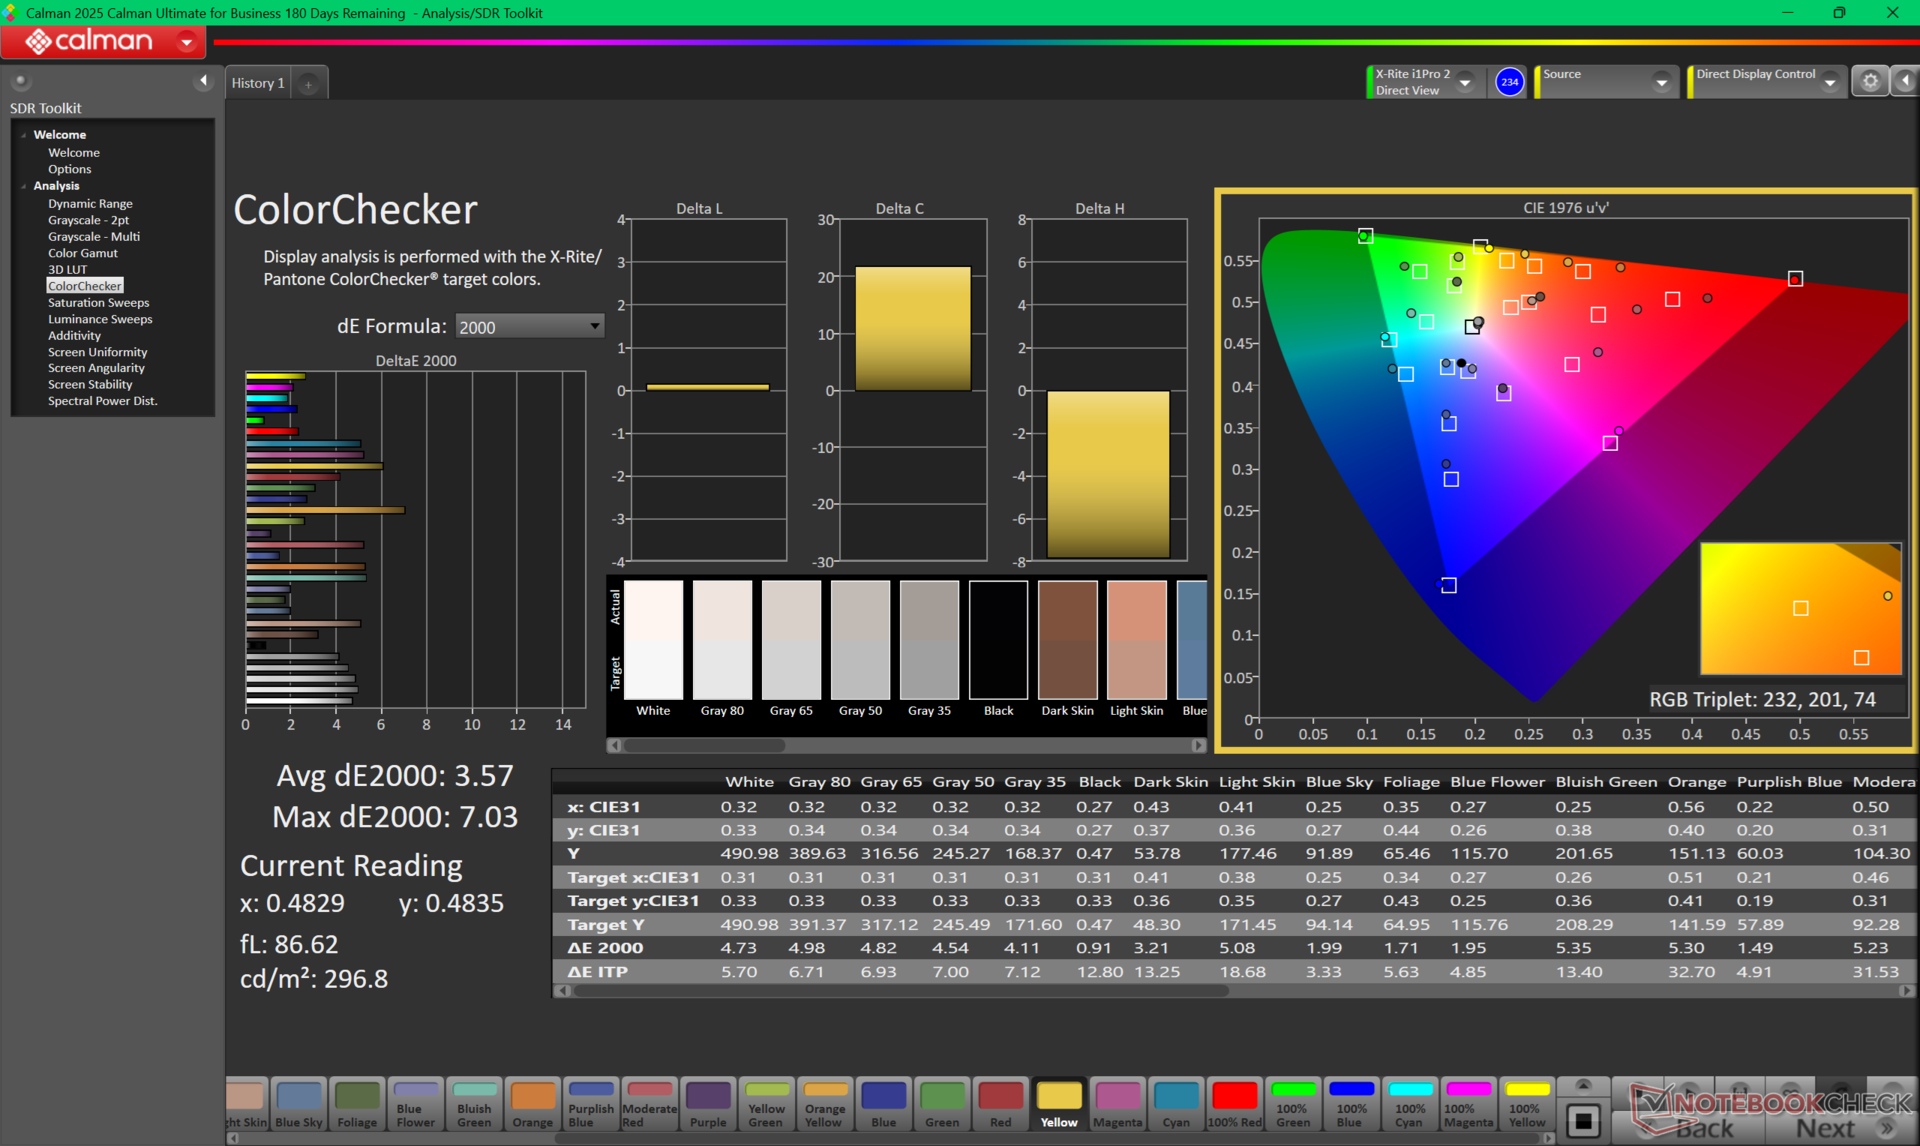
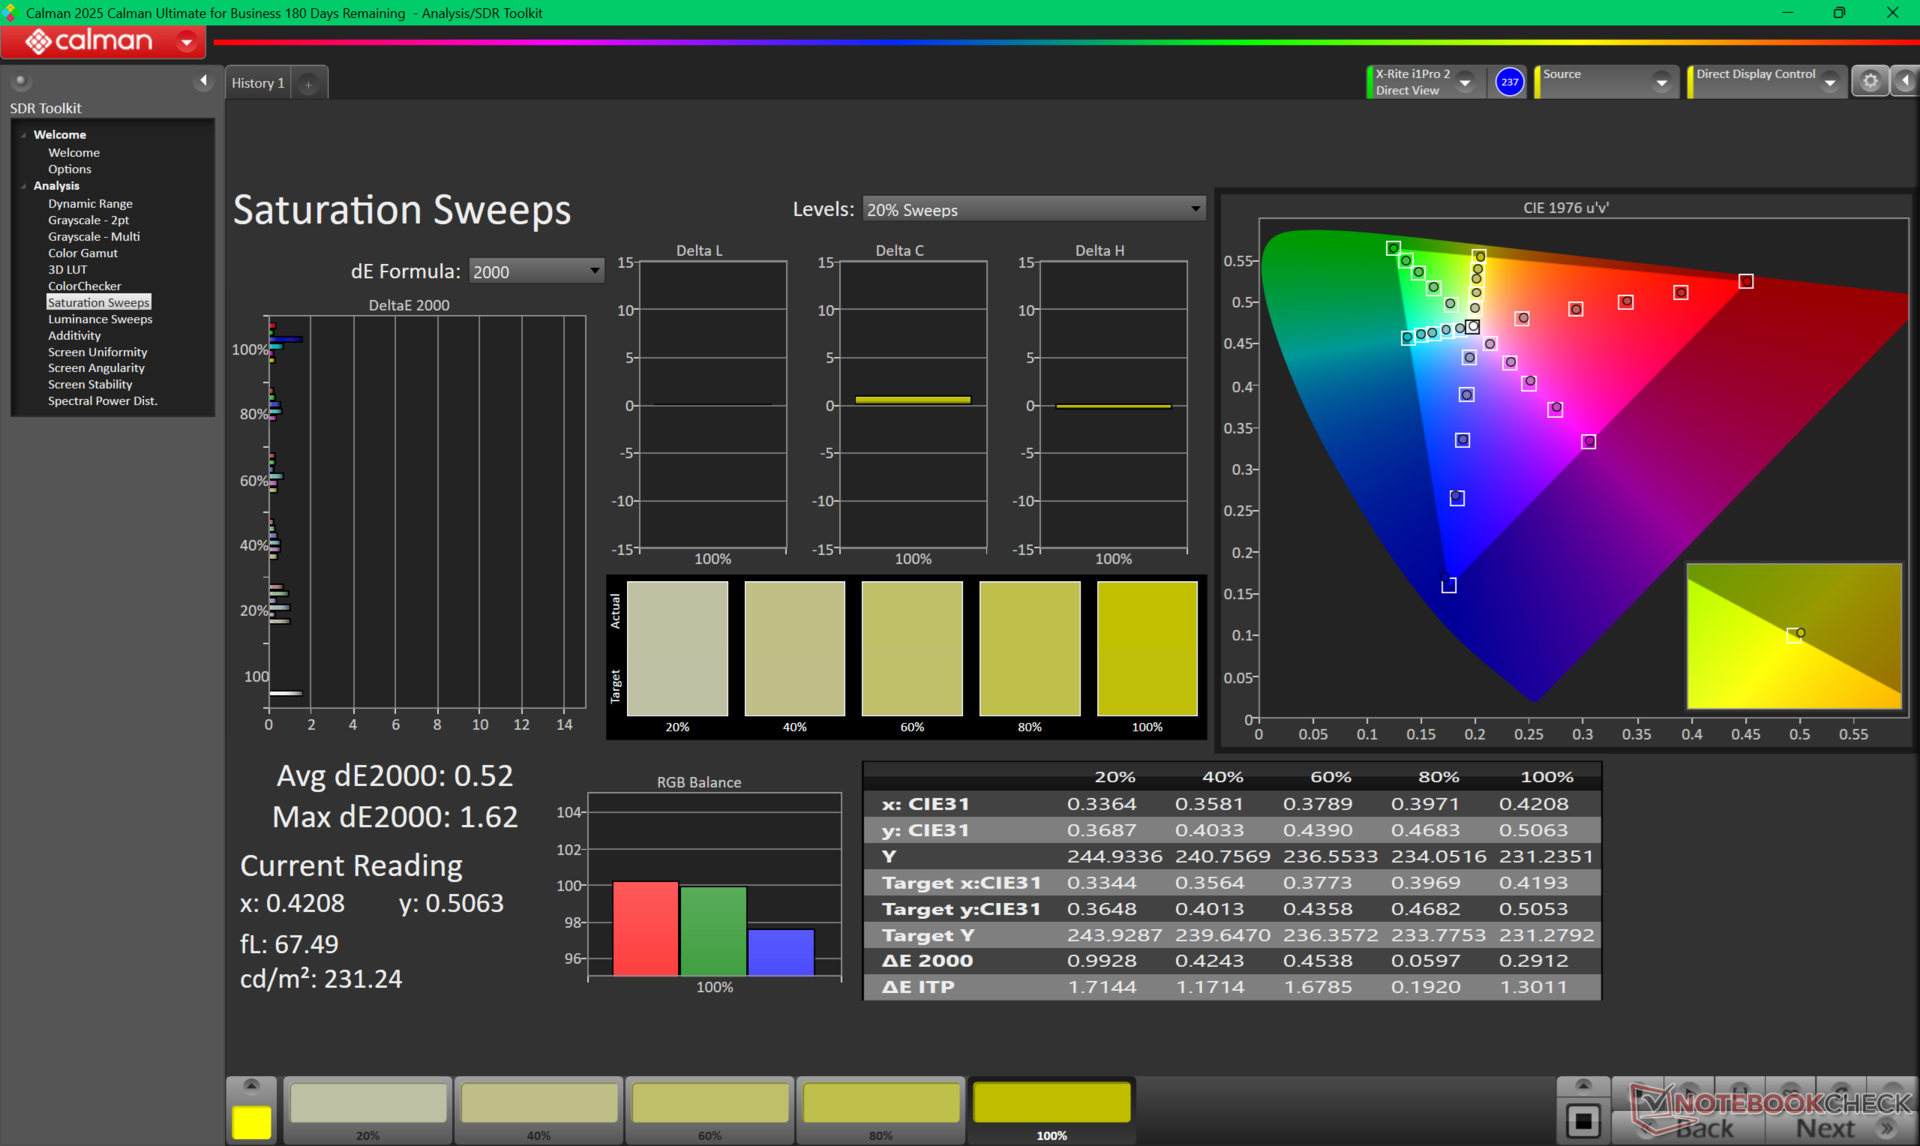
ΔE ColorChecker Calman: 3.57 | ∀{0.5-29.43 Ø4.75}
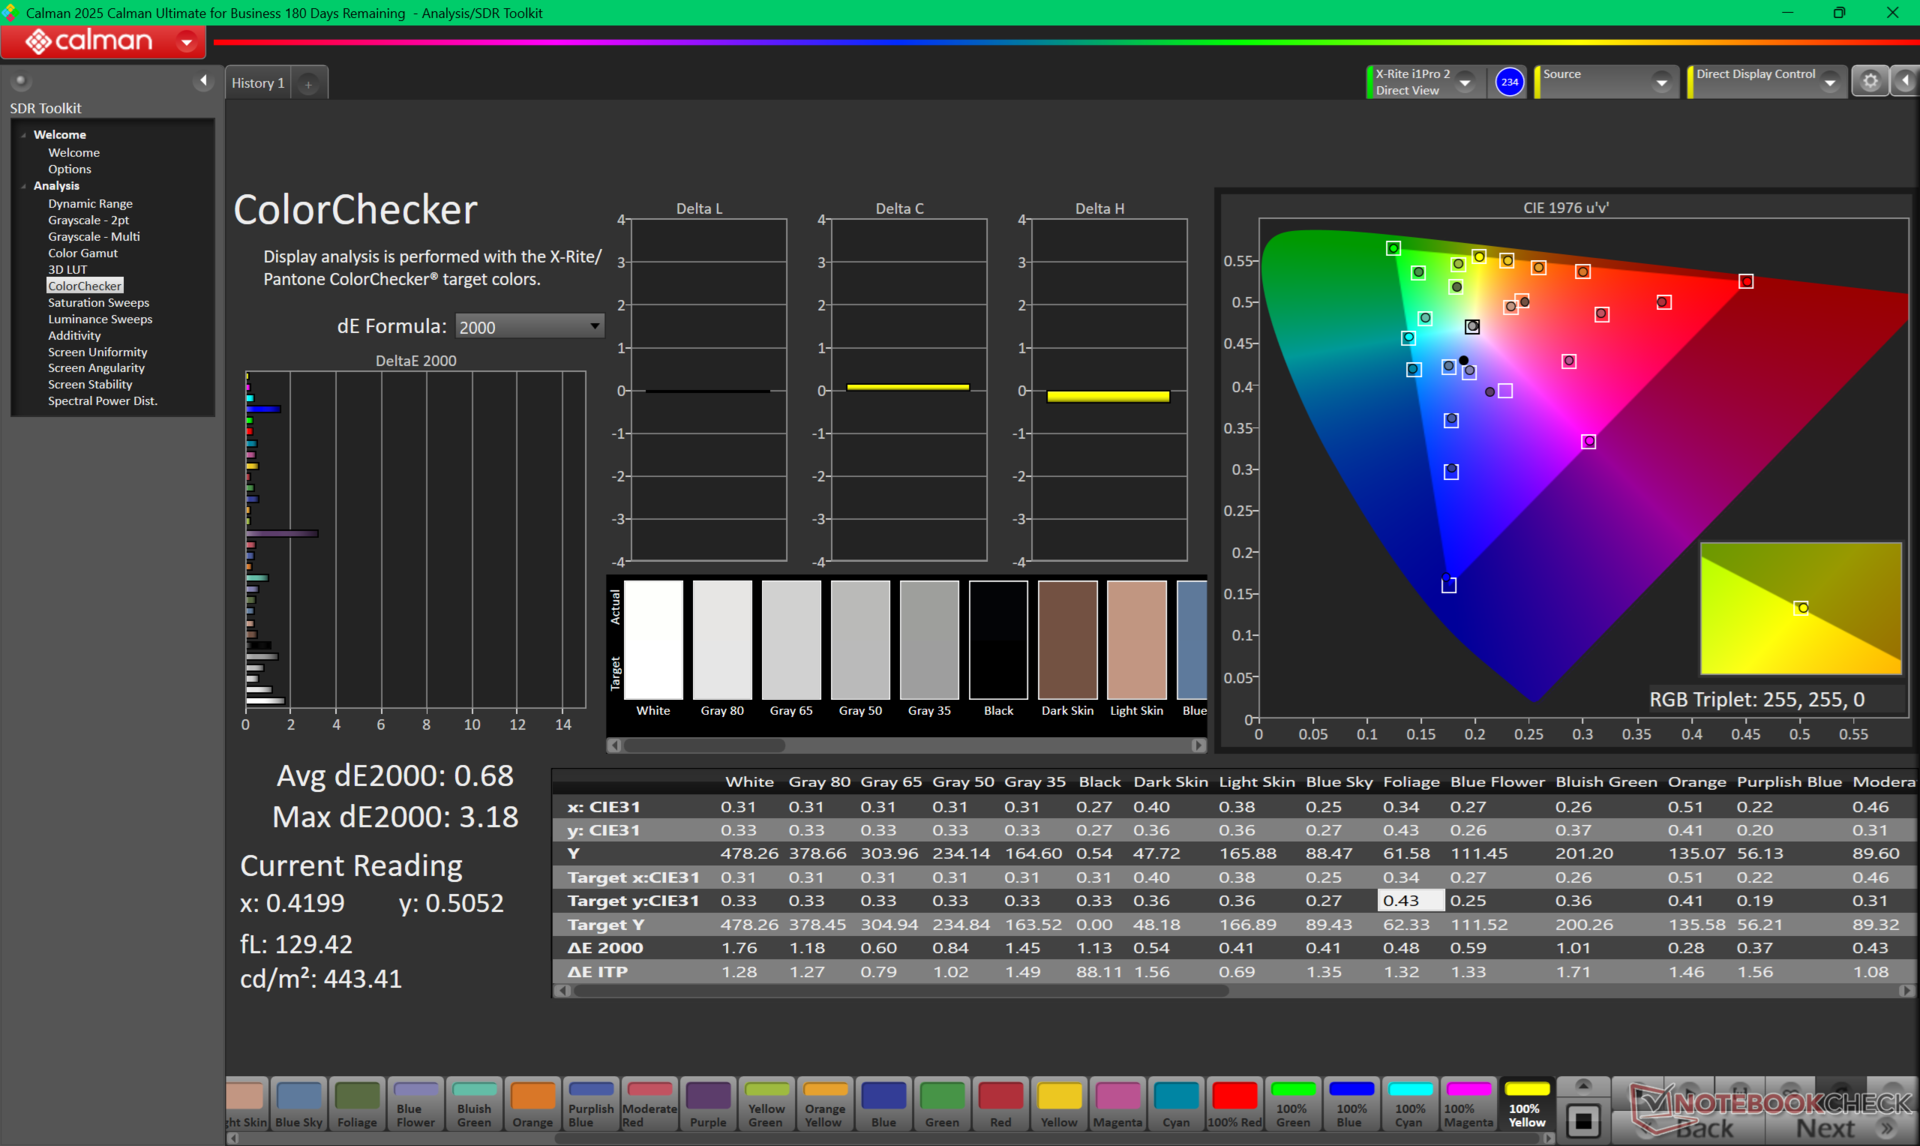
calibrated: 0.68
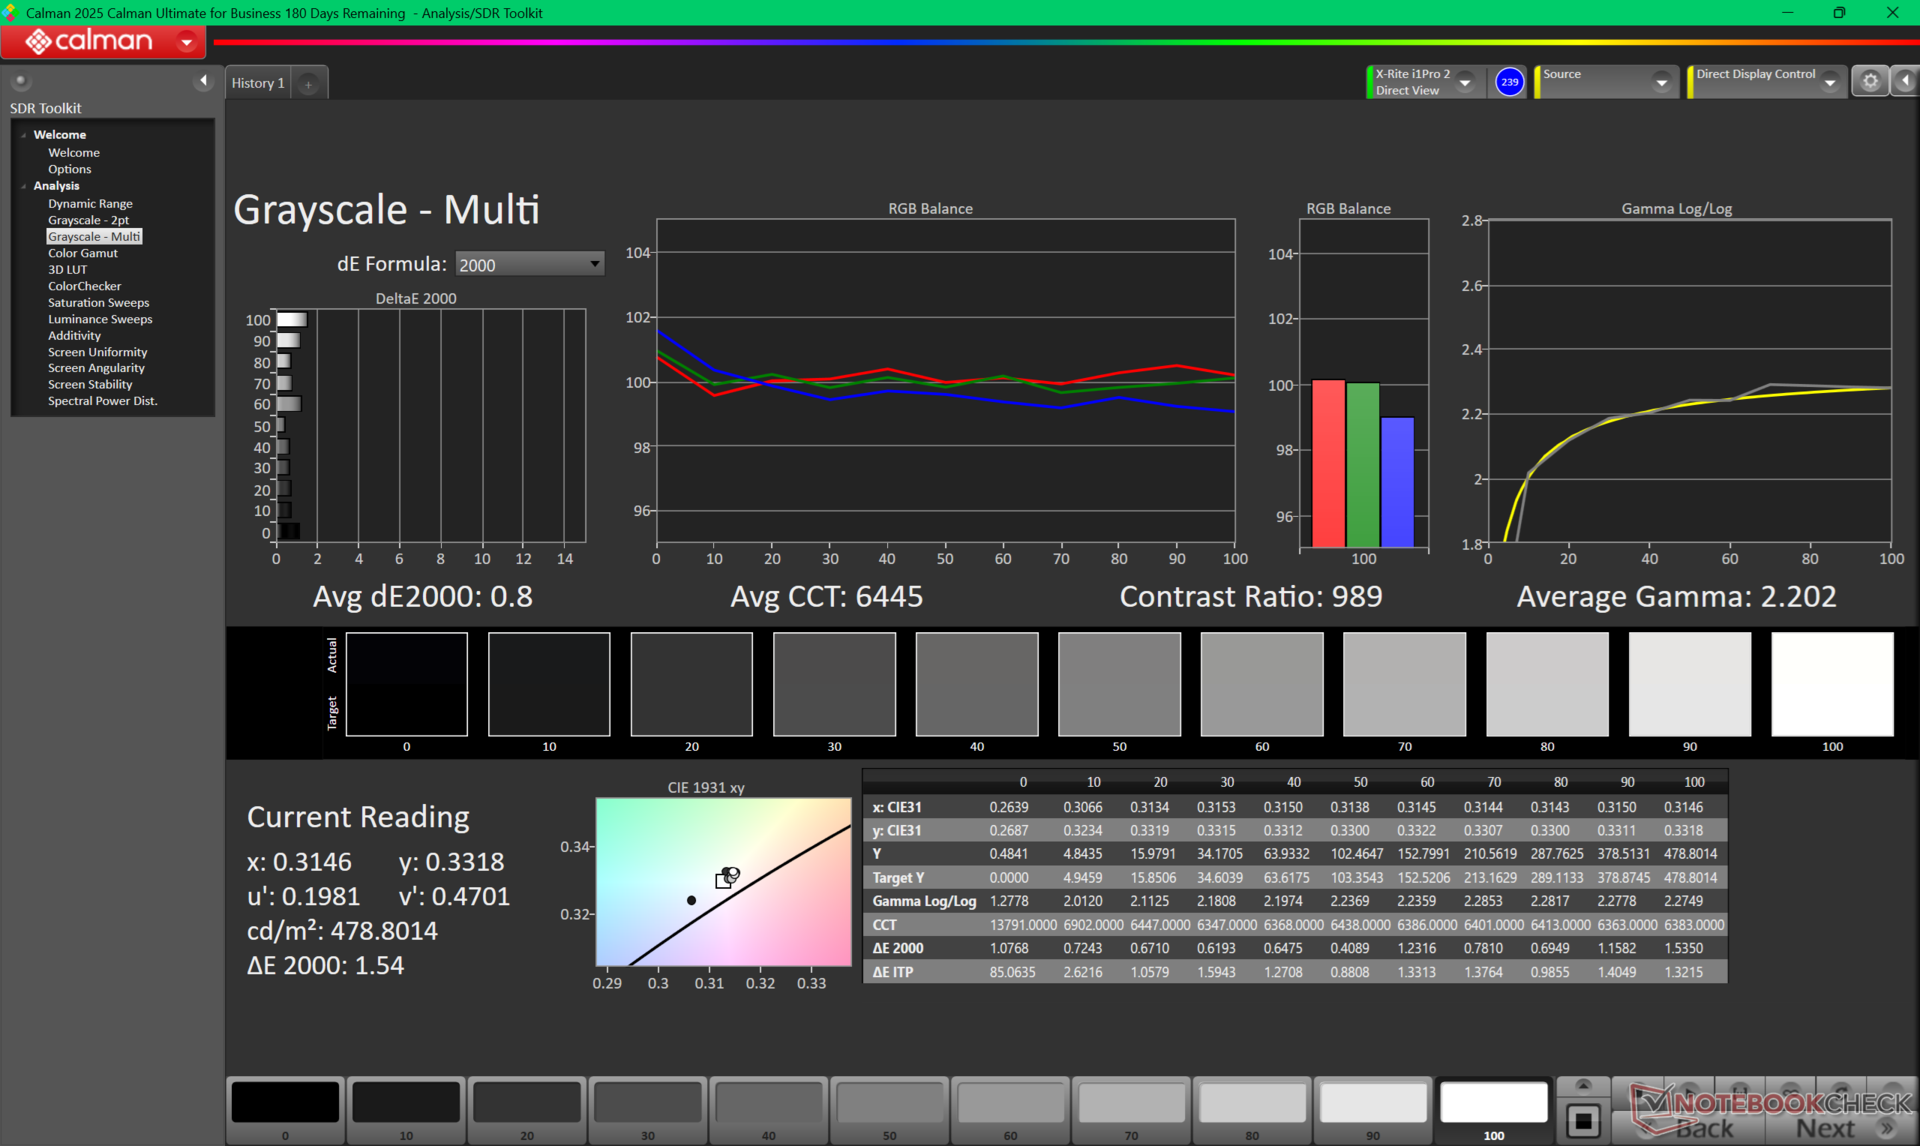
ΔE Greyscale Calman: 3.7 | ∀{0.09-98 Ø5}
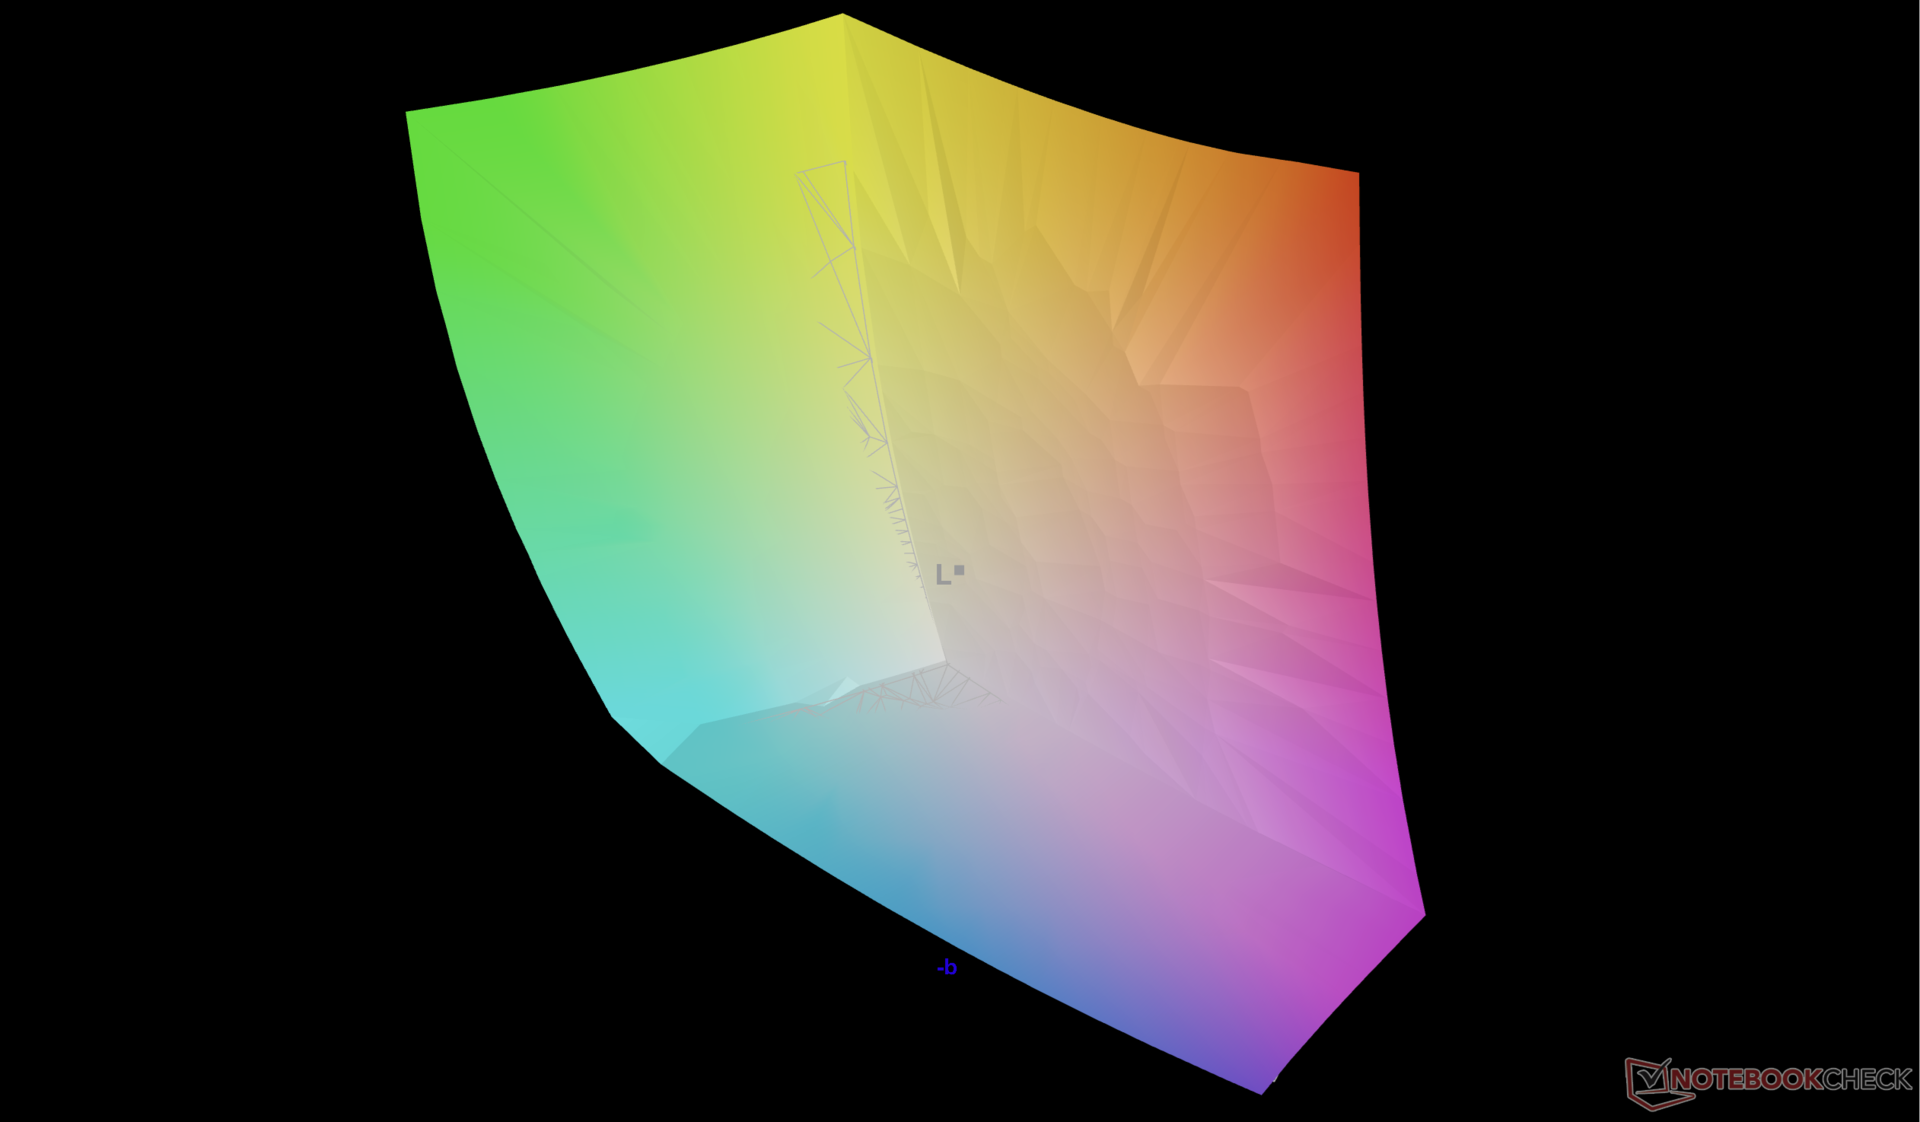
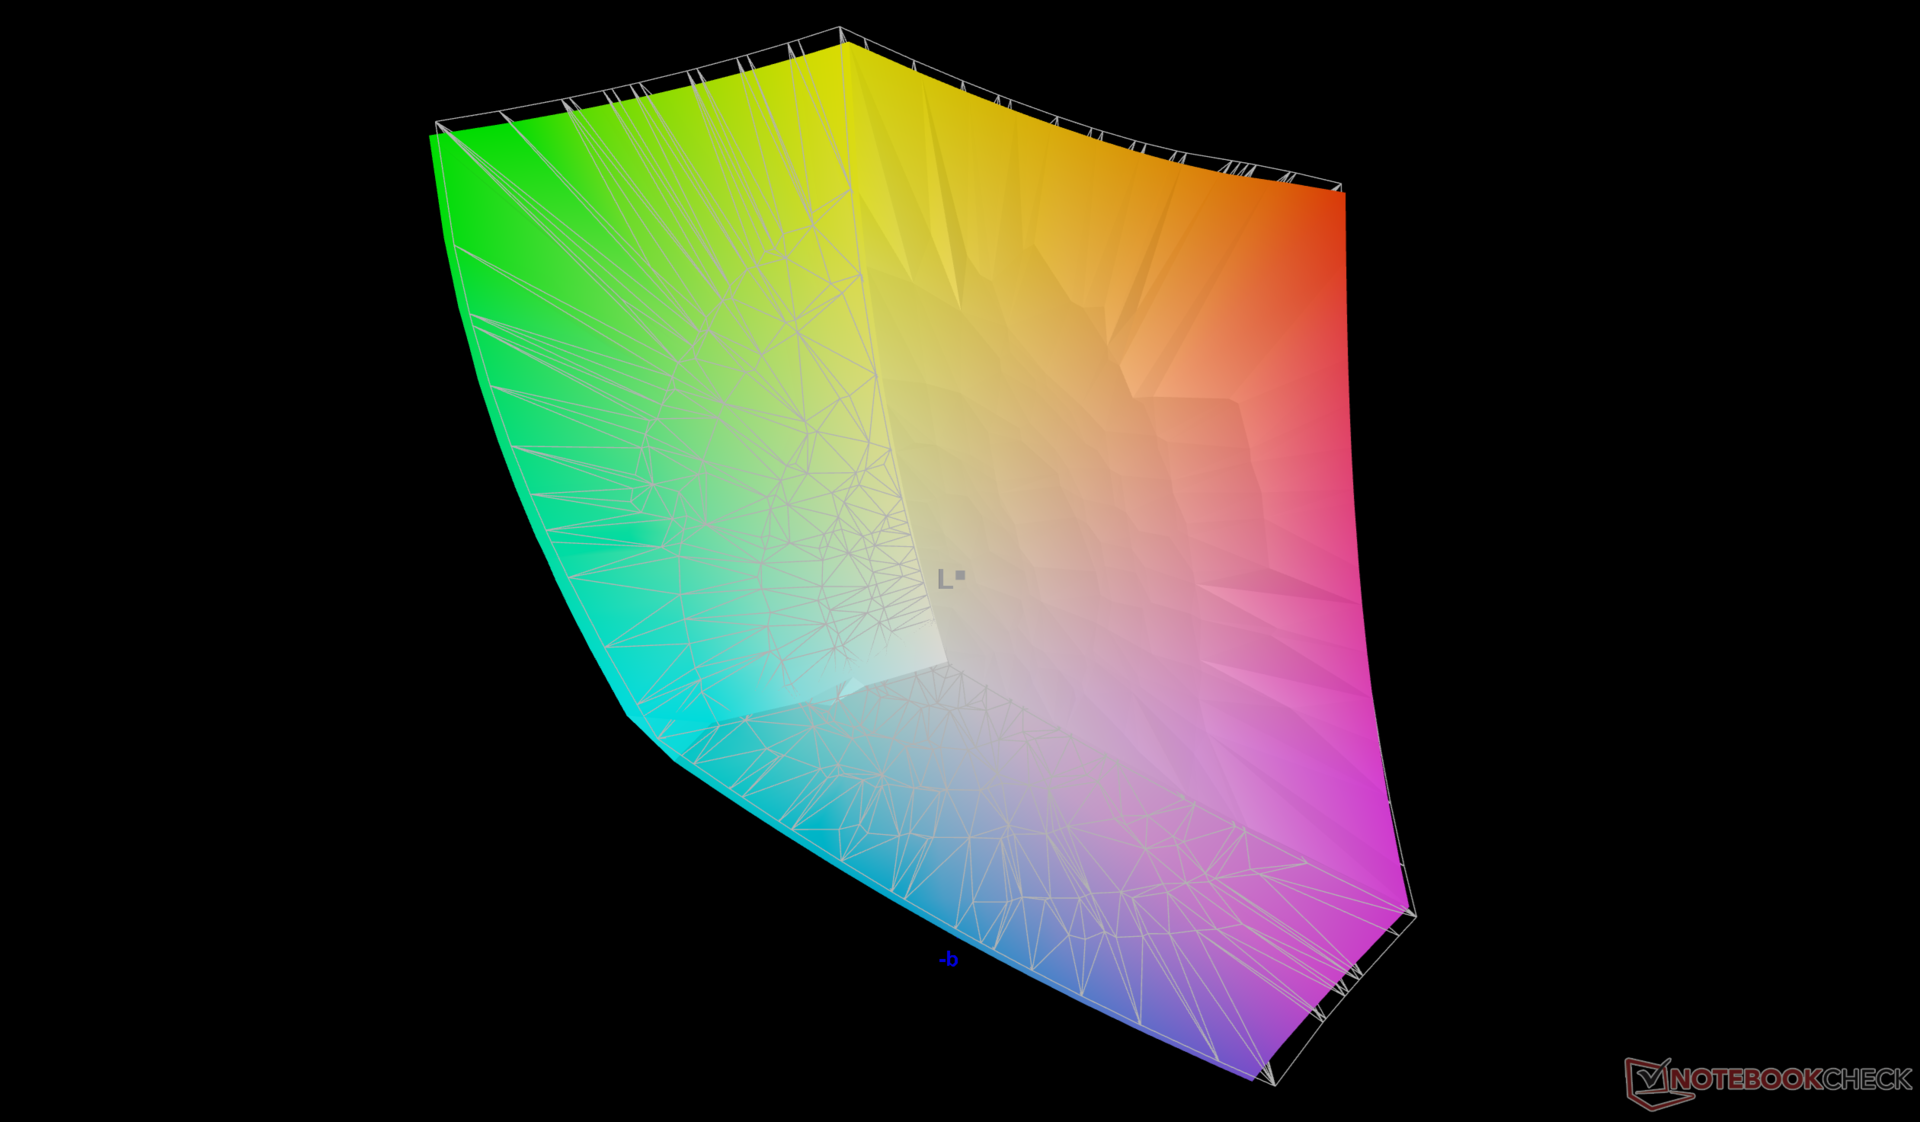
89.7% AdobeRGB 1998 (Argyll 3D)
99.8% sRGB (Argyll 3D)
96.9% Display P3 (Argyll 3D)
Gamma: 2.16
CCT: 5876 K
| Alienware 16X Aurora, RTX 5070 LG Philips 160WQG, IPS, 2560x1600, 16", 240 Hz | Alienware 16 Area-51 AU Optronics B160QAN, IPS, 2560x1600, 16", 240 Hz | Gigabyte Gaming A16 GA6H NE160QDM-NYJ (BOE0C80), IPS, 2560x1600, 16", 165 Hz | MSI Vector 16 HX AI A2XWHG B160QAN02.3 (AUO7DB2), IPS, 2560x1600, 16", 240 Hz | Asus TUF Gaming A16 FA608WV B160UAN08.1 (AUO9BB0), IPS, 1920x1200, 16", 144 Hz | Lenovo Legion 5 Pro 16IAX10H ATNA60HS01-0 (Samsung SDC420A), OLED, 2560x1600, 16", 165 Hz | |
|---|---|---|---|---|---|---|
| Display | -1% | -16% | -2% | -51% | 3% | |
| Display P3 Coverage (%) | 96.9 | 96 -1% | 69.4 -28% | 96.6 0% | 39.8 -59% | 99.9 3% |
| sRGB Coverage (%) | 99.8 | 100 0% | 99.5 0% | 99.8 0% | 59.7 -40% | 100 0% |
| AdobeRGB 1998 Coverage (%) | 89.7 | 89.2 -1% | 71.6 -20% | 84.4 -6% | 41.1 -54% | 94.1 5% |
| Response Times | 3% | -107% | 16% | -107% | 69% | |
| Response Time Grey 50% / Grey 80% * (ms) | 4.3 ? | 4.8 ? -12% | 14.3 ? -233% | 4.3 ? -0% | 13.6 ? -216% | 2 ? 53% |
| Response Time Black / White * (ms) | 8.7 ? | 7.2 ? 17% | 7 ? 20% | 6 ? 31% | 8.4 ? 3% | 1.4 ? 84% |
| PWM Frequency (Hz) | 1300 | |||||
| PWM Amplitude * (%) | 16.7 | |||||
| Screen | 0% | -20% | -9% | -89% | -18% | |
| Brightness middle (cd/m²) | 493.2 | 554 12% | 432 -12% | 473 -4% | 347 -30% | 518 5% |
| Brightness (cd/m²) | 477 | 532 12% | 425 -11% | 426 -11% | 321 -33% | 522 9% |
| Brightness Distribution (%) | 93 | 88 -5% | 91 -2% | 85 -9% | 88 -5% | 97 4% |
| Black Level * (cd/m²) | 0.5 | 0.52 -4% | 0.37 26% | 0.42 16% | 0.3 40% | |
| Contrast (:1) | 986 | 1065 8% | 1168 18% | 1126 14% | 1157 17% | |
| Colorchecker dE 2000 * | 3.57 | 2.81 21% | 4.76 -33% | 3.47 3% | 5.89 -65% | 2.49 30% |
| Colorchecker dE 2000 max. * | 7.03 | 8.32 -18% | 8.59 -22% | 7.24 -3% | 19.26 -174% | 5.25 25% |
| Colorchecker dE 2000 calibrated * | 0.68 | 0.65 4% | 1.18 -74% | 1.36 -100% | 4.3 -532% | 2.15 -216% |
| Greyscale dE 2000 * | 3.7 | 4.7 -27% | 6.2 -68% | 3.1 16% | 4.27 -15% | 3.02 18% |
| Gamma | 2.16 102% | 2.3 96% | 2.079 106% | 2.486 88% | 2.47 89% | 2.37 93% |
| CCT | 5876 111% | 6476 100% | 6690 97% | 6832 95% | 7158 91% | 6426 101% |
| Moyenne finale (programmes/paramètres) | 1% /
0% | -48% /
-31% | 2% /
-4% | -82% /
-83% | 18% /
2% |
* ... Moindre est la valeur, meilleures sont les performances
L'écran est livré correctement calibré en fonction des couleurs P3, même si Dell ne propose pas de service de calibrage en usine. La température des couleurs est néanmoins un peu plus chaude que ce que nous aurions souhaité, à environ 5900K. Notre profil ICM calibré peut être téléchargé gratuitement ci-dessus.
Temps de réponse de l'écran
| ↔ Temps de réponse noir à blanc | ||
|---|---|---|
| 8.7 ms ... hausse ↗ et chute ↘ combinées | ↗ 4.6 ms hausse | 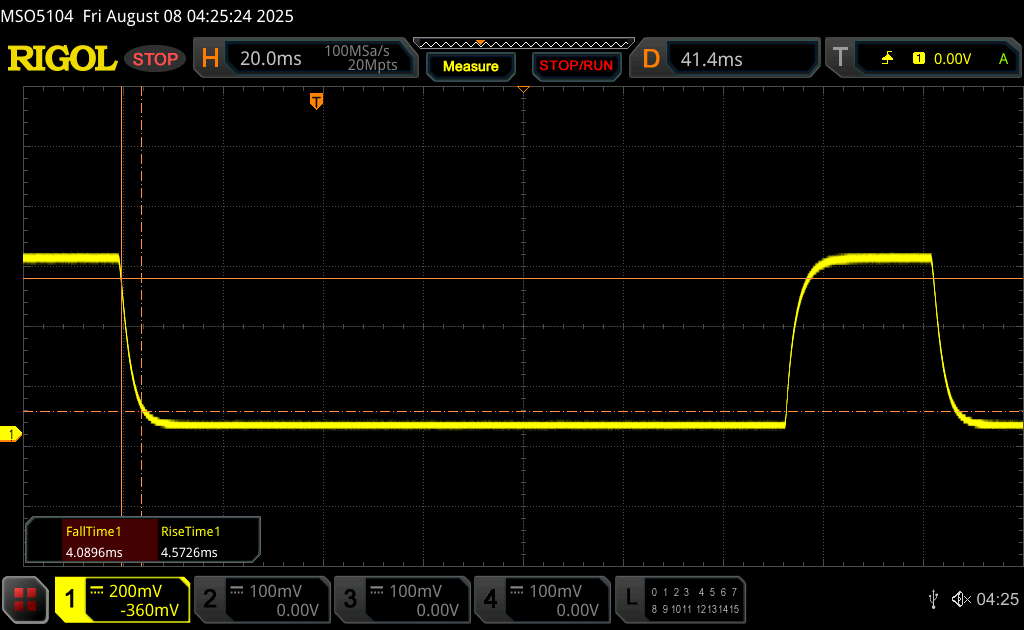 |
| ↘ 4.1 ms chute | ||
| L'écran montre de faibles temps de réponse, un bon écran pour jouer. En comparaison, tous les appareils testés affichent entre 0.1 (minimum) et 240 (maximum) ms. » 24 % des appareils testés affichent de meilleures performances. Cela signifie que les latences relevées sont meilleures que la moyenne (20 ms) de tous les appareils testés. | ||
| ↔ Temps de réponse gris 50% à gris 80% | ||
| 4.3 ms ... hausse ↗ et chute ↘ combinées | ↗ 1.9 ms hausse | 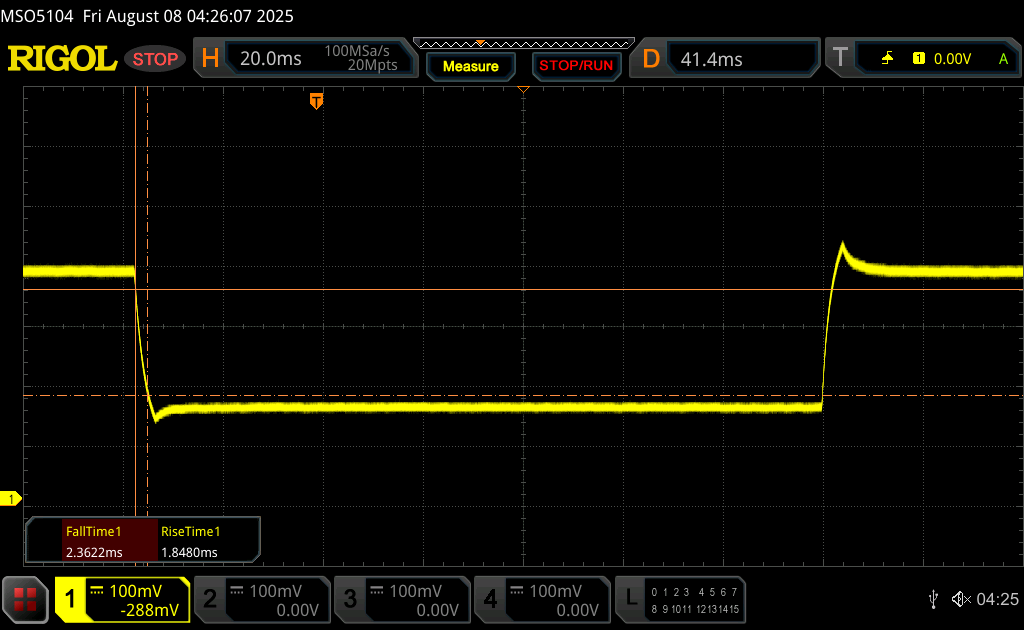 |
| ↘ 2.4 ms chute | ||
| L'écran montre de très faibles temps de réponse, parfait pour le jeu. En comparaison, tous les appareils testés affichent entre 0.165 (minimum) et 636 (maximum) ms. » 15 % des appareils testés affichent de meilleures performances. Cela signifie que les latences relevées sont meilleures que la moyenne (31.3 ms) de tous les appareils testés. | ||
Scintillement / MLI (Modulation de largeur d'impulsion)
| Scintillement / MLI (Modulation de largeur d'impulsion) non décelé | 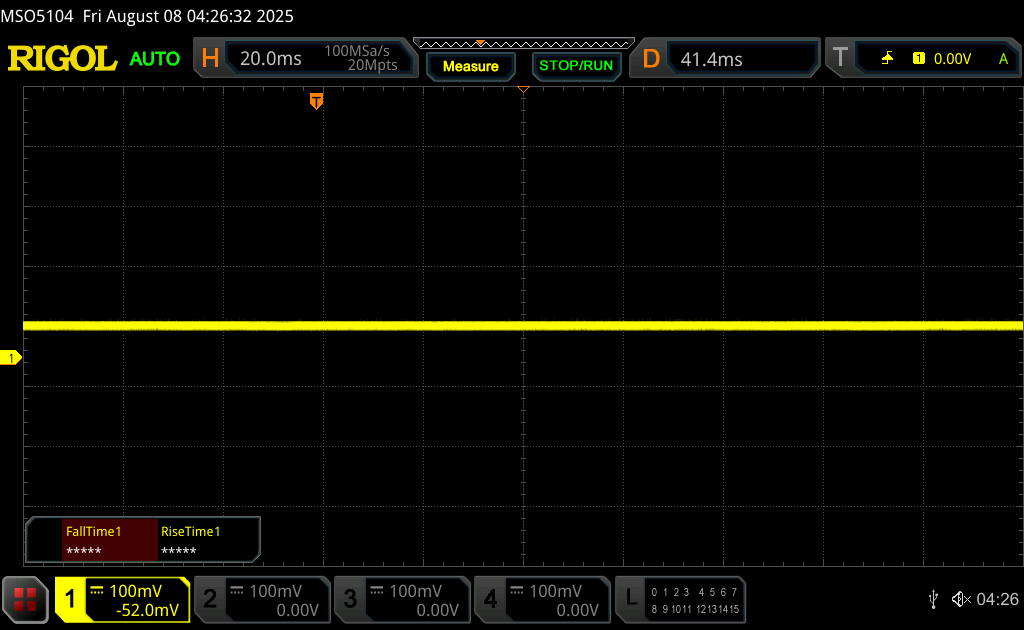 | ||
En comparaison, 53 % des appareils testés n'emploient pas MDI pour assombrir leur écran. Nous avons relevé une moyenne à 7962 (minimum : 5 - maximum : 343500) Hz dans le cas où une MDI était active. | |||
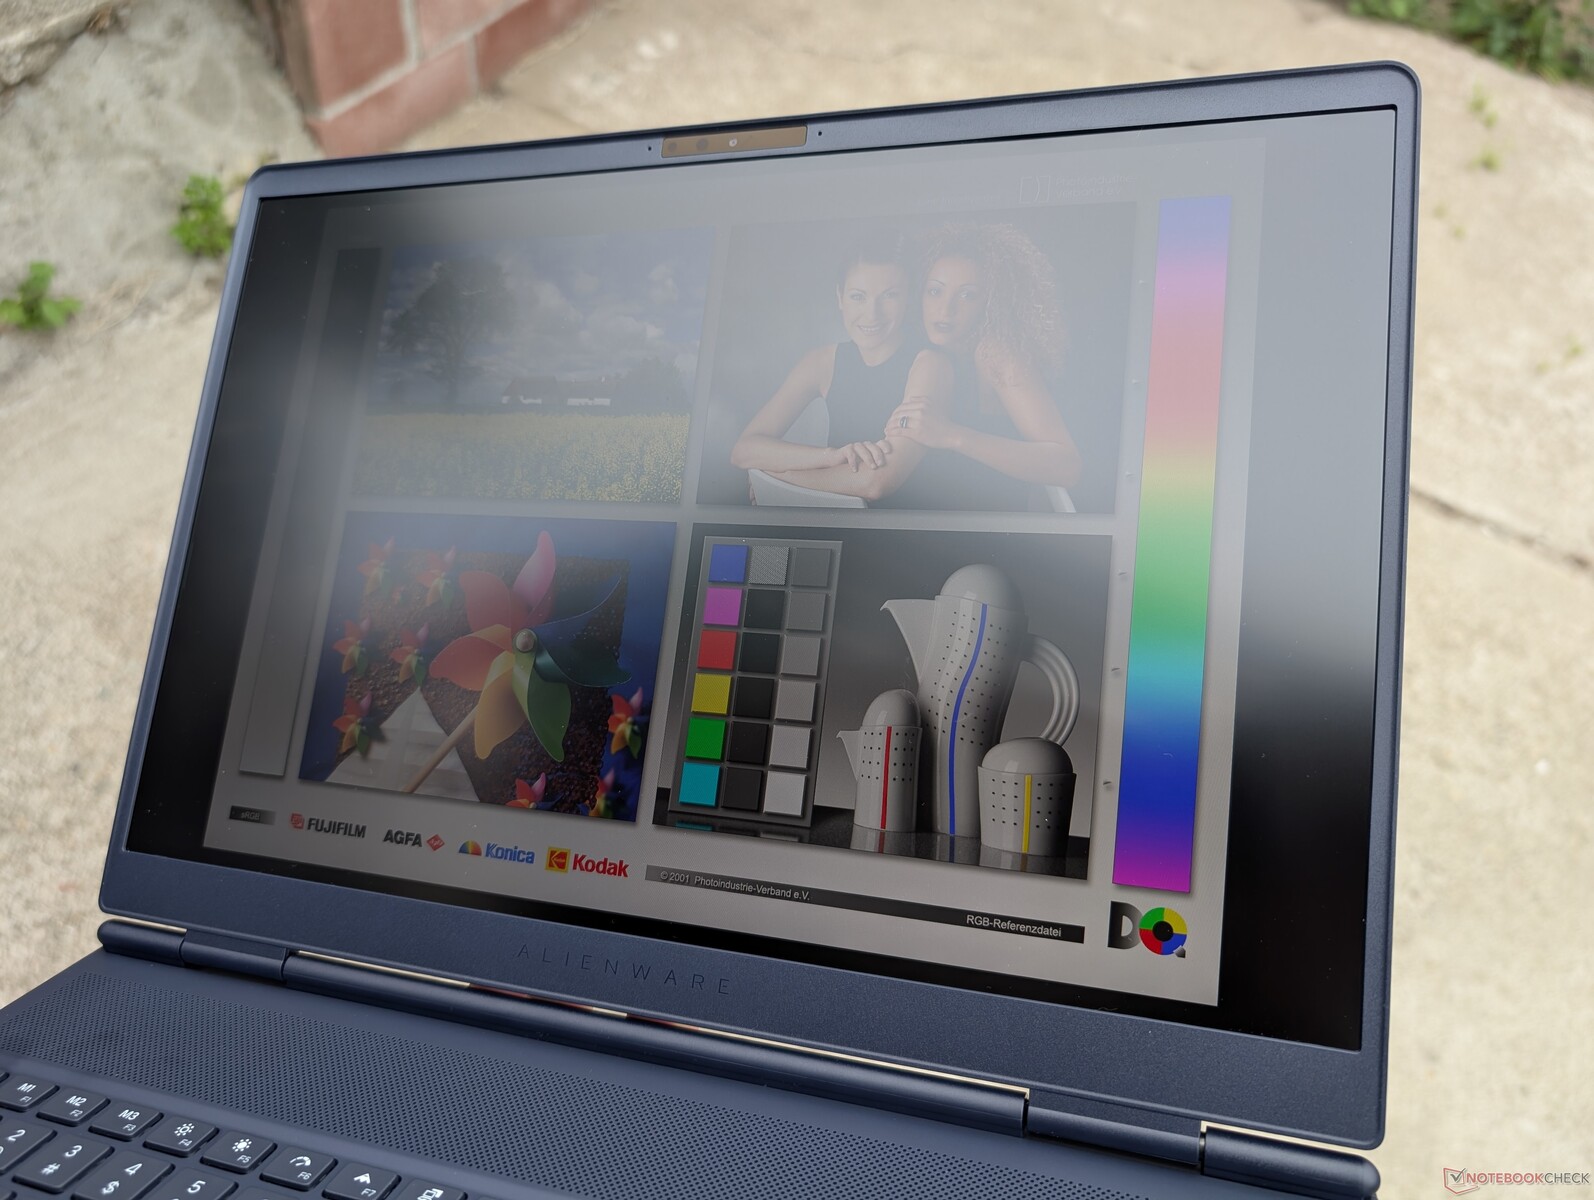
L'écran est assez lumineux pour un ordinateur portable de jeu avec presque 500 nits comparé à seulement ~350 nits sur l'Asus TUF Gaming A16. La visibilité est correcte si vous travaillez à l'ombre, mais les couleurs sont délavées si vous travaillez dans des conditions plus lumineuses.

Performance
Conditions d'essai
Nous avons réglé Windows et Alienware Command Center en mode Performance avant d'effectuer les tests ci-dessous. Un mode Overdrive est disponible sur Command Center qui augmente le plafond du ventilateur encore plus fort ()()(), mais les avantages en termes de performances sont au mieux minimes comme le montrent nos benchmarks ci-dessous.
Processeur
Les performances du processeur sont excellentes, mais pas parfaites. Lorsque vous exécutez CineBench R15 xT en boucle, par exemple, les performances chutent d'environ 8 % après les premières boucles, ce qui suggère une durabilité limitée de Turbo Boost. La température très élevée du cœur, de près de 100°C, lorsque le processeur est utilisé à plein régime, est un autre signe. La performance multithread globale est néanmoins plus rapide que la configuration Core Ultra 7 255HX jusqu'à 25 % ou que l'ancien Core Ultra 7 155H dans l'Alienware m16 R2 jusqu'à près de 2 fois.
Cinebench R15 Multi Loop
Cinebench R23: Multi Core | Single Core
Cinebench R20: CPU (Multi Core) | CPU (Single Core)
Cinebench R15: CPU Multi 64Bit | CPU Single 64Bit
Blender: v2.79 BMW27 CPU
7-Zip 18.03: 7z b 4 | 7z b 4 -mmt1
Geekbench 6.6: Multi-Core | Single-Core
Geekbench 5.5: Multi-Core | Single-Core
HWBOT x265 Benchmark v2.2: 4k Preset
LibreOffice : 20 Documents To PDF
R Benchmark 2.5: Overall mean
* ... Moindre est la valeur, meilleures sont les performances
AIDA64: FP32 Ray-Trace | FPU Julia | CPU SHA3 | CPU Queen | FPU SinJulia | FPU Mandel | CPU AES | CPU ZLib | FP64 Ray-Trace | CPU PhotoWorxx
| Performance rating | |
| Lenovo Legion 5 Pro 16IAX10H | |
| Moyenne Intel Core Ultra 9 275HX | |
| Alienware 16 Area-51 | |
| Alienware 16X Aurora, RTX 5070 | |
| Asus TUF Gaming A16 FA608WV | |
| MSI Vector 16 HX AI A2XWHG | |
| Gigabyte Gaming A16 GA6H | |
| AIDA64 / FP32 Ray-Trace | |
| Asus TUF Gaming A16 FA608WV | |
| Moyenne Intel Core Ultra 9 275HX (28039 - 39895, n=30) | |
| Lenovo Legion 5 Pro 16IAX10H | |
| Alienware 16 Area-51 | |
| Alienware 16X Aurora, RTX 5070 | |
| MSI Vector 16 HX AI A2XWHG | |
| Gigabyte Gaming A16 GA6H | |
| AIDA64 / FPU Julia | |
| Lenovo Legion 5 Pro 16IAX10H | |
| Moyenne Intel Core Ultra 9 275HX (140254 - 200744, n=30) | |
| Alienware 16 Area-51 | |
| Alienware 16X Aurora, RTX 5070 | |
| Asus TUF Gaming A16 FA608WV | |
| MSI Vector 16 HX AI A2XWHG | |
| Gigabyte Gaming A16 GA6H | |
| AIDA64 / CPU SHA3 | |
| Moyenne Intel Core Ultra 9 275HX (6710 - 9817, n=30) | |
| Lenovo Legion 5 Pro 16IAX10H | |
| Alienware 16 Area-51 | |
| Alienware 16X Aurora, RTX 5070 | |
| MSI Vector 16 HX AI A2XWHG | |
| Asus TUF Gaming A16 FA608WV | |
| Gigabyte Gaming A16 GA6H | |
| AIDA64 / CPU Queen | |
| Lenovo Legion 5 Pro 16IAX10H | |
| Alienware 16X Aurora, RTX 5070 | |
| Moyenne Intel Core Ultra 9 275HX (113887 - 140937, n=30) | |
| Alienware 16 Area-51 | |
| MSI Vector 16 HX AI A2XWHG | |
| Asus TUF Gaming A16 FA608WV | |
| Gigabyte Gaming A16 GA6H | |
| AIDA64 / FPU SinJulia | |
| Asus TUF Gaming A16 FA608WV | |
| Lenovo Legion 5 Pro 16IAX10H | |
| Alienware 16 Area-51 | |
| Alienware 16X Aurora, RTX 5070 | |
| Moyenne Intel Core Ultra 9 275HX (11172 - 14425, n=30) | |
| MSI Vector 16 HX AI A2XWHG | |
| Gigabyte Gaming A16 GA6H | |
| AIDA64 / FPU Mandel | |
| Moyenne Intel Core Ultra 9 275HX (72596 - 104508, n=30) | |
| Lenovo Legion 5 Pro 16IAX10H | |
| Alienware 16 Area-51 | |
| Alienware 16X Aurora, RTX 5070 | |
| Asus TUF Gaming A16 FA608WV | |
| MSI Vector 16 HX AI A2XWHG | |
| Gigabyte Gaming A16 GA6H | |
| AIDA64 / CPU AES | |
| Lenovo Legion 5 Pro 16IAX10H | |
| Moyenne Intel Core Ultra 9 275HX (105608 - 247074, n=30) | |
| Alienware 16 Area-51 | |
| Alienware 16X Aurora, RTX 5070 | |
| MSI Vector 16 HX AI A2XWHG | |
| Asus TUF Gaming A16 FA608WV | |
| Gigabyte Gaming A16 GA6H | |
| AIDA64 / CPU ZLib | |
| Lenovo Legion 5 Pro 16IAX10H | |
| Moyenne Intel Core Ultra 9 275HX (1582 - 2263, n=30) | |
| Alienware 16 Area-51 | |
| Alienware 16X Aurora, RTX 5070 | |
| Asus TUF Gaming A16 FA608WV | |
| MSI Vector 16 HX AI A2XWHG | |
| Gigabyte Gaming A16 GA6H | |
| AIDA64 / FP64 Ray-Trace | |
| Asus TUF Gaming A16 FA608WV | |
| Moyenne Intel Core Ultra 9 275HX (14847 - 21854, n=30) | |
| Lenovo Legion 5 Pro 16IAX10H | |
| Alienware 16 Area-51 | |
| Alienware 16X Aurora, RTX 5070 | |
| MSI Vector 16 HX AI A2XWHG | |
| Gigabyte Gaming A16 GA6H | |
| AIDA64 / CPU PhotoWorxx | |
| Alienware 16 Area-51 | |
| Moyenne Intel Core Ultra 9 275HX (37482 - 62916, n=30) | |
| Lenovo Legion 5 Pro 16IAX10H | |
| Alienware 16X Aurora, RTX 5070 | |
| MSI Vector 16 HX AI A2XWHG | |
| Asus TUF Gaming A16 FA608WV | |
| Gigabyte Gaming A16 GA6H | |
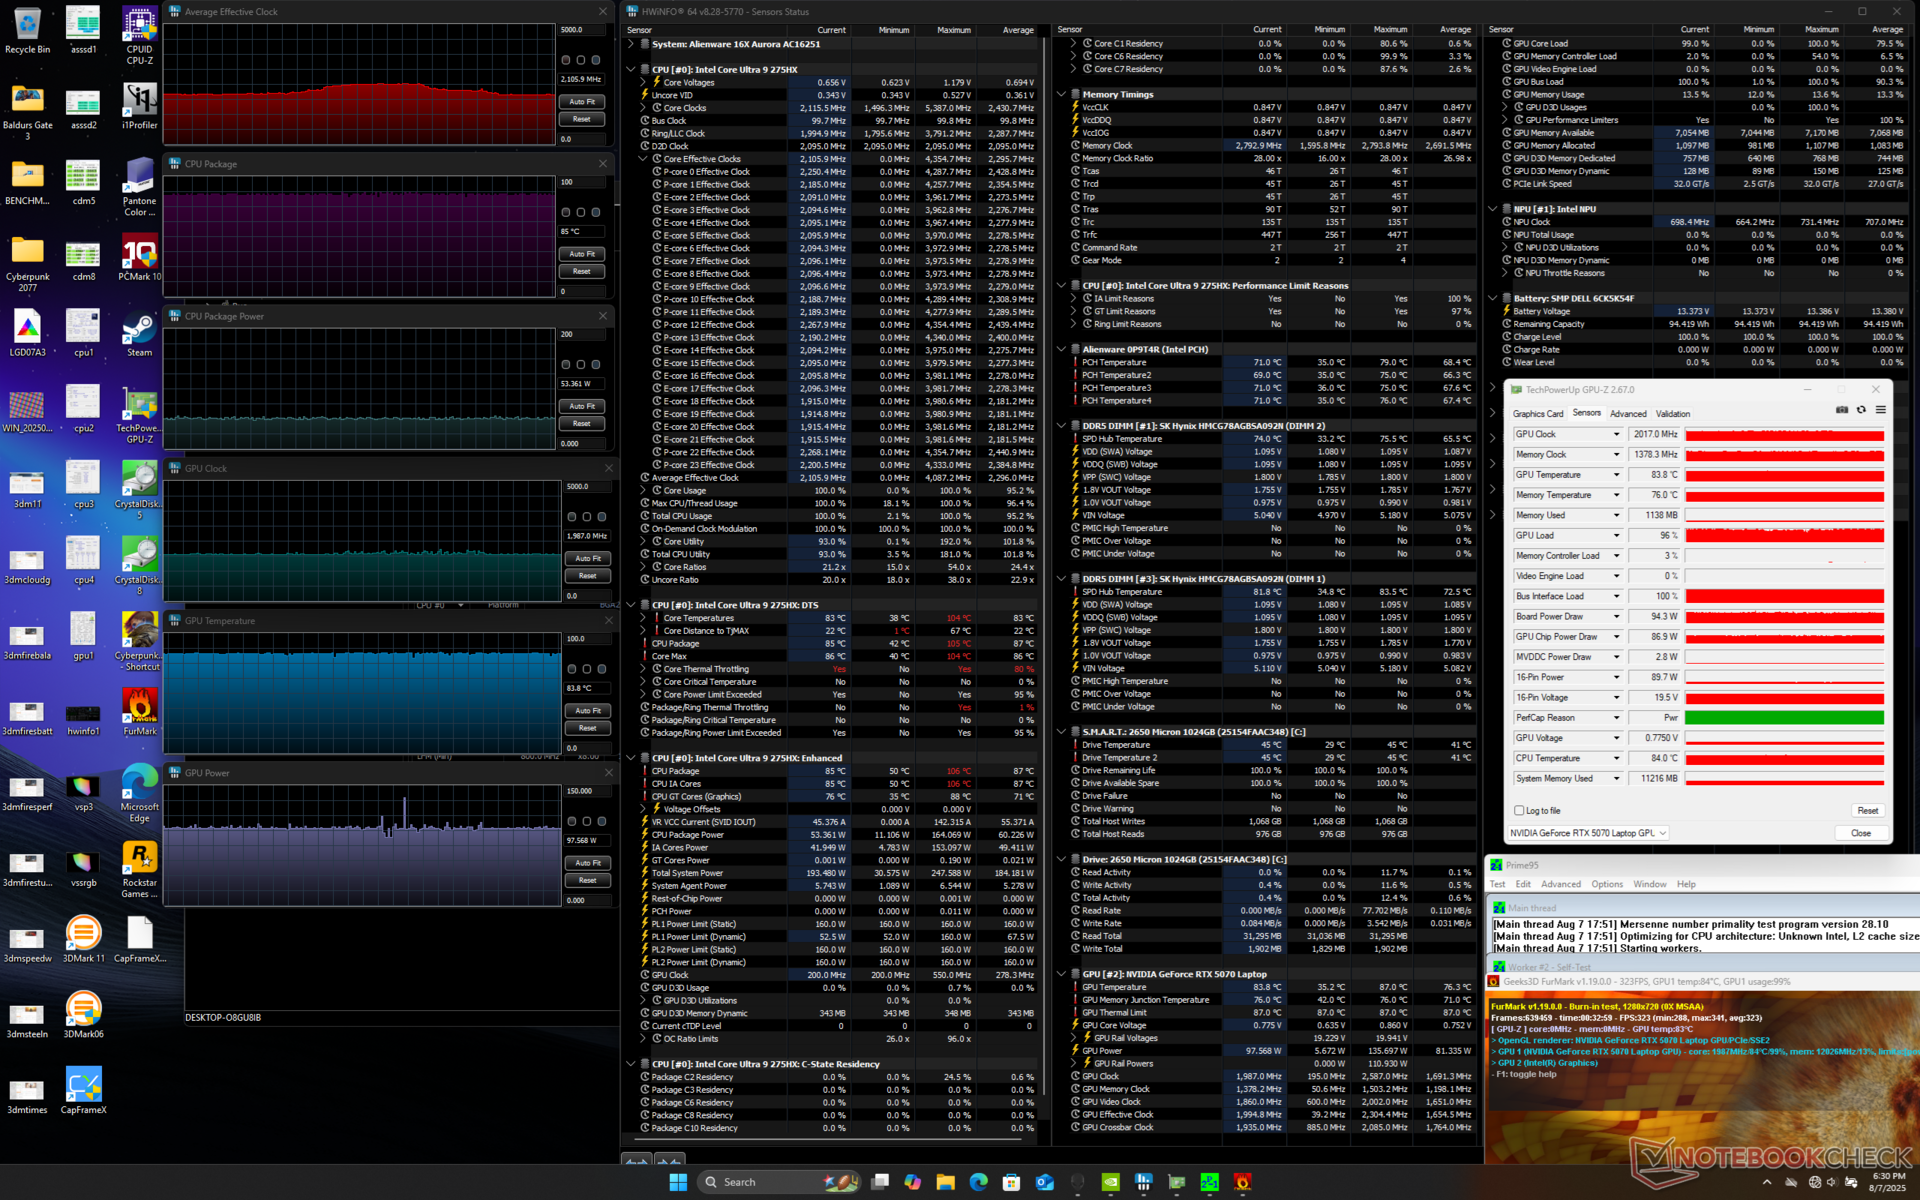
Test de stress
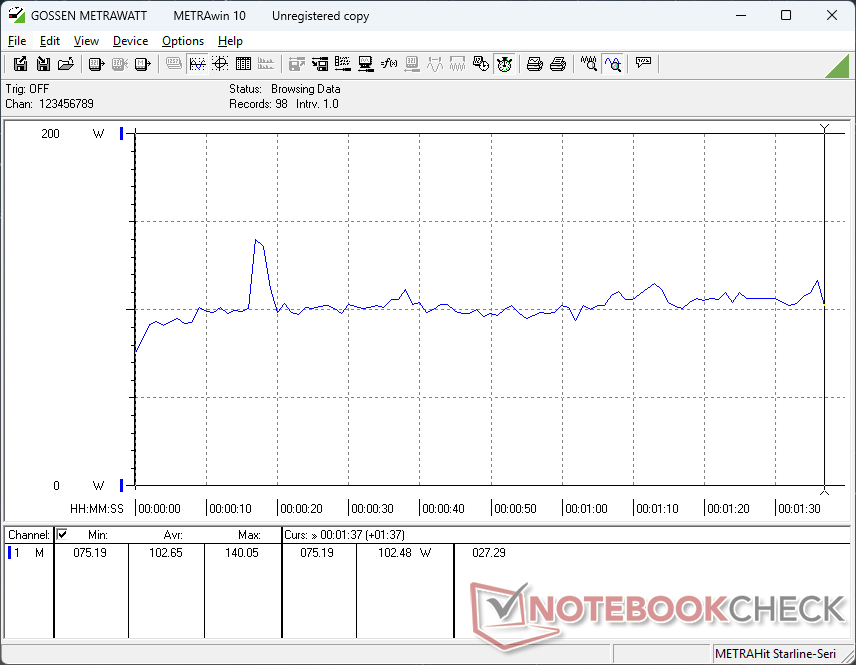
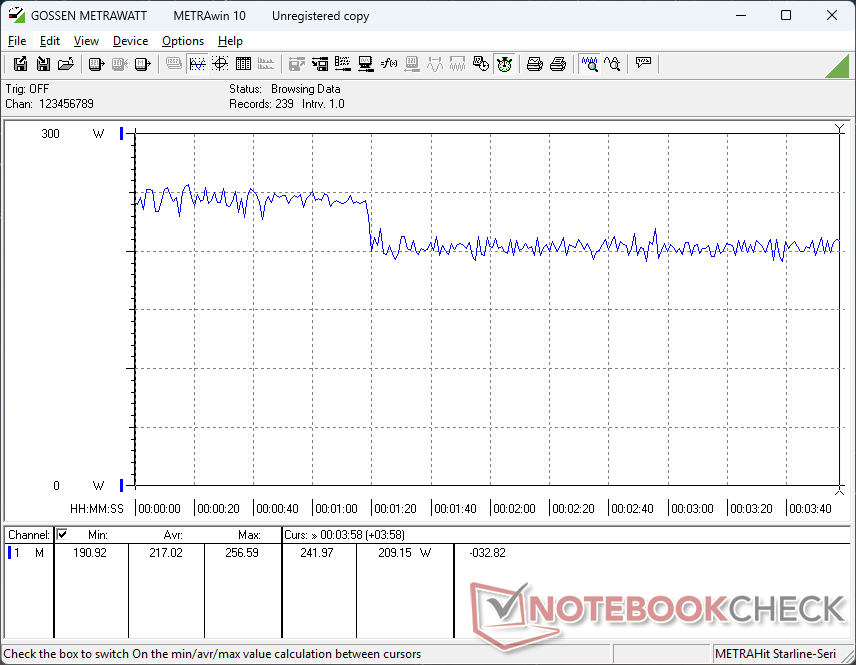
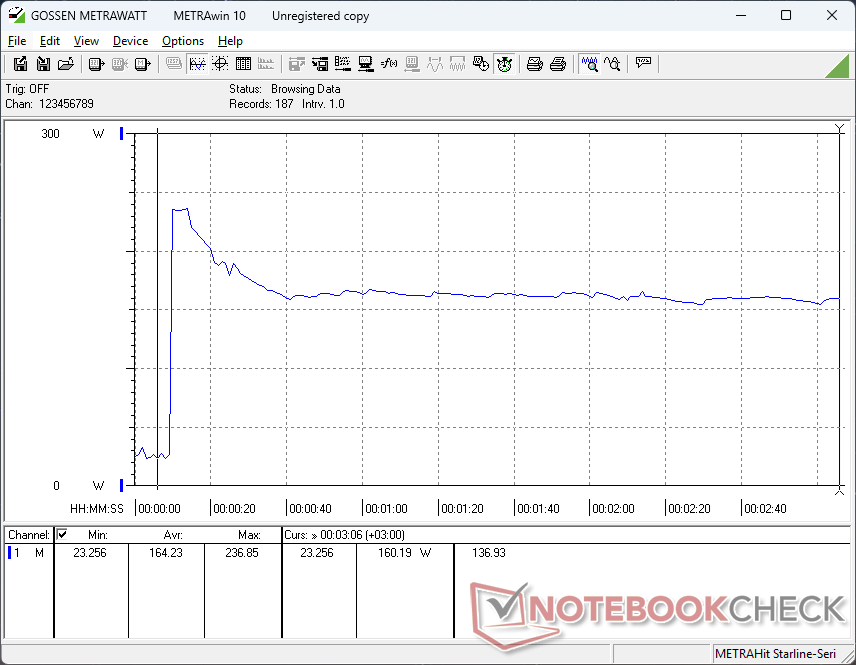
En mode Prime95, le processeur atteint 4,1 GHz, 165 W et 102 C avant de se stabiliser à 3,4 GHz, 102 W et 99 C peu de temps après. La température du cœur est très élevée, même en mode Overdrive, par rapport à d'autres ordinateurs portables de jeu comme le Razer Blade 16 où la température du cœur se stabilise à 80°C dans des conditions similaires. L'Aurora 16X donne clairement la priorité à la performance du CPU, même si cela signifie fonctionner à des températures beaucoup plus chaudes.
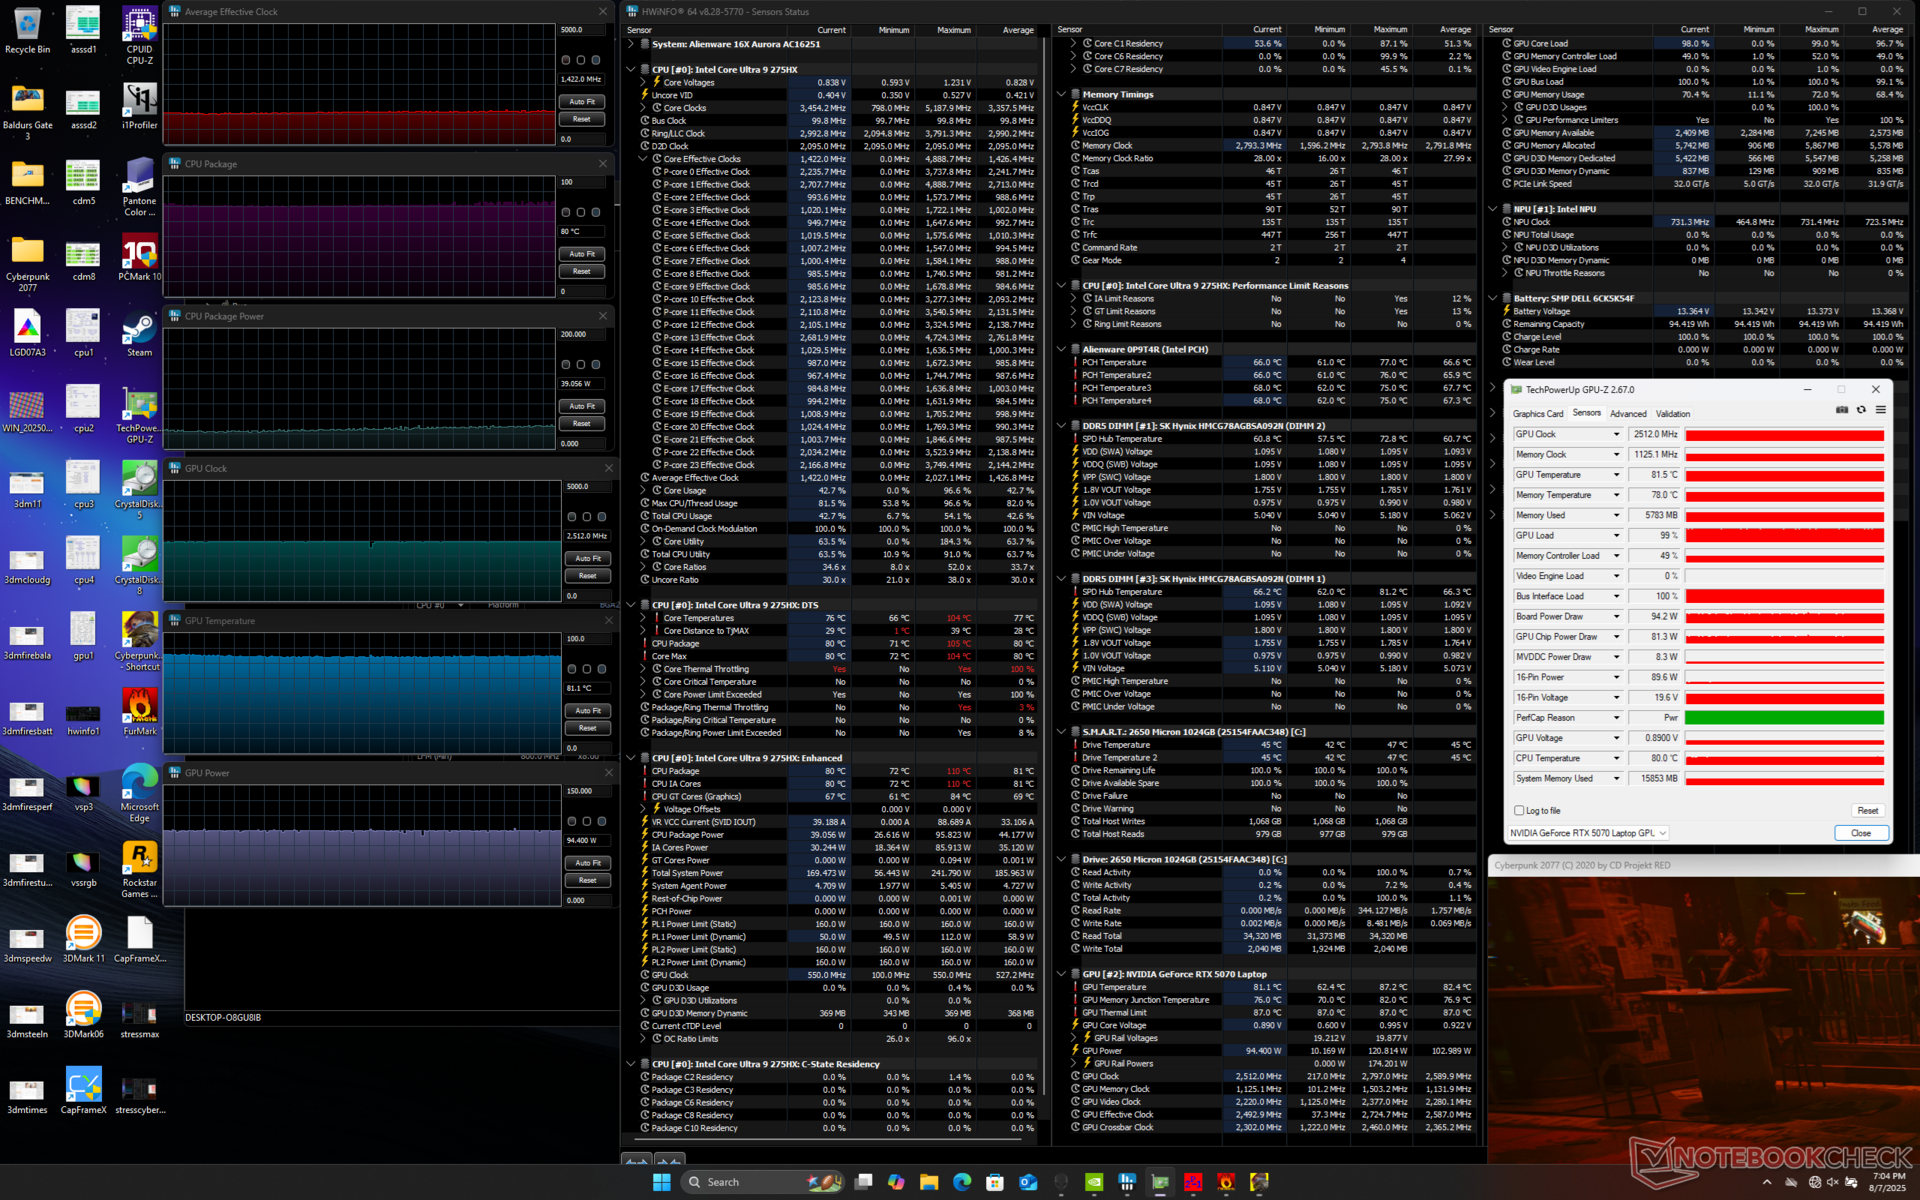
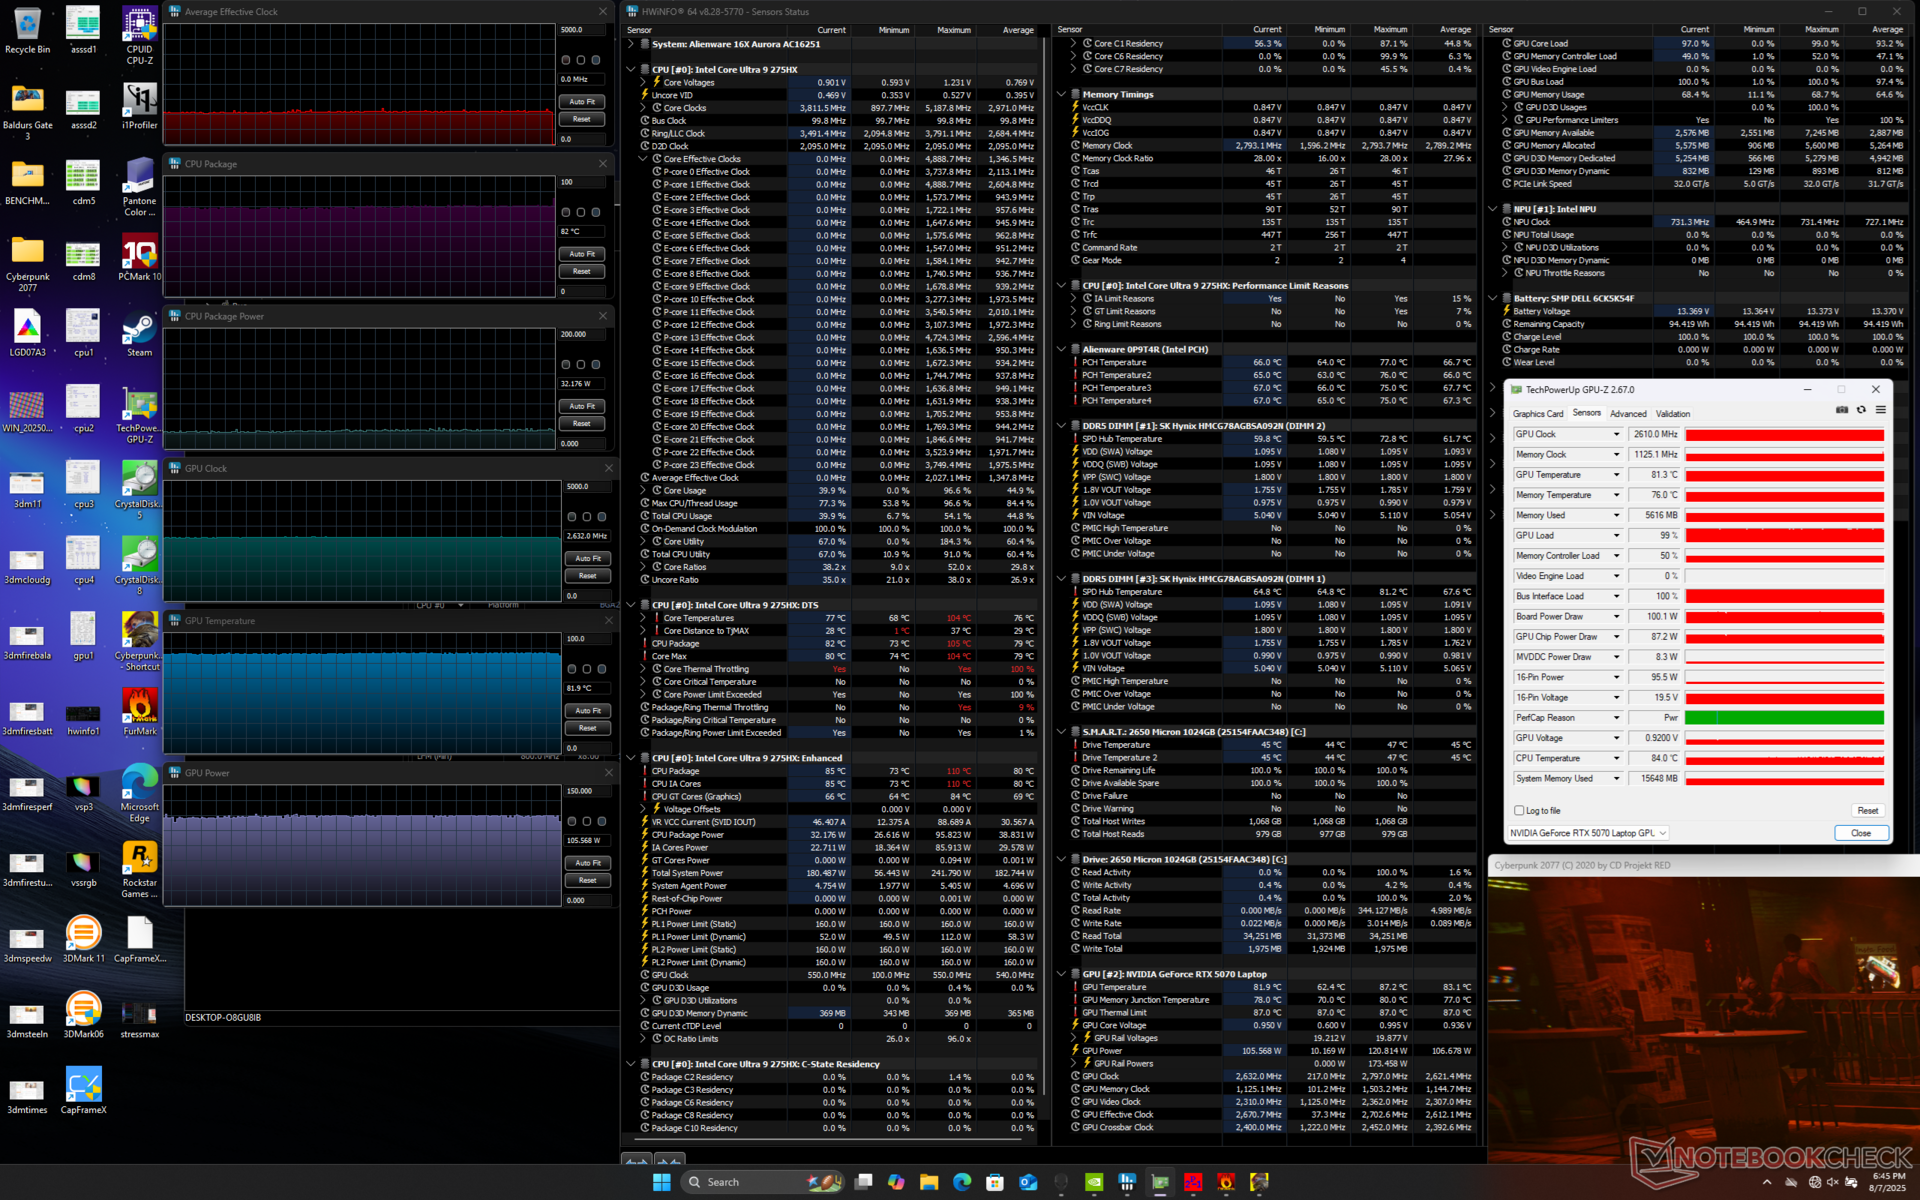
La consommation de la carte graphique se stabilise à 94 W, 111 W et 114 W lorsque Cyberpunk 2077 fonctionne en mode équilibré, performance et overdrive, respectivement. La fréquence d'horloge du GPU augmente entre chaque réglage de performance, comme le montrent le tableau et les captures d'écran ci-dessous, mais notez que les températures du GPU changent très peu, car le bruit du ventilateur s'intensifie pour compenser la fréquence d'horloge plus rapide. Les températures du CPU et du GPU pendant les jeux plafonnent à 80°C, ce qui est typique de la plupart des ordinateurs portables de jeu.
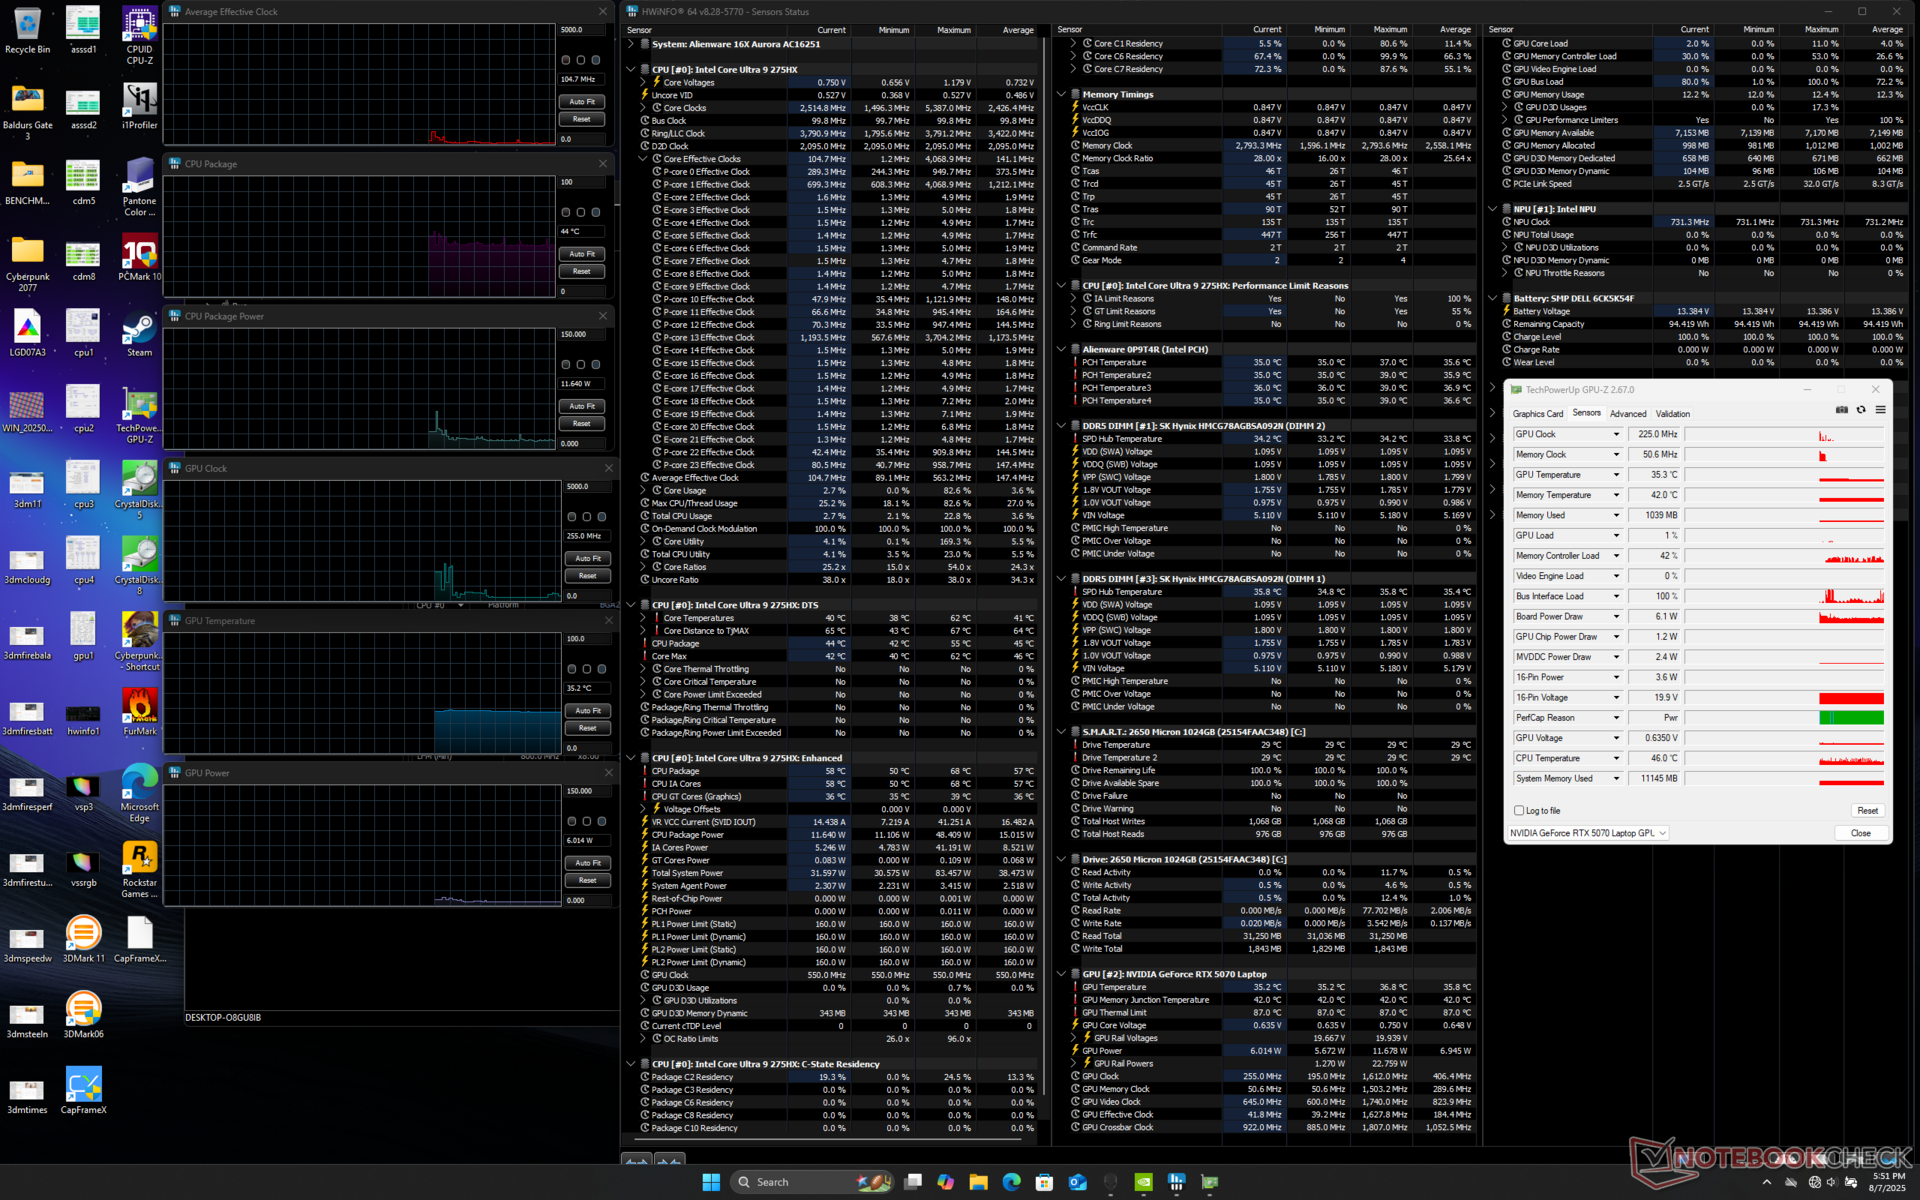

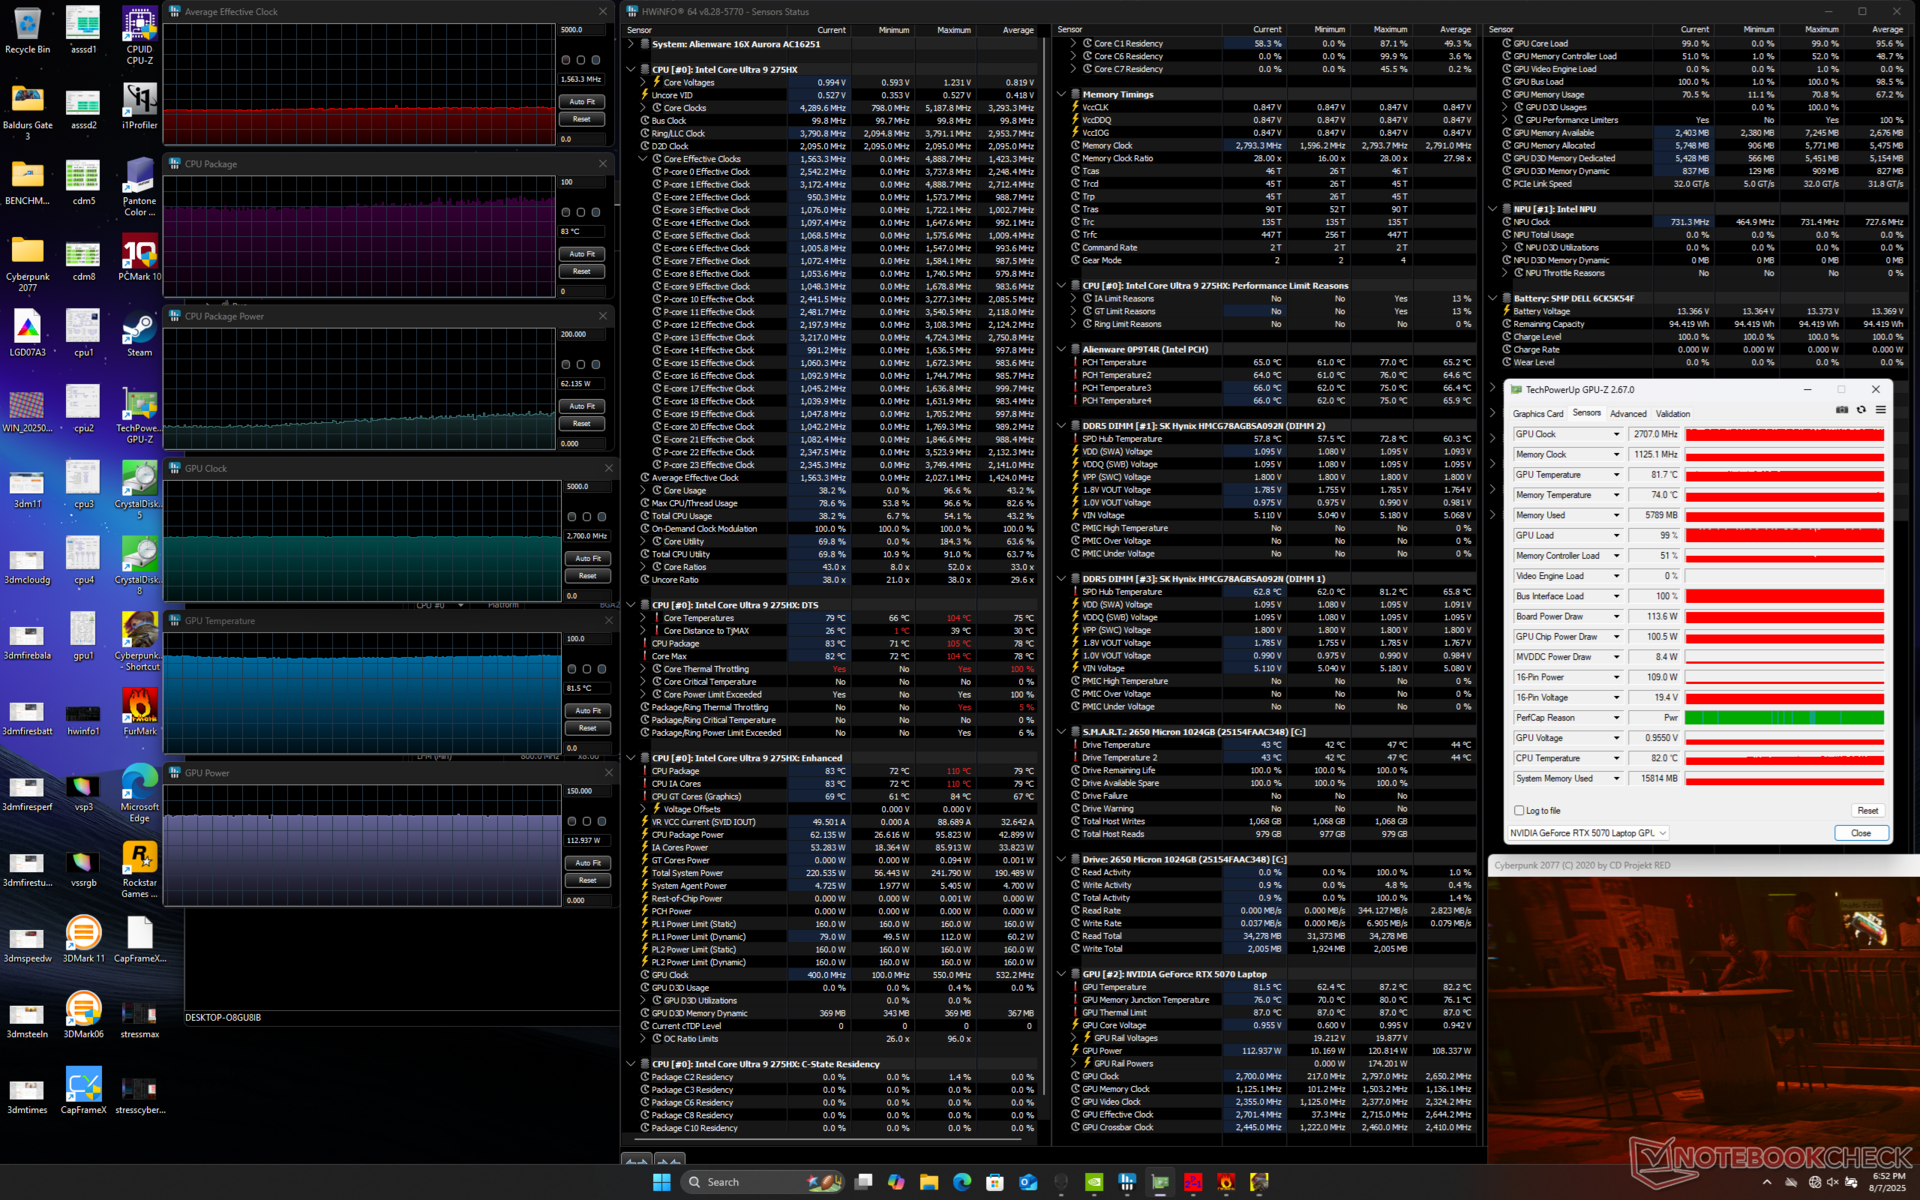
| Horloge moyenne du CPU (GHz) | Horloge du GPU (MHz) | Température moyenne du CPU (°C) | Température moyenne du GPU (°C) | |
| Système en veille | -- | -- | 44 | 35 |
| Prime95 Stress | 3.3 | -- | 99 | 52 |
| Prime95 + FurMark Stress | 2.1 | 2017 | 85 | 84 |
| Cyberpunk 2077 Stress (mode équilibré) | 1.4 | 2512 | 80 | 81 |
| Cyberpunk 2077 Stress (mode Performance) | 1.4 | 2610 | 82 | 82 |
| Cyberpunk 2077 Stress (mode Overdrive) | 1.6 | 2707 | 83 | 82 |
Performance du système
PCMark 10 plantait constamment avec des erreurs OpenCL, même après une réinstallation et de multiples tentatives. Ses résultats ne sont donc pas fournis ici. Les résultats de CrossMark et d'AIDA sont conformes à nos attentes et assez proches de ceux de l'Alienware 16 Area-51.
| AIDA64 / Memory Copy | |
| Asus TUF Gaming A16 FA608WV | |
| Alienware 16 Area-51 | |
| Moyenne Intel Core Ultra 9 275HX (56003 - 94460, n=30) | |
| Lenovo Legion 5 Pro 16IAX10H | |
| Alienware 16X Aurora, RTX 5070 | |
| MSI Vector 16 HX AI A2XWHG | |
| Gigabyte Gaming A16 GA6H | |
| AIDA64 / Memory Read | |
| Asus TUF Gaming A16 FA608WV | |
| Alienware 16 Area-51 | |
| Lenovo Legion 5 Pro 16IAX10H | |
| Alienware 16X Aurora, RTX 5070 | |
| Moyenne Intel Core Ultra 9 275HX (55795 - 97151, n=30) | |
| MSI Vector 16 HX AI A2XWHG | |
| Gigabyte Gaming A16 GA6H | |
| AIDA64 / Memory Write | |
| Asus TUF Gaming A16 FA608WV | |
| Alienware 16 Area-51 | |
| Moyenne Intel Core Ultra 9 275HX (55663 - 116129, n=30) | |
| Alienware 16X Aurora, RTX 5070 | |
| Lenovo Legion 5 Pro 16IAX10H | |
| MSI Vector 16 HX AI A2XWHG | |
| Gigabyte Gaming A16 GA6H | |
| AIDA64 / Memory Latency | |
| Alienware 16 Area-51 | |
| Moyenne Intel Core Ultra 9 275HX (105.8 - 161.6, n=30) | |
| Alienware 16X Aurora, RTX 5070 | |
| Asus TUF Gaming A16 FA608WV | |
| Lenovo Legion 5 Pro 16IAX10H | |
| MSI Vector 16 HX AI A2XWHG | |
| Gigabyte Gaming A16 GA6H | |
* ... Moindre est la valeur, meilleures sont les performances
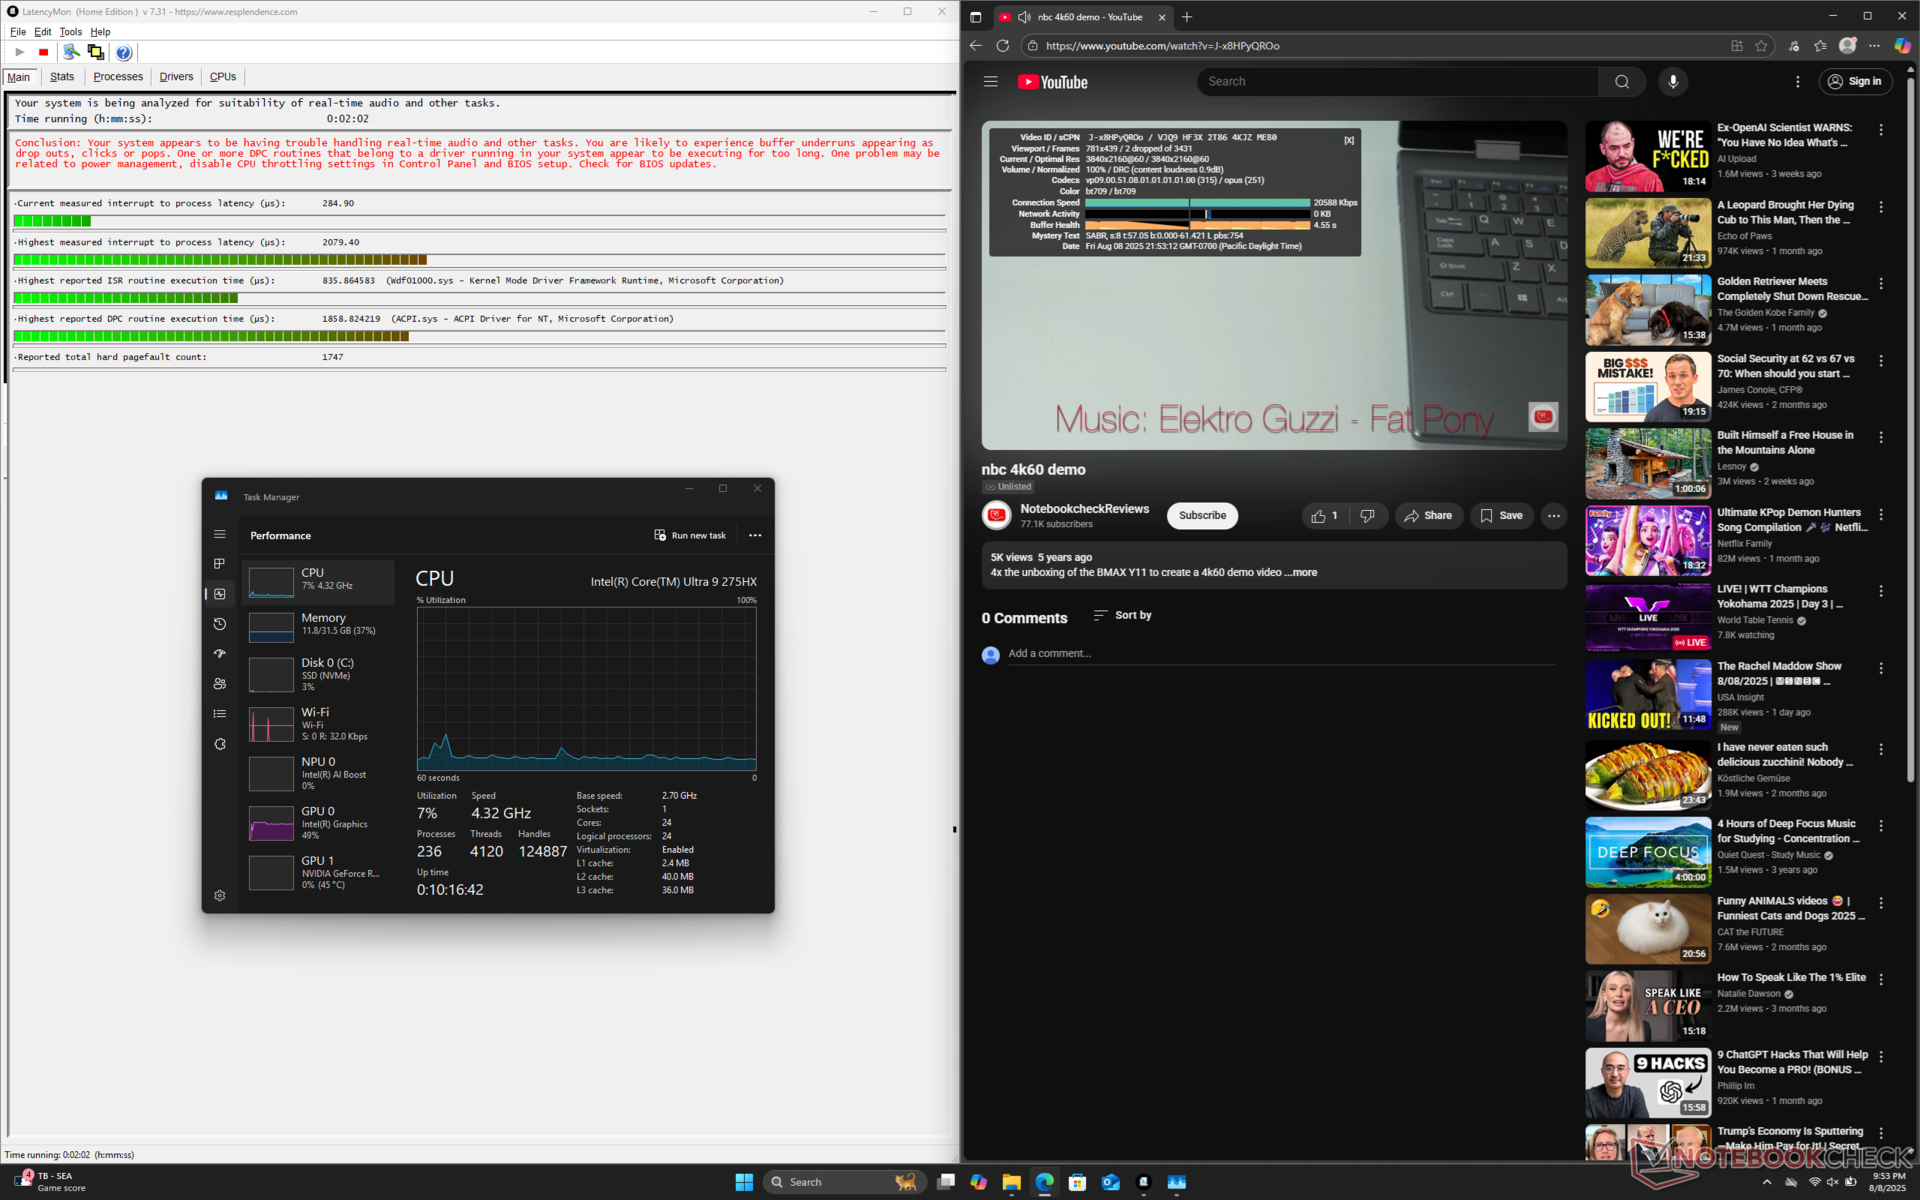
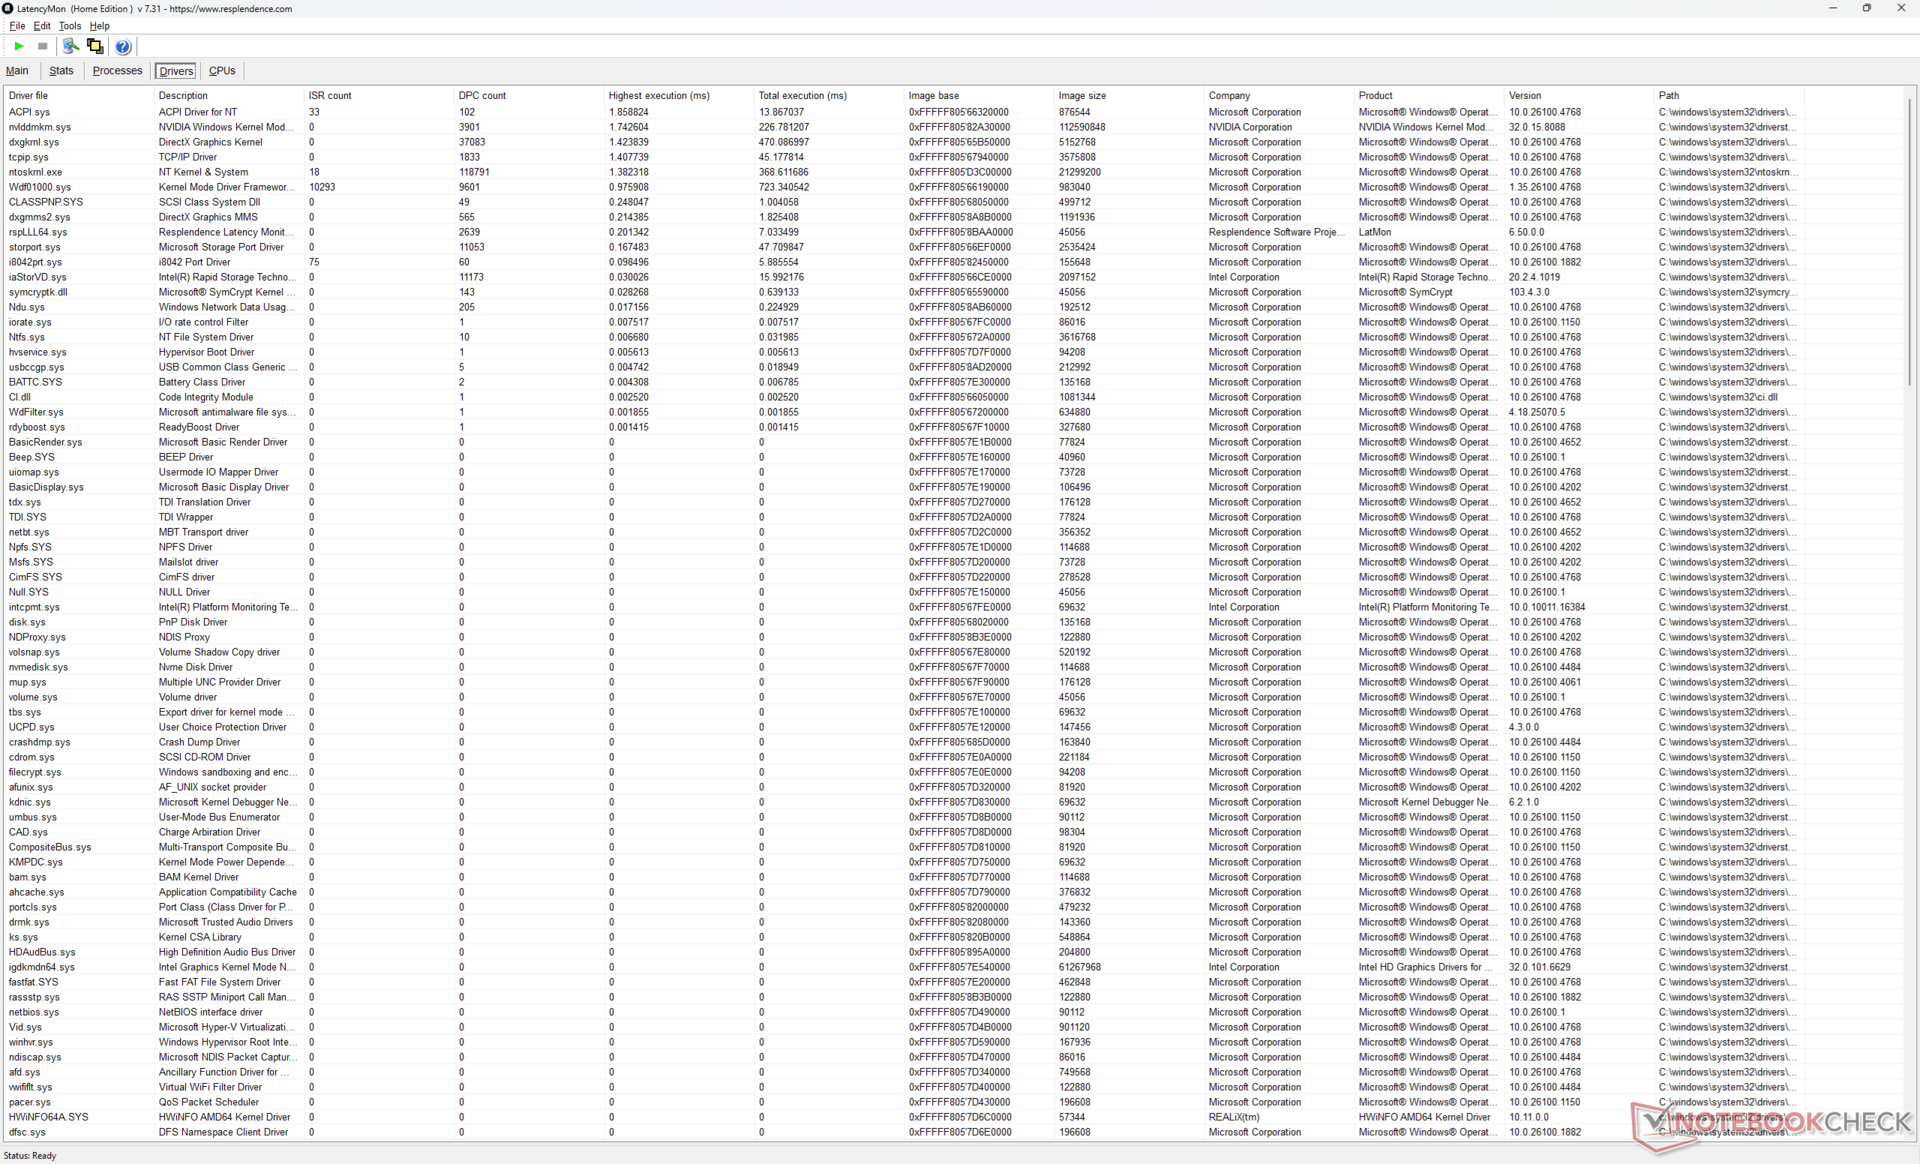
Latence DPC
LatencyMon ne montre que des problèmes mineurs de DPC lors de l'ouverture de plusieurs onglets de notre page d'accueil, ainsi que 2 images perdues lors de la lecture d'une vidéo 4K60 de 60 secondes.
| DPC Latencies / LatencyMon - interrupt to process latency (max), Web, Youtube, Prime95 | |
| MSI Vector 16 HX AI A2XWHG | |
| Gigabyte Gaming A16 GA6H | |
| Alienware 16 Area-51 | |
| Alienware 16X Aurora, RTX 5070 | |
| Asus TUF Gaming A16 FA608WV | |
| Lenovo Legion 5 Pro 16IAX10H | |
* ... Moindre est la valeur, meilleures sont les performances
Dispositifs de stockage
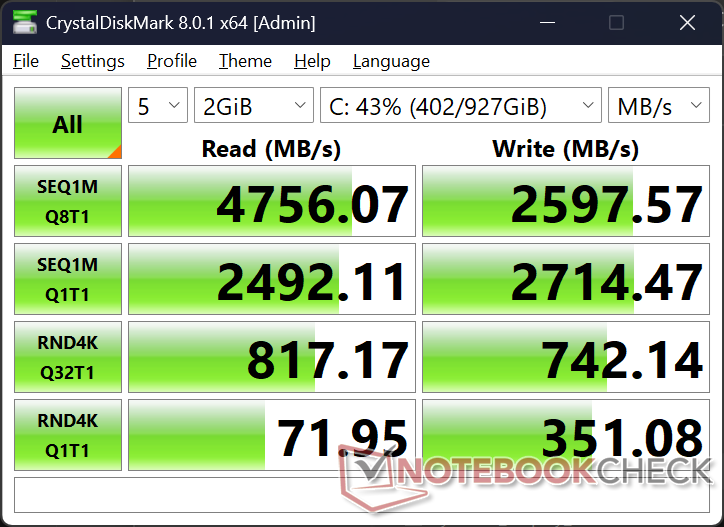
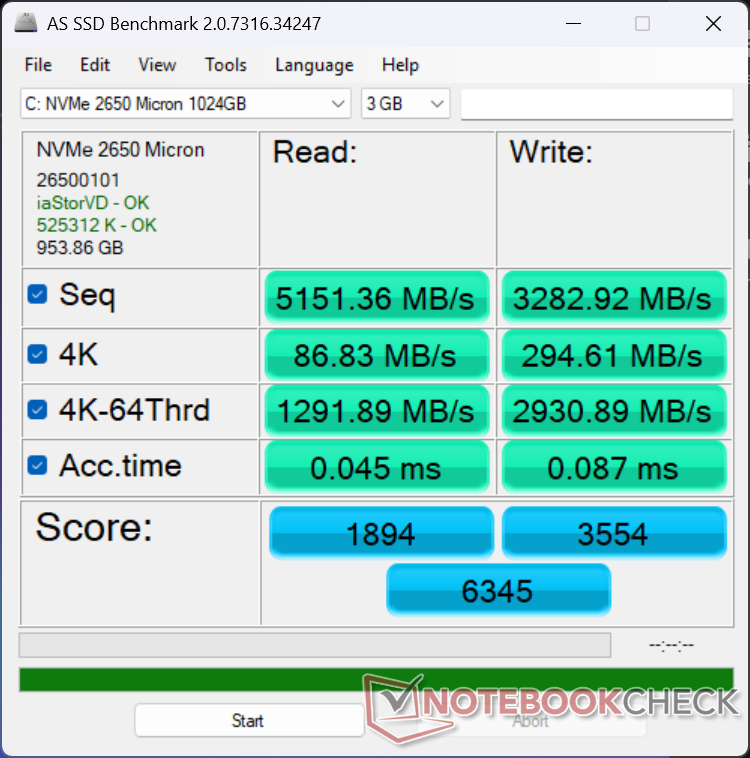
Le Micron 2650 PCIe4 x4 NVMe SSD dans notre unité offre des taux de lecture allant jusqu'à 7000 Mo/s avant que l'étranglement ne se produise après environ une minute dans notre test de stress en boucle DiskSpd. Les taux de transfert chutent jusqu'à 3000 Mo/s, comme le montre notre graphique ci-dessous, alors que le Samsung PM9C1a de l'Alienware Area-51 reste stable à 6200 Mo/s dans des conditions de test similaires. Pour les scénarios de jeu, cependant, l'étranglement retardé du SSD Aurora 16X devrait avoir un impact minime, voire nul, sur l'expérience de l'utilisateur.

| Drive Performance rating - Percent | |
| Alienware 16 Area-51 | |
| Alienware 16X Aurora, RTX 5070 | |
| Lenovo Legion 5 Pro 16IAX10H | |
| Gigabyte Gaming A16 GA6H | |
| MSI Vector 16 HX AI A2XWHG | |
| Asus TUF Gaming A16 FA608WV | |
* ... Moindre est la valeur, meilleures sont les performances
Throttoir de disque : Boucle de lecture DiskSpd, profondeur de la file d'attente 8
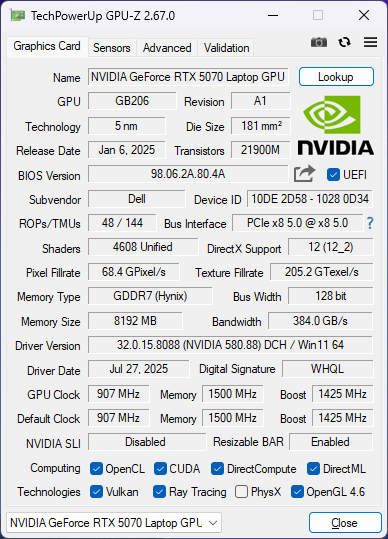
Performance du GPU
La rTX 5070 mobile est environ 10 % plus rapide que la rTX 4070 mobile en termes de performances brutes de tramage. En outre, elle offre d'autres avantages auxiliaires, notamment le support MFG et l'encodage/décodage de la profondeur de couleur 4:2:2, qui n'étaient pas disponibles auparavant.
Gardez à l'esprit que la RTX 5070 mobile est significativement plus lente que la rTX 5070 de bureau d'environ 35 à 40 % et avec beaucoup moins de VRAM. La rétrogradation vers la rTX 5060 mobile devrait avoir un impact sur les performances d'environ 10 %.
| Profil de puissance | Score graphique | Score physique | Score combiné |
| Mode Overdrive | 36334 | 51210 | 12767 |
| Mode Performance | 35646 (-2%) | 50983 (-0%) | 13658 (-0%) |
| Mode équilibré | 33459 (-8%) | 50799 (-1%) | 12594 (-1%) |
| Puissance de la batterie | 26776 (-26%) | 29665 (-42%) | 9154 (-28%) |
Il n'y a pas de différences de performances significatives entre les modes Overdrive et Performance, comme le montre notre tableau de résultats Fire Strike ci-dessus. En revanche, les performances graphiques diminuent d'environ 8 % pour les utilisateurs qui préfèrent jouer en mode équilibré, beaucoup plus silencieux.
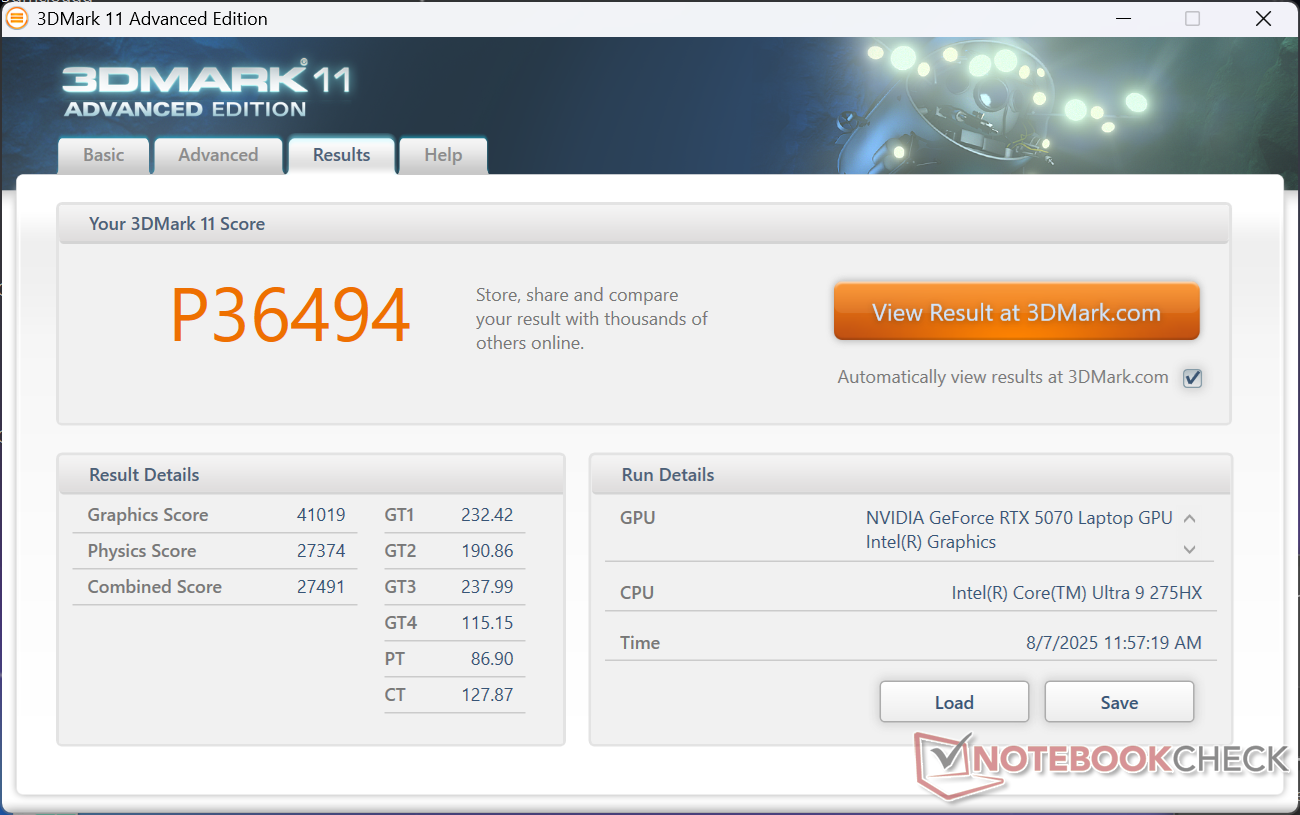
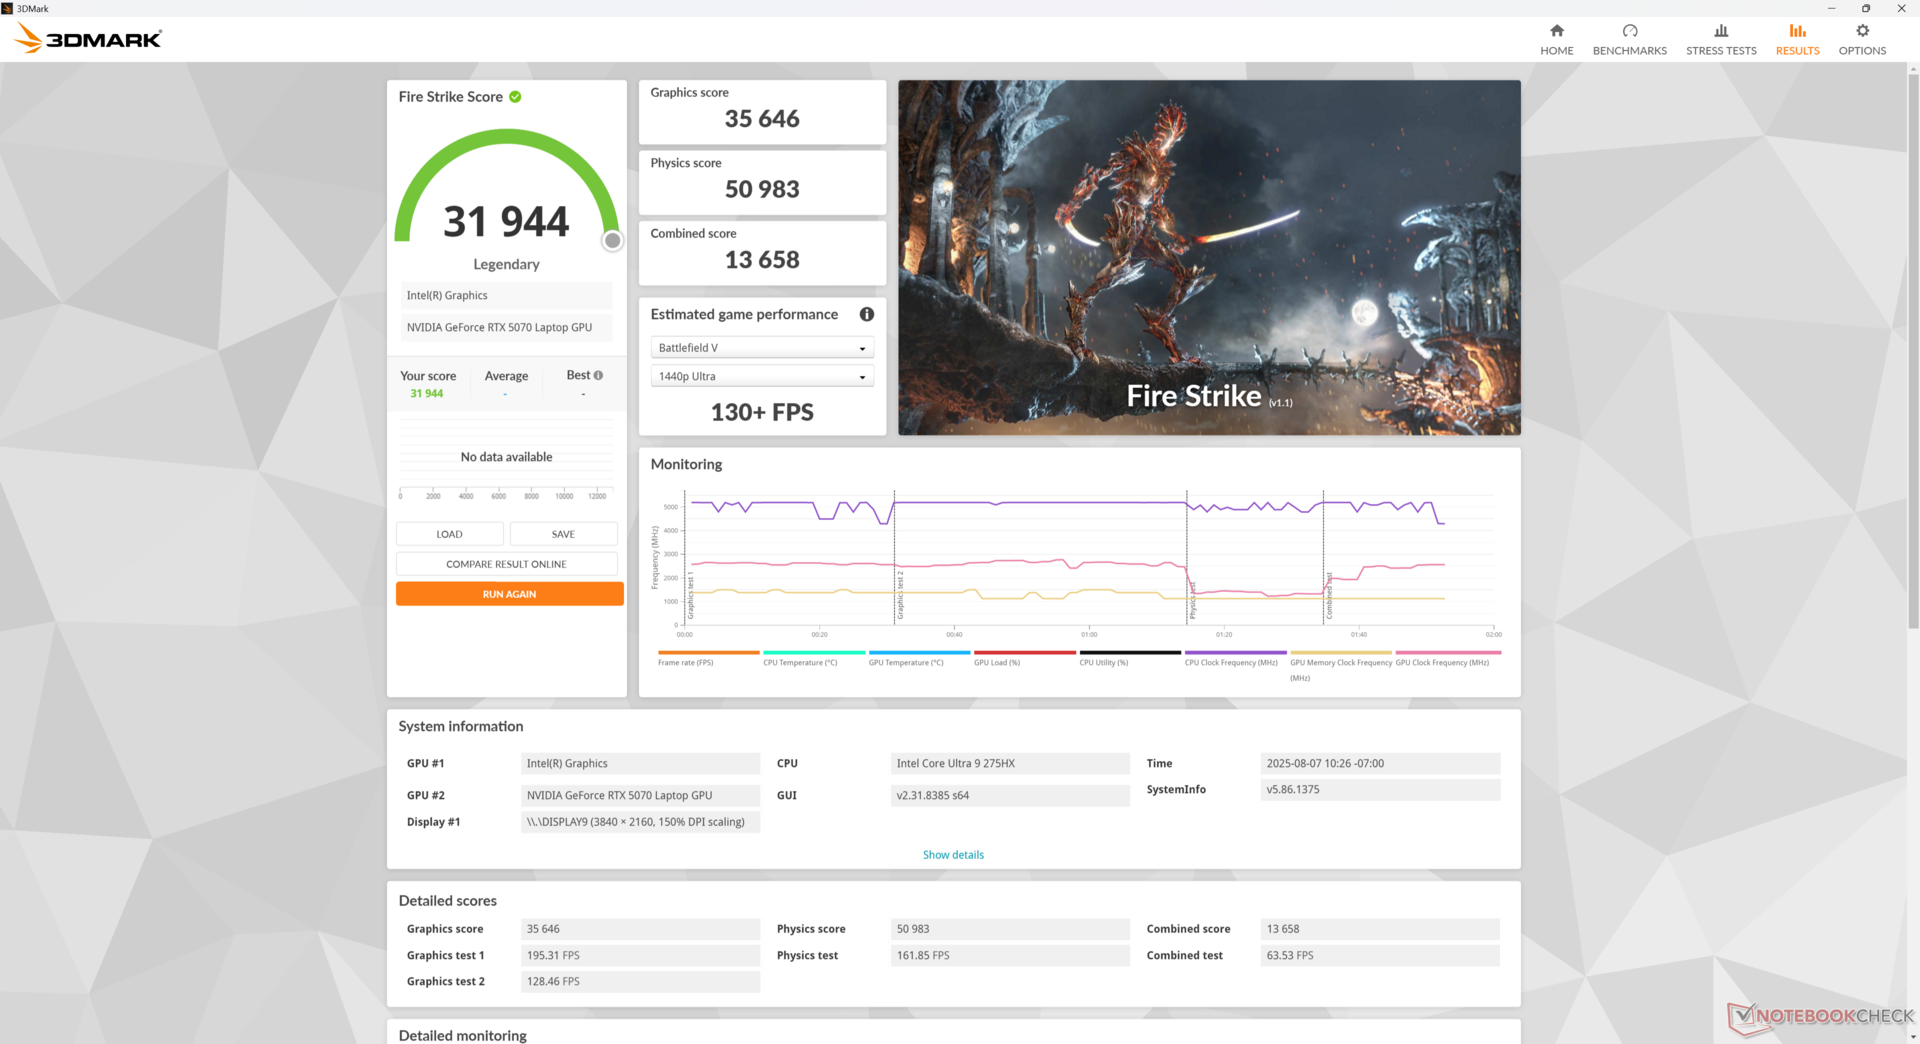
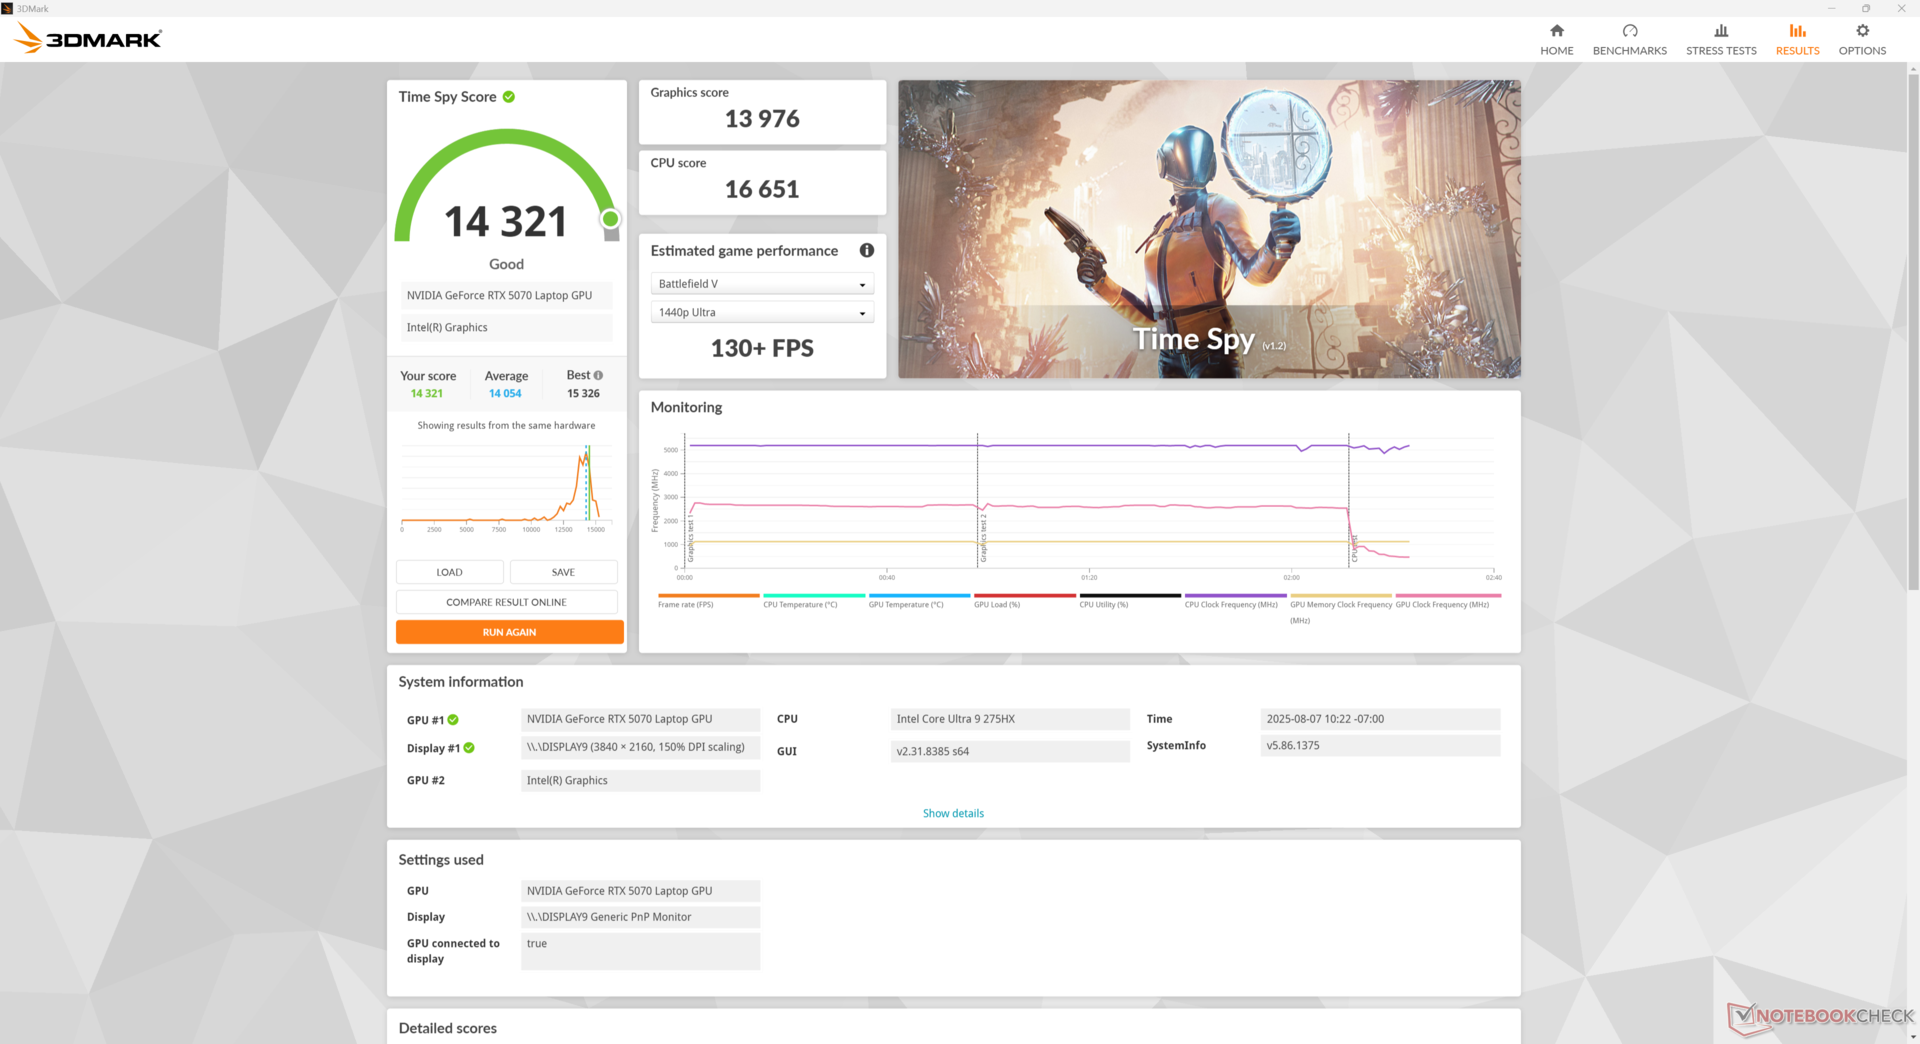
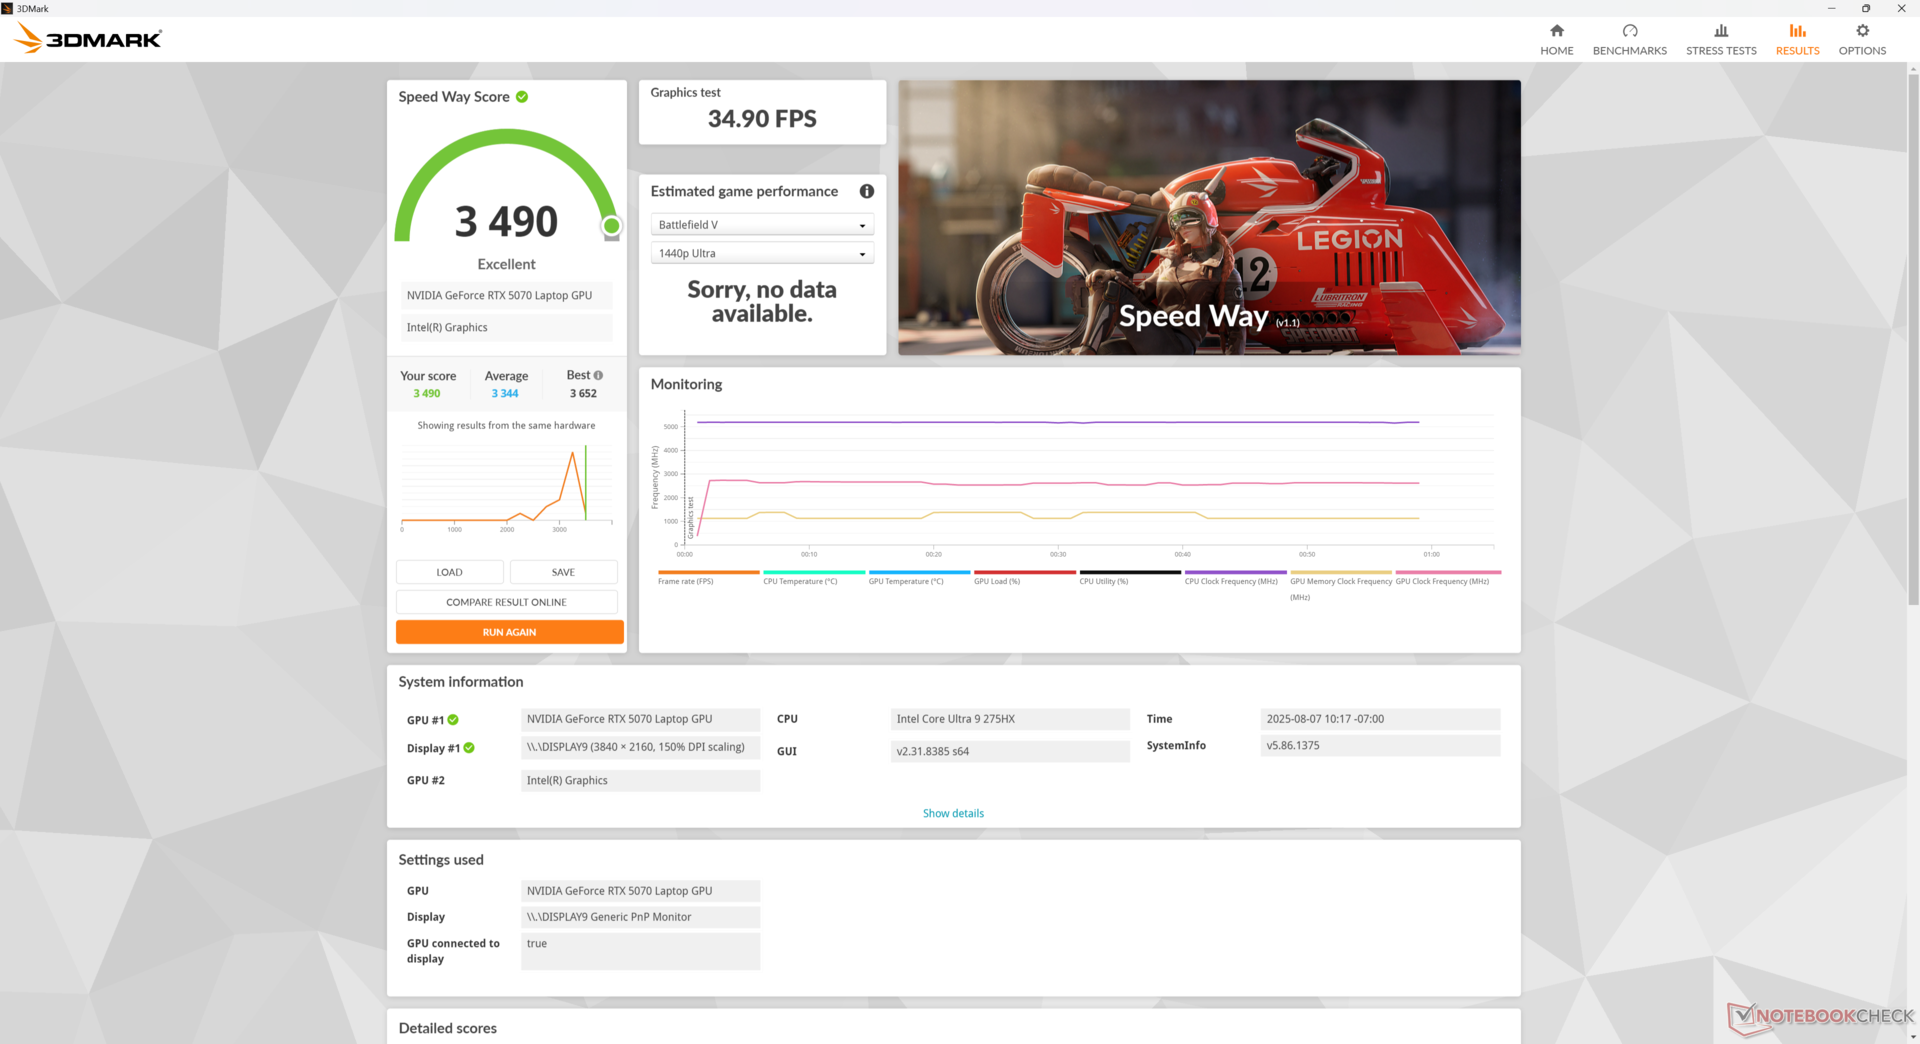
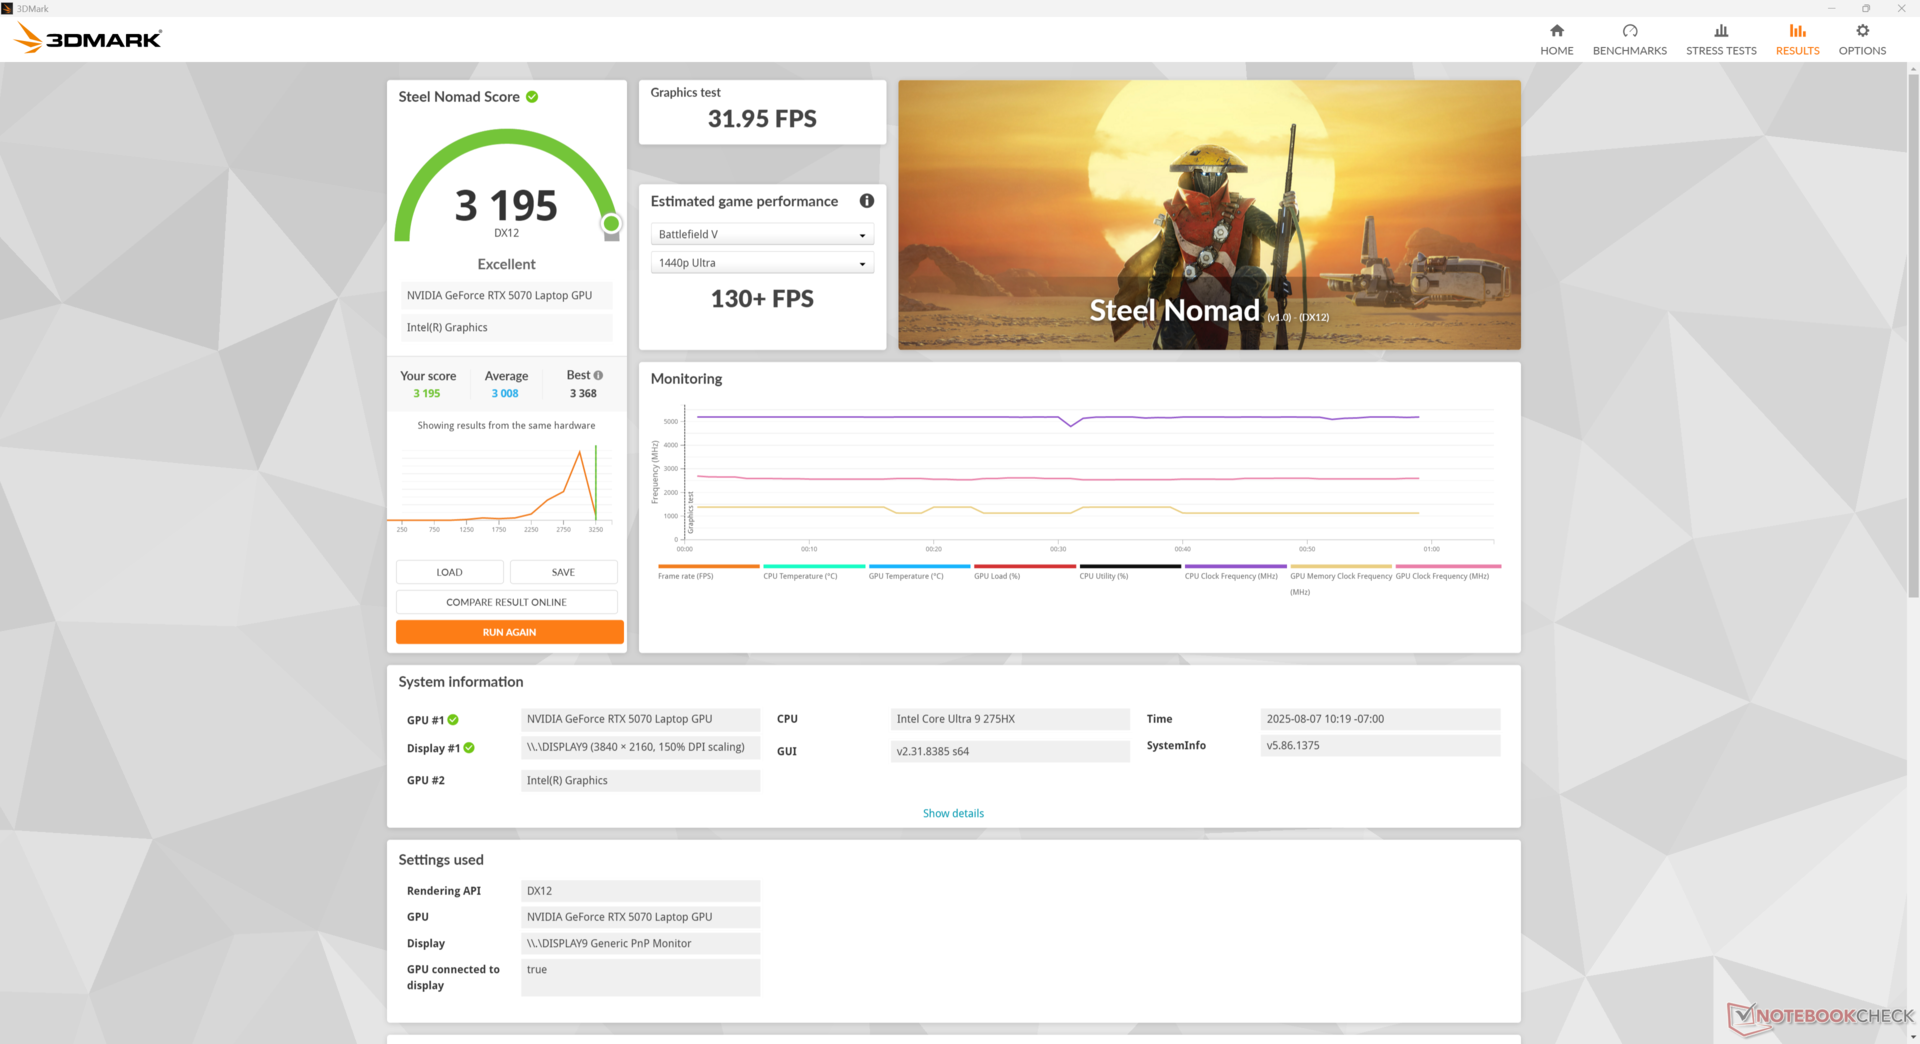
| 3DMark 11 Performance | 36494 points | |
| 3DMark Cloud Gate Standard Score | 71379 points | |
| 3DMark Fire Strike Score | 31944 points | |
| 3DMark Time Spy Score | 14321 points | |
| 3DMark Steel Nomad Score | 3195 points | |
Aide | ||
* ... Moindre est la valeur, meilleures sont les performances
Performances des jeux
Le jeu avec la RTX 5070 mobile est mitigé. Alors que la RTX 5070 de bureau peut confortablement faire tourner la plupart des titres à 1440p en paramètres maximum, y compris des titres exigeants comme Indiana Jones ou Assassin's Creed Shadows, le GPU mobile a du mal sur ces mêmes titres. Par exemple, Alan Wake 2 à 1440p en configuration Ultra ne tourne qu'à 45 FPS sur notre Aurora 16X contre 74 FPS sur notre RTX 5070 de référence. DLSS peut certainement aider à réduire cet écart, mais il est recommandé de baisser les paramètres généraux à moyen ou moyen-haut. Bien sûr, la RTX 5070 mobile est beaucoup plus portable que son homologue de bureau plus rapide.
Les 8 Go de VRAM constituent également une limitation notable. L'activation de fonctions avancées telles que le ray tracing ou des textures plus élevées qui consomment de la VRAM ont souvent fait chuter les taux d'images ou conduit à un crash lors des tests de jeux tels que Monster Hunter Wilds, Indiana Jones, Alan Wake 2, ou Black Myth Wukong. Monster Hunter Wilds, par exemple, tourne plus de 40 % plus lentement qu'un ordinateur portable équipé d'une carte graphique RTX 5070 Ti avec les paramètres 1080p maximum. Nos résultats pour Indiana Jones sont également anormalement bas, même après de multiples tentatives et la mise à jour vers les derniers pilotes au moment de la publication.
| Performance rating - Percent | |
| Alienware 16 Area-51 -1! | |
| Lenovo Legion 5 Pro 16IAX10H | |
| MSI Vector 16 HX AI A2XWHG -1! | |
| Alienware 16X Aurora, RTX 5070 | |
| Gigabyte Gaming A16 GA6H | |
| Asus TUF Gaming A16 FA608WV | |
| Cyberpunk 2077 - 1920x1080 Ultra Preset (FSR off) | |
| Alienware 16 Area-51 | |
| Lenovo Legion 5 Pro 16IAX10H | |
| MSI Vector 16 HX AI A2XWHG | |
| Alienware 16X Aurora, RTX 5070 | |
| Gigabyte Gaming A16 GA6H | |
| Asus TUF Gaming A16 FA608WV | |
| Baldur's Gate 3 - 1920x1080 Ultra Preset AA:T | |
| Alienware 16 Area-51 | |
| MSI Vector 16 HX AI A2XWHG | |
| Alienware 16X Aurora, RTX 5070 | |
| Lenovo Legion 5 Pro 16IAX10H | |
| Gigabyte Gaming A16 GA6H | |
| Asus TUF Gaming A16 FA608WV | |
| GTA V - 1920x1080 Highest AA:4xMSAA + FX AF:16x | |
| Alienware 16X Aurora, RTX 5070 | |
| Lenovo Legion 5 Pro 16IAX10H | |
| MSI Vector 16 HX AI A2XWHG | |
| Asus TUF Gaming A16 FA608WV | |
| Gigabyte Gaming A16 GA6H | |
| Final Fantasy XV Benchmark - 1920x1080 High Quality | |
| Alienware 16 Area-51 | |
| Lenovo Legion 5 Pro 16IAX10H | |
| MSI Vector 16 HX AI A2XWHG | |
| Alienware 16X Aurora, RTX 5070 | |
| Asus TUF Gaming A16 FA608WV | |
| Gigabyte Gaming A16 GA6H | |
| Strange Brigade - 1920x1080 ultra AA:ultra AF:16 | |
| Alienware 16 Area-51 | |
| Lenovo Legion 5 Pro 16IAX10H | |
| Alienware 16X Aurora, RTX 5070 | |
| Gigabyte Gaming A16 GA6H | |
| Asus TUF Gaming A16 FA608WV | |
| Dota 2 Reborn - 1920x1080 ultra (3/3) best looking | |
| Alienware 16X Aurora, RTX 5070 | |
| Lenovo Legion 5 Pro 16IAX10H | |
| MSI Vector 16 HX AI A2XWHG | |
| Alienware 16 Area-51 | |
| Gigabyte Gaming A16 GA6H | |
| Asus TUF Gaming A16 FA608WV | |
| X-Plane 11.11 - 1920x1080 high (fps_test=3) | |
| Alienware 16X Aurora, RTX 5070 | |
| Lenovo Legion 5 Pro 16IAX10H | |
| Alienware 16 Area-51 | |
| MSI Vector 16 HX AI A2XWHG | |
| Gigabyte Gaming A16 GA6H | |
| Asus TUF Gaming A16 FA608WV | |
| Monster Hunter Wilds | |
| 1920x1080 medium, no upscaling | |
| Chuwi Gamebook, R9 9955HX | |
| Alienware 16X Aurora, RTX 5070 | |
| Moyenne NVIDIA GeForce RTX 5070 Laptop (61.6 - 78.2, n=4) | |
| 1920x1080 ultra, RT: high, no upscaling | |
| Alienware 16 Area-51 | |
| Chuwi Gamebook, R9 9955HX | |
| Razer Blade 16 RTX 5080 | |
| Moyenne NVIDIA GeForce RTX 5070 Laptop (39.1 - 44.5, n=3) | |
| Alienware 16X Aurora, RTX 5070 | |
| 2560x1440 ultra, RT: high, no upscaling | |
| Alienware 16 Area-51 | |
| Razer Blade 16 RTX 5080 | |
| Chuwi Gamebook, R9 9955HX | |
| Moyenne NVIDIA GeForce RTX 5070 Laptop (21.1 - 31.7, n=3) | |
| Alienware 16X Aurora, RTX 5070 | |
Cyberpunk 2077 ultra FPS Chart
| Bas | Moyen | Élevé | Ultra | QHD DLSS | QHD | 4K DLSS | 4K | |
|---|---|---|---|---|---|---|---|---|
| GTA V (2015) | 156.4 | 129 | 125.6 | |||||
| Dota 2 Reborn (2015) | 239 | 210 | 201 | 184 | 148.8 | |||
| Final Fantasy XV Benchmark (2018) | 150.7 | 107.4 | 58.8 | |||||
| X-Plane 11.11 (2018) | 162.3 | 141.3 | 116.1 | 89.3 | ||||
| Strange Brigade (2018) | 259 | 177.9 | 96.1 | |||||
| Baldur's Gate 3 (2023) | 140.8 | 140 | 96.3 | 83.7 | 49.6 | |||
| Cyberpunk 2077 (2023) | 180.3 | 142.7 | 117.7 | 102.9 | 76.6 | 65.4 | 28.4 | |
| Alan Wake 2 (2023) | 62.6 | 45.1 | 23.8 | |||||
| F1 24 (2024) | 88.3 | 85.8 | 54.7 | 22.7 | 19 | |||
| Black Myth: Wukong (2024) | 66 | 37 | 41 | 27 | 7 | |||
| Indiana Jones and the Great Circle (2024) | 153.8 | 56.1 | 8.3 | 7.6 | ||||
| Monster Hunter Wilds (2025) | 78.2 | 39.1 | 21.1 | |||||
| Assassin's Creed Shadows (2025) | 61 | 38 | 37 | 37 | 29 | 22 |
Émissions
Bruit du système
Bien qu'il abandonne le refroidisseur à chambre à vapeur de l'Area-51 pour une approche plus traditionnelle, le bruit et le comportement des ventilateurs de l'Aurora 16X sont étonnamment similaires. Les deux ventilateurs restent silencieux pendant toute la première scène de 3DMark 06, alors qu'ils ont tendance à s'activer très tôt sur la plupart des autres ordinateurs portables de jeu. Cela signifie que le comportement du ventilateur de l'Aurora 16X est plus stable lorsqu'il exécute des charges moins exigeantes comme des navigateurs ou des vidéos.
Le bruit du ventilateur atteint 48,5 dB(A), 51,8 dB(A) et 58 dB(A) en mode équilibré, en mode performance et en mode overdrive, respectivement. Il est recommandé de jouer en mode Performance, car les avantages du mode Overdrive en termes de performances sont extrêmement faibles par rapport à l'augmentation extrême des niveaux de bruit.
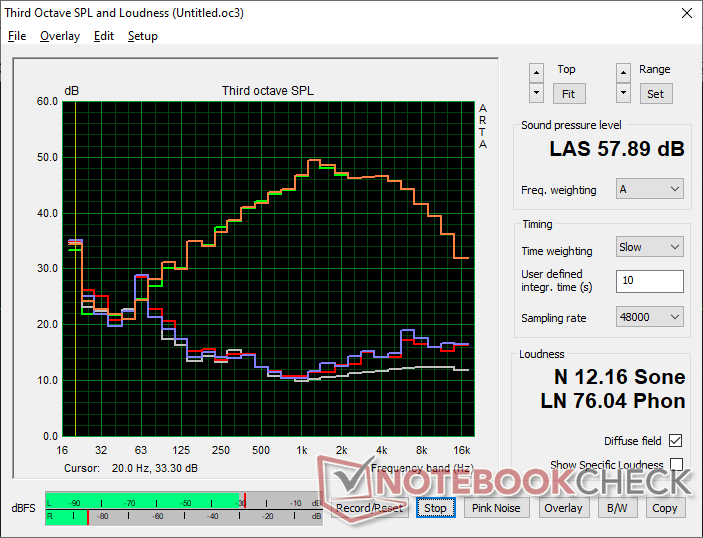
Degré de la nuisance sonore
| Au repos |
| 23.9 / 23.9 / 26.1 dB(A) |
| Fortement sollicité |
| 26.8 / 58 dB(A) |
 | ||
30 dB silencieux 40 dB(A) audible 50 dB(A) bruyant |
||
min: | ||
| Alienware 16X Aurora, RTX 5070 GeForce RTX 5070 Laptop, Ultra 9 275HX | Alienware 16 Area-51 GeForce RTX 5080 Laptop, Ultra 9 275HX, Samsung PM9C1a MZ9L81T0HDLB | Gigabyte Gaming A16 GA6H GeForce RTX 5070 Laptop, i7-13620H, Kingston OM8PGP41024Q-A0 | MSI Vector 16 HX AI A2XWHG GeForce RTX 5070 Ti Laptop, Ultra 7 255HX, Micron 2400 MTFDKBA512QFM | Asus TUF Gaming A16 FA608WV GeForce RTX 4060 Laptop GPU, Ryzen AI 9 HX 370, Micron 2400 MTFDKBA1T0QFM | Lenovo Legion 5 Pro 16IAX10H GeForce RTX 5070 Ti Laptop, Ultra 9 275HX, Western Digital PC SN8000S SDEPNRK-1T00 | |
|---|---|---|---|---|---|---|
| Noise | -4% | -17% | -25% | 6% | -19% | |
| arrêt / environnement * (dB) | 23.7 | 23.6 -0% | 24 -1% | 25 -5% | 23 3% | 24 -1% |
| Idle Minimum * (dB) | 23.9 | 25.4 -6% | 25 -5% | 33 -38% | 23 4% | 24 -0% |
| Idle Average * (dB) | 23.9 | 27.8 -16% | 26 -9% | 34 -42% | 23 4% | 24 -0% |
| Idle Maximum * (dB) | 26.1 | 28.1 -8% | 27 -3% | 38 -46% | 29.11 -12% | 30.9 -18% |
| Load Average * (dB) | 26.8 | 28.8 -7% | 54 -101% | 46 -72% | 31 -16% | 55.9 -109% |
| Cyberpunk 2077 ultra * (dB) | 51.8 | 50.4 3% | 54 -4% | 47 9% | 36.23 30% | 56.72 -9% |
| Load Maximum * (dB) | 58 | 56.4 3% | 55 5% | 49 16% | 39.44 32% | 56.72 2% |
* ... Moindre est la valeur, meilleures sont les performances
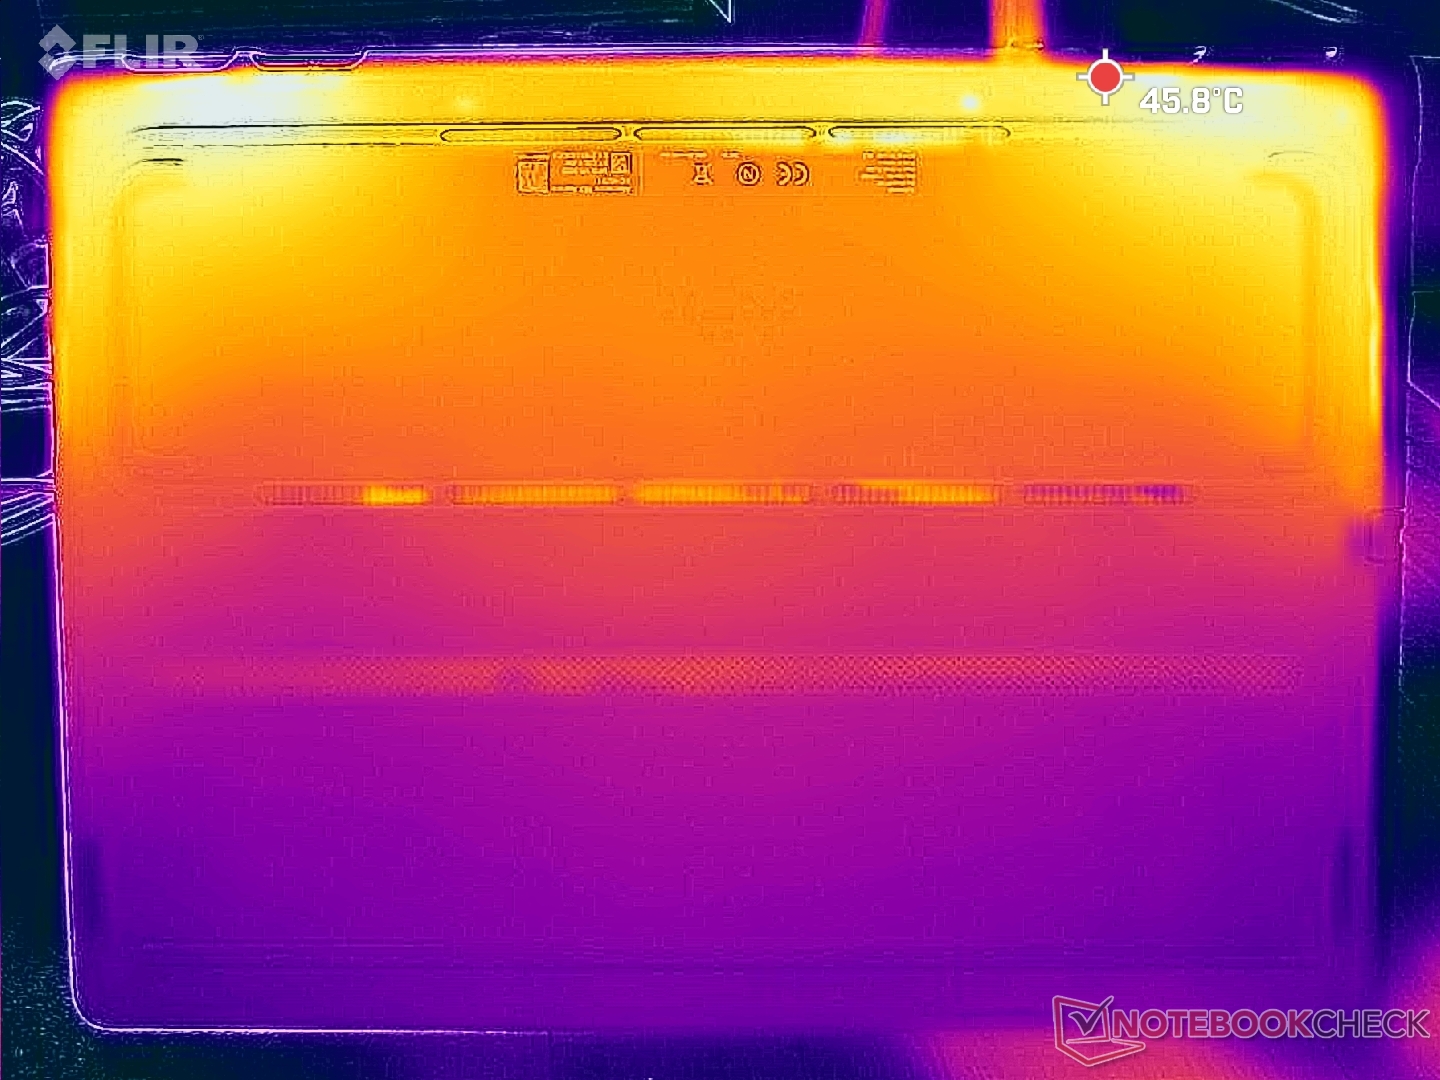
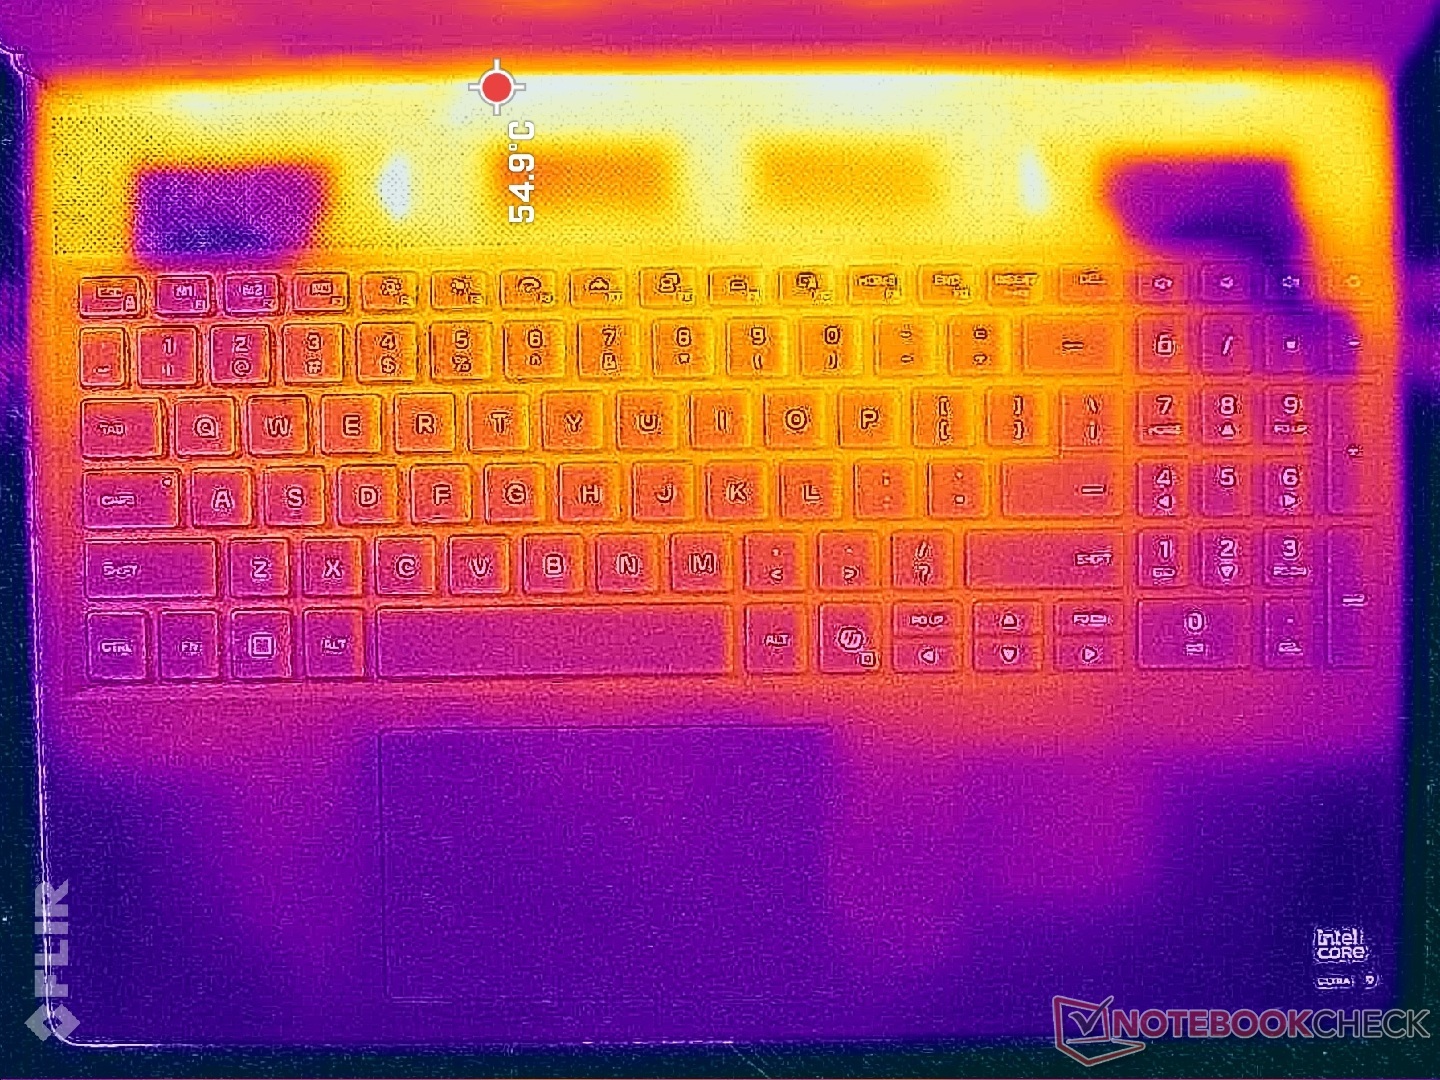
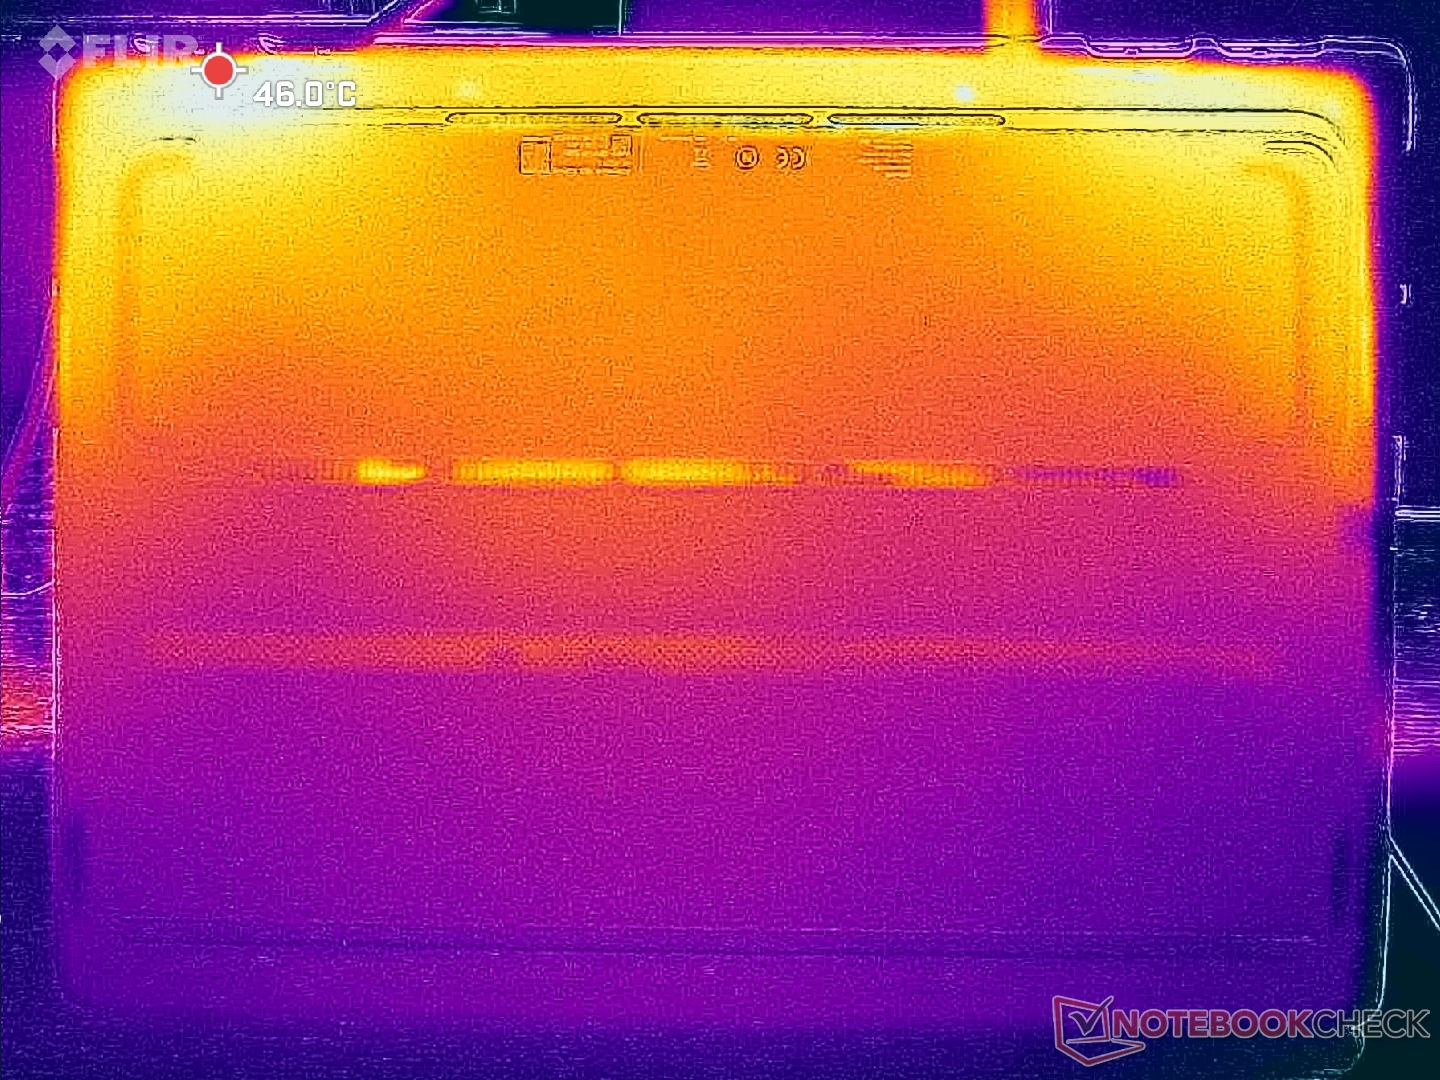
Température
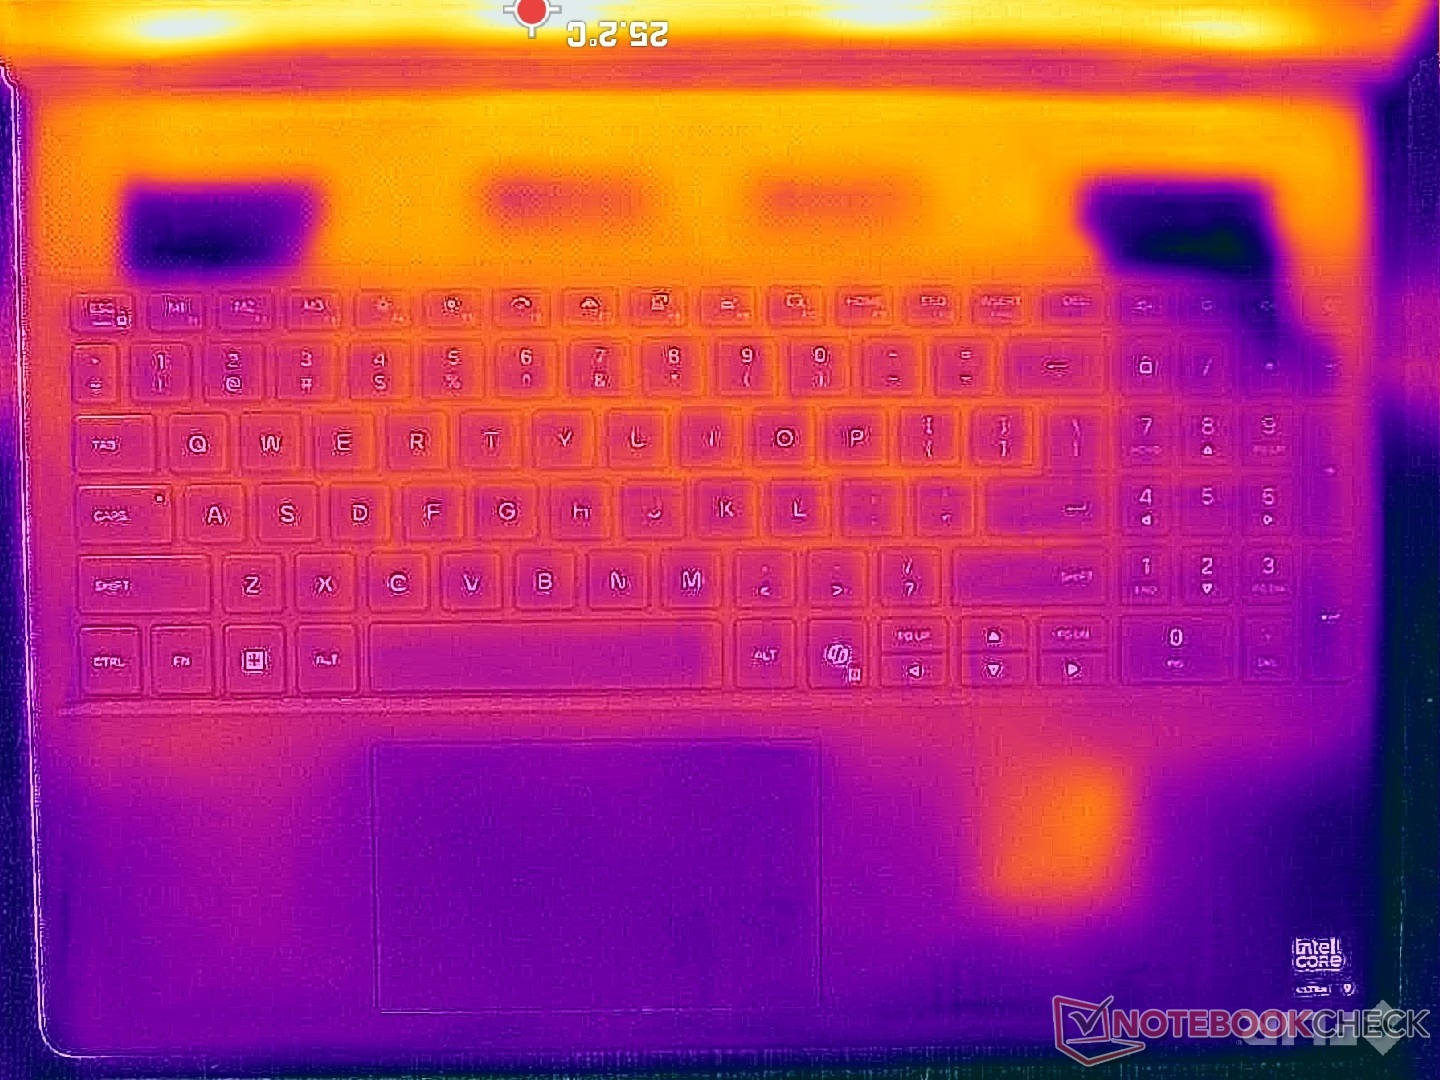
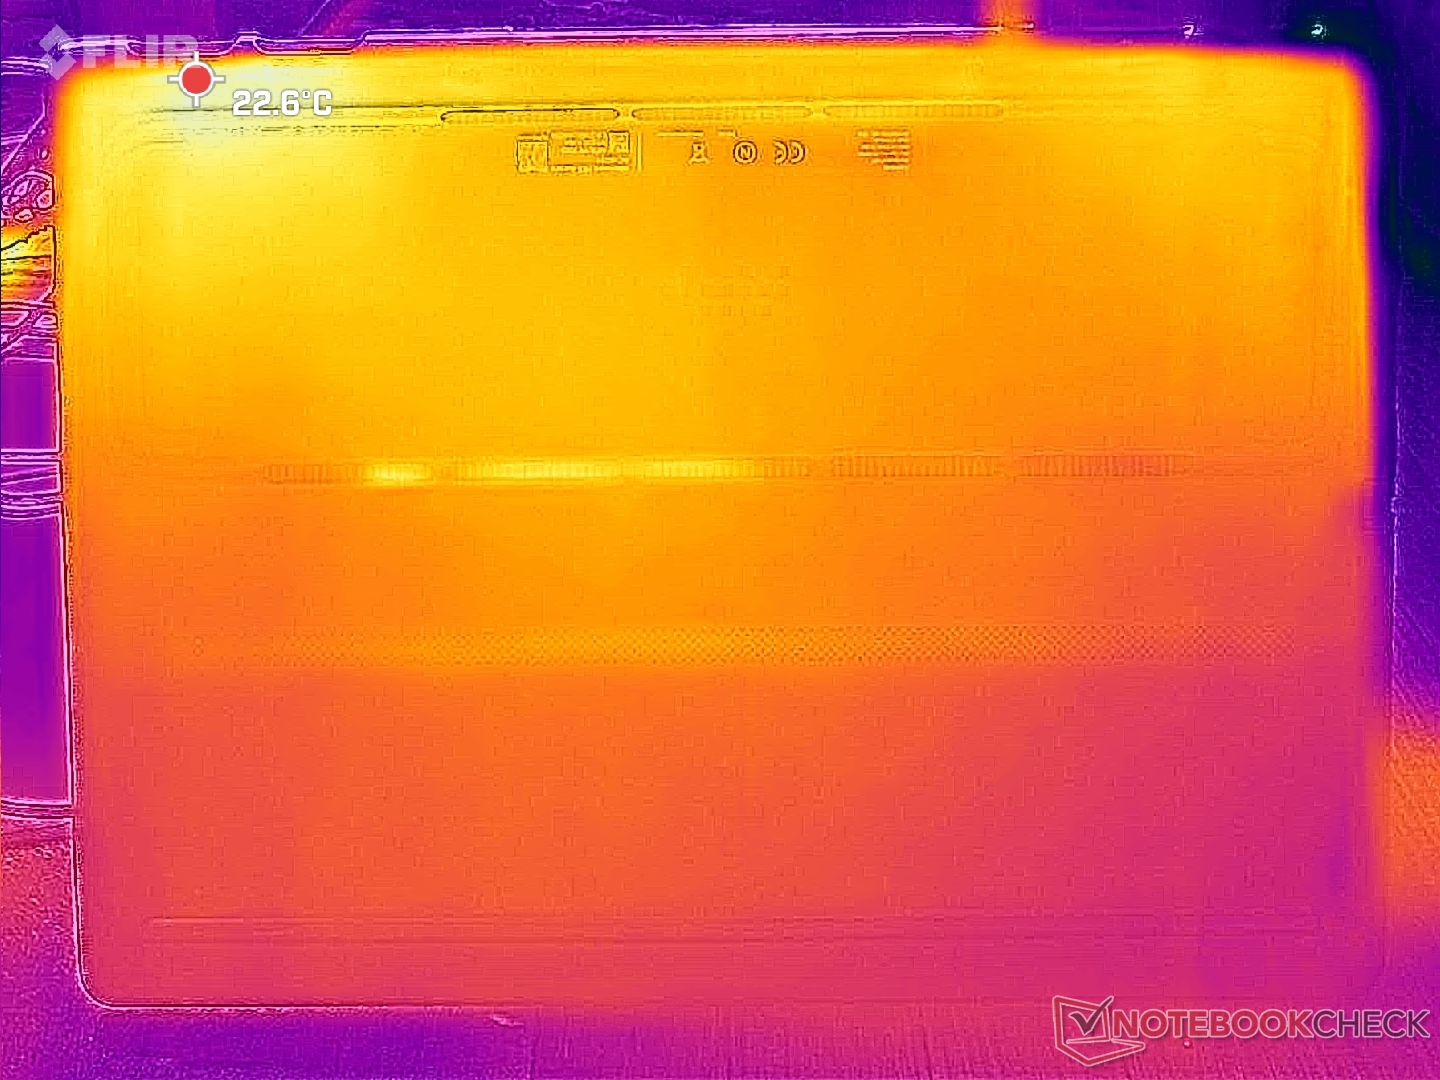
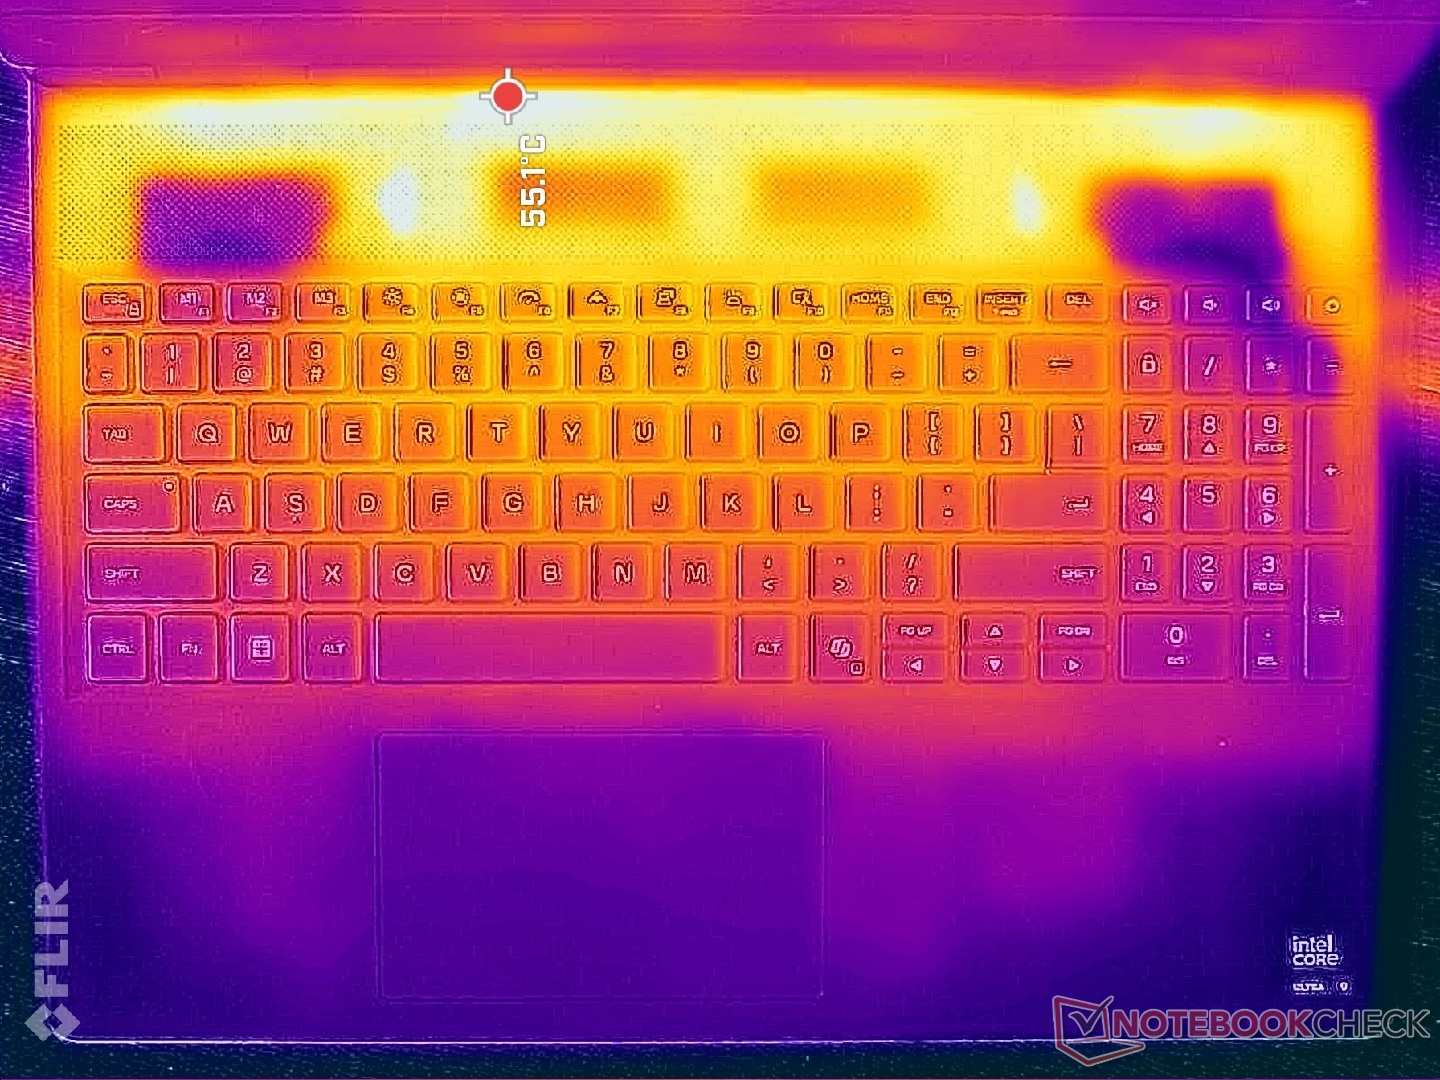
Les températures de surface peuvent être assez élevées, même avec des charges peu exigeantes. Lorsque vous jouez, les repose-paumes peuvent atteindre une température de 30°C, tandis que la majeure partie du clavier peut atteindre une température de 42°C pour des doigts et des paumes bien chauds. Bien qu'ils ne soient pas nécessairement inconfortables, les repose-paumes et les touches WASD plus froids sont certainement préférables lors des sessions de jeu plus longues. Le MSI Vector 16 HX concurrent est encore plus chaud dans des conditions similaires.
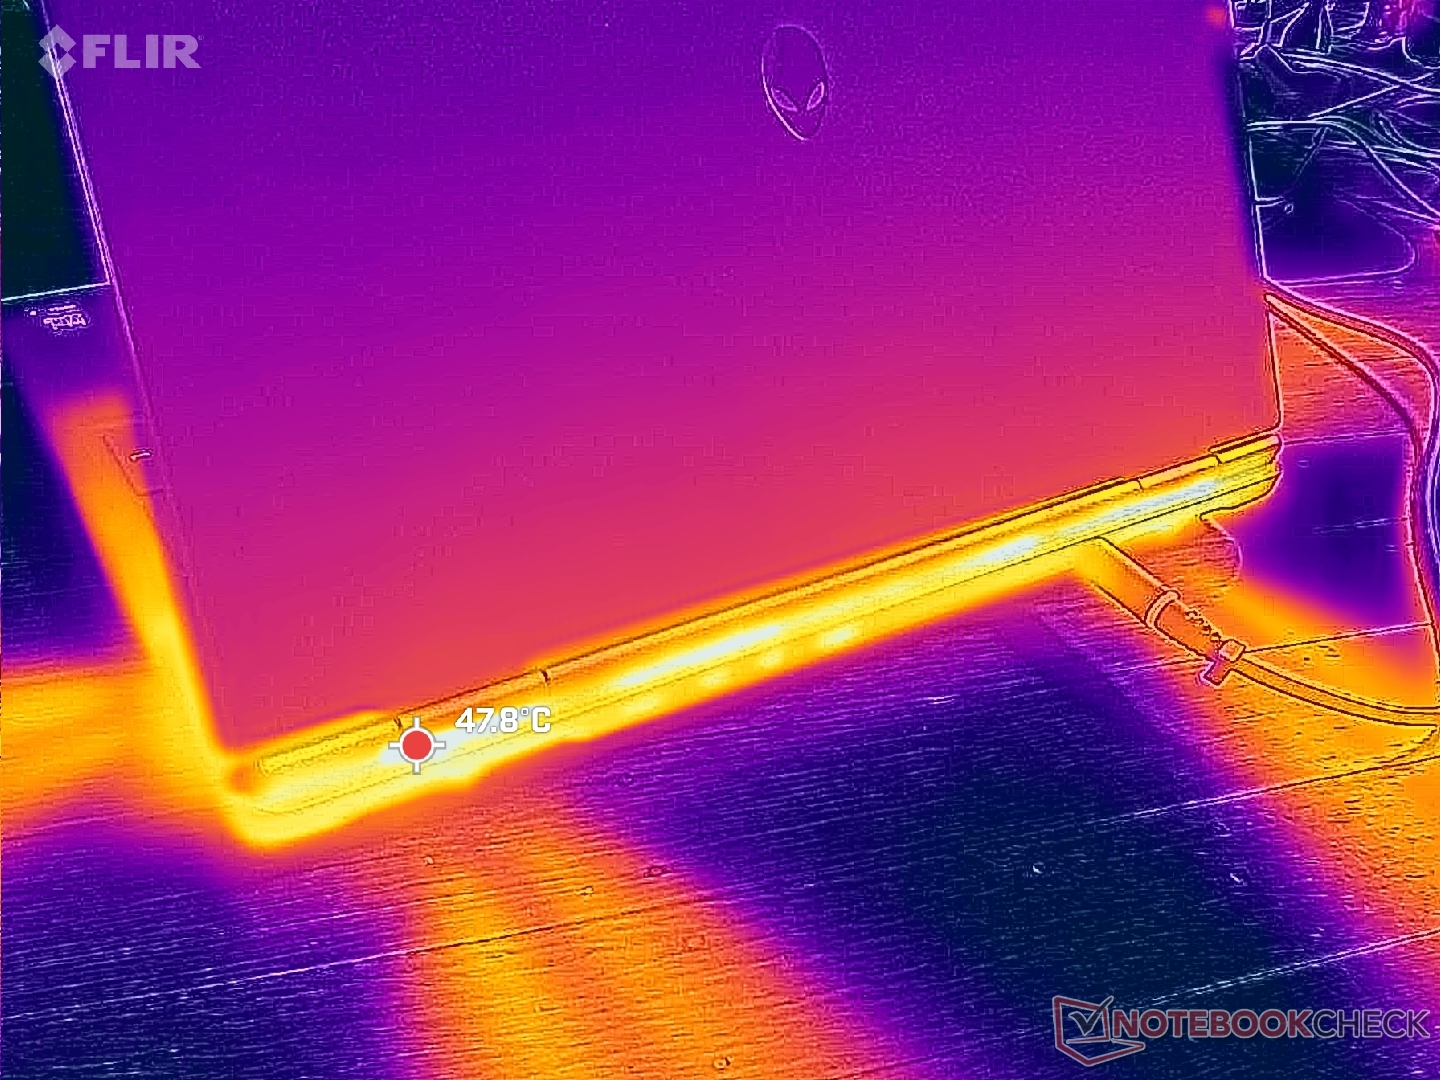
(-) La température maximale du côté supérieur est de 51 °C / 124 F, par rapport à la moyenne de 40.4 °C / 105 F, allant de 21.2 à 68.8 °C pour la classe Gaming.
(-) Le fond chauffe jusqu'à un maximum de 45.6 °C / 114 F, contre une moyenne de 43.3 °C / 110 F
(+) En utilisation inactive, la température moyenne du côté supérieur est de 27.7 °C / 82 F, par rapport à la moyenne du dispositif de 33.9 °C / 93 F.
(-) 3: The average temperature for the upper side is 41.4 °C / 107 F, compared to the average of 33.9 °C / 93 F for the class Gaming.
(+) Les repose-poignets et le pavé tactile atteignent la température maximale de la peau (33.4 °C / 92.1 F) et ne sont donc pas chauds.
(-) La température moyenne de la zone de l'appui-paume de dispositifs similaires était de 28.8 °C / 83.8 F (-4.6 °C / #-8.3 F).
| Alienware 16X Aurora, RTX 5070 Intel Core Ultra 9 275HX, NVIDIA GeForce RTX 5070 Laptop | Alienware 16 Area-51 Intel Core Ultra 9 275HX, NVIDIA GeForce RTX 5080 Laptop | Gigabyte Gaming A16 GA6H Intel Core i7-13620H, NVIDIA GeForce RTX 5070 Laptop | MSI Vector 16 HX AI A2XWHG Intel Core Ultra 7 255HX, NVIDIA GeForce RTX 5070 Ti Laptop | Asus TUF Gaming A16 FA608WV AMD Ryzen AI 9 HX 370, NVIDIA GeForce RTX 4060 Laptop GPU | Lenovo Legion 5 Pro 16IAX10H Intel Core Ultra 9 275HX, NVIDIA GeForce RTX 5070 Ti Laptop | |
|---|---|---|---|---|---|---|
| Heat | -6% | -12% | -9% | 10% | -21% | |
| Maximum Upper Side * (°C) | 51 | 43.8 14% | 50 2% | 53 -4% | 38 25% | 48 6% |
| Maximum Bottom * (°C) | 45.6 | 40 12% | 49 -7% | 52 -14% | 37 19% | 50 -10% |
| Idle Upper Side * (°C) | 29.8 | 35.8 -20% | 35 -17% | 33 -11% | 28 6% | 38 -28% |
| Idle Bottom * (°C) | 27.4 | 35.2 -28% | 34 -24% | 29 -6% | 30 -9% | 42 -53% |
* ... Moindre est la valeur, meilleures sont les performances
Haut-parleurs
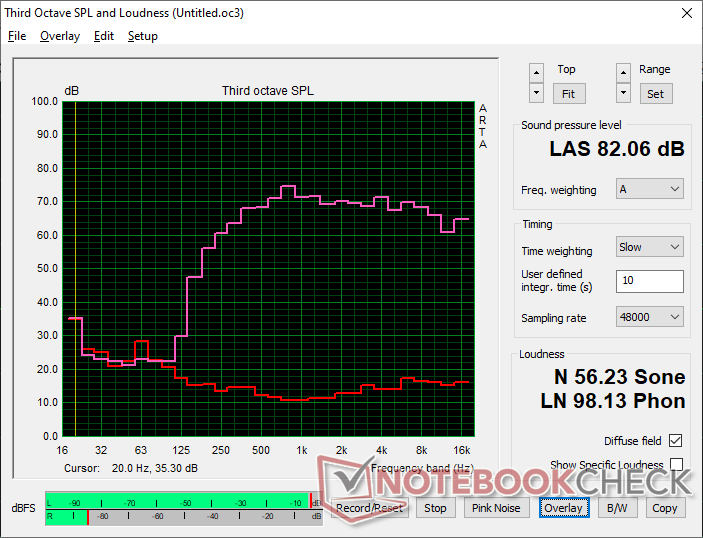
Alienware 16X Aurora, RTX 5070 analyse audio
(+) | les haut-parleurs peuvent jouer relativement fort (82.1# dB)
Basses 100 - 315 Hz
(-) | presque aucune basse - en moyenne 21.6% plus bas que la médiane
(±) | la linéarité des basses est moyenne (12.9% delta à la fréquence précédente)
Médiums 400 - 2000 Hz
(+) | médiane équilibrée - seulement 2.3% de la médiane
(+) | les médiums sont linéaires (4% delta à la fréquence précédente)
Aiguës 2 - 16 kHz
(+) | des sommets équilibrés - à seulement 1.3% de la médiane
(+) | les aigus sont linéaires (3.7% delta à la fréquence précédente)
Globalement 100 - 16 000 Hz
(+) | le son global est linéaire (14.5% différence à la médiane)
Par rapport à la même classe
» 27% de tous les appareils testés de cette catégorie étaient meilleurs, 7% similaires, 66% pires
» Le meilleur avait un delta de 6%, la moyenne était de 18%, le pire était de 132%.
Par rapport à tous les appareils testés
» 18% de tous les appareils testés étaient meilleurs, 4% similaires, 78% pires
» Le meilleur avait un delta de 4%, la moyenne était de 24%, le pire était de 134%.
Apple MacBook Pro 16 2021 M1 Pro analyse audio
(+) | les haut-parleurs peuvent jouer relativement fort (84.7# dB)
Basses 100 - 315 Hz
(+) | bonne basse - seulement 3.8% loin de la médiane
(+) | les basses sont linéaires (5.2% delta à la fréquence précédente)
Médiums 400 - 2000 Hz
(+) | médiane équilibrée - seulement 1.3% de la médiane
(+) | les médiums sont linéaires (2.1% delta à la fréquence précédente)
Aiguës 2 - 16 kHz
(+) | des sommets équilibrés - à seulement 1.9% de la médiane
(+) | les aigus sont linéaires (2.7% delta à la fréquence précédente)
Globalement 100 - 16 000 Hz
(+) | le son global est linéaire (4.6% différence à la médiane)
Par rapport à la même classe
» 0% de tous les appareils testés de cette catégorie étaient meilleurs, 0% similaires, 100% pires
» Le meilleur avait un delta de 5%, la moyenne était de 17%, le pire était de 45%.
Par rapport à tous les appareils testés
» 0% de tous les appareils testés étaient meilleurs, 0% similaires, 100% pires
» Le meilleur avait un delta de 4%, la moyenne était de 24%, le pire était de 134%.
Gestion de l'énergie
Consommation électrique
La marche au ralenti sur l'ordinateur de bureau demande entre 20 et 32 W selon la luminosité et le réglage du profil d'alimentation. Ces minima sont plus élevés que sur de nombreux ordinateurs portables de jeu concurrents, mais restent en ligne avec la plupart des autres modèles Alienware.
Cyberpunk 2077 demande 192 W, soit 11 % de moins que le MSI Vector 16 HX avec la carte graphique RTX 5070 Ti. Si l'on considère que la RTX 5070 Ti peut être 25 à 30 % plus rapide que notre RTX 5070, la performance par watt de notre configuration Aurora 16X n'est pas aussi bonne que nous l'espérions.
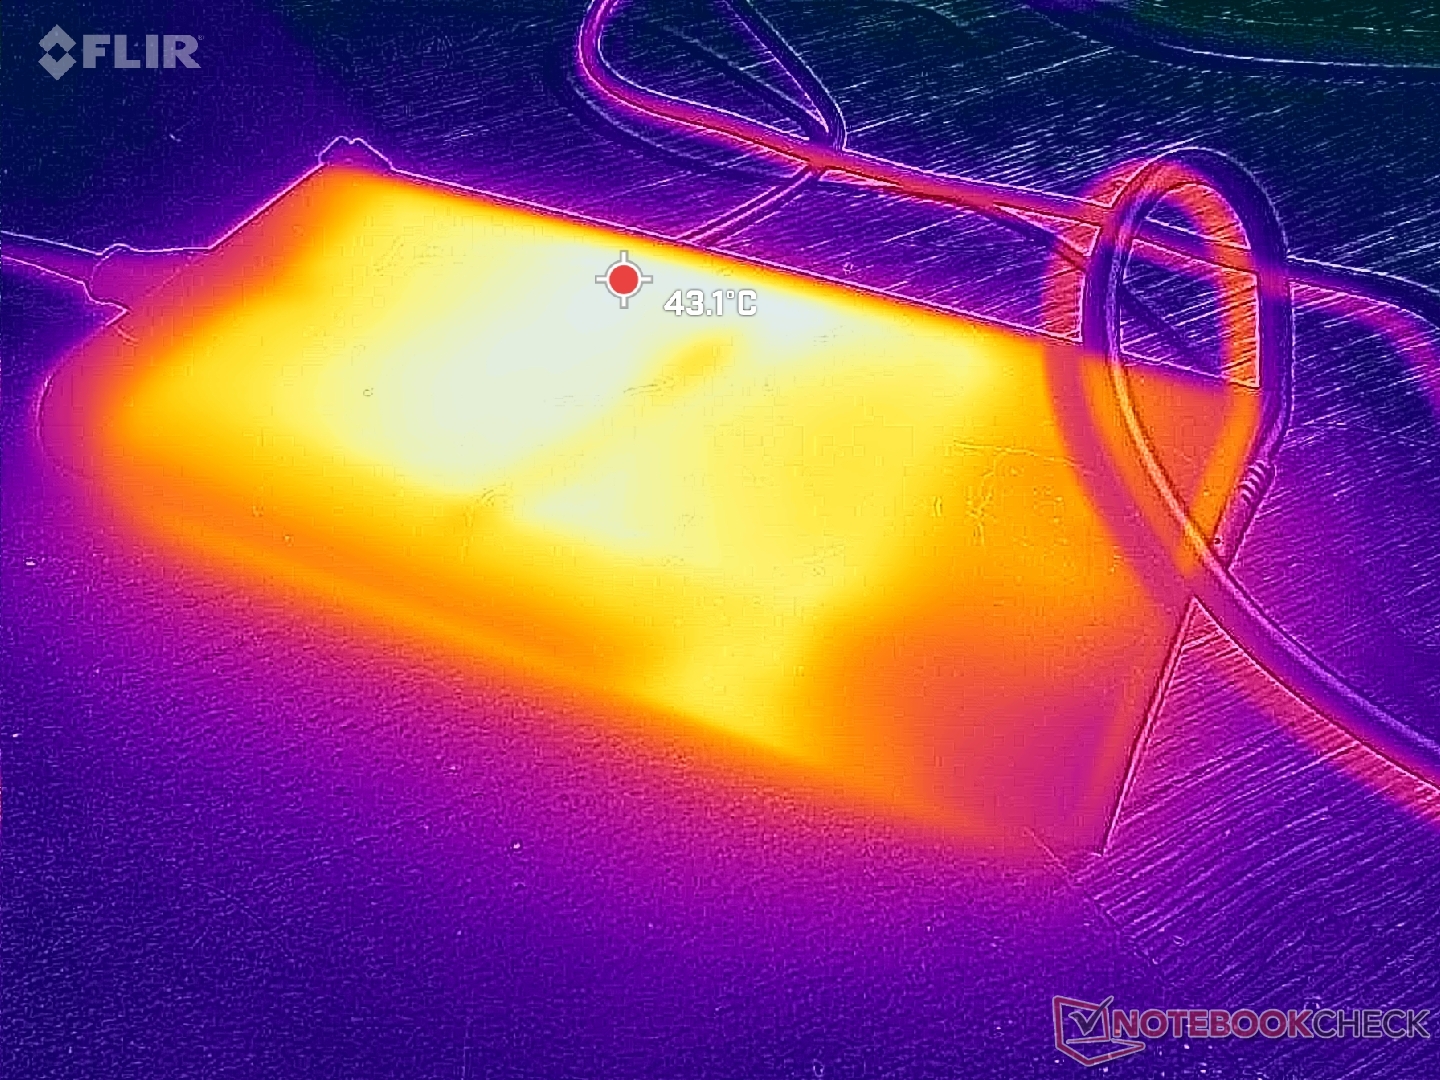
Nous avons pu enregistrer une consommation maximale temporaire de 292 W à partir de l'adaptateur secteur 280 W relativement grand (~20,5 x 10,5 x 2,5 cm) lorsque le CPU et le GPU sont tous deux utilisés à 100 %.
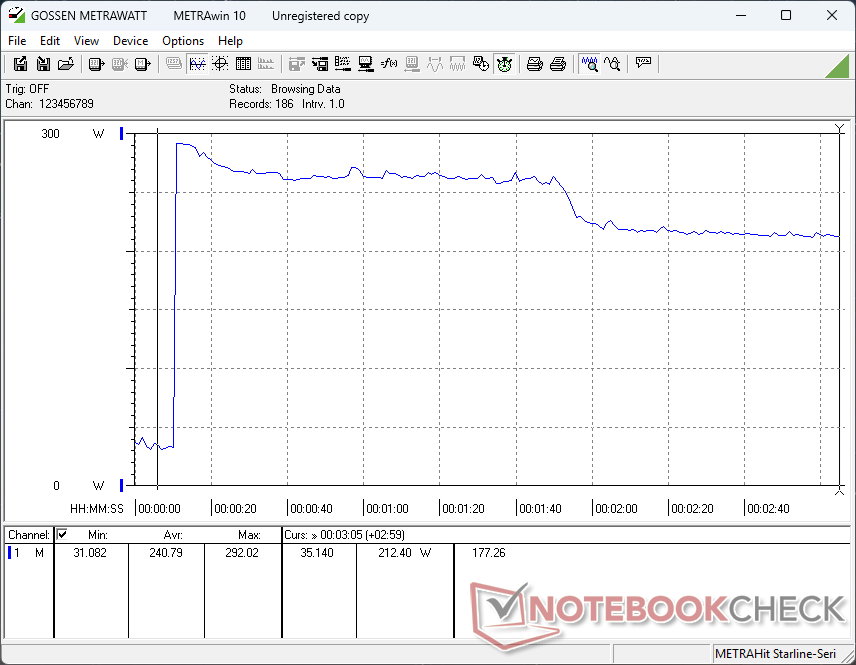
| Éteint/en veille | |
| Au repos | |
| Fortement sollicité |
|
Légende:
min: | |
| Alienware 16X Aurora, RTX 5070 Ultra 9 275HX, GeForce RTX 5070 Laptop, , IPS, 2560x1600, 16" | Alienware 16 Area-51 Ultra 9 275HX, GeForce RTX 5080 Laptop, Samsung PM9C1a MZ9L81T0HDLB, IPS, 2560x1600, 16" | Gigabyte Gaming A16 GA6H i7-13620H, GeForce RTX 5070 Laptop, Kingston OM8PGP41024Q-A0, IPS, 2560x1600, 16" | MSI Vector 16 HX AI A2XWHG Ultra 7 255HX, GeForce RTX 5070 Ti Laptop, Micron 2400 MTFDKBA512QFM, IPS, 2560x1600, 16" | Asus TUF Gaming A16 FA608WV Ryzen AI 9 HX 370, GeForce RTX 4060 Laptop GPU, Micron 2400 MTFDKBA1T0QFM, IPS, 1920x1200, 16" | Lenovo Legion 5 Pro 16IAX10H Ultra 9 275HX, GeForce RTX 5070 Ti Laptop, Western Digital PC SN8000S SDEPNRK-1T00, OLED, 2560x1600, 16" | |
|---|---|---|---|---|---|---|
| Power Consumption | -26% | 39% | 9% | 40% | -1% | |
| Idle Minimum * (Watt) | 20.1 | 27 -34% | 9 55% | 7.1 65% | 6.8 66% | 14 30% |
| Idle Average * (Watt) | 27.6 | 33.5 -21% | 11 60% | 15.9 42% | 12.7 54% | 14.3 48% |
| Idle Maximum * (Watt) | 31.8 | 41.4 -30% | 23 28% | 29.5 7% | 15.2 52% | 20.1 37% |
| Load Average * (Watt) | 102.7 | 124.7 -21% | 91 11% | 124 -21% | 85 17% | 177 -72% |
| Cyberpunk 2077 ultra external monitor * (Watt) | 192.3 | 249 -29% | 130 32% | 217 -13% | 143 26% | 255 -33% |
| Cyberpunk 2077 ultra * (Watt) | 217 | 256 -18% | 132.5 39% | 222 -2% | 145 33% | 255 -18% |
| Load Maximum * (Watt) | 292 | 367.2 -26% | 155 47% | 336 -15% | 199 32% | 294 -1% |
* ... Moindre est la valeur, meilleures sont les performances
Consommation électrique Cyberpunk / Stress Test
Consommation électrique du moniteur externe
Autonomie de la batterie
La capacité de la batterie est la même que celle de l'Alienware 15 Area-51, malgré l'attrait plus économique de l'Aurora 16X. Les durées d'utilisation restent néanmoins médiocres ou moyennes au mieux avec seulement 4 heures de navigation WLAN dans le monde réel sur le profil d'alimentation équilibré.
Le chargement de l'adaptateur secteur inclus prend près de 2,5 heures.
| Alienware 16X Aurora, RTX 5070 Ultra 9 275HX, GeForce RTX 5070 Laptop, 96 Wh | Alienware 16 Area-51 Ultra 9 275HX, GeForce RTX 5080 Laptop, 96 Wh | Gigabyte Gaming A16 GA6H i7-13620H, GeForce RTX 5070 Laptop, 76 Wh | MSI Vector 16 HX AI A2XWHG Ultra 7 255HX, GeForce RTX 5070 Ti Laptop, 90 Wh | Asus TUF Gaming A16 FA608WV Ryzen AI 9 HX 370, GeForce RTX 4060 Laptop GPU, 90 Wh | Lenovo Legion 5 Pro 16IAX10H Ultra 9 275HX, GeForce RTX 5070 Ti Laptop, 80 Wh | |
|---|---|---|---|---|---|---|
| Autonomie de la batterie | -35% | 79% | 63% | 230% | 14% | |
| WiFi v1.3 (h) | 4.3 | 2.8 -35% | 7.7 79% | 7 63% | 14.2 230% | 4.9 14% |
| Reader / Idle (h) | 3.1 | |||||
| H.264 (h) | 14.7 | 4.8 | ||||
| Load (h) | 2.1 | 1.7 |
Notebookcheck Rating
Alienware 16X Aurora, RTX 5070
- 08/13/2025 v8
Allen Ngo
 Total Sustainability Score:
 Comparaison avec des concurrents potentiels
Image | Modèle | Prix | Poids | Épaisseur | Écran |
|---|---|---|---|---|---|
1. 84.9%  | Alienware 16X Aurora, RTX 5070 Intel Core Ultra 9 275HX ⎘ NVIDIA GeForce RTX 5070 Laptop ⎘ 32 Go Mémoire | Amazon: Prix de liste: 1800 USD | 2.5 kg | 23.4 mm | 16.00" 2560x1600 189 PPI IPS |
2. 85.7%  | Alienware 16 Area-51 Intel Core Ultra 9 275HX ⎘ NVIDIA GeForce RTX 5080 Laptop ⎘ 32 Go Mémoire, 1024 Go SSD | Amazon: 1. $2,358.00 Alienware 16 Area-51 Gaming ... 2. $2,581.99 Alienware 16 Area-51 AA16250... 3. $3,309.99 Alienware 16 Area-51 AA16250... Prix de liste: 3500 USD | 3.3 kg | 28.5 mm | 16.00" 2560x1600 189 PPI IPS |
3. 80.1%  | Gigabyte Gaming A16 GA6H Intel Core i7-13620H ⎘ NVIDIA GeForce RTX 5070 Laptop ⎘ 16 Go Mémoire, 1024 Go SSD | Amazon: 1. $1,285.71 GIGABYTE - Gaming A16 Gaming... 2. $1,349.99 GIGABYTE - Gaming A16 Gaming... 3. $920.13 GIGABYTE - Gaming A16 Gaming... Prix de liste: 1700 EUR | 2.3 kg | 23 mm | 16.00" 2560x1600 189 PPI IPS |
4. 84%  | MSI Vector 16 HX AI A2XWHG Intel Core Ultra 7 255HX ⎘ NVIDIA GeForce RTX 5070 Ti Laptop ⎘ 16 Go Mémoire, 512 Go SSD | Amazon: Prix de liste: 2000 EUR | 2.6 kg | 28.6 mm | 16.00" 2560x1600 189 PPI IPS |
5. 83%  | Asus TUF Gaming A16 FA608WV AMD Ryzen AI 9 HX 370 ⎘ NVIDIA GeForce RTX 4060 Laptop GPU ⎘ 16 Go Mémoire, 1024 Go SSD | Amazon: Prix de liste: 1399 Euro | 2.2 kg | 25.7 mm | 16.00" 1920x1200 142 PPI IPS |
6. 84.5%  | Lenovo Legion 5 Pro 16IAX10H Intel Core Ultra 9 275HX ⎘ NVIDIA GeForce RTX 5070 Ti Laptop ⎘ 32 Go Mémoire, 1024 Go SSD | Amazon: 1. $2,333.00 Lenovo Legion Pro 7 16IAX10H... 2. $1,549.00 Lenovo Legion 5 Pro Gaming A... 3. $1,699.99 Lenovo Legion 5 Pro 5i Gen 1... Prix de liste: 2500 Euro | 2.4 kg | 25.95 mm | 16.00" 2560x1600 189 PPI OLED |
Transparency
La sélection des appareils à examiner est effectuée par notre équipe éditoriale. L'échantillon de test a été prêté à l'auteur par le fabricant ou le détaillant pour les besoins de cet examen. Le prêteur n'a pas eu d'influence sur cette évaluation et le fabricant n'a pas reçu de copie de cette évaluation avant sa publication. Il n'y avait aucune obligation de publier cet article. En tant que média indépendant, Notebookcheck n'est pas soumis à l'autorité des fabricants, des détaillants ou des éditeurs.
Voici comment Notebookcheck teste
Chaque année, Notebookcheck examine de manière indépendante des centaines d'ordinateurs portables et de smartphones en utilisant des procédures standardisées afin de garantir que tous les résultats sont comparables. Nous avons continuellement développé nos méthodes de test depuis environ 20 ans et avons établi des normes industrielles dans le processus. Dans nos laboratoires de test, des équipements de mesure de haute qualité sont utilisés par des techniciens et des rédacteurs expérimentés. Ces tests impliquent un processus de validation en plusieurs étapes. Notre système d'évaluation complexe repose sur des centaines de mesures et de points de référence bien fondés, ce qui garantit l'objectivité.
