Verdict - Plus vert et plus léger que jamais
Le processeur Core Ultra X7 et le GPU Arc B390 sont jusqu'à 70 % et 150 % plus rapides que les options Core Ultra 5 ou Ultra 7, respectivement décevantes, sans qu'il soit nécessaire de les réchauffer. Cette configuration haut de gamme coûte 400 $ de plus à l'heure où nous écrivons ces lignes, mais elle double la mémoire vive (de 16 à 32 Go) et la capacité de stockage (de 512 Go à 1 To), ce qui en fait un choix intéressant, en particulier pour les éditeurs graphiques ou les créateurs de contenu.
Pour encore plus de puissance mais moins d'efficacité, les utilisateurs peuvent se tourner vers le Dell 16 Premium de l'année dernière, équipé d'un processeur Arrow Lake Dell 16 Premium de l'année dernière, qui peut offrir des performances multithread 20 % plus rapides et des performances graphiques 60 % plus rapides que même la configuration haut de gamme 2026 XPS 16. Gardez à l'esprit que l'ancien modèle Dell 16 Premium est plus épais et plus lourd pour accueillir le GPU Nvidia.
Le comportement d'étranglement observé suggère que le CPU aurait pu bénéficier d'une solution de refroidissement plus puissante. La température du cœur peut atteindre 100°C lorsqu'il est sollicité, avant de réduire la fréquence d'horloge pour maintenir la température sous contrôle. Le concurrent Asus ExpertBook Ultra concurrent est capable de maintenir des fréquences d'horloge plus élevées avec le même processeur Panther Lake X7 pour des performances supérieures à celles de notre Dell.
En revanche, la luxueuse dalle OLED coûte 150 $ de plus que les 400 $ mentionnés ci-dessus. La mise à niveau de l'écran est moins recommandée que celle du processeur Core Ultra X7, car l'écran IPS de base est déjà très performant en termes de couleurs, de rapport de contraste et de taux de rafraîchissement. Pour le niveau d'édition et de multimédia visé par le CPU et le GPU, l'écran IPS devrait suffire à la plupart des utilisateurs disposant d'un budget plus serré.
Points positifs
Points négatifs
Prix et disponibilité
La configuration examinée, avec le Core Ultra X7 et l'écran tactile OLED 3,2K, est vendue au prix de 2350 $ directement par Dell.
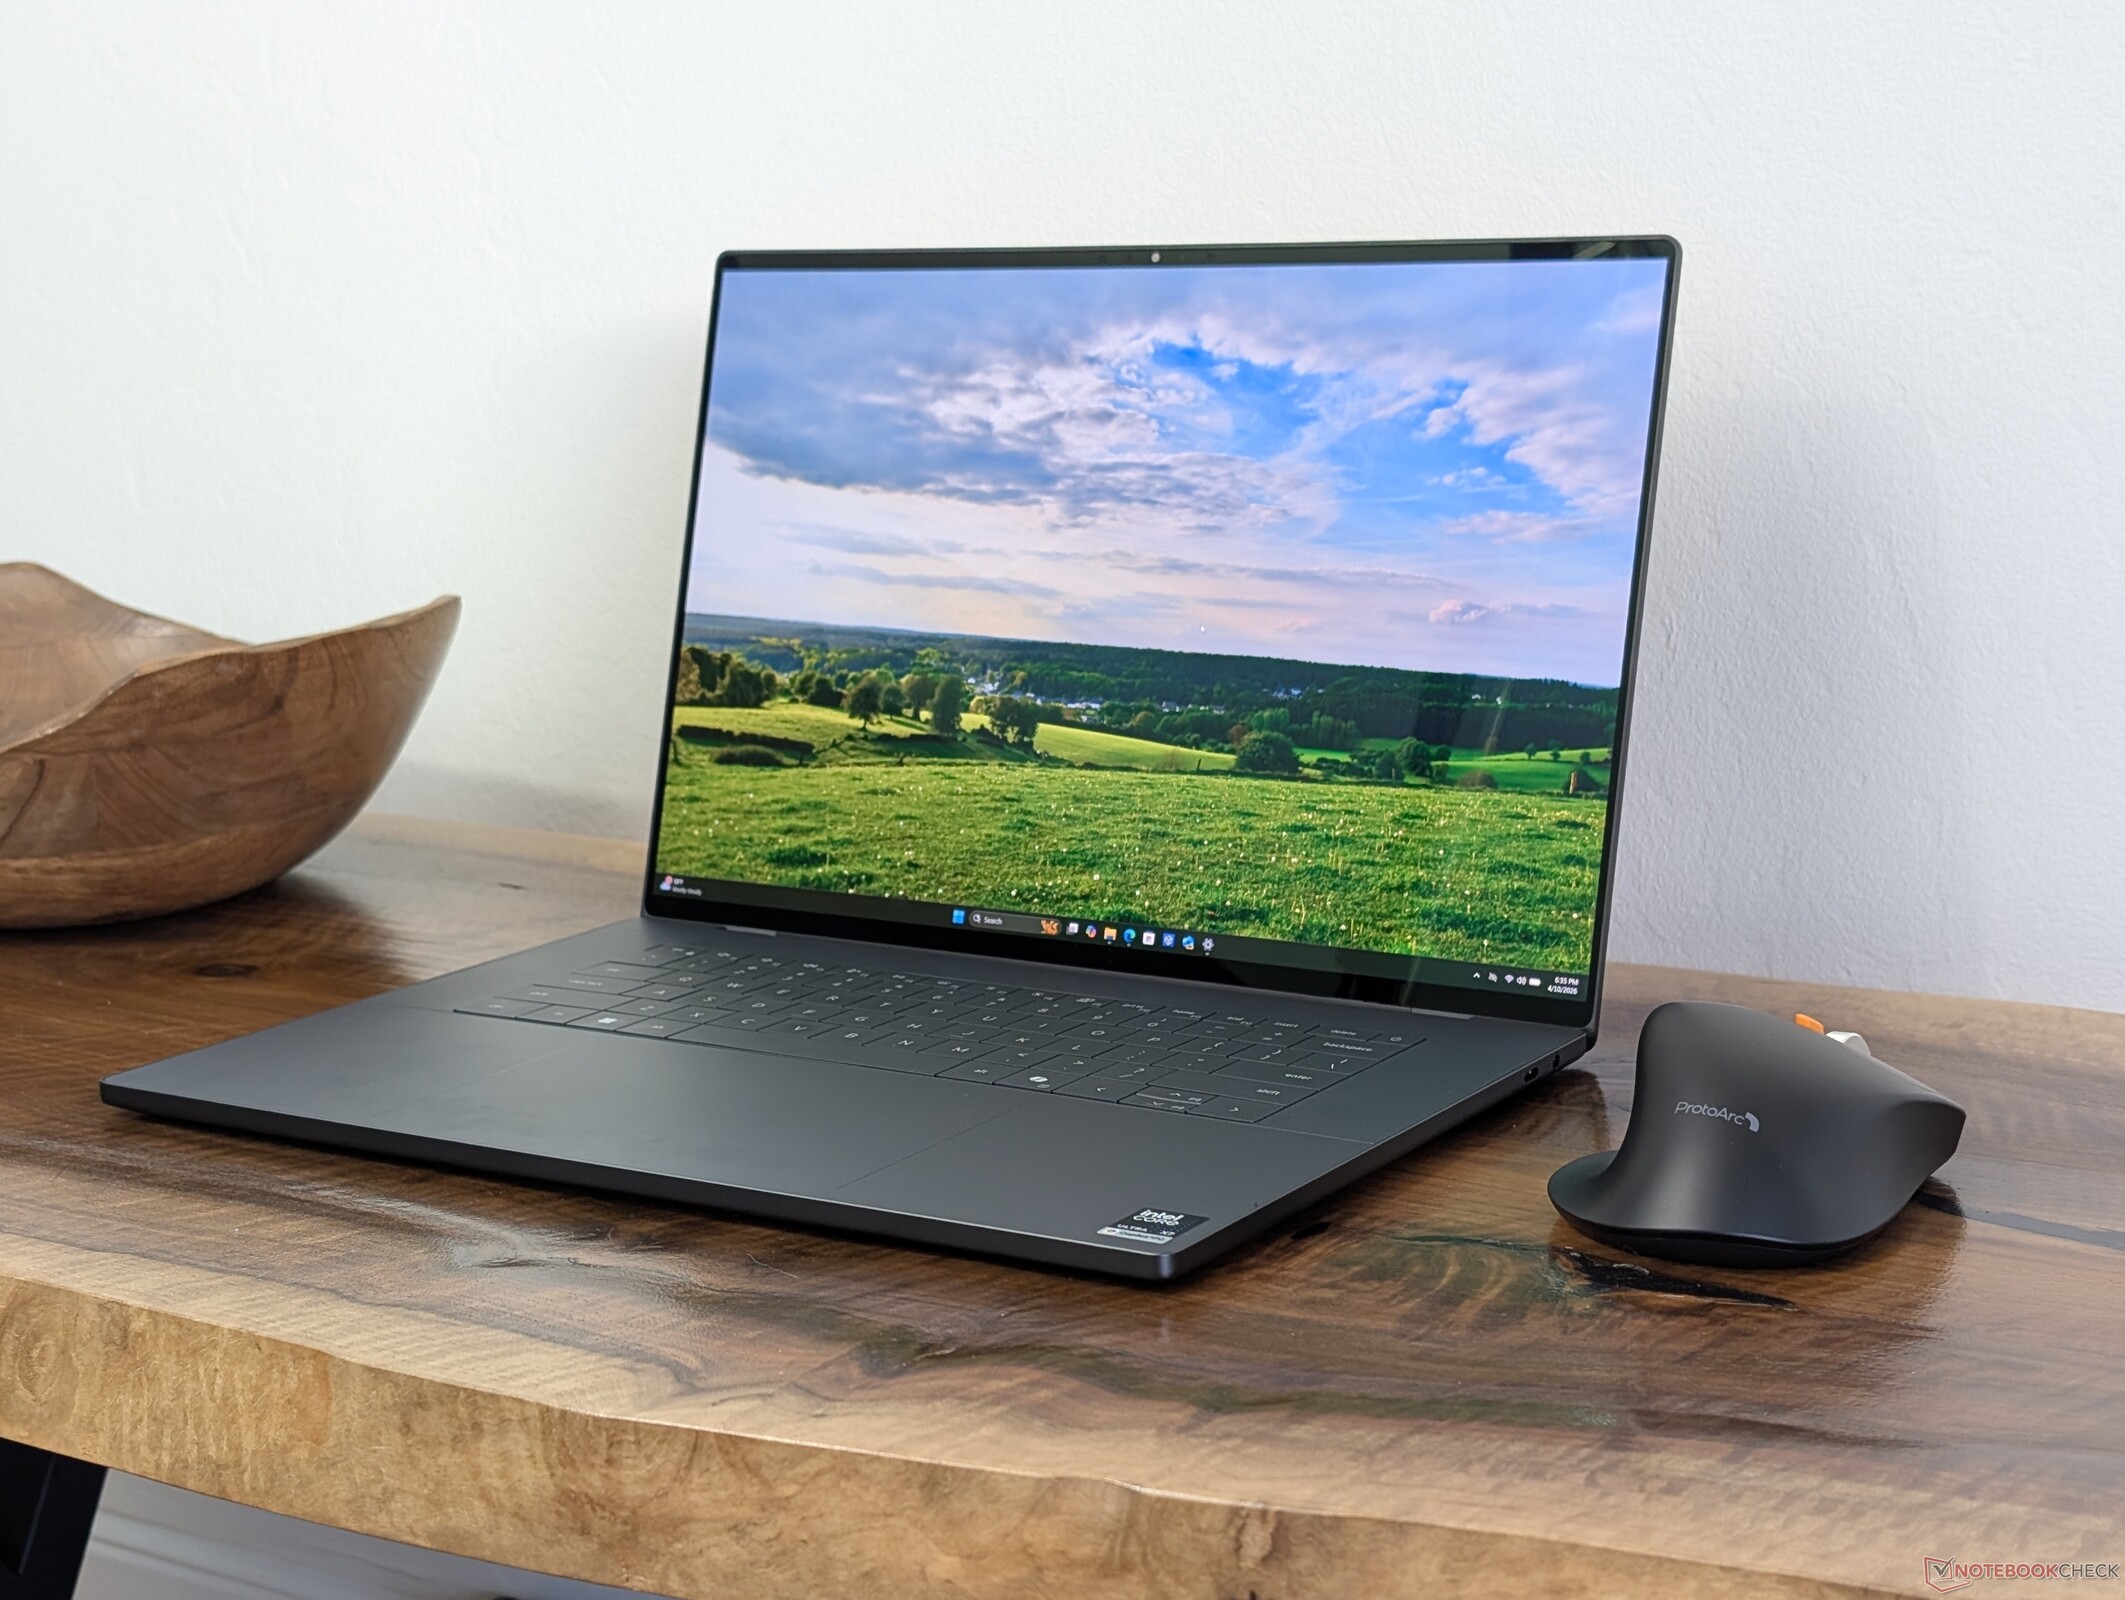
Après avoir récemment testé la configuration configuration de base Core Ultra 5 325 IPS du nouveau XPS 16, nous sommes maintenant prêts à nous attaquer à la configuration Core Ultra X7 358H OLED pour voir quels types d'améliorations et d'avantages l'option la plus coûteuse apporte à la table. Le modèle haut de gamme vaut-il la peine d'être acheté 500 à 600 dollars de plus ?
Tous nos commentaires sur les caractéristiques physiques du nouveau XPS 16 2026 se trouvent ici. Cette page se concentre plutôt sur les différences auxquelles les utilisateurs peuvent s'attendre lorsqu'ils choisissent entre les configurations Core Ultra 5 ou Core Ultra X7 du modèle.
Plus d'avis Dell :
Spécifications
Cas
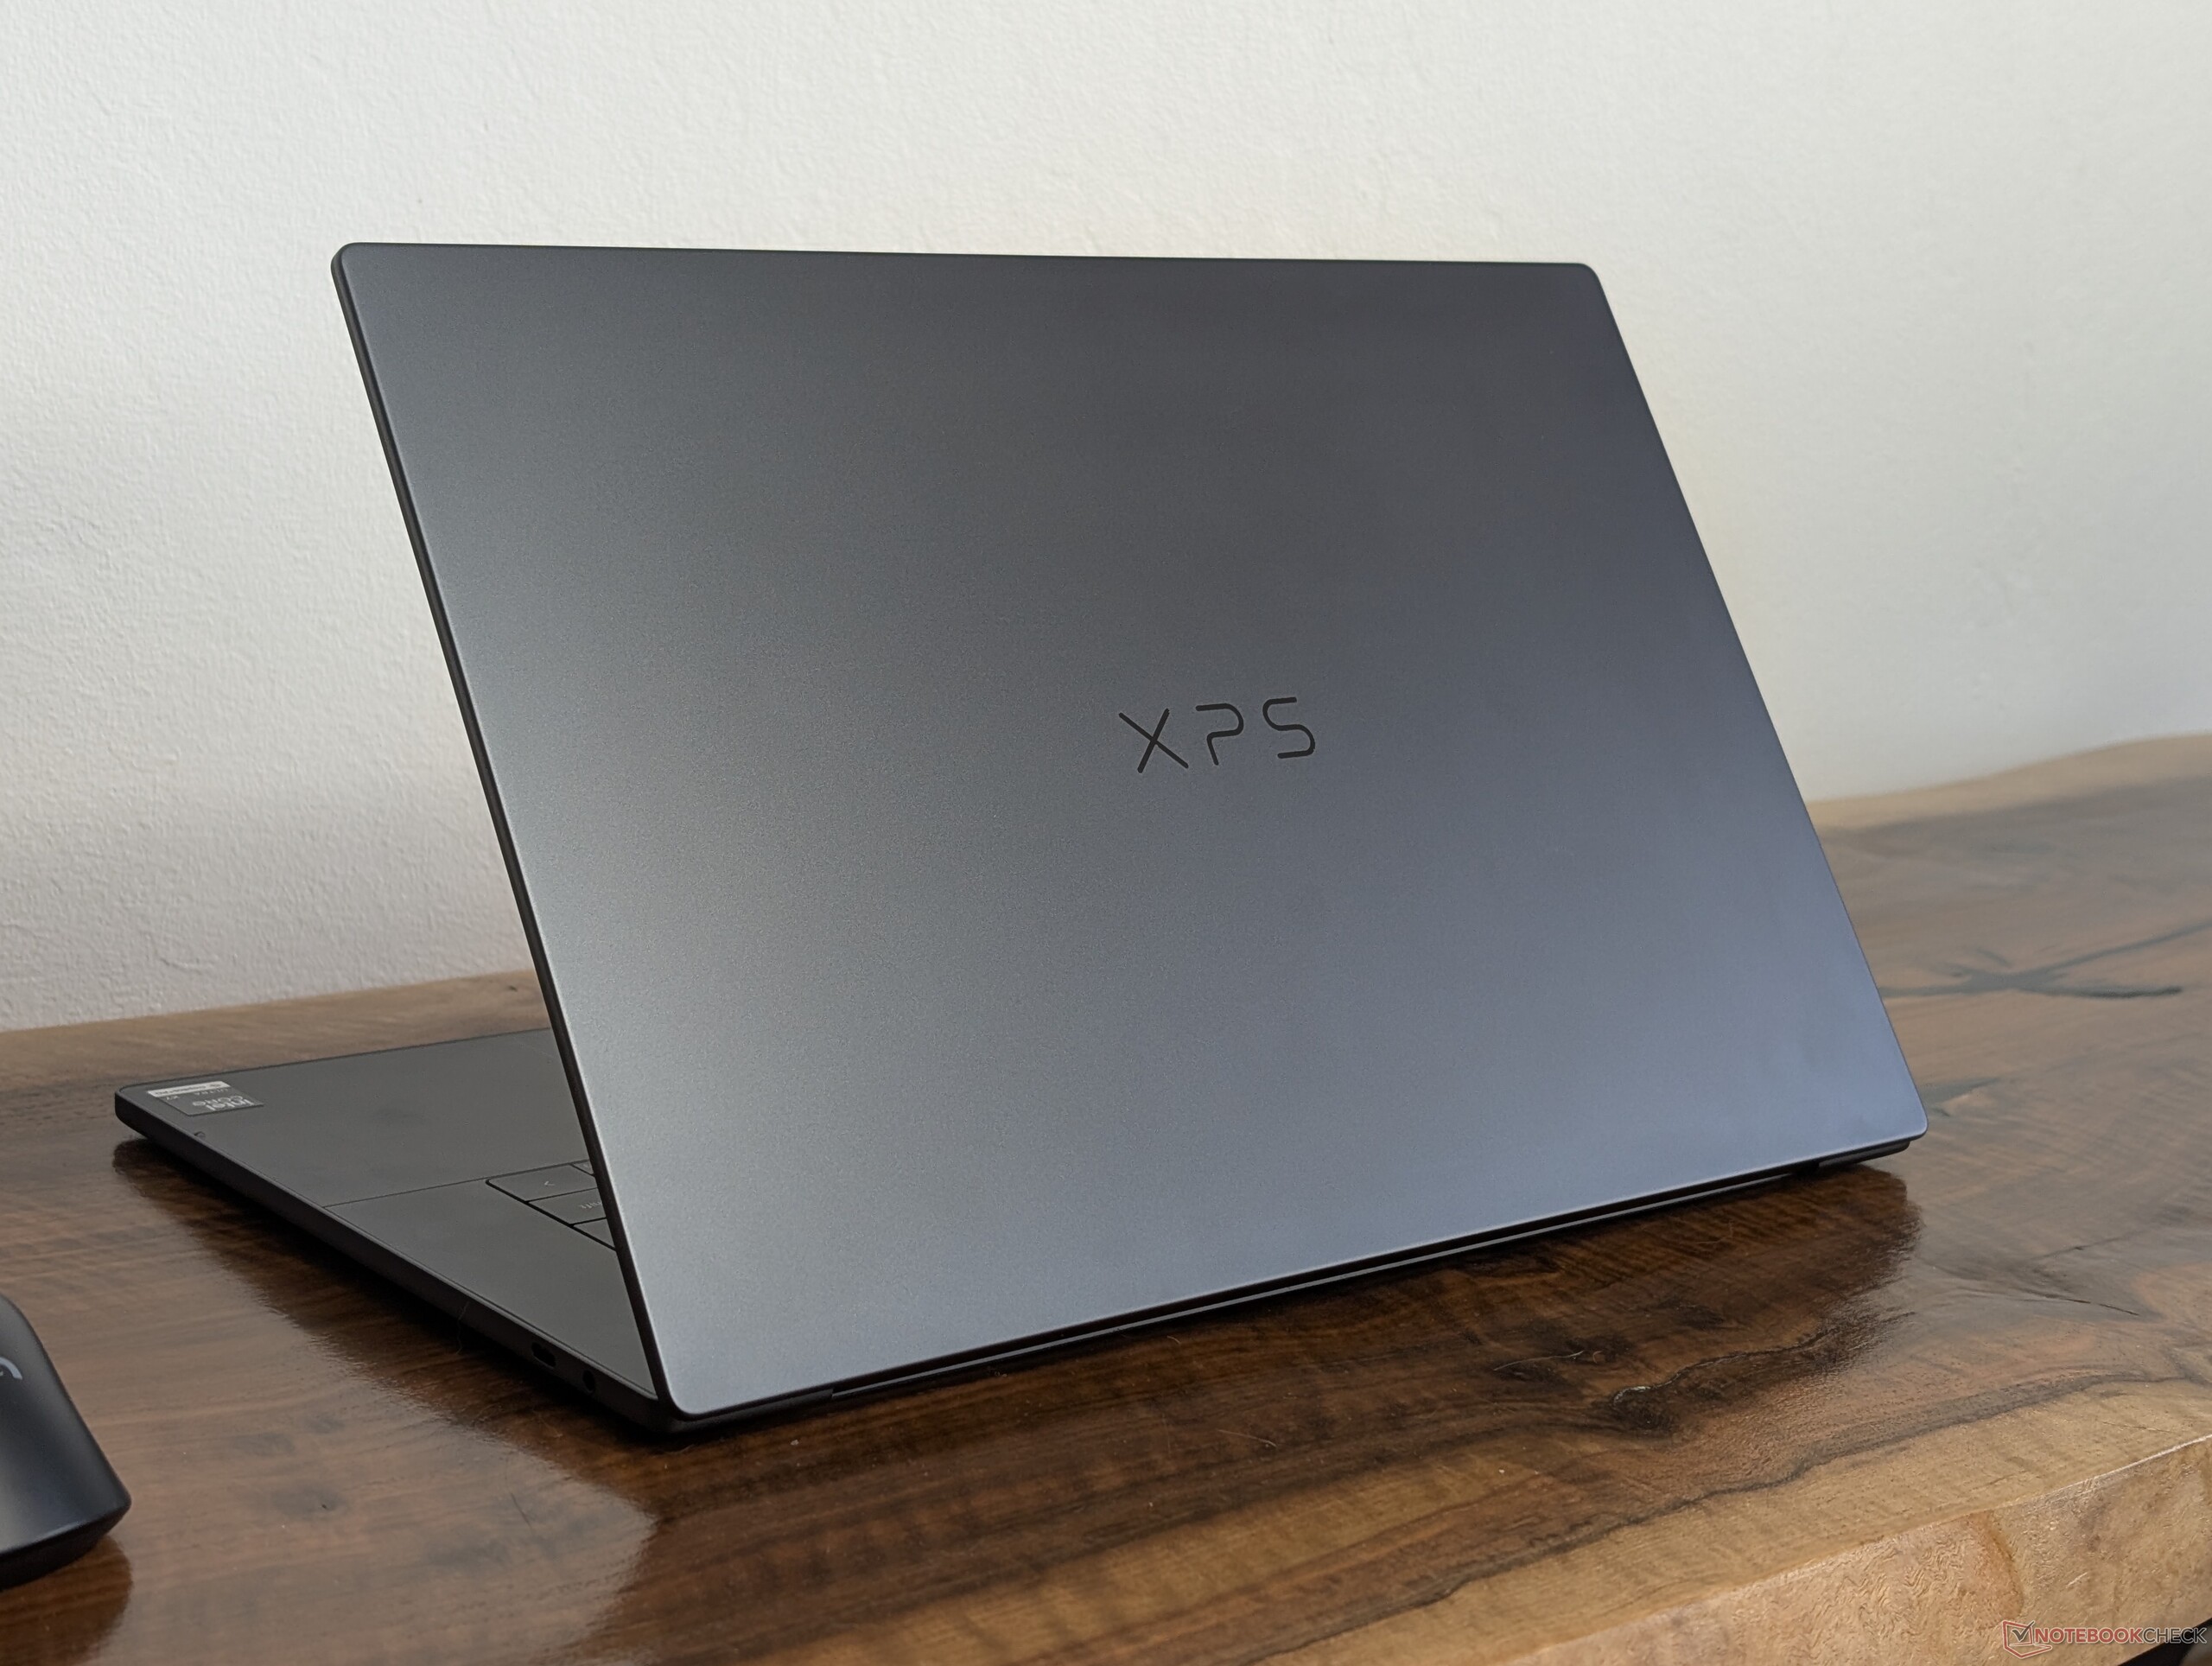
La configuration OLED est légèrement plus fine et plus légère que la configuration IPS, de près de 1 mm et 100 g, respectivement. Les deux options sont par ailleurs identiques.
Connectivité


Communication
Webcam


Maintenance

Durabilité
Le nouveau XPS 16 utilise plus de matériaux recyclés que la plupart des autres modèles de la gamme actuelle de Dell. Le châssis est composé de 25 à 75 % d'aluminium recyclé, de 10 % de verre recyclé pour l'écran tactile OLED, de 50 % de cobalt pour la batterie, de 90 % d'acier recyclé pour les touches et de 100 % de matériaux recyclés pour l'emballage.
Affichage
Deux options d'affichage sont disponibles :
- 1920 x 1200, 100% sRGB, IPS, non tactile, 1 - 120 Hz, mat
- 3200 x 2000, 100% DCI-P3, OLED, écran tactile, 20 - 120 Hz, DisplayHDR 500, brillant
L'option OLED offre de nombreuses améliorations par rapport au panneau IPS de base, notamment une résolution native plus élevée, des couleurs P3 plus profondes, une fonctionnalité d'écran tactile, la prise en charge du HDR500 et des niveaux de contraste très noirs. Elle résout également de manière native les temps de réponse noir-blanc relativement lents de l'écran IPS de base, pour une expérience utilisateur plus nette.
Le choix de l'écran OLED présente néanmoins quelques inconvénients mineurs, tels qu'une consommation d'énergie plus élevée, la modulation de la largeur d'impulsion et un écran brillant à fort taux d'éblouissement. Sa résolution native de 3,2K est également nettement inférieure à celle de l'écran OLED 4K de l'ancien modèle XPS 16 ancien modèle XPS 16 (3200 x 2000 contre 3840 x 2400).
La luminosité maximale du panneau OLED est de 400 nits en mode SDR et de 500 nits en mode HDR, selon nos propres mesures. Ainsi, la configuration IPS la moins chère est en fait légèrement plus lumineuse que la configuration OLED lorsqu'elle affiche du contenu SDR. La visibilité en extérieur n'est donc pas nécessairement meilleure avec l'option OLED la plus brillante.
| |||||||||||||||||||||||||
Homogénéité de la luminosité: 95 %
Valeur mesurée au centre, sur batterie: 395.4 cd/m²
Contraste: ∞:1 (Valeurs des noirs: 0 cd/m²)
ΔE ColorChecker Calman: 3.69 | ∀{0.5-29.43 Ø4.72}
calibrated: 0.68
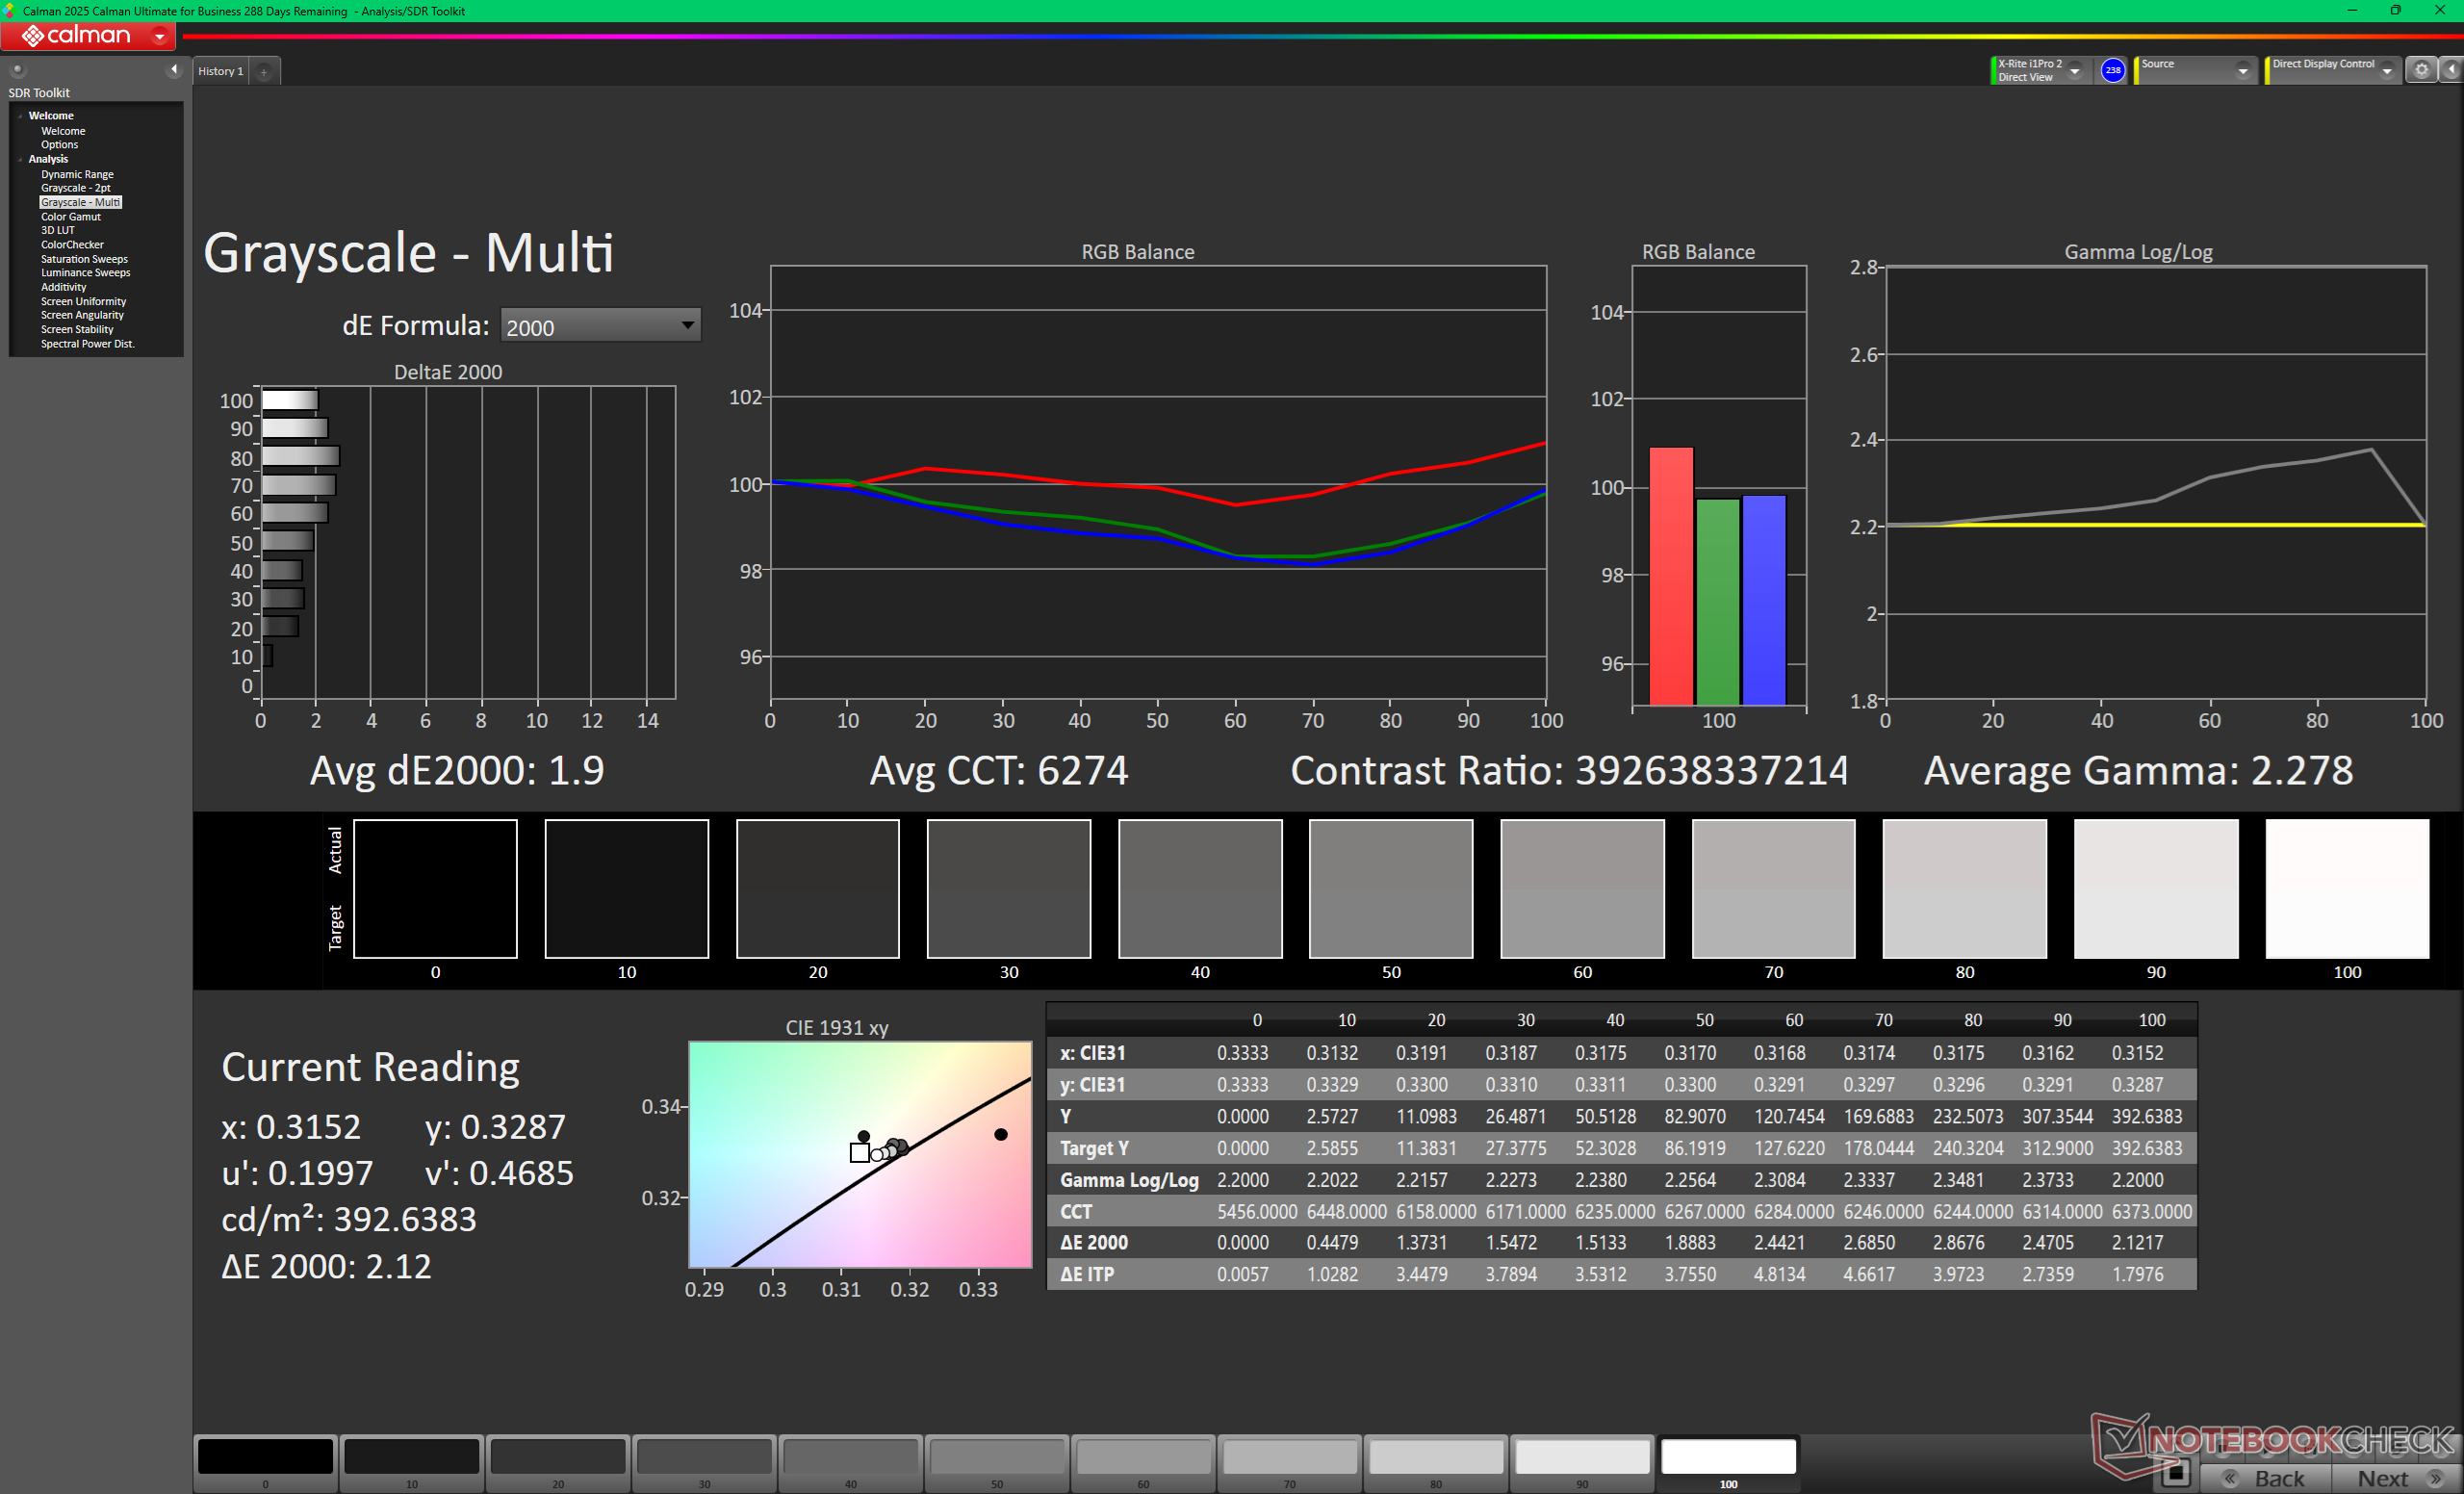
ΔE Greyscale Calman: 1.9 | ∀{0.09-98 Ø4.97}
96.5% AdobeRGB 1998 (Argyll 3D)
100% sRGB (Argyll 3D)
99.5% Display P3 (Argyll 3D)
Gamma: 2.28
CCT: 6274 K
| Dell XPS 16 Core Ultra X7 358H LG Philips 160WV1, OLED, 3200x2000, 16", 120 Hz | Dell XPS 16 Core Ultra 5 325 LG Philips 160WUX, IPS, 1920x1200, 16", 120 Hz | Dell XPS 16 9640 SDC4196, OLED, 3840x2400, 16.3", 90 Hz | Samsung Galaxy Book6 Pro ATNA60HR05-0, OLED, 2880x1800, 16", 120 Hz | Lenovo Yoga Pro 9 16IAH10 RTX 5050 ATNA60HR04-0, OLED, 2880x1800, 16", 120 Hz | HP Omnibook 5 16-af1037nr BOE0C46, IPS, 1920x1200, 16", 60 Hz | |
|---|---|---|---|---|---|---|
| Display | -22% | -3% | -4% | -54% | ||
| Display P3 Coverage (%) | 99.5 | 66.2 -33% | 98.3 -1% | 98.3 -1% | 39.2 -61% | |
| sRGB Coverage (%) | 100 | 97.4 -3% | 100 0% | 99.9 0% | 57.7 -42% | |
| AdobeRGB 1998 Coverage (%) | 96.5 | 67.7 -30% | 87.8 -9% | 85.9 -11% | 40.5 -58% | |
| Response Times | -4418% | -12% | -49% | -19% | -3791% | |
| Response Time Grey 50% / Grey 80% * (ms) | 0.65 ? | 39.3 ? -5946% | 0.82 ? -26% | 0.51 ? 22% | 32.5 ? -4900% | |
| Response Time Black / White * (ms) | 0.87 ? | 26 ? -2889% | 0.85 ? 2% | 0.41 ? 53% | 24.2 ? -2682% | |
| PWM Frequency (Hz) | 240.2 ? | 360 ? | 240 ? | 1200 | ||
| PWM Amplitude * (%) | 31 | 100 -223% | 37 -19% | |||
| Screen | 1% | 6% | 34% | 5% | -91% | |
| Brightness middle (cd/m²) | 395.4 | 534.6 35% | 366 -7% | 502 27% | 471.7 19% | 349.2 -12% |
| Brightness (cd/m²) | 392 | 515 31% | 367 -6% | 507 29% | 474 21% | 326 -17% |
| Brightness Distribution (%) | 95 | 92 -3% | 96 1% | 97 2% | 98 3% | 86 -9% |
| Black Level * (cd/m²) | 0.26 | 0.33 | ||||
| Colorchecker dE 2000 * | 3.69 | 2.53 31% | 1.3 65% | 1 73% | 3.53 4% | 5.87 -59% |
| Colorchecker dE 2000 max. * | 7.94 | 4.57 42% | 3.6 55% | 2.4 70% | 6.31 21% | 20.58 -159% |
| Colorchecker dE 2000 calibrated * | 0.68 | 1.26 -85% | 1 -47% | 3.04 -347% | ||
| Greyscale dE 2000 * | 1.9 | 2.7 -42% | 2.2 -16% | 1.8 5% | 2.6 -37% | 2.6 -37% |
| Gamma | 2.28 96% | 2.32 95% | 2.14 103% | 2.24 98% | 2.24 98% | 2.14 103% |
| CCT | 6274 104% | 6860 95% | 6680 97% | 6435 101% | 6292 103% | 6411 101% |
| Contrast (:1) | 2056 | 1058 | ||||
| Moyenne finale (programmes/paramètres) | -1480% /
-741% | -3% /
1% | -6% /
4% | -7% /
2% | -1312% /
-699% |
* ... Moindre est la valeur, meilleures sont les performances


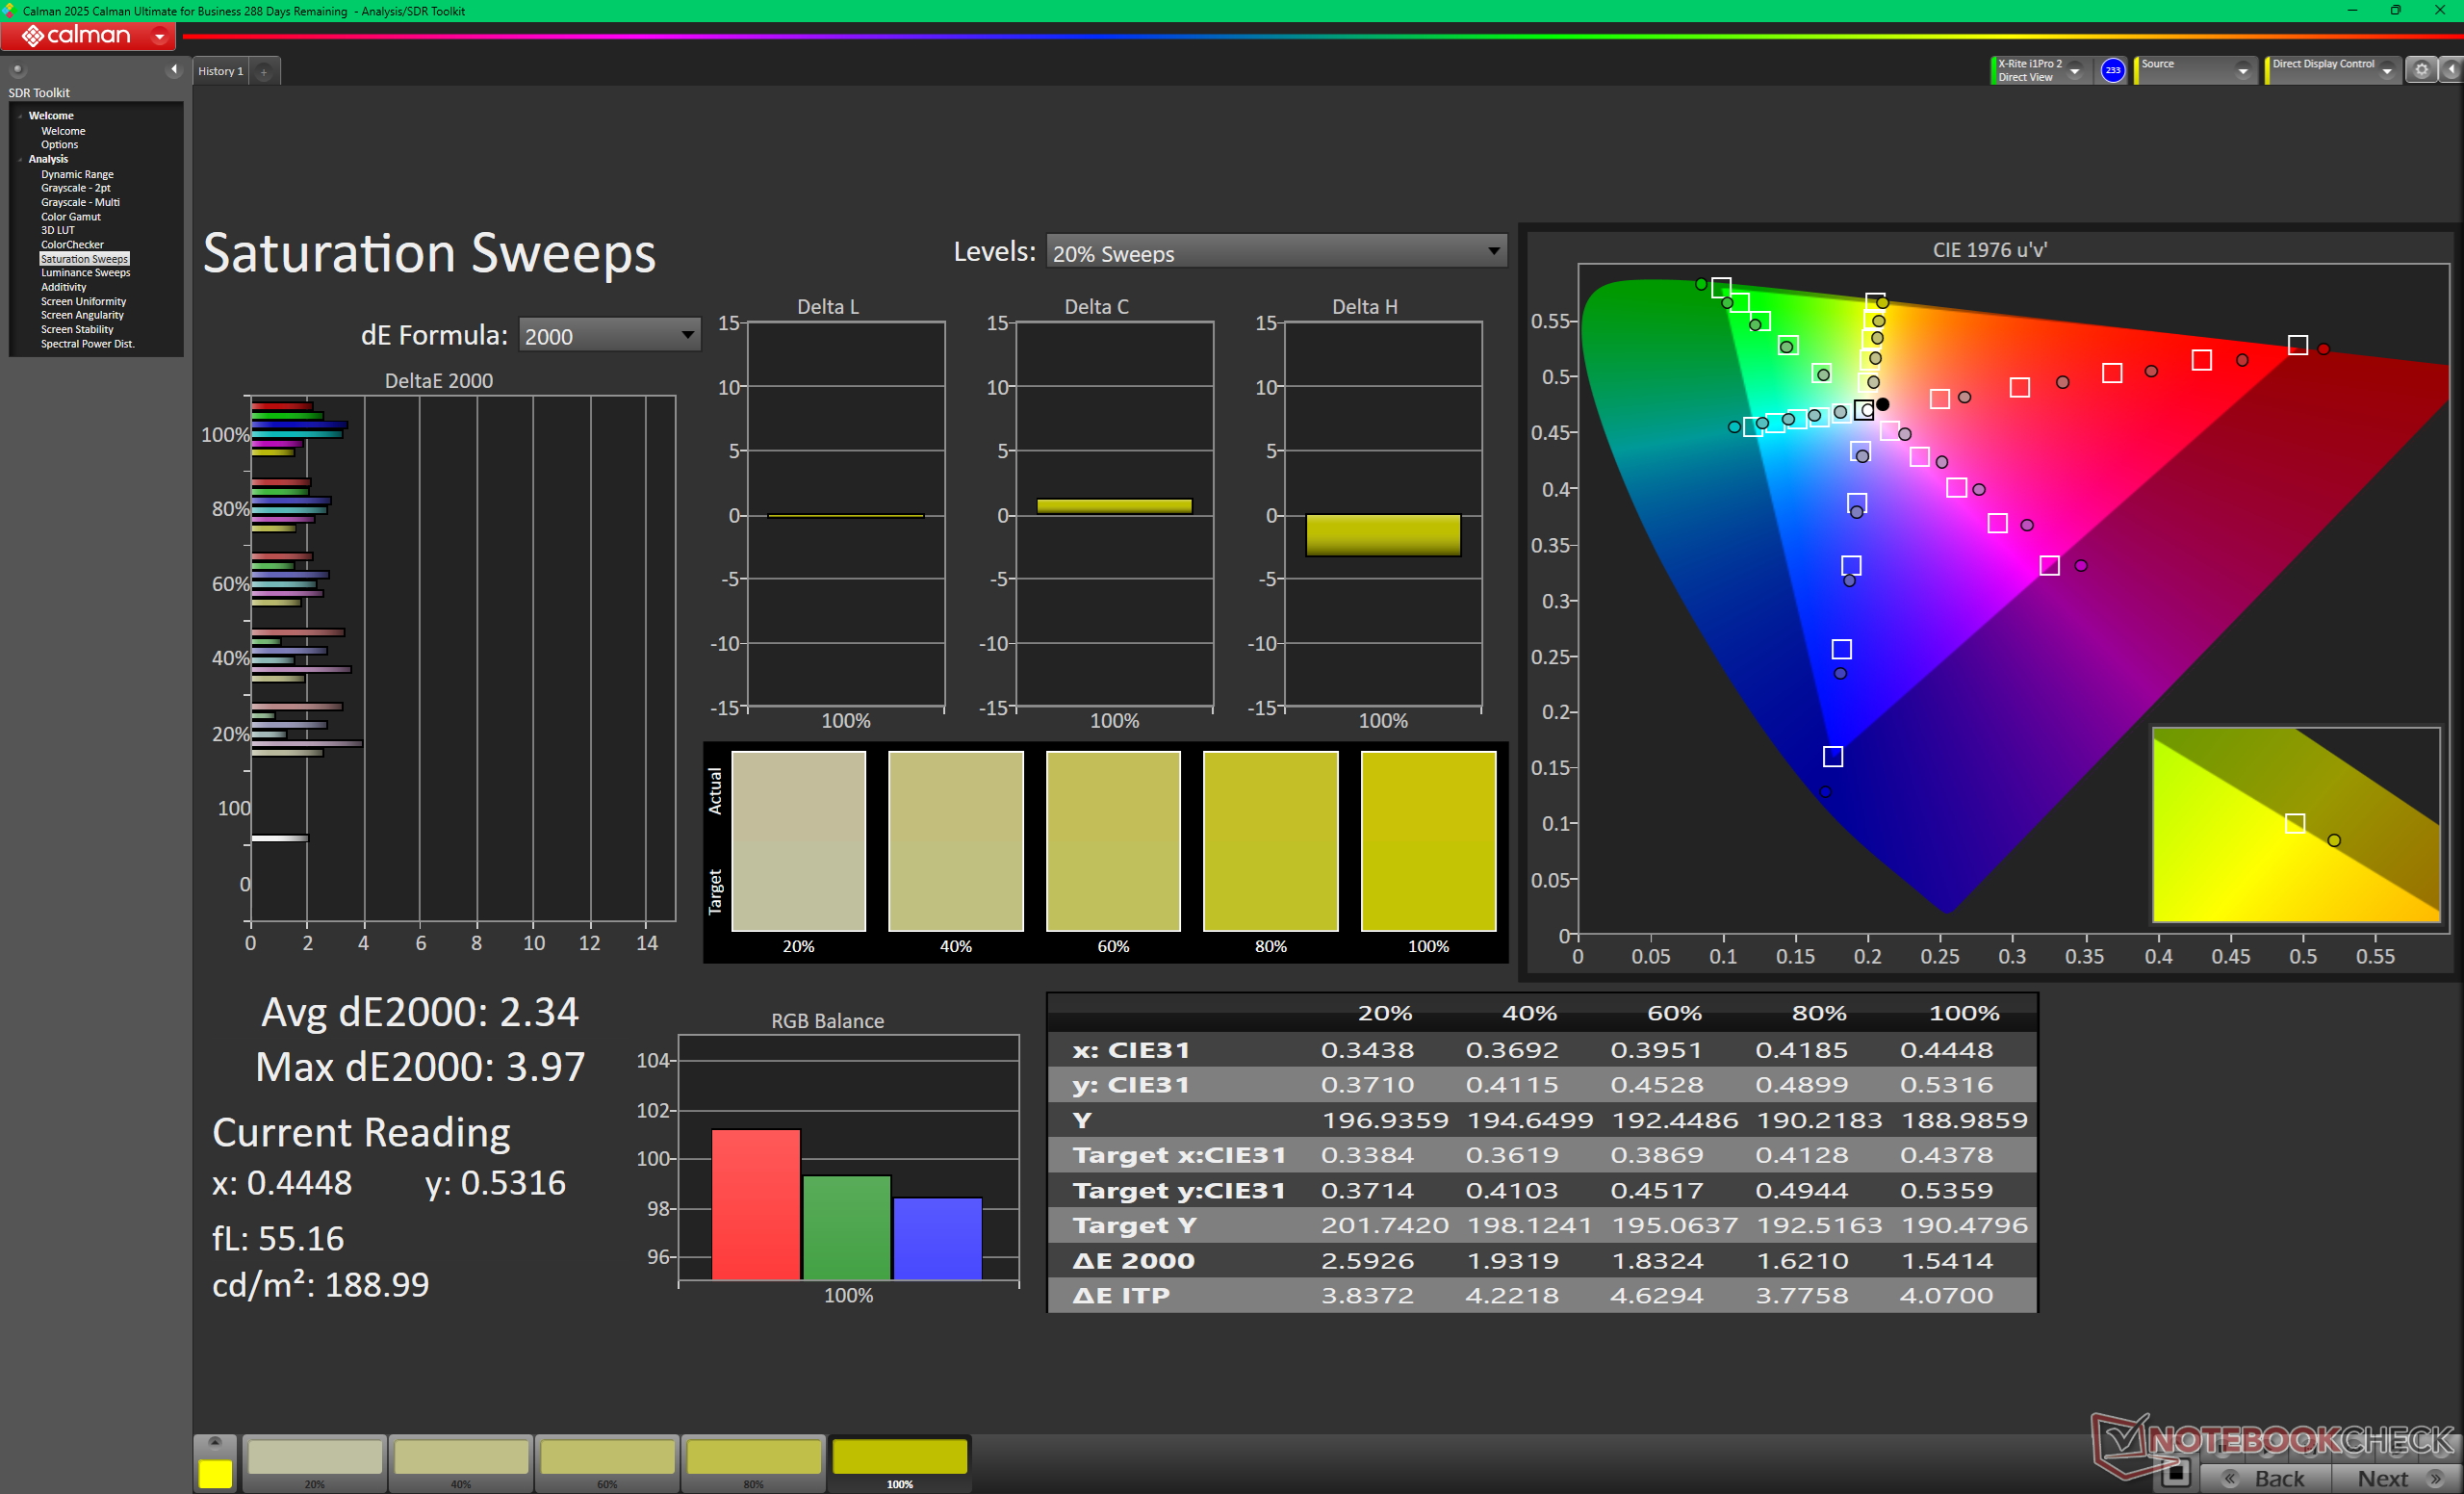
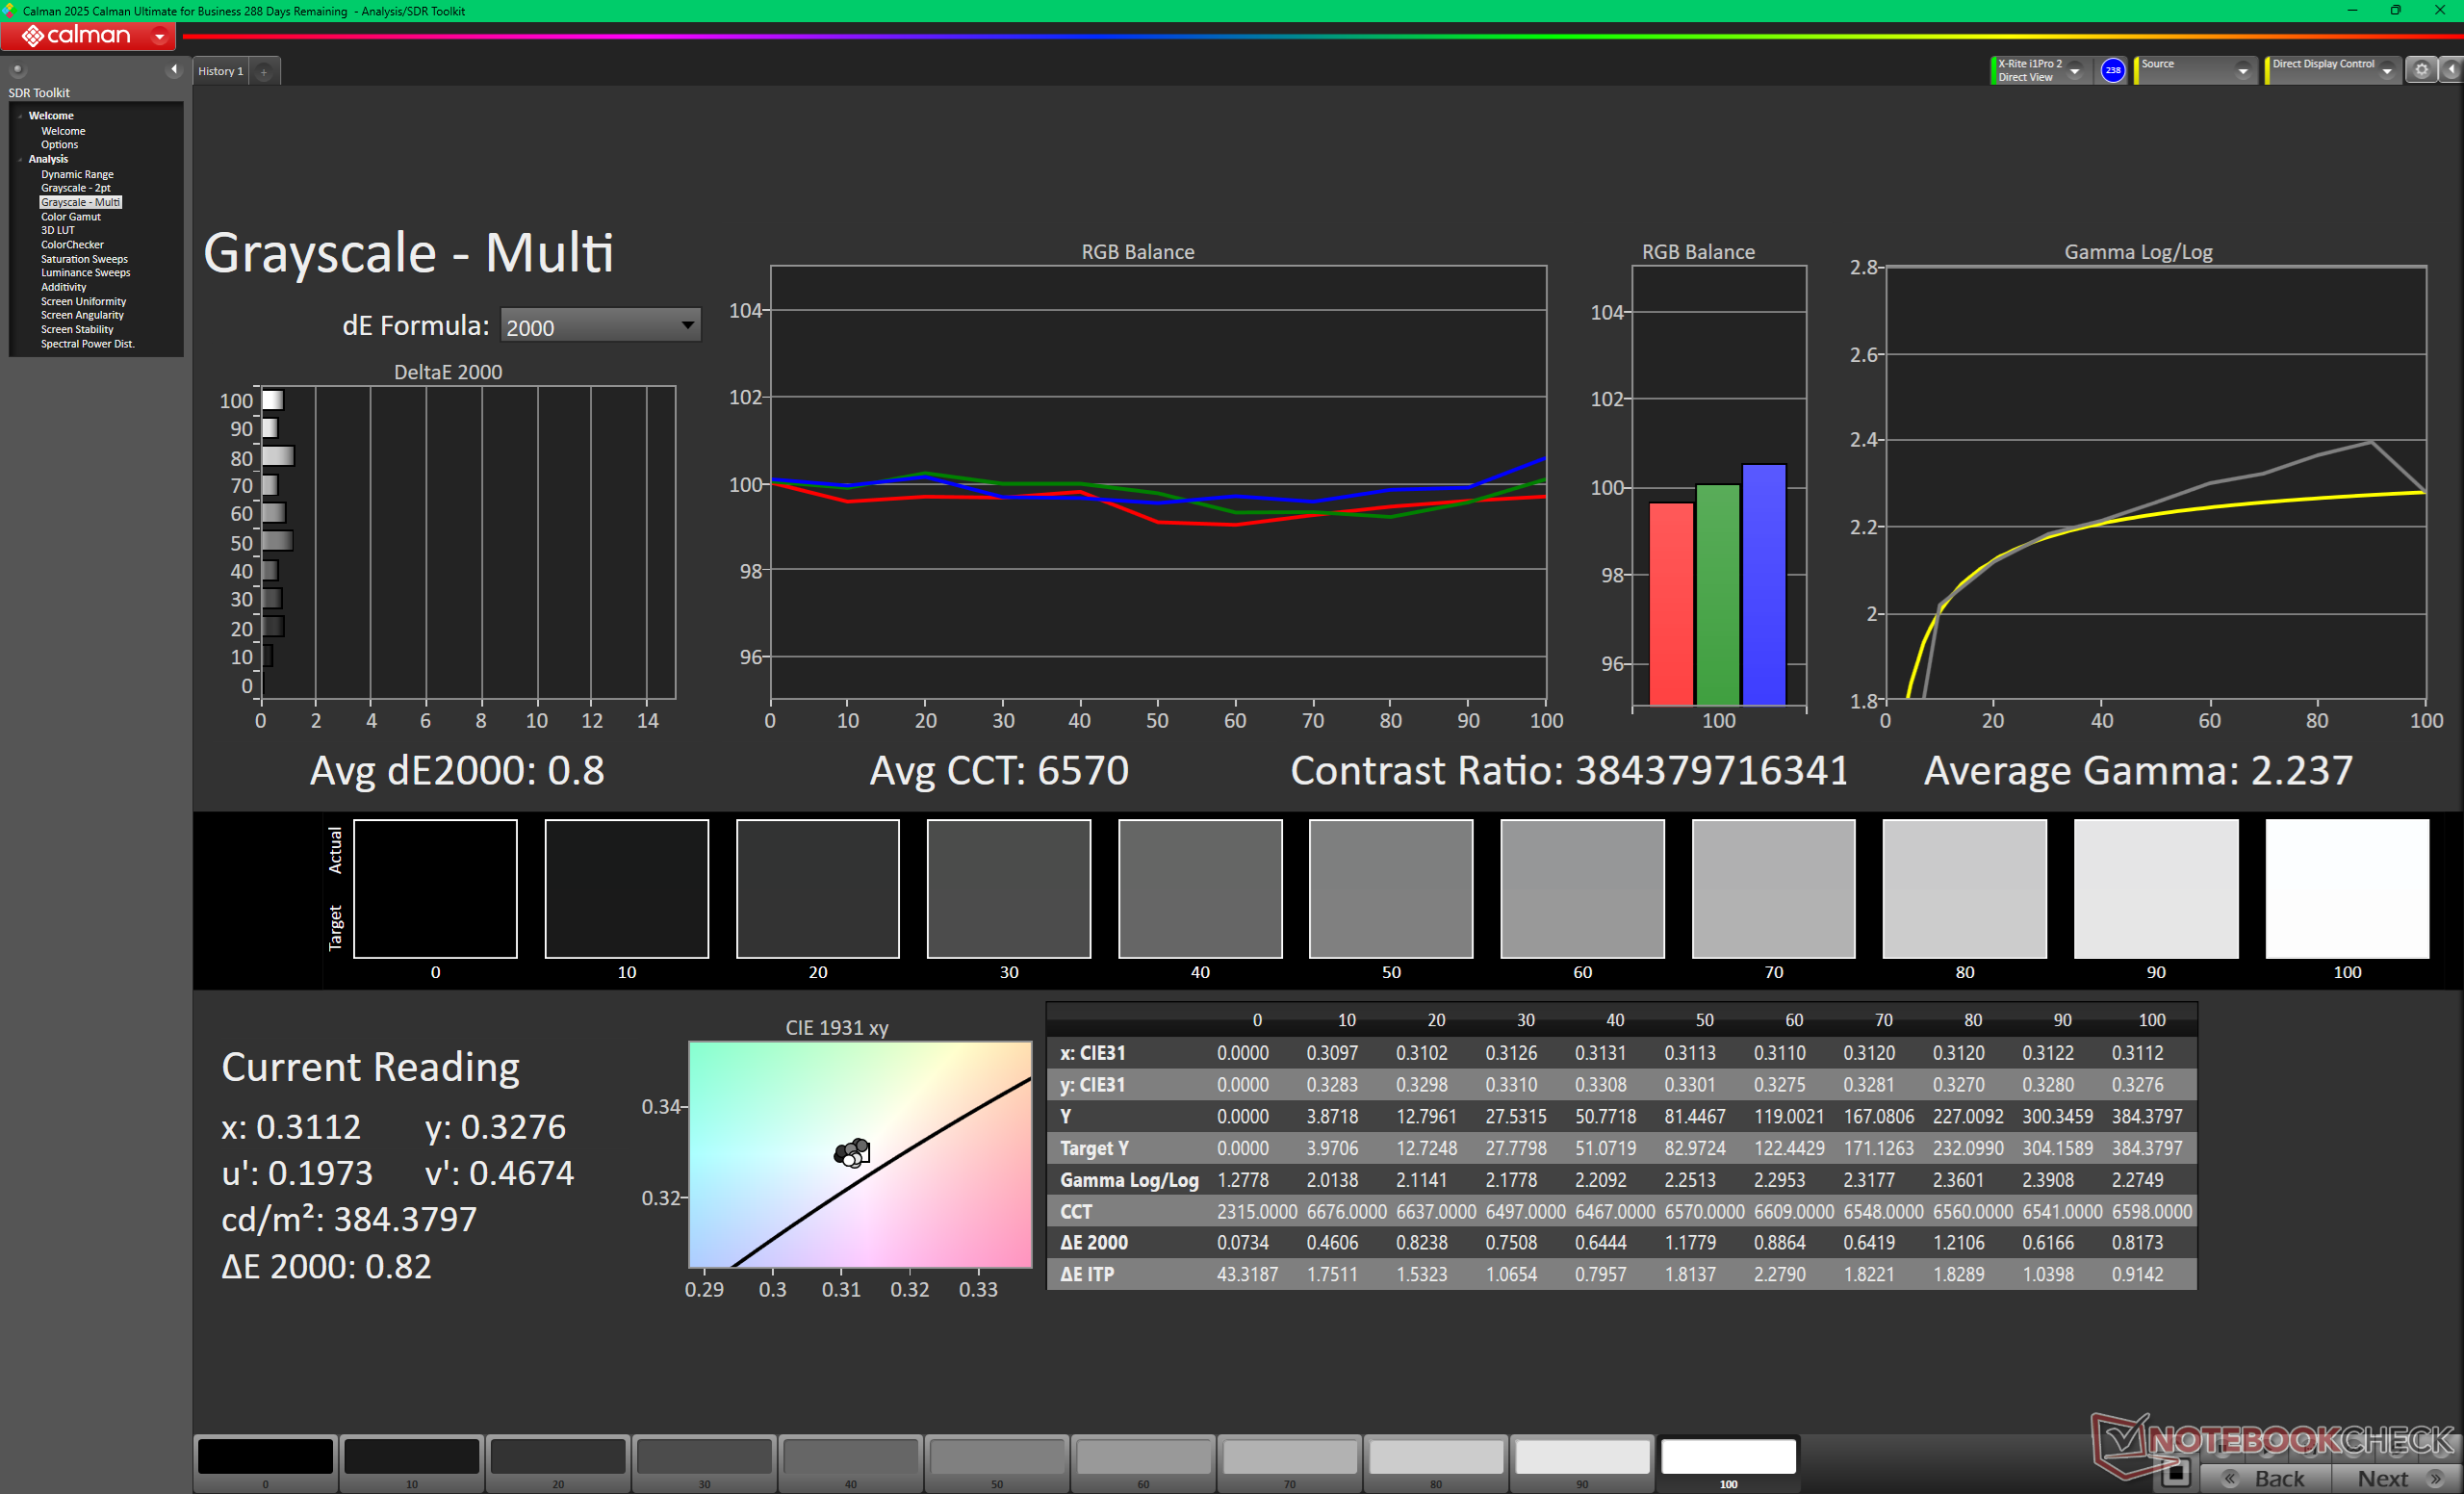
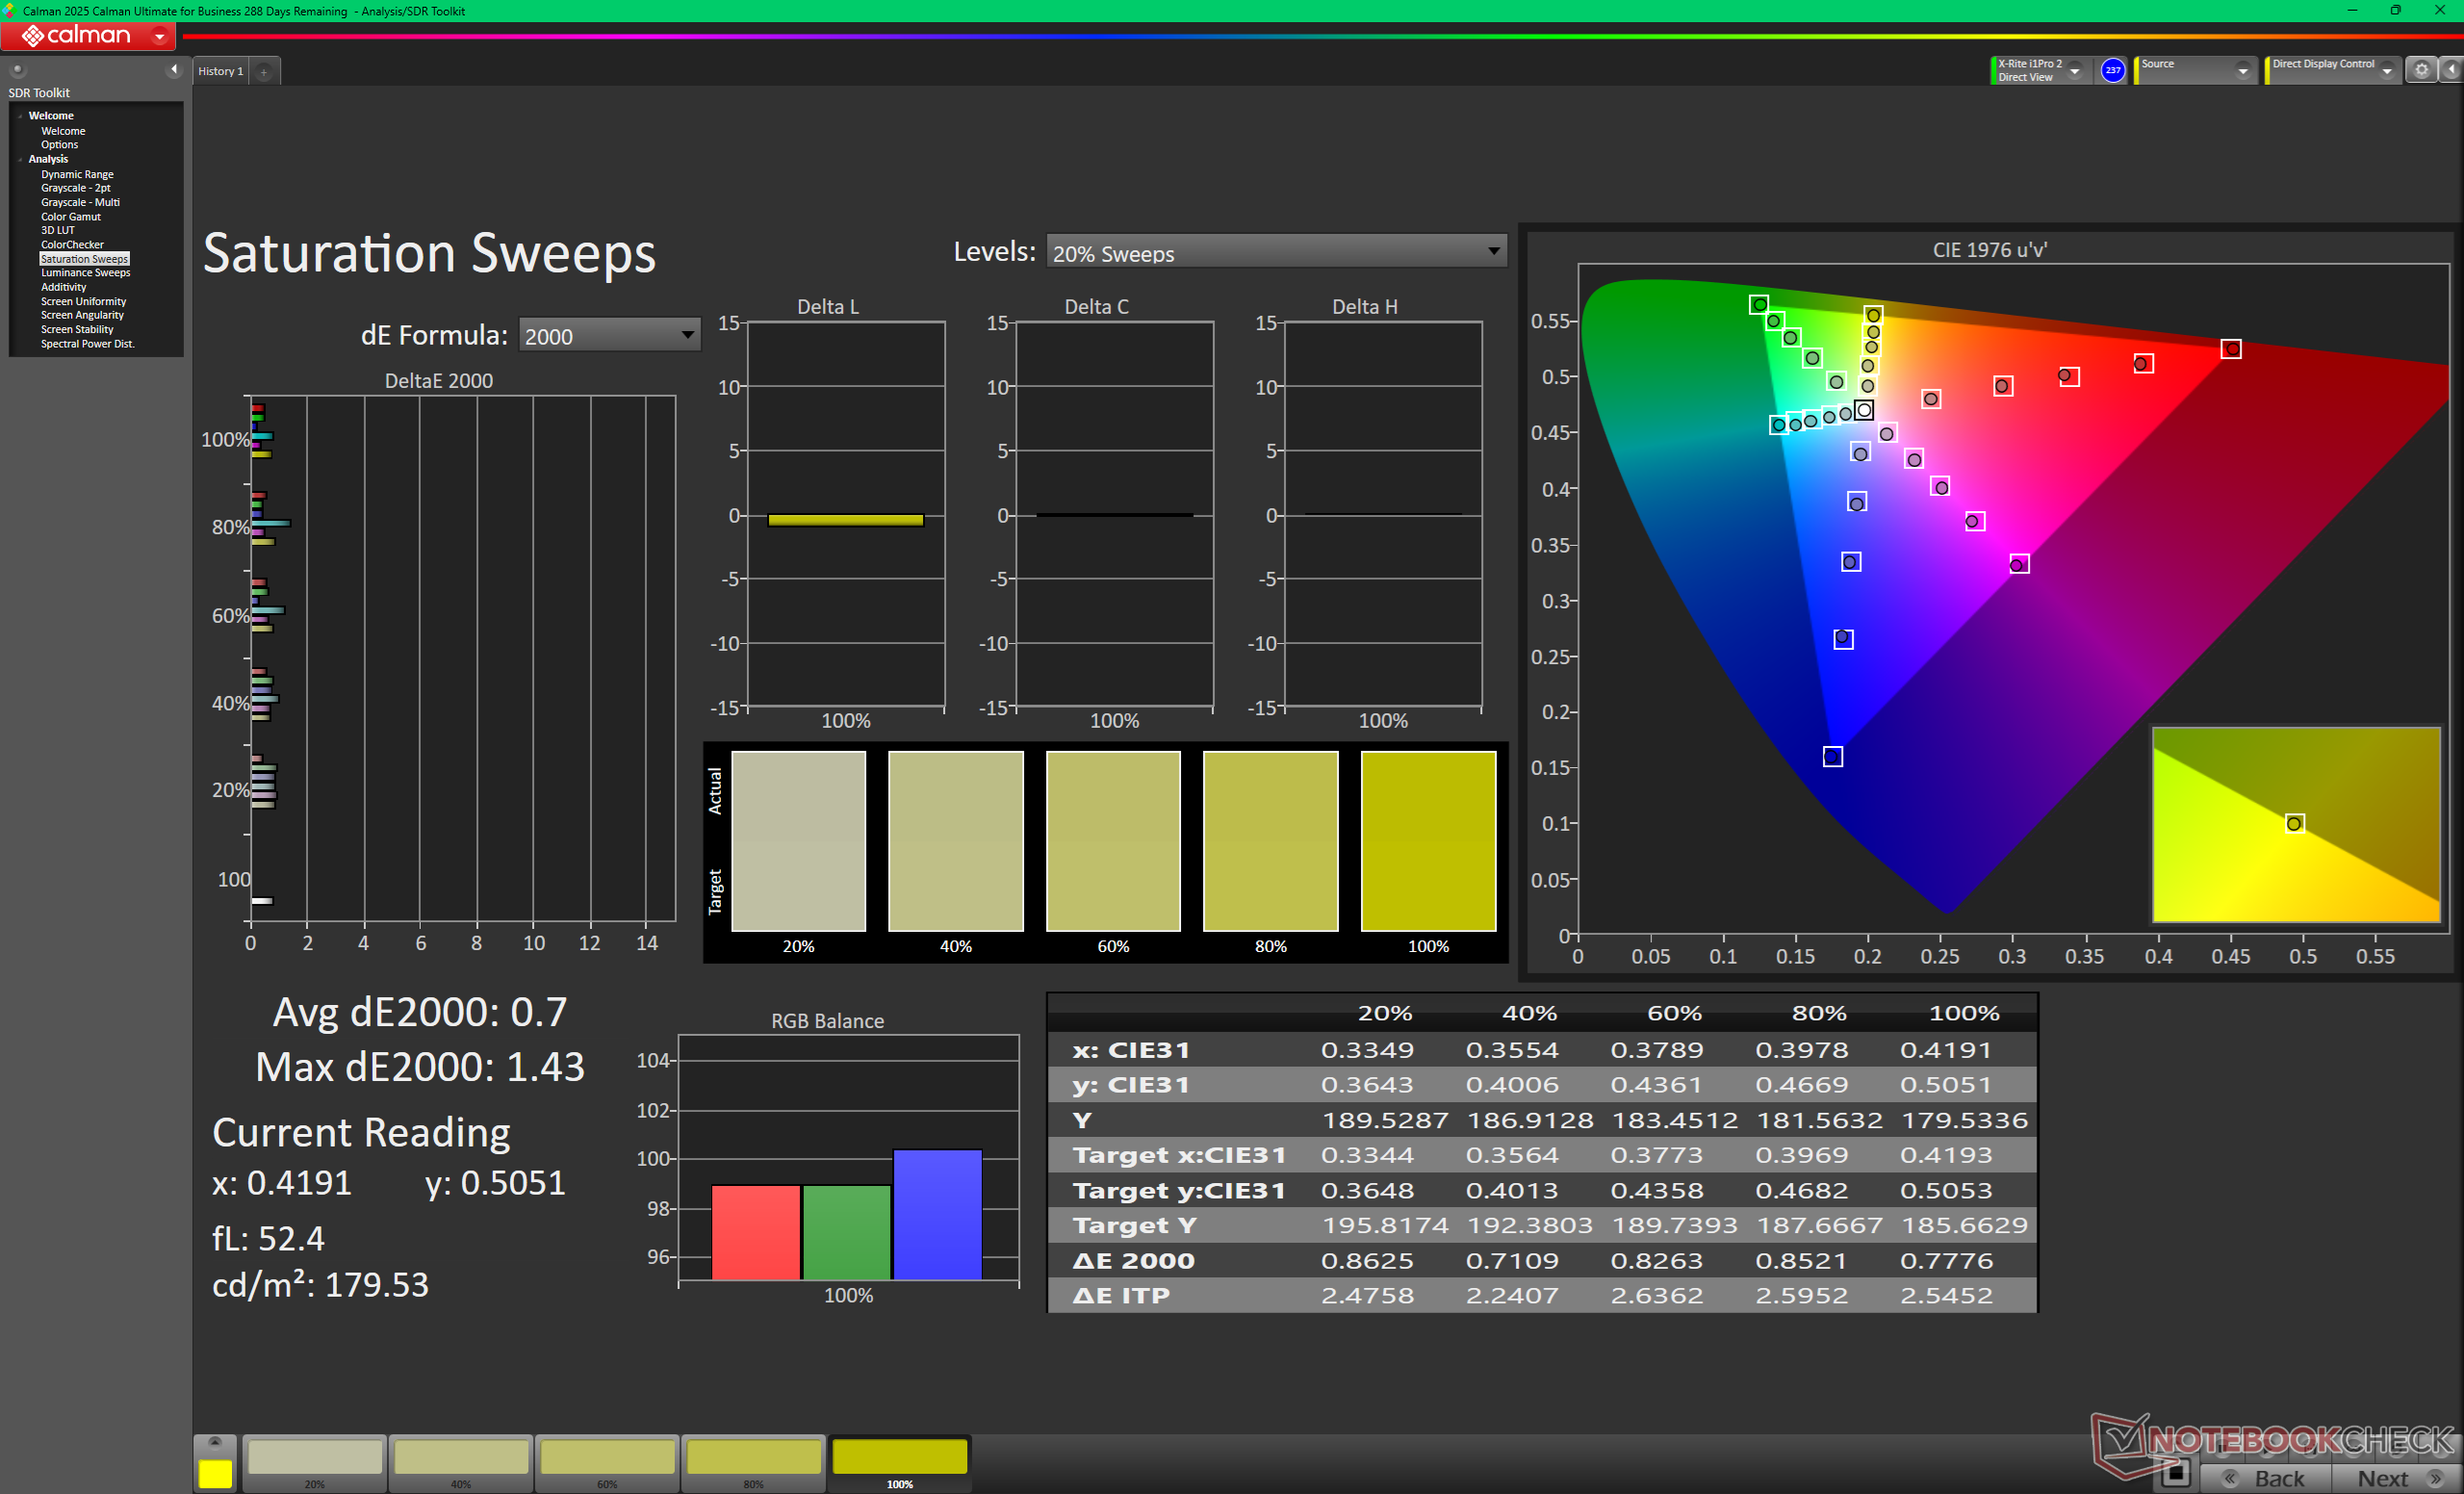
L'écran est calibré de manière satisfaisante par rapport à la norme P3, avec des valeurs DeltaE moyennes en niveaux de gris et en couleurs atteignant respectivement 1,9 et 3,69. Un étalonnage supplémentaire n'est donc pas nécessaire pour la plupart des utilisateurs finaux.


Temps de réponse de l'écran
| ↔ Temps de réponse noir à blanc | ||
|---|---|---|
| 0.87 ms ... hausse ↗ et chute ↘ combinées | ↗ 0.43 ms hausse | 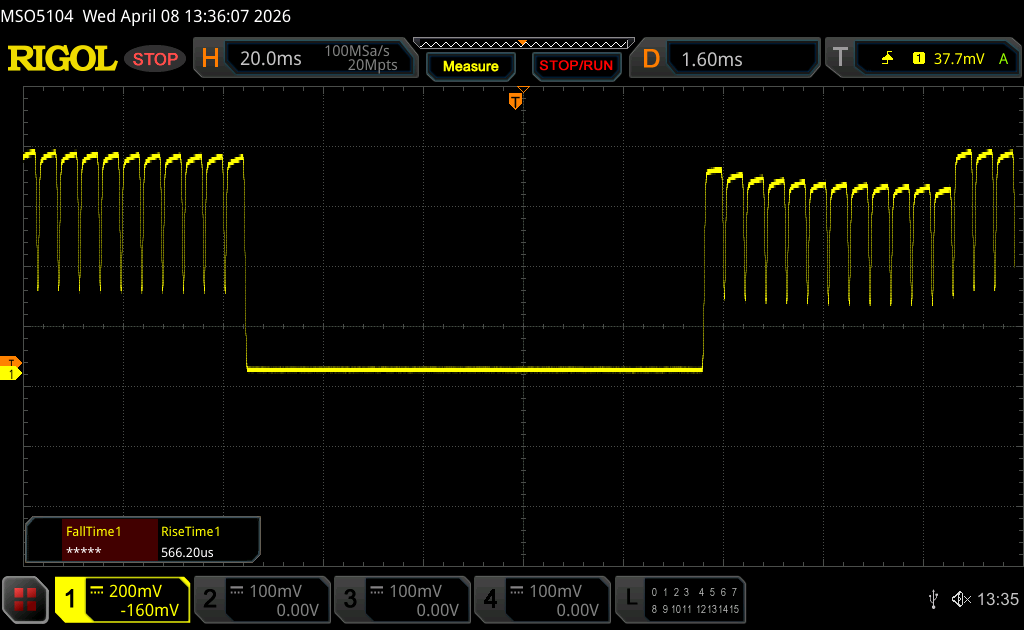 |
| ↘ 0.44 ms chute | ||
| L'écran montre de très faibles temps de réponse, parfait pour le jeu. En comparaison, tous les appareils testés affichent entre 0.1 (minimum) et 240 (maximum) ms. » 3 % des appareils testés affichent de meilleures performances. Cela signifie que les latences relevées sont meilleures que la moyenne (19.8 ms) de tous les appareils testés. | ||
| ↔ Temps de réponse gris 50% à gris 80% | ||
| 0.65 ms ... hausse ↗ et chute ↘ combinées | ↗ 0.36 ms hausse | 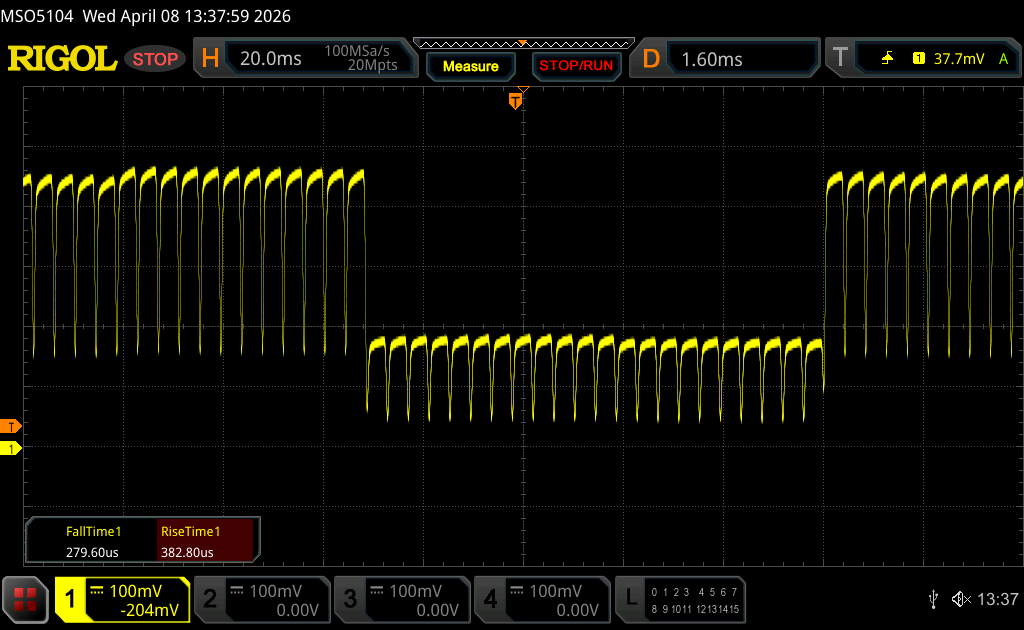 |
| ↘ 0.29 ms chute | ||
| L'écran montre de très faibles temps de réponse, parfait pour le jeu. En comparaison, tous les appareils testés affichent entre 0.165 (minimum) et 636 (maximum) ms. » 2 % des appareils testés affichent de meilleures performances. Cela signifie que les latences relevées sont meilleures que la moyenne (31 ms) de tous les appareils testés. | ||
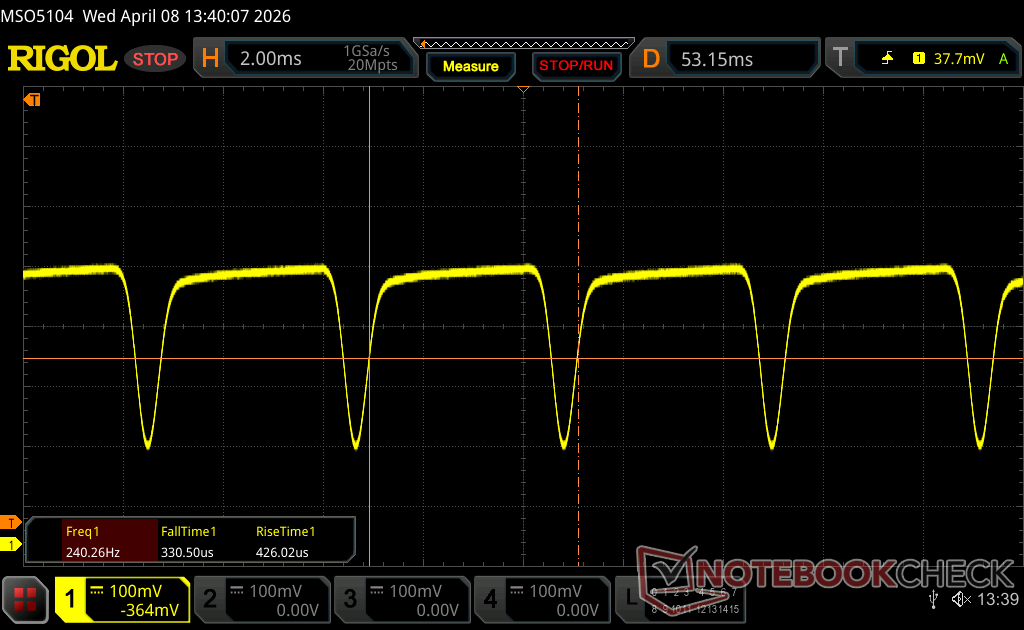
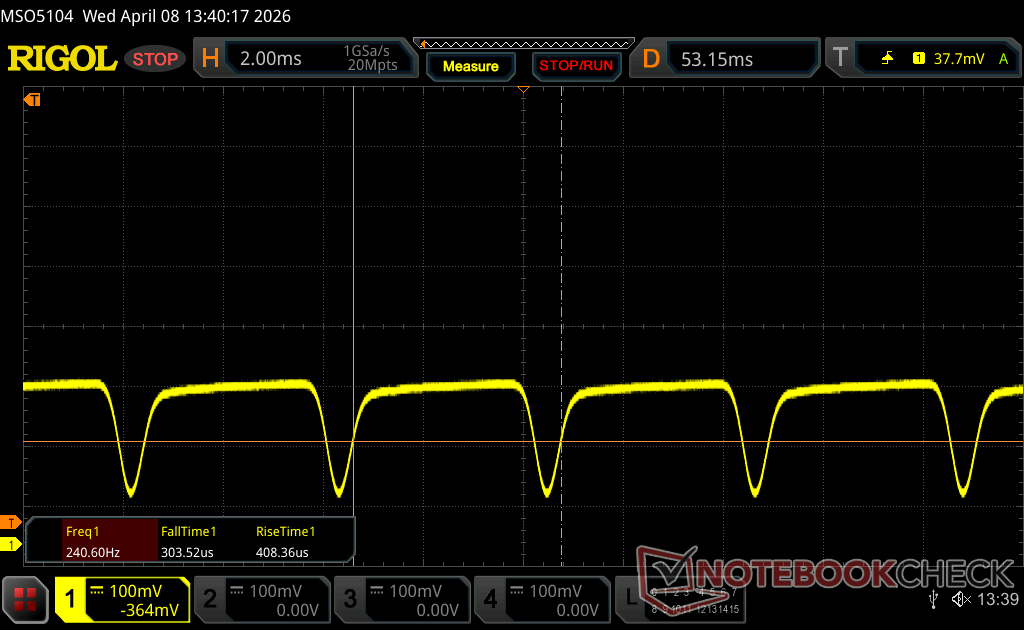
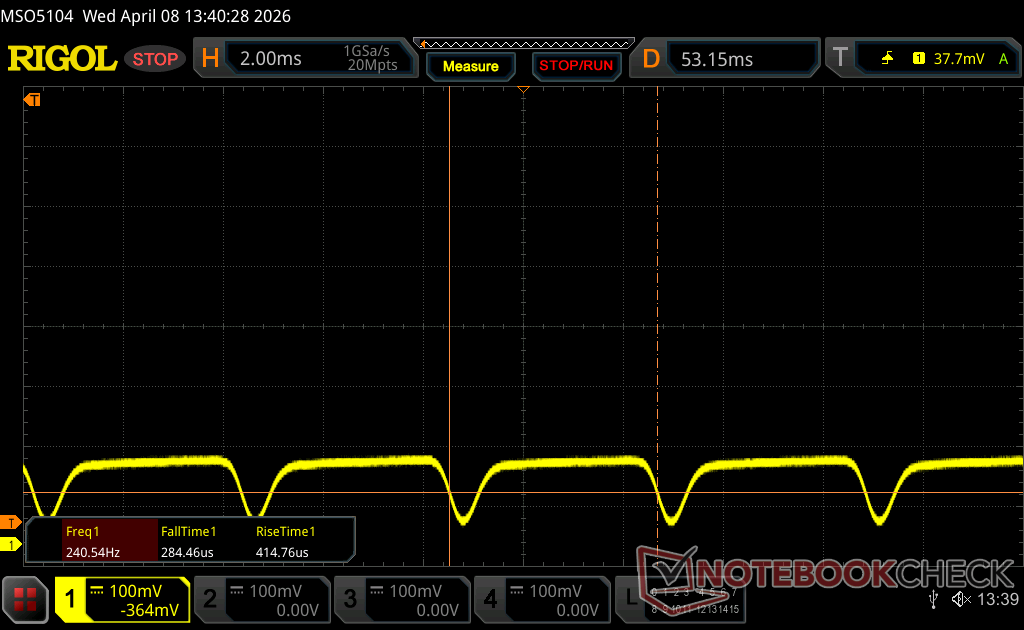
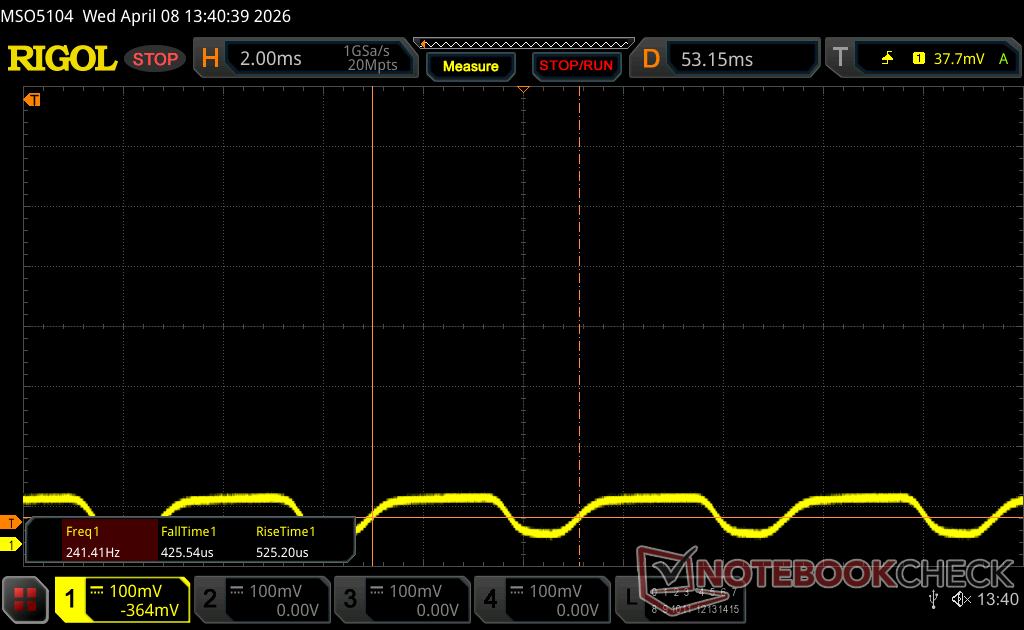
Scintillement / MLI (Modulation de largeur d'impulsion)
| Scintillement / MLI (Modulation de largeur d'impulsion) décelé | 240.2 Hz Amplitude: 31 % | ≤ 100 Niveau de luminosité | 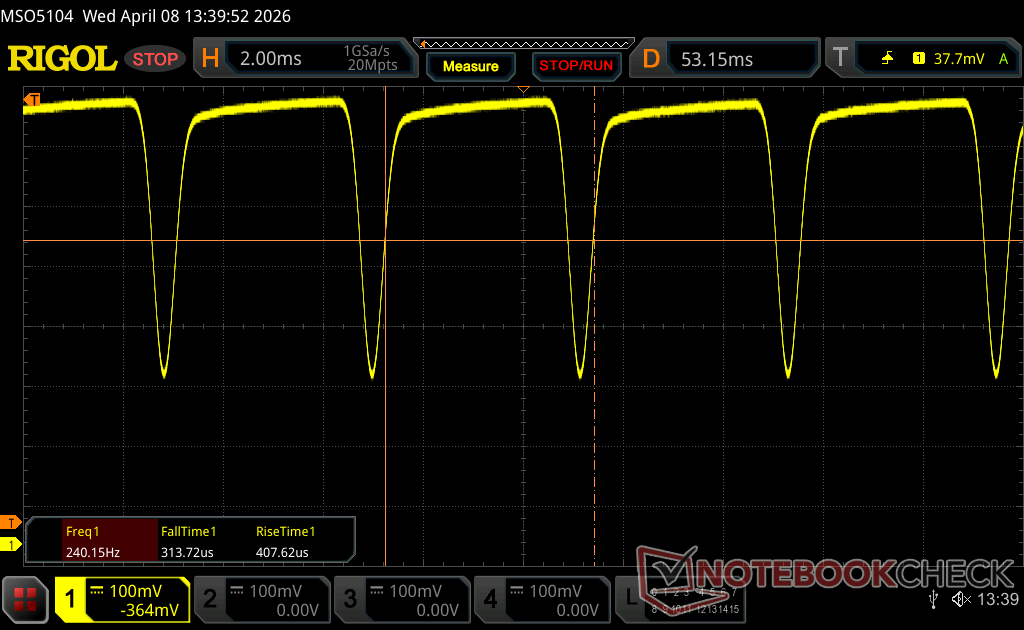 |
Le rétroéclairage de l'écran scintille à la fréquence de 240.2 Hz (certainement du fait de l'utilisation d'une MDI - Modulation de largeur d'impulsion) à un niveau de luminosité inférieur ou égal à 100 % . Aucun scintillement ne devrait être perceptible au-dessus de cette valeur. La fréquence de rafraîchissement de 240.2 Hz est relativement faible, les personnes les plus sensibles devraient percevoir un scintillement et être sujettes à une fatigue oculaire accrue (avec le niveau de luminosité indiqué) En comparaison, 52 % des appareils testés n'emploient pas MDI pour assombrir leur écran. Nous avons relevé une moyenne à 7763 (minimum : 5 - maximum : 343500) Hz dans le cas où une MDI était active. | |||


Performance
Conditions d'essai
Nous avons réglé Windows et Dell Optimizer sur le mode Performance avant d'effectuer les tests ci-dessous.
Processeur
Le Core Ultra X7 358H offre une amélioration de 60 à 70 % des performances multithread par rapport au modèle de base Core Ultra 5 325 ou Core Ultra 7 355 de base. Malheureusement, la durabilité de Turbo Boost est imparfaite, comme le montre notre graphique de stress CineBench R15 xT ci-dessous, où les performances chutent d'environ 15 % après les premières boucles. Le concurrent Asus ExpertBook Ultra concurrent peut soutenir des fréquences d'horloge et des performances plus élevées avec le même CPU Core Ultra X7.
Le Core Ultra 7 255H de l'ancien Dell 16 Premium est nettement plus rapide que le Core Ultra X7 358H du nouveau XPS 16 lorsqu'il s'agit de charges multithread.
Cinebench R15 Multi Loop
Cinebench R23: Multi Core | Single Core
Cinebench R20: CPU (Multi Core) | CPU (Single Core)
Cinebench R15: CPU Multi 64Bit | CPU Single 64Bit
Blender: v2.79 BMW27 CPU
7-Zip 18.03: 7z b 4 | 7z b 4 -mmt1
Geekbench 6.7: Multi-Core | Single-Core
Geekbench 5.5: Multi-Core | Single-Core
HWBOT x265 Benchmark v2.2: 4k Preset
LibreOffice : 20 Documents To PDF
R Benchmark 2.5: Overall mean
* ... Moindre est la valeur, meilleures sont les performances
AIDA64: FP32 Ray-Trace | FPU Julia | CPU SHA3 | CPU Queen | FPU SinJulia | FPU Mandel | CPU AES | CPU ZLib | FP64 Ray-Trace | CPU PhotoWorxx | CPU CheckMate
| Performance rating | |
| Lenovo Yoga Pro 9 16IAH10 RTX 5050 -1! | |
| Dell XPS 16 9640 -1! | |
| Samsung Galaxy Book6 Pro -1! | |
| Dell XPS 16 Core Ultra X7 358H -1! | |
| Moyenne Intel Core Ultra X7 358H | |
| Dell XPS 16 Core Ultra 5 325 -1! | |
| HP Omnibook 5 16-af1037nr -1! | |
| AIDA64 / FP32 Ray-Trace | |
| Lenovo Yoga Pro 9 16IAH10 RTX 5050 (v6.92.6600) | |
| Dell XPS 16 9640 (v6.92.6600) | |
| Samsung Galaxy Book6 Pro (v8.20.8100) | |
| Dell XPS 16 Core Ultra X7 358H (v8.20.8100) | |
| Moyenne Intel Core Ultra X7 358H (12221 - 17932, n=8) | |
| Dell XPS 16 Core Ultra 5 325 (v8.20.8100) | |
| HP Omnibook 5 16-af1037nr (v6.92.6600) | |
| AIDA64 / FPU Julia | |
| Lenovo Yoga Pro 9 16IAH10 RTX 5050 (v6.92.6600) | |
| Dell XPS 16 9640 (v6.92.6600) | |
| Dell XPS 16 Core Ultra X7 358H (v8.20.8100) | |
| Samsung Galaxy Book6 Pro (v8.20.8100) | |
| Moyenne Intel Core Ultra X7 358H (29930 - 95525, n=8) | |
| Dell XPS 16 Core Ultra 5 325 (v8.20.8100) | |
| HP Omnibook 5 16-af1037nr (v6.92.6600) | |
| AIDA64 / CPU SHA3 | |
| Lenovo Yoga Pro 9 16IAH10 RTX 5050 (v6.92.6600) | |
| Moyenne Intel Core Ultra X7 358H (3910 - 4911, n=8) | |
| Dell XPS 16 Core Ultra X7 358H (v8.20.8100) | |
| Samsung Galaxy Book6 Pro (v8.20.8100) | |
| Dell XPS 16 9640 (v6.92.6600) | |
| Dell XPS 16 Core Ultra 5 325 (v8.20.8100) | |
| HP Omnibook 5 16-af1037nr (v6.92.6600) | |
| AIDA64 / CPU Queen | |
| Dell XPS 16 9640 (v6.92.6600) | |
| Lenovo Yoga Pro 9 16IAH10 RTX 5050 (v6.92.6600) | |
| Moyenne Intel Core Ultra X7 358H (63425 - 63827, n=2) | |
| HP Omnibook 5 16-af1037nr (v6.92.6600) | |
| AIDA64 / FPU SinJulia | |
| Dell XPS 16 9640 (v6.92.6600) | |
| Lenovo Yoga Pro 9 16IAH10 RTX 5050 (v6.92.6600) | |
| Samsung Galaxy Book6 Pro (v8.20.8100) | |
| Dell XPS 16 Core Ultra X7 358H (v8.20.8100) | |
| Moyenne Intel Core Ultra X7 358H (4735 - 7038, n=8) | |
| Dell XPS 16 Core Ultra 5 325 (v8.20.8100) | |
| HP Omnibook 5 16-af1037nr (v6.92.6600) | |
| AIDA64 / FPU Mandel | |
| Lenovo Yoga Pro 9 16IAH10 RTX 5050 (v6.92.6600) | |
| Dell XPS 16 Core Ultra X7 358H (v8.20.8100) | |
| Samsung Galaxy Book6 Pro (v8.20.8100) | |
| Dell XPS 16 9640 (v6.92.6600) | |
| Moyenne Intel Core Ultra X7 358H (14716 - 50734, n=8) | |
| Dell XPS 16 Core Ultra 5 325 (v8.20.8100) | |
| HP Omnibook 5 16-af1037nr (v6.92.6600) | |
| AIDA64 / CPU AES | |
| Dell XPS 16 9640 (v6.92.6600) | |
| Lenovo Yoga Pro 9 16IAH10 RTX 5050 (v6.92.6600) | |
| Samsung Galaxy Book6 Pro (v8.20.8100) | |
| Dell XPS 16 Core Ultra X7 358H (v8.20.8100) | |
| Moyenne Intel Core Ultra X7 358H (5127 - 67510, n=8) | |
| Dell XPS 16 Core Ultra 5 325 (v8.20.8100) | |
| HP Omnibook 5 16-af1037nr (v6.92.6600) | |
| AIDA64 / CPU ZLib | |
| Lenovo Yoga Pro 9 16IAH10 RTX 5050 (v6.92.6600) | |
| Dell XPS 16 9640 (v6.92.6600) | |
| Samsung Galaxy Book6 Pro (v8.20.8100) | |
| Moyenne Intel Core Ultra X7 358H (932 - 1179, n=8) | |
| Dell XPS 16 Core Ultra X7 358H (v8.20.8100) | |
| Dell XPS 16 Core Ultra 5 325 (v8.20.8100) | |
| HP Omnibook 5 16-af1037nr (v6.92.6600) | |
| AIDA64 / FP64 Ray-Trace | |
| Lenovo Yoga Pro 9 16IAH10 RTX 5050 (v6.92.6600) | |
| Dell XPS 16 9640 (v6.92.6600) | |
| Dell XPS 16 Core Ultra X7 358H (v8.20.8100) | |
| Samsung Galaxy Book6 Pro (v8.20.8100) | |
| Moyenne Intel Core Ultra X7 358H (6506 - 9447, n=8) | |
| Dell XPS 16 Core Ultra 5 325 (v8.20.8100) | |
| HP Omnibook 5 16-af1037nr (v6.92.6600) | |
| AIDA64 / CPU PhotoWorxx | |
| Dell XPS 16 Core Ultra X7 358H (v8.20.8100) | |
| Samsung Galaxy Book6 Pro (v8.20.8100) | |
| Moyenne Intel Core Ultra X7 358H (30538 - 88154, n=8) | |
| Lenovo Yoga Pro 9 16IAH10 RTX 5050 (v6.92.6600) | |
| Dell XPS 16 Core Ultra 5 325 (v8.20.8100) | |
| Dell XPS 16 9640 (v6.92.6600) | |
| HP Omnibook 5 16-af1037nr (v6.92.6600) | |
| AIDA64 / CPU CheckMate | |
| Moyenne Intel Core Ultra X7 358H (4187 - 4475, n=7) | |
| Dell XPS 16 Core Ultra X7 358H (v8.20.8100) | |
| Samsung Galaxy Book6 Pro (v8.20.8100) | |
| Dell XPS 16 Core Ultra 5 325 (v8.20.8100) | |
Performance du système
Les résultats de PCMark sont nettement supérieurs à ceux de la configuration Core Ultra 5 de base, en particulier pour le sous-test de création de contenu numérique, très gourmand en GPU, grâce à la carte graphique intégrée beaucoup plus rapide de la configuration Core Ultra X7. Selon AIDA64, les performances de la mémoire vive sont également 25 à 40 % plus rapides avec une configuration de 32 Go au lieu de 16 Go.

PCMark 10: Score | Essentials | Productivity | Digital Content Creation
CrossMark: Overall | Productivity | Creativity | Responsiveness
WebXPRT 3: Overall
WebXPRT 4: Overall
Mozilla Kraken 1.1: Total
| Performance rating | |
| Dell XPS 16 Core Ultra X7 358H | |
| Lenovo Yoga Pro 9 16IAH10 RTX 5050 | |
| Moyenne Intel Core Ultra X7 358H, Intel Arc B390 12 Xe3 Panther Lake iGPU | |
| Samsung Galaxy Book6 Pro | |
| Dell XPS 16 9640 -1! | |
| Dell XPS 16 Core Ultra 5 325 | |
| HP Omnibook 5 16-af1037nr | |
| PCMark 10 / Score | |
| Dell XPS 16 Core Ultra X7 358H | |
| Lenovo Yoga Pro 9 16IAH10 RTX 5050 | |
| Moyenne Intel Core Ultra X7 358H, Intel Arc B390 12 Xe3 Panther Lake iGPU (8834 - 9880, n=8) | |
| Samsung Galaxy Book6 Pro | |
| Dell XPS 16 Core Ultra 5 325 | |
| HP Omnibook 5 16-af1037nr | |
| Dell XPS 16 9640 | |
| PCMark 10 / Essentials | |
| Dell XPS 16 Core Ultra X7 358H | |
| Moyenne Intel Core Ultra X7 358H, Intel Arc B390 12 Xe3 Panther Lake iGPU (10282 - 11263, n=7) | |
| Lenovo Yoga Pro 9 16IAH10 RTX 5050 | |
| Dell XPS 16 9640 | |
| Samsung Galaxy Book6 Pro | |
| Dell XPS 16 Core Ultra 5 325 | |
| HP Omnibook 5 16-af1037nr | |
| PCMark 10 / Productivity | |
| Lenovo Yoga Pro 9 16IAH10 RTX 5050 | |
| Dell XPS 16 Core Ultra X7 358H | |
| Samsung Galaxy Book6 Pro | |
| Moyenne Intel Core Ultra X7 358H, Intel Arc B390 12 Xe3 Panther Lake iGPU (13908 - 16780, n=7) | |
| HP Omnibook 5 16-af1037nr | |
| Dell XPS 16 Core Ultra 5 325 | |
| Dell XPS 16 9640 | |
| PCMark 10 / Digital Content Creation | |
| Dell XPS 16 Core Ultra X7 358H | |
| Moyenne Intel Core Ultra X7 358H, Intel Arc B390 12 Xe3 Panther Lake iGPU (13082 - 13893, n=7) | |
| Lenovo Yoga Pro 9 16IAH10 RTX 5050 | |
| Samsung Galaxy Book6 Pro | |
| Dell XPS 16 9640 | |
| Dell XPS 16 Core Ultra 5 325 | |
| HP Omnibook 5 16-af1037nr | |
| CrossMark / Overall | |
| Dell XPS 16 Core Ultra X7 358H | |
| Moyenne Intel Core Ultra X7 358H, Intel Arc B390 12 Xe3 Panther Lake iGPU (1884 - 2119, n=8) | |
| Lenovo Yoga Pro 9 16IAH10 RTX 5050 | |
| Samsung Galaxy Book6 Pro | |
| Dell XPS 16 9640 | |
| Dell XPS 16 Core Ultra 5 325 | |
| HP Omnibook 5 16-af1037nr | |
| CrossMark / Productivity | |
| Dell XPS 16 Core Ultra X7 358H | |
| Lenovo Yoga Pro 9 16IAH10 RTX 5050 | |
| Moyenne Intel Core Ultra X7 358H, Intel Arc B390 12 Xe3 Panther Lake iGPU (1678 - 1928, n=8) | |
| Samsung Galaxy Book6 Pro | |
| Dell XPS 16 9640 | |
| Dell XPS 16 Core Ultra 5 325 | |
| HP Omnibook 5 16-af1037nr | |
| CrossMark / Creativity | |
| Dell XPS 16 Core Ultra X7 358H | |
| Moyenne Intel Core Ultra X7 358H, Intel Arc B390 12 Xe3 Panther Lake iGPU (2241 - 2529, n=8) | |
| Samsung Galaxy Book6 Pro | |
| Lenovo Yoga Pro 9 16IAH10 RTX 5050 | |
| Dell XPS 16 9640 | |
| Dell XPS 16 Core Ultra 5 325 | |
| HP Omnibook 5 16-af1037nr | |
| CrossMark / Responsiveness | |
| Dell XPS 16 Core Ultra X7 358H | |
| Dell XPS 16 9640 | |
| Moyenne Intel Core Ultra X7 358H, Intel Arc B390 12 Xe3 Panther Lake iGPU (1560 - 1837, n=8) | |
| Lenovo Yoga Pro 9 16IAH10 RTX 5050 | |
| Samsung Galaxy Book6 Pro | |
| Dell XPS 16 Core Ultra 5 325 | |
| HP Omnibook 5 16-af1037nr | |
| WebXPRT 3 / Overall | |
| Lenovo Yoga Pro 9 16IAH10 RTX 5050 | |
| Moyenne Intel Core Ultra X7 358H, Intel Arc B390 12 Xe3 Panther Lake iGPU (293 - 338, n=8) | |
| Dell XPS 16 Core Ultra X7 358H | |
| HP Omnibook 5 16-af1037nr | |
| Samsung Galaxy Book6 Pro | |
| Dell XPS 16 9640 | |
| Dell XPS 16 Core Ultra 5 325 | |
| WebXPRT 4 / Overall | |
| Lenovo Yoga Pro 9 16IAH10 RTX 5050 | |
| Dell XPS 16 Core Ultra X7 358H | |
| Moyenne Intel Core Ultra X7 358H, Intel Arc B390 12 Xe3 Panther Lake iGPU (278 - 305, n=7) | |
| HP Omnibook 5 16-af1037nr | |
| Samsung Galaxy Book6 Pro | |
| Dell XPS 16 Core Ultra 5 325 | |
| Dell XPS 16 9640 | |
| Mozilla Kraken 1.1 / Total | |
| HP Omnibook 5 16-af1037nr | |
| Dell XPS 16 Core Ultra 5 325 | |
| Samsung Galaxy Book6 Pro | |
| Moyenne Intel Core Ultra X7 358H, Intel Arc B390 12 Xe3 Panther Lake iGPU (445 - 460, n=8) | |
| Dell XPS 16 Core Ultra X7 358H | |
| Lenovo Yoga Pro 9 16IAH10 RTX 5050 | |
* ... Moindre est la valeur, meilleures sont les performances
| PCMark 10 Score | 9717 points | |
Aide | ||
| AIDA64 / Memory Copy | |
| Dell XPS 16 Core Ultra X7 358H | |
| Samsung Galaxy Book6 Pro | |
| Moyenne Intel Core Ultra X7 358H (102745 - 132135, n=7) | |
| Dell XPS 16 Core Ultra 5 325 | |
| Lenovo Yoga Pro 9 16IAH10 RTX 5050 | |
| Dell XPS 16 9640 | |
| HP Omnibook 5 16-af1037nr | |
| AIDA64 / Memory Read | |
| Dell XPS 16 Core Ultra X7 358H | |
| Samsung Galaxy Book6 Pro | |
| Moyenne Intel Core Ultra X7 358H (97755 - 118888, n=8) | |
| Lenovo Yoga Pro 9 16IAH10 RTX 5050 | |
| Dell XPS 16 Core Ultra 5 325 | |
| Dell XPS 16 9640 | |
| HP Omnibook 5 16-af1037nr | |
| AIDA64 / Memory Write | |
| Dell XPS 16 Core Ultra X7 358H | |
| Moyenne Intel Core Ultra X7 358H (105984 - 134998, n=8) | |
| Samsung Galaxy Book6 Pro | |
| Dell XPS 16 Core Ultra 5 325 | |
| Lenovo Yoga Pro 9 16IAH10 RTX 5050 | |
| Dell XPS 16 9640 | |
| HP Omnibook 5 16-af1037nr | |
| AIDA64 / Memory Latency | |
| HP Omnibook 5 16-af1037nr | |
| Dell XPS 16 9640 | |
| Lenovo Yoga Pro 9 16IAH10 RTX 5050 | |
| Dell XPS 16 Core Ultra 5 325 | |
| Samsung Galaxy Book6 Pro | |
| Dell XPS 16 Core Ultra X7 358H | |
| Moyenne Intel Core Ultra X7 358H (84.6 - 101.9, n=8) | |
* ... Moindre est la valeur, meilleures sont les performances
Latence DPC


| DPC Latencies / LatencyMon - interrupt to process latency (max), Web, Youtube, Prime95 | |
| Lenovo Yoga Pro 9 16IAH10 RTX 5050 | |
| Dell XPS 16 Core Ultra 5 325 | |
| HP Omnibook 5 16-af1037nr | |
| Dell XPS 16 9640 | |
| Dell XPS 16 Core Ultra X7 358H | |
| Samsung Galaxy Book6 Pro | |
* ... Moindre est la valeur, meilleures sont les performances
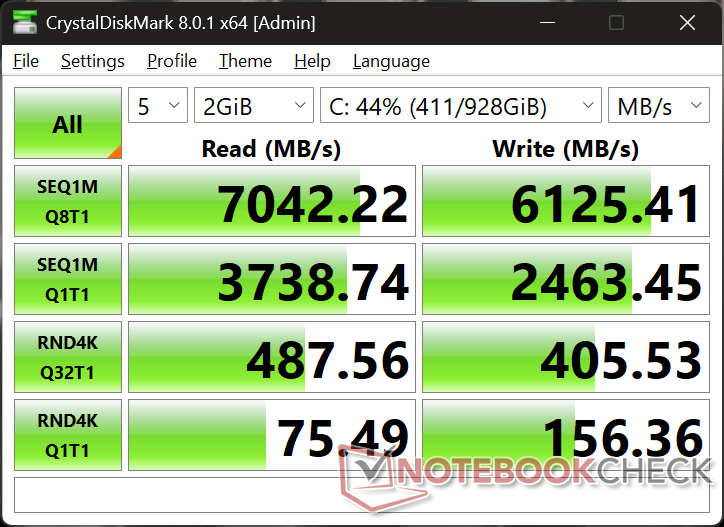
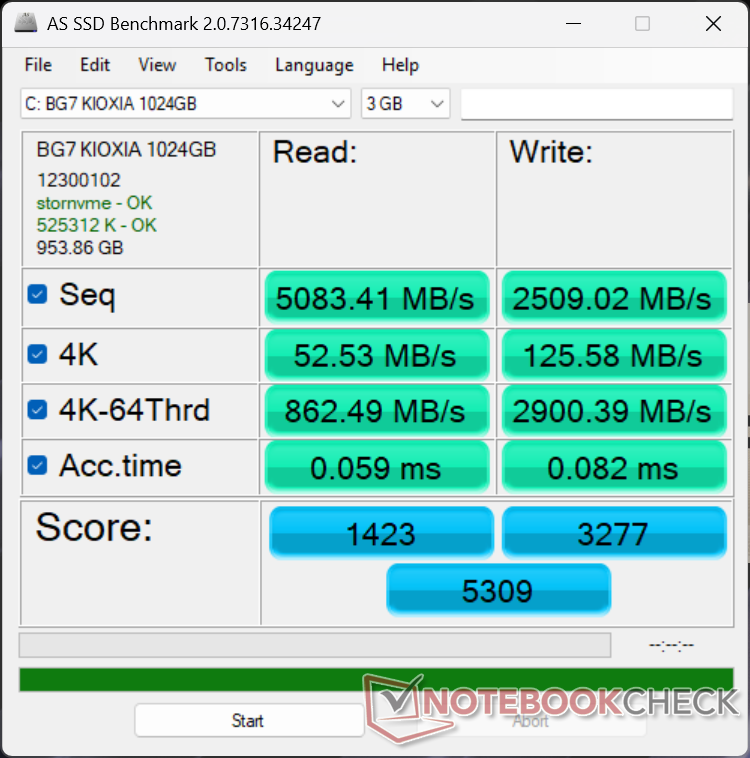
Dispositifs de stockage
Notre unité de test est livrée avec un Kioxia BG7 au lieu d'un BG8 ou d'un BG6 comme dans notre configuration Core Ultra 5 ou 2025 Dell 16 Premiumrespectivement. Les performances sont pratiquement les mêmes, avec des taux de transfert maximaux durables d'environ 7 000 Mo/s.


| Drive Performance rating - Percent | |
| Dell XPS 16 9640 | |
| Lenovo Yoga Pro 9 16IAH10 RTX 5050 | |
| Dell XPS 16 Core Ultra X7 358H | |
| Samsung Galaxy Book6 Pro | |
| Dell XPS 16 Core Ultra 5 325 | |
| HP Omnibook 5 16-af1037nr | |
* ... Moindre est la valeur, meilleures sont les performances
Throttoir de disque : Boucle de lecture DiskSpd, profondeur de la file d'attente 8
Performance du GPU
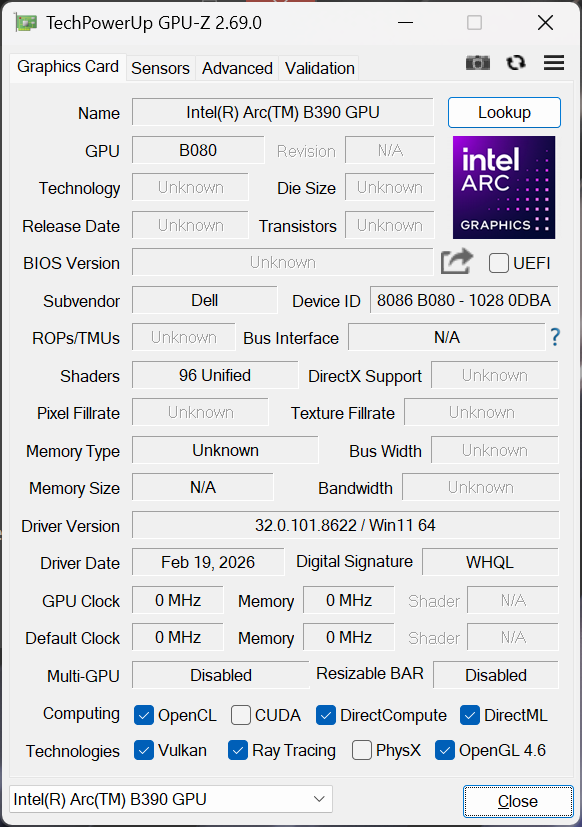
Le système intégré Arc B390 est nettement plus rapide que la version de base Graphics 4 Xe3 dans la configuration Core Ultra 5. Il s'agit du GPU le plus rapide disponible pour le XPS 16 2026, car les options Nvidia discrètes ne sont plus configurables. Les utilisateurs peuvent s'attendre à une augmentation de 2,5 fois des performances brutes par rapport à l'option Graphics 4 Xe3 ou à un déficit de 30 % des performances brutes par rapport à l'ancien XPS 16 avec la RTX 4070 . Il est néanmoins assez puissant pour faire tourner la plupart des titres modernes en 1080p avec des paramètres moyens, y compris Black Myth : Wukong.
L'exécution en mode équilibré au lieu du mode performance n'a pas d'impact significatif sur les performances. En revanche, l'utilisation de la batterie réduit légèrement les performances, jusqu'à 10 %, comme le montre notre tableau de résultats Fire Strike ci-dessous.
| Profil d'alimentation | Score graphique | Score physique | Score combiné |
| Mode Performance | 17018 | 22086 | 4859 |
| Mode équilibré | 16785 (-1%) | 22887 (+4%) | 4467 (-8%) |
| Alimentation par batterie | 15685 (-8%) | 20760 (-6%) | 4269 (-12%) |
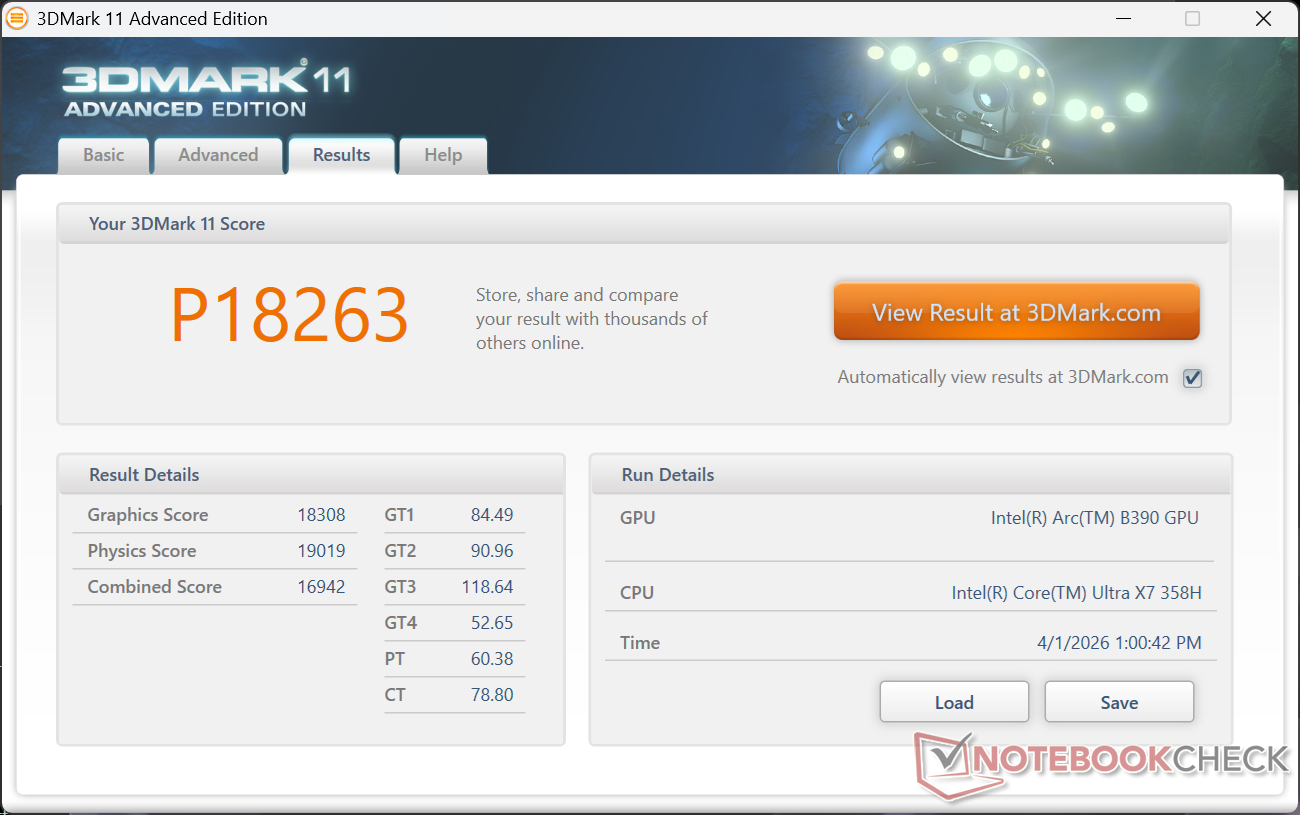


| 3DMark 11 Performance | 18263 points | |
| 3DMark Cloud Gate Standard Score | 39015 points | |
| 3DMark Fire Strike Score | 13997 points | |
| 3DMark Time Spy Score | 7436 points | |
Aide | ||
* ... Moindre est la valeur, meilleures sont les performances
| Performance rating - Percent | |
| Lenovo Yoga Pro 9 16IAH10 RTX 5050 | |
| Dell XPS 16 9640 | |
| Dell XPS 16 Core Ultra X7 358H | |
| Samsung Galaxy Book6 Pro | |
| Dell XPS 16 Core Ultra 5 325 | |
| HP Omnibook 5 16-af1037nr | |
| Cyberpunk 2077 - 1920x1080 Ultra Preset (FSR off) | |
| Lenovo Yoga Pro 9 16IAH10 RTX 5050 | |
| Dell XPS 16 9640 | |
| Dell XPS 16 Core Ultra X7 358H | |
| Samsung Galaxy Book6 Pro | |
| Dell XPS 16 Core Ultra 5 325 | |
| HP Omnibook 5 16-af1037nr | |
| Baldur's Gate 3 - 1920x1080 Ultra Preset AA:T | |
| Lenovo Yoga Pro 9 16IAH10 RTX 5050 | |
| Dell XPS 16 9640 | |
| Dell XPS 16 Core Ultra X7 358H | |
| Samsung Galaxy Book6 Pro | |
| Dell XPS 16 Core Ultra 5 325 | |
| HP Omnibook 5 16-af1037nr | |
| GTA V - 1920x1080 Highest AA:4xMSAA + FX AF:16x | |
| Lenovo Yoga Pro 9 16IAH10 RTX 5050 | |
| Dell XPS 16 9640 | |
| Dell XPS 16 Core Ultra X7 358H | |
| Samsung Galaxy Book6 Pro | |
| Dell XPS 16 Core Ultra 5 325 | |
| HP Omnibook 5 16-af1037nr | |
| Final Fantasy XV Benchmark - 1920x1080 High Quality | |
| Lenovo Yoga Pro 9 16IAH10 RTX 5050 | |
| Dell XPS 16 9640 | |
| Dell XPS 16 Core Ultra X7 358H | |
| Samsung Galaxy Book6 Pro | |
| Dell XPS 16 Core Ultra 5 325 | |
| HP Omnibook 5 16-af1037nr | |
| Strange Brigade - 1920x1080 ultra AA:ultra AF:16 | |
| Lenovo Yoga Pro 9 16IAH10 RTX 5050 | |
| Dell XPS 16 9640 | |
| Dell XPS 16 Core Ultra X7 358H | |
| Samsung Galaxy Book6 Pro | |
| Dell XPS 16 Core Ultra 5 325 | |
| HP Omnibook 5 16-af1037nr | |
| Dota 2 Reborn - 1920x1080 ultra (3/3) best looking | |
| Lenovo Yoga Pro 9 16IAH10 RTX 5050 | |
| Dell XPS 16 Core Ultra X7 358H | |
| Dell XPS 16 9640 | |
| Samsung Galaxy Book6 Pro | |
| Dell XPS 16 Core Ultra 5 325 | |
| HP Omnibook 5 16-af1037nr | |
| X-Plane 11.11 - 1920x1080 high (fps_test=3) | |
| Lenovo Yoga Pro 9 16IAH10 RTX 5050 | |
| Dell XPS 16 9640 | |
| Dell XPS 16 9640 | |
| Dell XPS 16 Core Ultra X7 358H | |
| Samsung Galaxy Book6 Pro | |
| HP Omnibook 5 16-af1037nr | |
| Dell XPS 16 Core Ultra 5 325 | |
Cyberpunk 2077 ultra FPS Chart
| Bas | Moyen | Élevé | Ultra | |
|---|---|---|---|---|
| GTA V (2015) | 182 | 176.1 | 103.3 | 45.2 |
| Dota 2 Reborn (2015) | 112.9 | 91.6 | 100.2 | 96.9 |
| Final Fantasy XV Benchmark (2018) | 131.1 | 79.7 | 56.2 | |
| X-Plane 11.11 (2018) | 55.9 | 47.6 | 38.8 | |
| Strange Brigade (2018) | 359 | 130.5 | 104 | 90.6 |
| Baldur's Gate 3 (2023) | 72.3 | 62.3 | 55.6 | 54.3 |
| Cyberpunk 2077 (2023) | 80.4 | 65.4 | 56 | 48.7 |
| F1 24 (2024) | 142.7 | 135.3 | 103.4 | 36.8 |
| Black Myth: Wukong (2024) | 47 | 37 | 29 | 16 |
Émissions
Bruit du système
La vitesse de rotation du ventilateur augmente plus rapidement par rapport à la configuration Core Ultra 5 de base, ce qui correspond à la consommation d'énergie généralement plus élevée du système Core Ultra X7. Lors de l'exécution de 3DMark 06, par exemple, le bruit du ventilateur a atteint 38 dB(A) contre 34 dB(A) pour le Core Ultra 5 SKU.
Degré de la nuisance sonore
| Au repos |
| 23.4 / 23.4 / 25.8 dB(A) |
| Fortement sollicité |
| 38 / 48.6 dB(A) |
 | ||
30 dB silencieux 40 dB(A) audible 50 dB(A) bruyant |
||
min: | ||
| Dell XPS 16 Core Ultra X7 358H Ultra X7 358H, Arc B390 Panther Lake iGPU | Dell XPS 16 Core Ultra 5 325 Ultra 5 325, Intel Graphics 4 Xe3 PTL | Dell XPS 16 9640 Ultra 7 155H, GeForce RTX 4070 Laptop GPU | Samsung Galaxy Book6 Pro Ultra 7 356H, Intel Graphics 4 Xe3 PTL | Lenovo Yoga Pro 9 16IAH10 RTX 5050 Ultra 9 285H, GeForce RTX 5050 Laptop | HP Omnibook 5 16-af1037nr Ultra 7 255U, Graphics 4-Core iGPU (Arrow Lake) | |
|---|---|---|---|---|---|---|
| Noise | 5% | -5% | 2% | -7% | 13% | |
| arrêt / environnement * (dB) | 23.3 | 22.8 2% | 24.5 -5% | 25.3 -9% | 24.6 -6% | 23.3 -0% |
| Idle Minimum * (dB) | 23.4 | 22.9 2% | 24.5 -5% | 25.3 -8% | 24.6 -5% | 23.5 -0% |
| Idle Average * (dB) | 23.4 | 22.9 2% | 24.5 -5% | 25.3 -8% | 24.6 -5% | 23.5 -0% |
| Idle Maximum * (dB) | 25.8 | 23.9 7% | 27.5 -7% | 25.3 2% | 26.8 -4% | 24.4 5% |
| Load Average * (dB) | 38 | 34.8 8% | 39.6 -4% | 31.8 16% | 32.8 14% | 25.8 32% |
| Cyberpunk 2077 ultra * (dB) | 38.1 | 38 -0% | 38.4 -1% | 51.8 -36% | 26.2 31% | |
| Load Maximum * (dB) | 48.6 | 43.3 11% | 49.7 -2% | 38.4 21% | 51.8 -7% | 39 20% |
| Witcher 3 ultra * (dB) | 49.7 |
* ... Moindre est la valeur, meilleures sont les performances
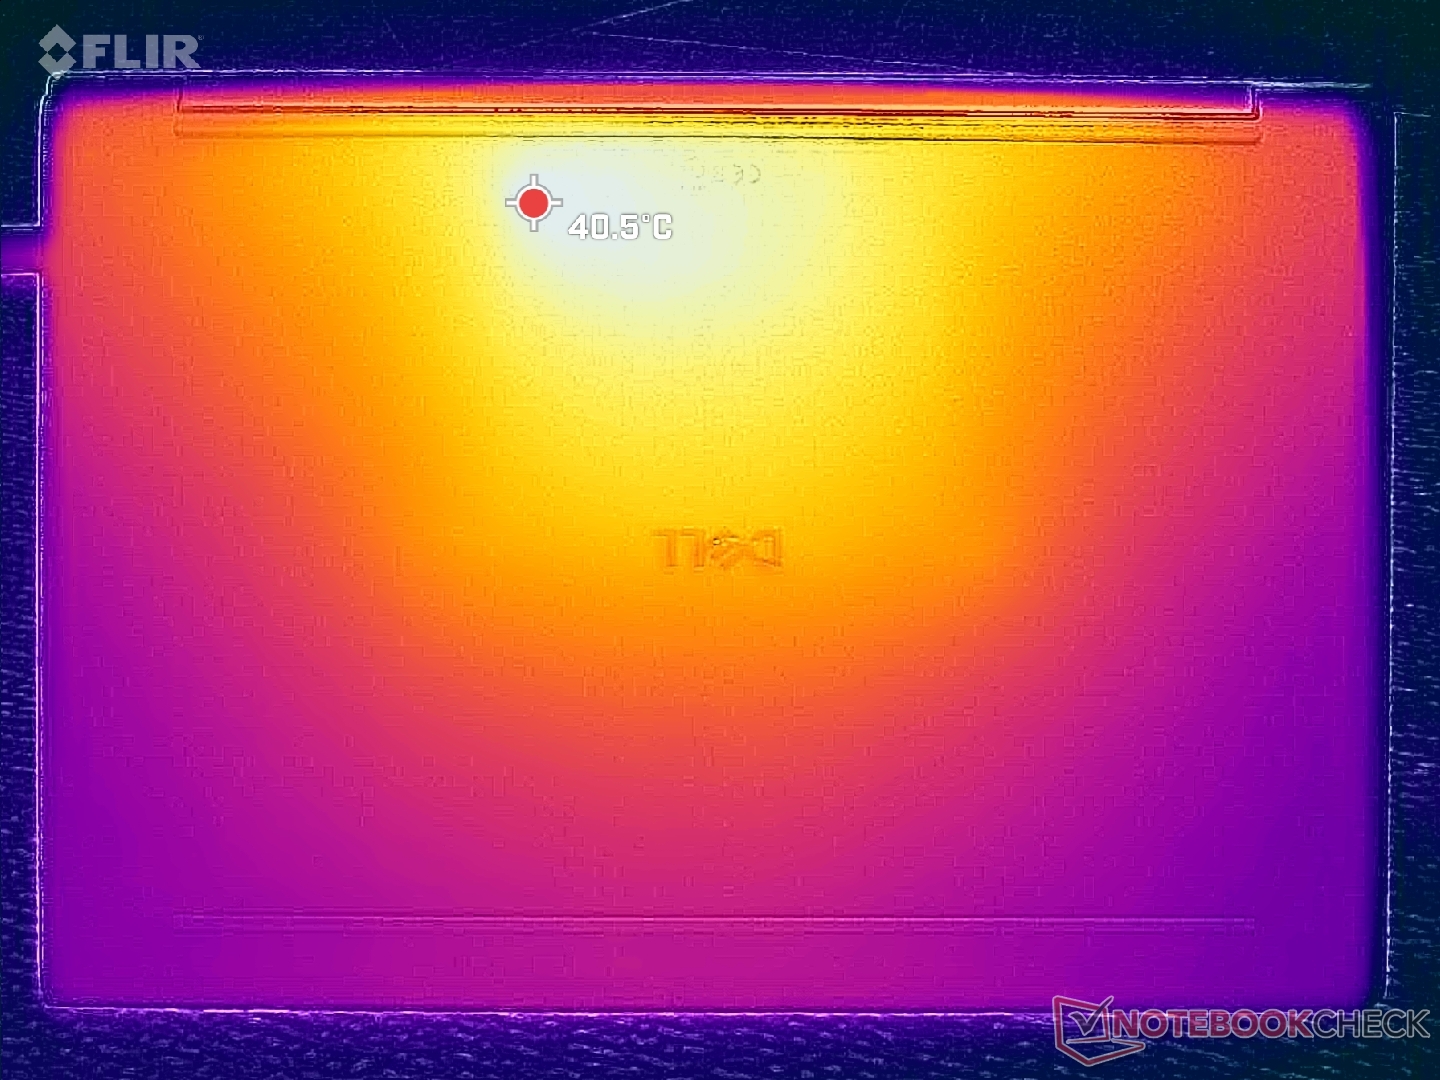
Température
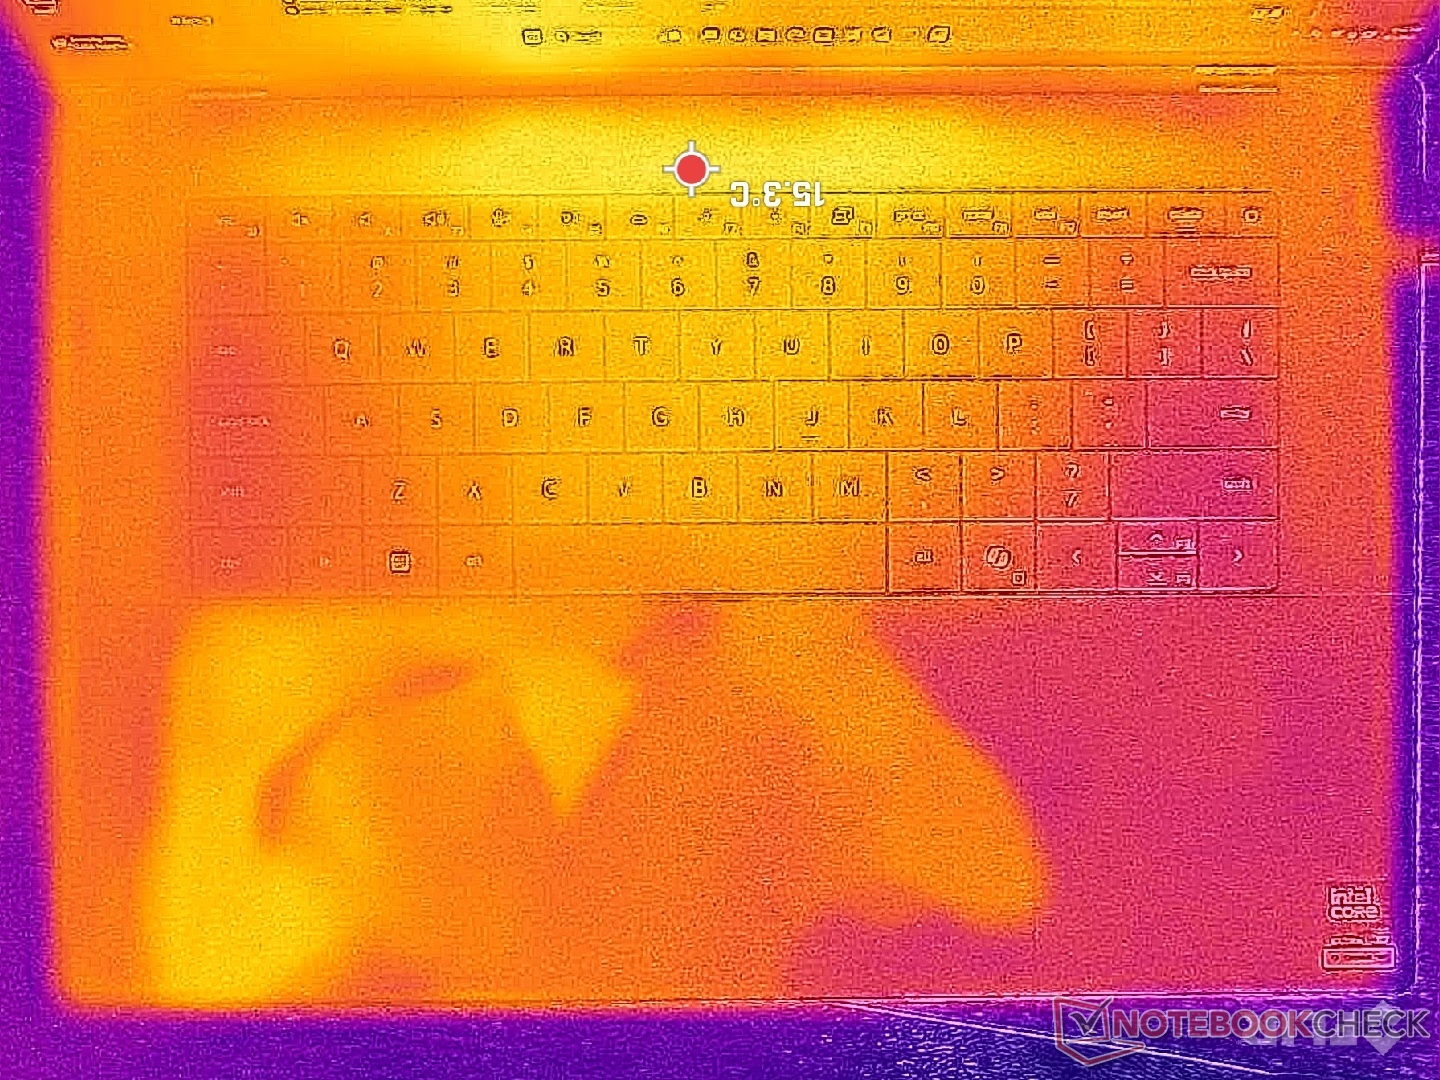
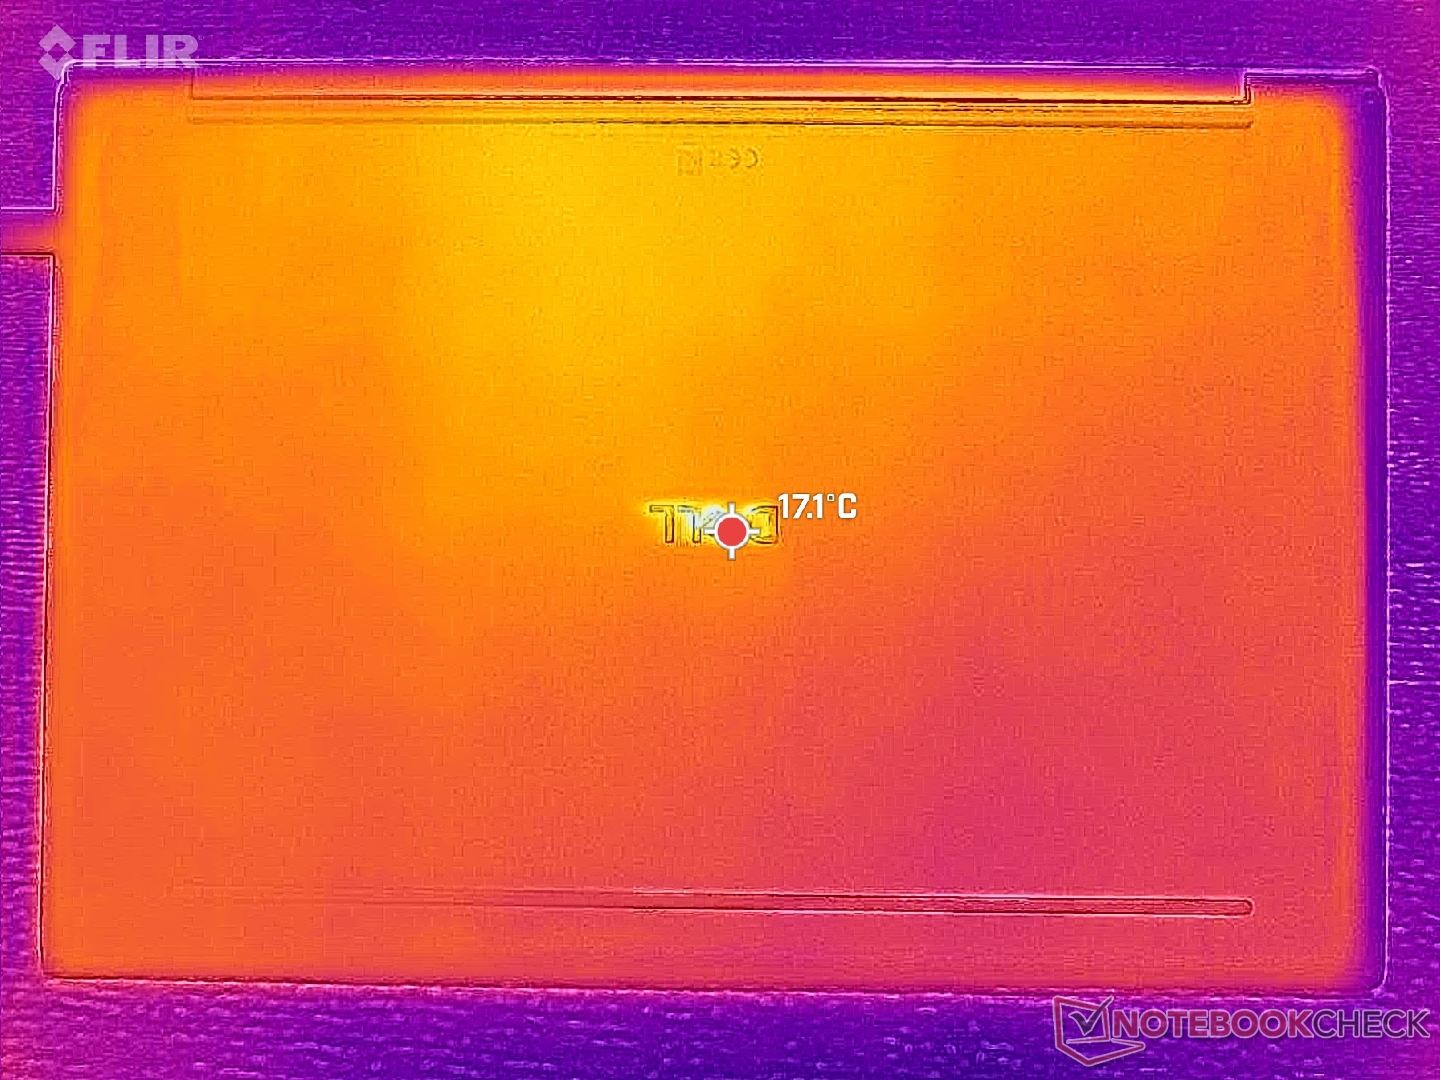
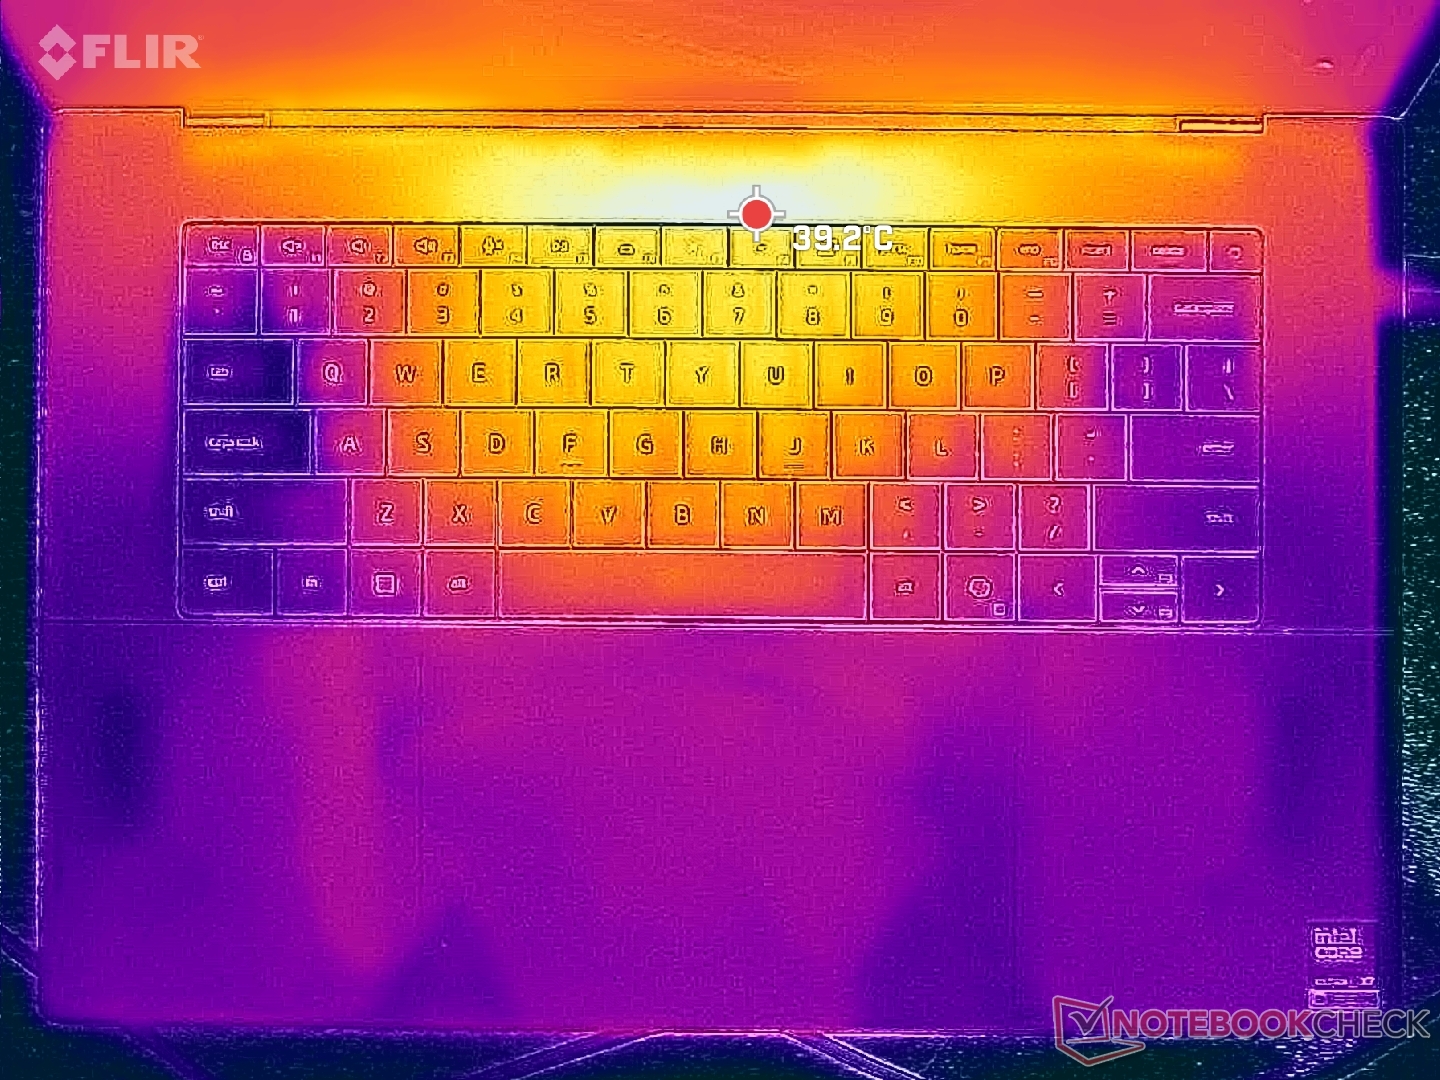
Les températures de surface sont en moyenne plus basses que celles du XPS 16 9640, plus ancien mais plus épais, équipé de cartes graphiques RTX 4070 plus rapides. Les points chauds culminent néanmoins à 40°C près du centre du clavier.
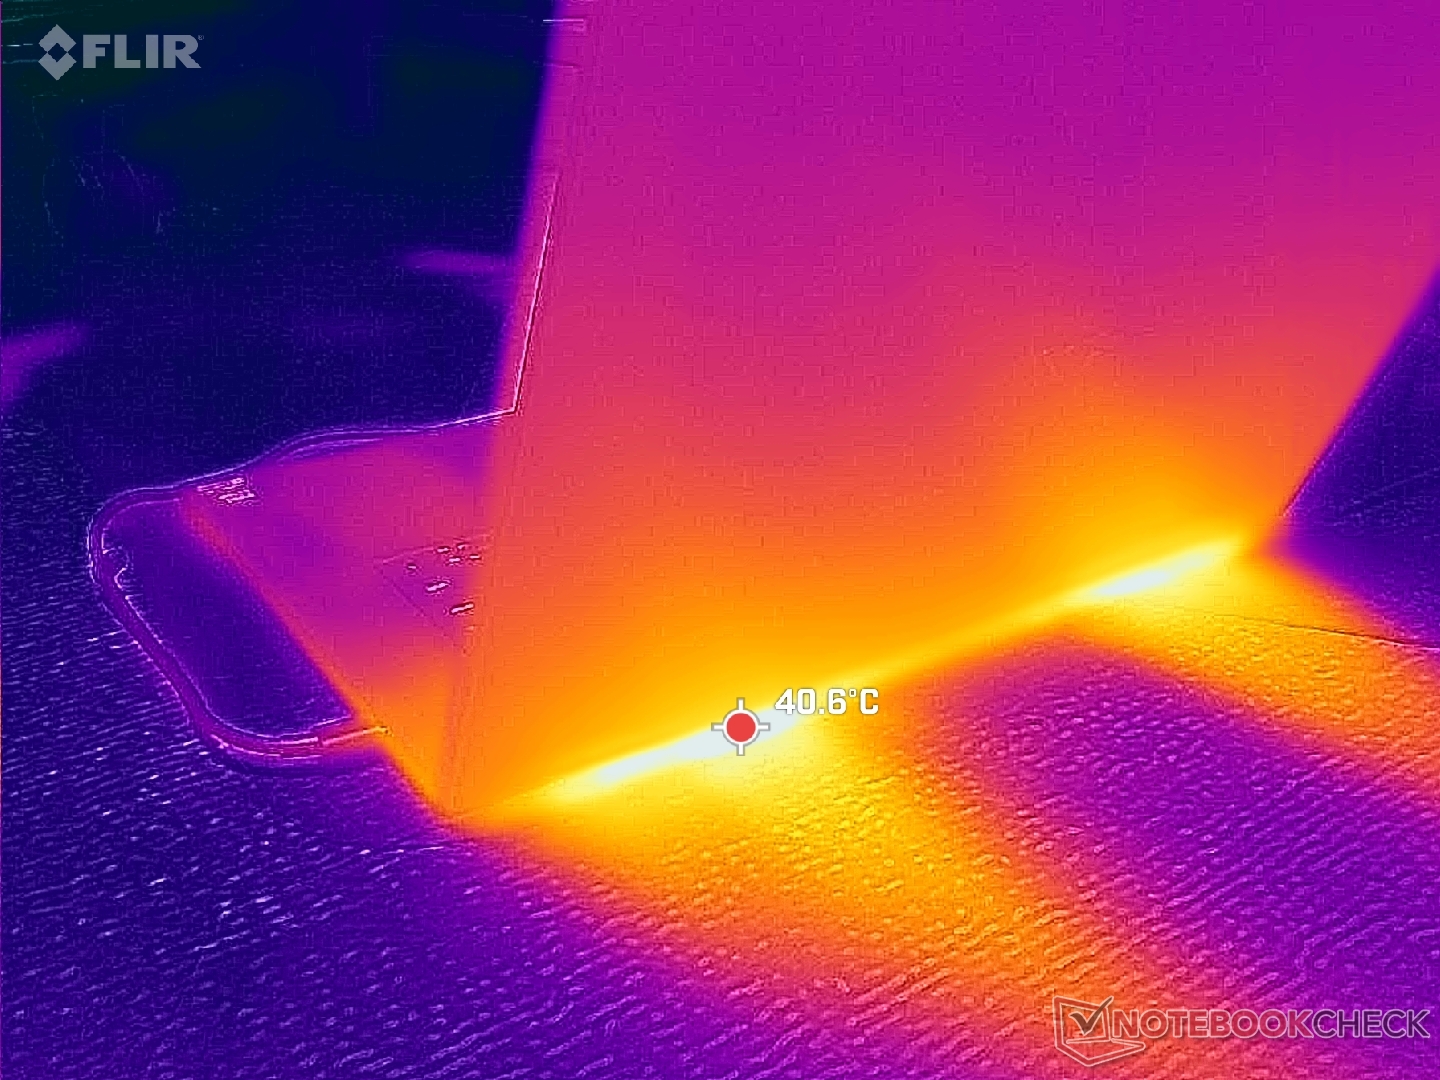
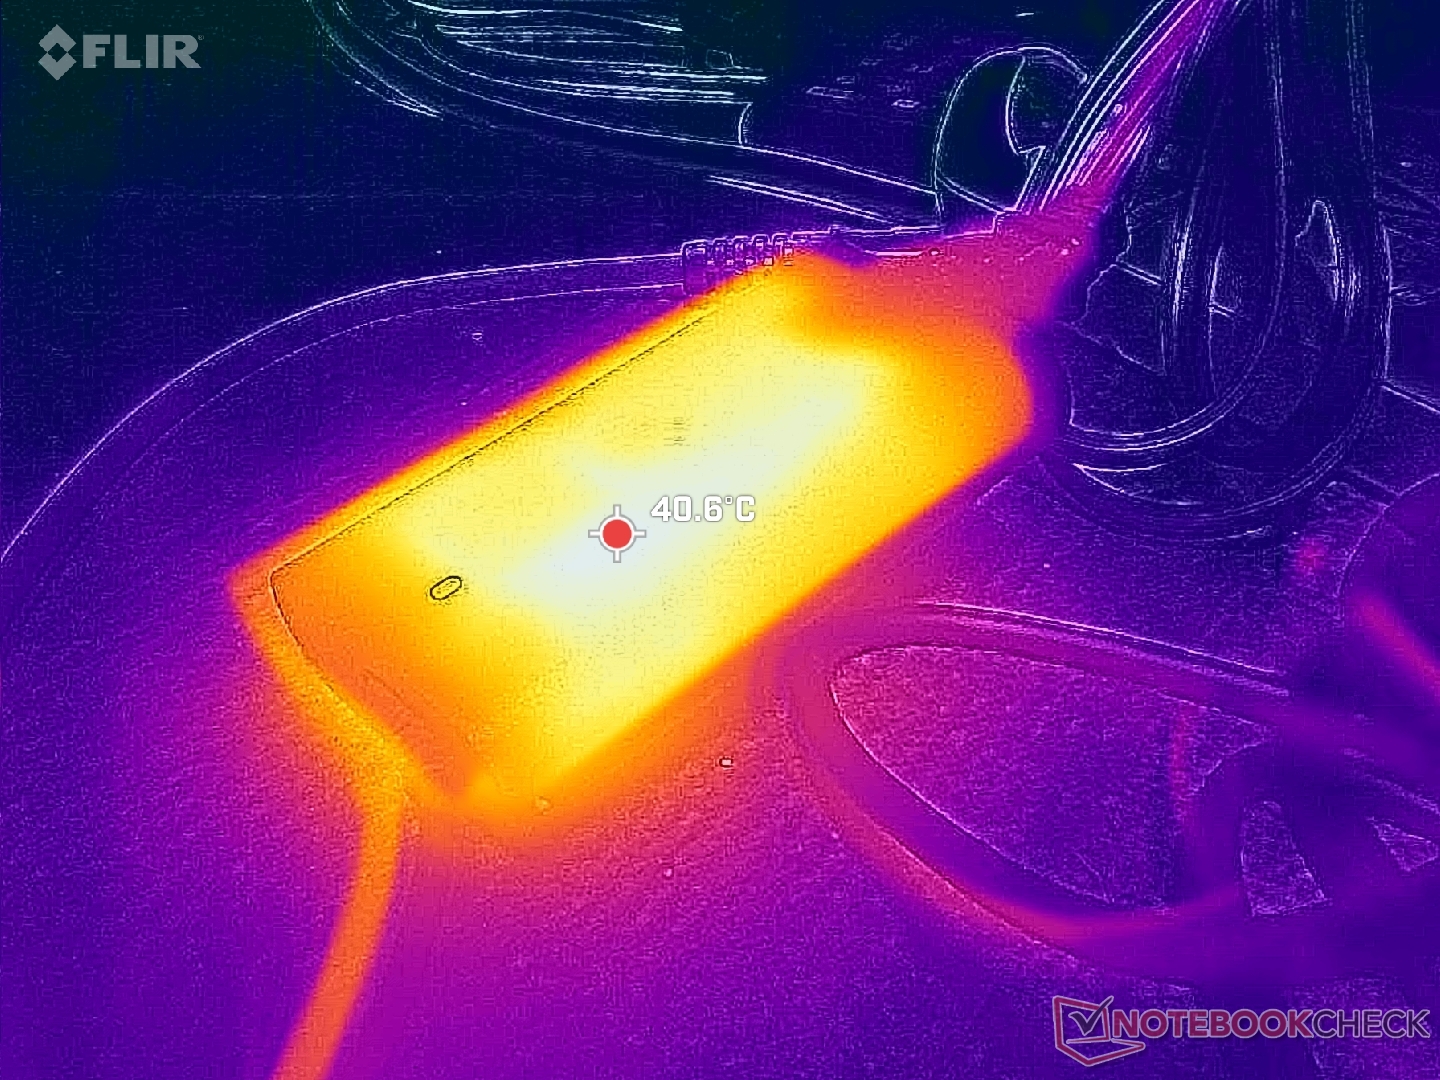
(±) La température maximale du côté supérieur est de 40.6 °C / 105 F, par rapport à la moyenne de 36.8 °C / 98 F, allant de 21 à 71 °C pour la classe Multimedia.
(+) Le fond chauffe jusqu'à un maximum de 39.8 °C / 104 F, contre une moyenne de 39.1 °C / 102 F
(+) En utilisation inactive, la température moyenne du côté supérieur est de 22.3 °C / 72 F, par rapport à la moyenne du dispositif de 31.3 °C / 88 F.
(+) Les repose-poignets et le pavé tactile sont plus froids que la température de la peau avec un maximum de 25.6 °C / 78.1 F et sont donc froids au toucher.
(+) La température moyenne de la zone de l'appui-paume de dispositifs similaires était de 28.7 °C / 83.7 F (+3.1 °C / #5.6 F).
| Dell XPS 16 Core Ultra X7 358H Ultra X7 358H, Arc B390 Panther Lake iGPU | Dell XPS 16 Core Ultra 5 325 Ultra 5 325, Intel Graphics 4 Xe3 PTL | Dell XPS 16 9640 Ultra 7 155H, GeForce RTX 4070 Laptop GPU | Samsung Galaxy Book6 Pro Ultra 7 356H, Intel Graphics 4 Xe3 PTL | Lenovo Yoga Pro 9 16IAH10 RTX 5050 Ultra 9 285H, GeForce RTX 5050 Laptop | HP Omnibook 5 16-af1037nr Ultra 7 255U, Graphics 4-Core iGPU (Arrow Lake) | |
|---|---|---|---|---|---|---|
| Heat | -3% | -7% | 3% | -12% | 6% | |
| Maximum Upper Side * (°C) | 40.6 | 43.8 -8% | 39.4 3% | 37.8 7% | 34.4 15% | 28 31% |
| Maximum Bottom * (°C) | 39.8 | 42 -6% | 36.9 7% | 40.1 -1% | 41.4 -4% | 33.2 17% |
| Idle Upper Side * (°C) | 23.2 | 23.2 -0% | 28.2 -22% | 22.6 3% | 28.6 -23% | 24.6 -6% |
| Idle Bottom * (°C) | 23.8 | 23.6 1% | 27.4 -15% | 22.8 4% | 31.8 -34% | 27.8 -17% |
* ... Moindre est la valeur, meilleures sont les performances
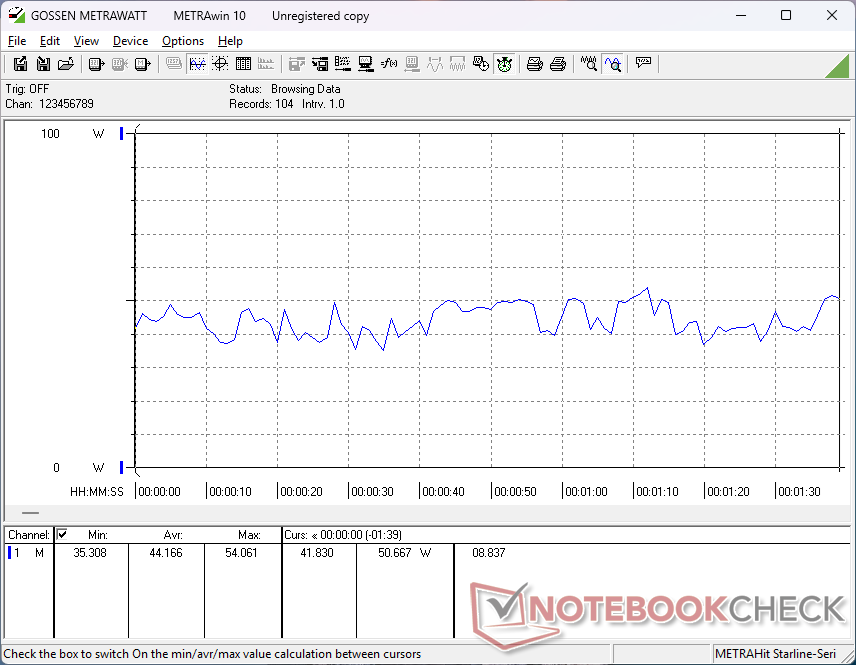
Test de stress
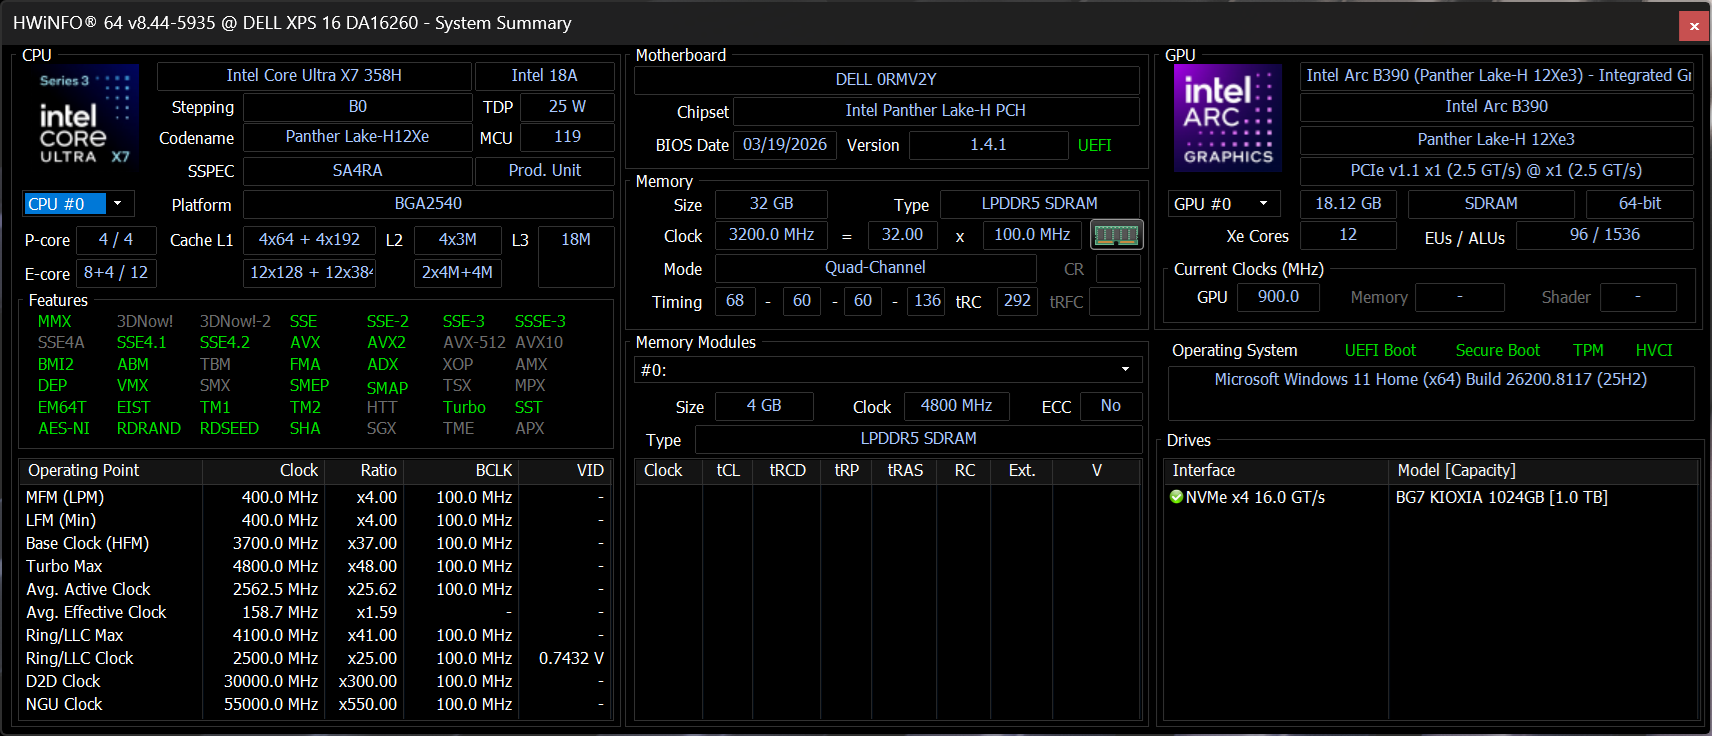
Le CPU atteignait 2,9 GHz, 69 W et 100 C lors de l'exécution du stress Prime95 avant de redescendre à 2,2 GHz, 40 W et 78 C quelques secondes plus tard pour représenter la durabilité limitée de Turbo Boost. L'étranglement complète les résultats de la boucle CineBench R15 xT ci-dessus et le comportement de la consommation d'énergie ci-dessous.
Plus important encore, la température du cœur sous charge est inférieure à celle de la configuration Core Ultra 5 plus lente du XPS 16. Le CPU se stabilise à 78°C et 68°C lors de l'exécution de Prime95 et Cyberpunk 2077, respectivement, par rapport à 86°C et 89°C sur le XPS 16 Core Ultra 5.


| Horloge du CPU (GHz) | Horloge du GPU (MHz) | Température moyenne du CPU (°C) | |
| Système au repos | -- | -- | 44 |
| Prime95 Stress | 2.1 | 900 | 78 |
| Prime95 + FurMark Stress | 1.7 | 1350 | 71 |
| Cyberpunk 2077 Stress | 0.87 | 2150 | 68 |
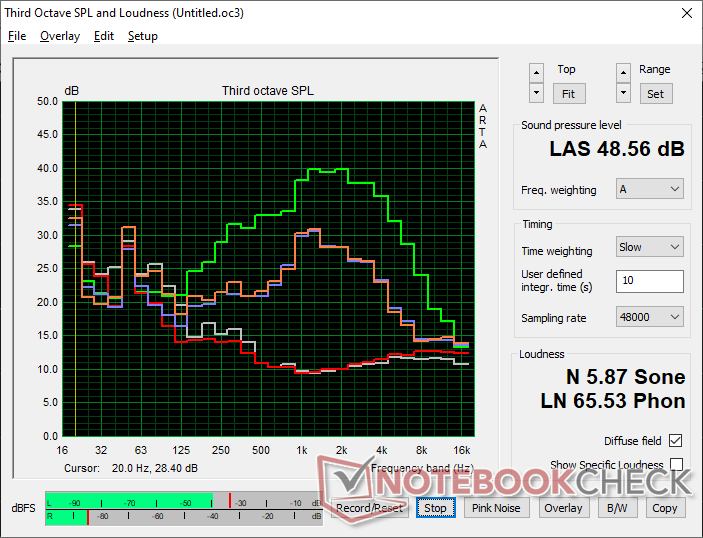
Intervenants
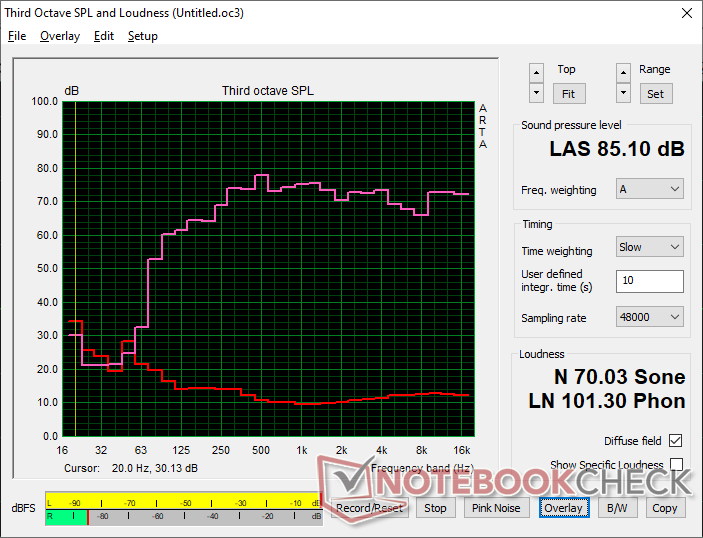
Dell XPS 16 Core Ultra X7 358H analyse audio
(+) | les haut-parleurs peuvent jouer relativement fort (85.1# dB)
Basses 100 - 315 Hz
(±) | basse réduite - en moyenne 7.6% inférieure à la médiane
(+) | les basses sont linéaires (6.1% delta à la fréquence précédente)
Médiums 400 - 2000 Hz
(+) | médiane équilibrée - seulement 2.1% de la médiane
(+) | les médiums sont linéaires (3.4% delta à la fréquence précédente)
Aiguës 2 - 16 kHz
(+) | des sommets équilibrés - à seulement 2.3% de la médiane
(+) | les aigus sont linéaires (4.1% delta à la fréquence précédente)
Globalement 100 - 16 000 Hz
(+) | le son global est linéaire (6.2% différence à la médiane)
Par rapport à la même classe
» 3% de tous les appareils testés de cette catégorie étaient meilleurs, 0% similaires, 96% pires
» Le meilleur avait un delta de 5%, la moyenne était de 17%, le pire était de 45%.
Par rapport à tous les appareils testés
» 0% de tous les appareils testés étaient meilleurs, 0% similaires, 99% pires
» Le meilleur avait un delta de 4%, la moyenne était de 23%, le pire était de 134%.
Apple MacBook Pro 16 2021 M1 Pro analyse audio
(+) | les haut-parleurs peuvent jouer relativement fort (84.7# dB)
Basses 100 - 315 Hz
(+) | bonne basse - seulement 3.8% loin de la médiane
(+) | les basses sont linéaires (5.2% delta à la fréquence précédente)
Médiums 400 - 2000 Hz
(+) | médiane équilibrée - seulement 1.3% de la médiane
(+) | les médiums sont linéaires (2.1% delta à la fréquence précédente)
Aiguës 2 - 16 kHz
(+) | des sommets équilibrés - à seulement 1.9% de la médiane
(+) | les aigus sont linéaires (2.7% delta à la fréquence précédente)
Globalement 100 - 16 000 Hz
(+) | le son global est linéaire (4.6% différence à la médiane)
Par rapport à la même classe
» 0% de tous les appareils testés de cette catégorie étaient meilleurs, 0% similaires, 100% pires
» Le meilleur avait un delta de 5%, la moyenne était de 17%, le pire était de 45%.
Par rapport à tous les appareils testés
» 0% de tous les appareils testés étaient meilleurs, 0% similaires, 100% pires
» Le meilleur avait un delta de 4%, la moyenne était de 23%, le pire était de 134%.
Gestion de l'énergie
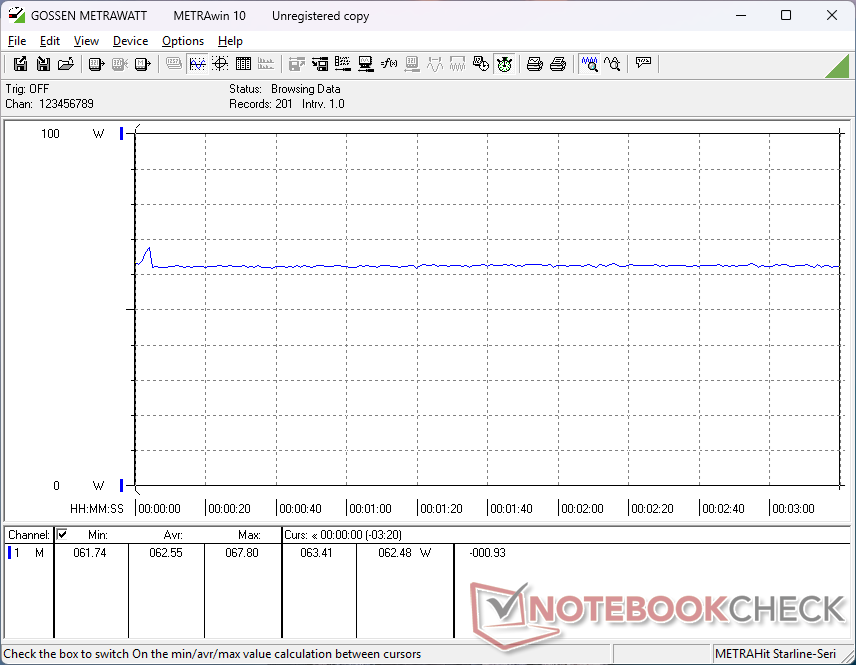
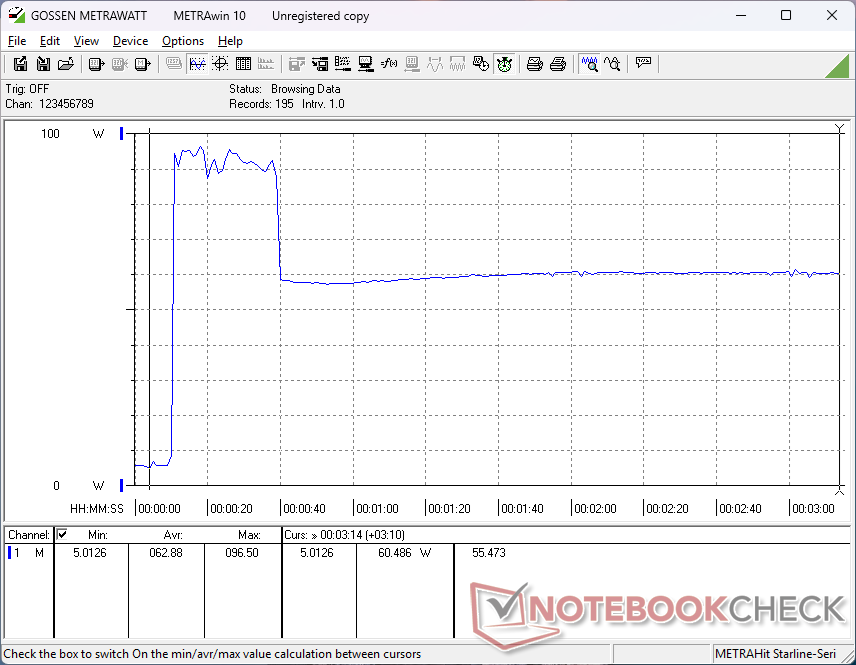
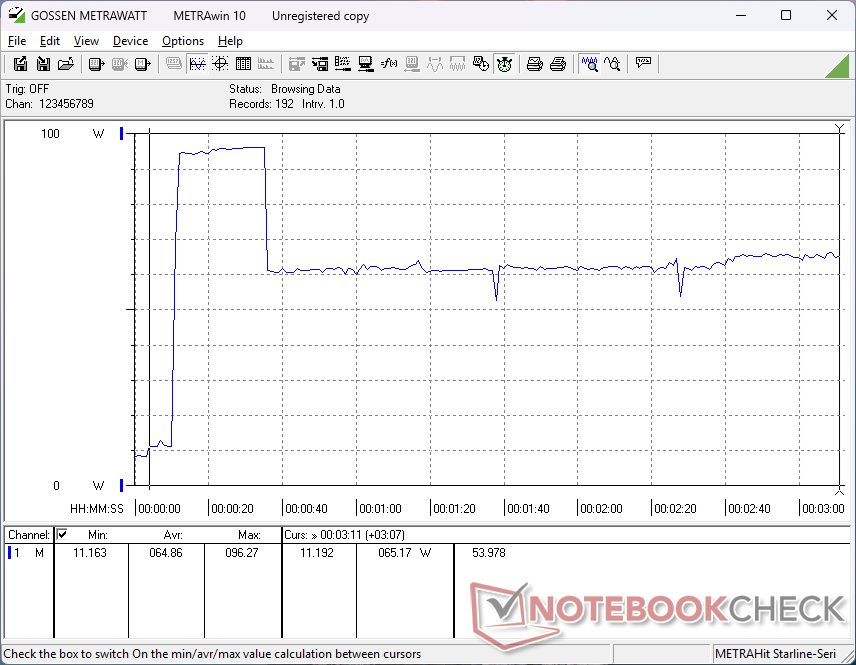
Consommation électrique
La configuration Core Ultra X7 OLED est généralement plus exigeante que la configuration Core Ultra 5 IPS de base, même au ralenti, en raison du panneau OLED. L'exécution de Cyberpunk 2077 et de Prime95 consomme respectivement 38 % et 35 % d'énergie en plus. Toutefois, l'augmentation des performances l'emporte largement sur l'augmentation de la demande en énergie, de sorte que les performances par watt sont toujours plus élevées avec l'option Core Ultra X7.
| Éteint/en veille | |
| Au repos | |
| Fortement sollicité |
|
Légende:
min: | |
| Dell XPS 16 Core Ultra X7 358H Ultra X7 358H, Arc B390 Panther Lake iGPU, , OLED, 3200x2000, 16" | Dell XPS 16 Core Ultra 5 325 Ultra 5 325, Intel Graphics 4 Xe3 PTL, SK hynix PVC10 HFS512GEM4X182N, IPS, 1920x1200, 16" | Dell XPS 16 9640 Ultra 7 155H, GeForce RTX 4070 Laptop GPU, Kioxia XG8 KXG80ZNV1T02, OLED, 3840x2400, 16.3" | Samsung Galaxy Book6 Pro Ultra 7 356H, Intel Graphics 4 Xe3 PTL, Samsung PM9C1b MZVL8512HFLU-00BLL, OLED, 2880x1800, 16" | Lenovo Yoga Pro 9 16IAH10 RTX 5050 Ultra 9 285H, GeForce RTX 5050 Laptop, WD PC SN7100S SDFPMSL-1T00-1101, OLED, 2880x1800, 16" | HP Omnibook 5 16-af1037nr Ultra 7 255U, Graphics 4-Core iGPU (Arrow Lake), , IPS, 1920x1200, 16" | |
|---|---|---|---|---|---|---|
| Power Consumption | 28% | -70% | 25% | -142% | -2% | |
| Idle Minimum * (Watt) | 4 | 1.3 67% | 7.7 -93% | 2.5 37% | 6.8 -70% | 4.8 -20% |
| Idle Average * (Watt) | 4.4 | 4.5 -2% | 10.3 -134% | 4.2 5% | 20.1 -357% | 9.4 -114% |
| Idle Maximum * (Watt) | 10.2 | 4.6 55% | 10.6 -4% | 4.6 55% | 21.6 -112% | 9.7 5% |
| Load Average * (Watt) | 44.2 | 36.5 17% | 76.5 -73% | 42.2 5% | 87.6 -98% | 41.8 5% |
| Cyberpunk 2077 ultra * (Watt) | 62.6 | 47.9 23% | 52.7 16% | 148.2 -137% | 39.5 37% | |
| Cyberpunk 2077 ultra external monitor * (Watt) | 62.4 | 45.4 27% | 40.6 35% | 147.9 -137% | 35.9 42% | |
| Load Maximum * (Watt) | 94.6 | 82.8 12% | 138.5 -46% | 70.8 25% | 173.5 -83% | 66.1 30% |
| Witcher 3 ultra * (Watt) | 126.4 |
* ... Moindre est la valeur, meilleures sont les performances
Consommation électrique Cyberpunk / Stress Test
Consommation électrique du moniteur externe
Autonomie de la batterie
Les durées d'exécution sont significativement plus courtes avec notre Core Ultra X7 3.2K OLED SKU par rapport au Core Ultra 5 FHD IPS SKU de plus de la moitié, même avec Windows VRR activé. Bien qu'une durée de plus de 10 heures soit plus que suffisante pour la plupart des utilisateurs, la différence est notable.
| Dell XPS 16 Core Ultra X7 358H Ultra X7 358H, Arc B390 Panther Lake iGPU, 70 Wh | Dell XPS 16 Core Ultra 5 325 Ultra 5 325, Intel Graphics 4 Xe3 PTL, 70 Wh | Dell XPS 16 9640 Ultra 7 155H, GeForce RTX 4070 Laptop GPU, 99.5 Wh | Samsung Galaxy Book6 Pro Ultra 7 356H, Intel Graphics 4 Xe3 PTL, 78 Wh | Lenovo Yoga Pro 9 16IAH10 RTX 5050 Ultra 9 285H, GeForce RTX 5050 Laptop, 84 Wh | HP Omnibook 5 16-af1037nr Ultra 7 255U, Graphics 4-Core iGPU (Arrow Lake), 59 Wh | |
|---|---|---|---|---|---|---|
| Autonomie de la batterie | 158% | 2% | 58% | 4% | -8% | |
| WiFi v1.3 (h) | 10.3 | 26.6 158% | 10.5 2% | 16.3 58% | 10.7 4% | 9.5 -8% |
| H.264 (h) | 16.5 | |||||
| Load (h) | 1.5 |
Notebookcheck Rating
La configuration Core Ultra X7 XPS 16 est nettement plus convaincante que les options Core Ultra 5 ou Ultra 7 moins performantes. Le modèle abandonne les performances par rapport au Dell 16 Premium de l'année dernière au profit d'un look beaucoup plus fin, plus mince et plus efficace.
Dell XPS 16 Core Ultra X7 358H
- 04/11/2026 v8
Allen Ngo
 Total Sustainability Score:
 Comparaison avec des concurrents potentiels
Image | Modèle | Prix | Poids | Épaisseur | Écran |
|---|---|---|---|---|---|
1. 87.2%  | Dell XPS 16 Core Ultra X7 358H Intel Core Ultra X7 358H ⎘ Intel Arc B390 12 Xe3 Panther Lake iGPU ⎘ 32 Go Mémoire | Amazon: 1. $2,199.00 Dell Premium 16 (XPS 16 2025... 2. $2,599.00 Dell Premium 16 (XPS 16 2025... 3. $1,977.99 Dell Premium 16 (Previously ... Prix de liste: 2350 USD | 1.7 kg | 14.62 mm | 16.00" 3200x2000 236 PPI OLED |
2. 84.2%  | Dell XPS 16 Core Ultra 5 325 Intel Core Ultra 5 325 ⎘ Intel Graphics 4 Xe3 Panther Lake iGPU ⎘ 16 Go Mémoire, 512 Go SSD | Amazon: 1. $2,599.00 Dell Premium 16 (XPS 16 2025... 2. $2,199.00 Dell Premium 16 (XPS 16 2025... 3. $1,977.99 Dell Premium 16 (Previously ... Prix de liste: 1600 USD | 1.7 kg | 15.4 mm | 16.00" 1920x1200 142 PPI IPS |
3. 88.6% v7 (old)  | Dell XPS 16 9640 Intel Core Ultra 7 155H ⎘ NVIDIA GeForce RTX 4070 Laptop GPU ⎘ 32 Go Mémoire, 1024 Go SSD | Amazon: 1. $2,199.00 New XPS 16 9640 Business Lap... 2. $2,499.00 Dell XPS 16 9640 16.3" Touch... 3. $2,799.99 Dell XPS 16 9640 Laptop | In... | 2.3 kg | 18.7 mm | 16.30" 3840x2400 139 PPI OLED |
4. 86.3%  | Samsung Galaxy Book6 Pro Intel Core Ultra 7 356H ⎘ Intel Graphics 4 Xe3 Panther Lake iGPU ⎘ 32 Go Mémoire, 512 Go SSD | Amazon: Prix de liste: 2199€ | 1.6 kg | 11.9 mm | 16.00" 2880x1800 212 PPI OLED |
5. 88.8%  | Lenovo Yoga Pro 9 16IAH10 RTX 5050 Intel Core Ultra 9 285H ⎘ NVIDIA GeForce RTX 5050 Laptop ⎘ 32 Go Mémoire, 1024 Go SSD | Amazon: Prix de liste: 1800 USD | 2 kg | 17.9 mm | 16.00" 2880x1800 212 PPI OLED |
6. 77.8%  | HP Omnibook 5 16-af1037nr Intel Core Ultra 7 255U ⎘ Intel Graphics 4-Core iGPU (Meteor / Arrow Lake) ⎘ 16 Go Mémoire | Amazon: Prix de liste: 660 USD | 1.7 kg | 18.6 mm | 16.00" 1920x1200 142 PPI IPS |
Transparency
La sélection des appareils à examiner est effectuée par notre équipe éditoriale. L'échantillon de test a été prêté à l'auteur par le fabricant ou le détaillant pour les besoins de cet examen. Le prêteur n'a pas eu d'influence sur cette évaluation et le fabricant n'a pas reçu de copie de cette évaluation avant sa publication. Il n'y avait aucune obligation de publier cet article. En tant que média indépendant, Notebookcheck n'est pas soumis à l'autorité des fabricants, des détaillants ou des éditeurs.
Voici comment Notebookcheck teste
Chaque année, Notebookcheck examine de manière indépendante des centaines d'ordinateurs portables et de smartphones en utilisant des procédures standardisées afin de garantir que tous les résultats sont comparables. Nous avons continuellement développé nos méthodes de test depuis environ 20 ans et avons établi des normes industrielles dans le processus. Dans nos laboratoires de test, des équipements de mesure de haute qualité sont utilisés par des techniciens et des rédacteurs expérimentés. Ces tests impliquent un processus de validation en plusieurs étapes. Notre système d'évaluation complexe repose sur des centaines de mesures et de points de référence bien fondés, ce qui garantit l'objectivité.
