 Deutsch
 English
 Español
 Français
 Italiano
 Nederlands
 Polski
 Português
 Русский
 Türkçe
 Svenska
 Chinese
 Magyar
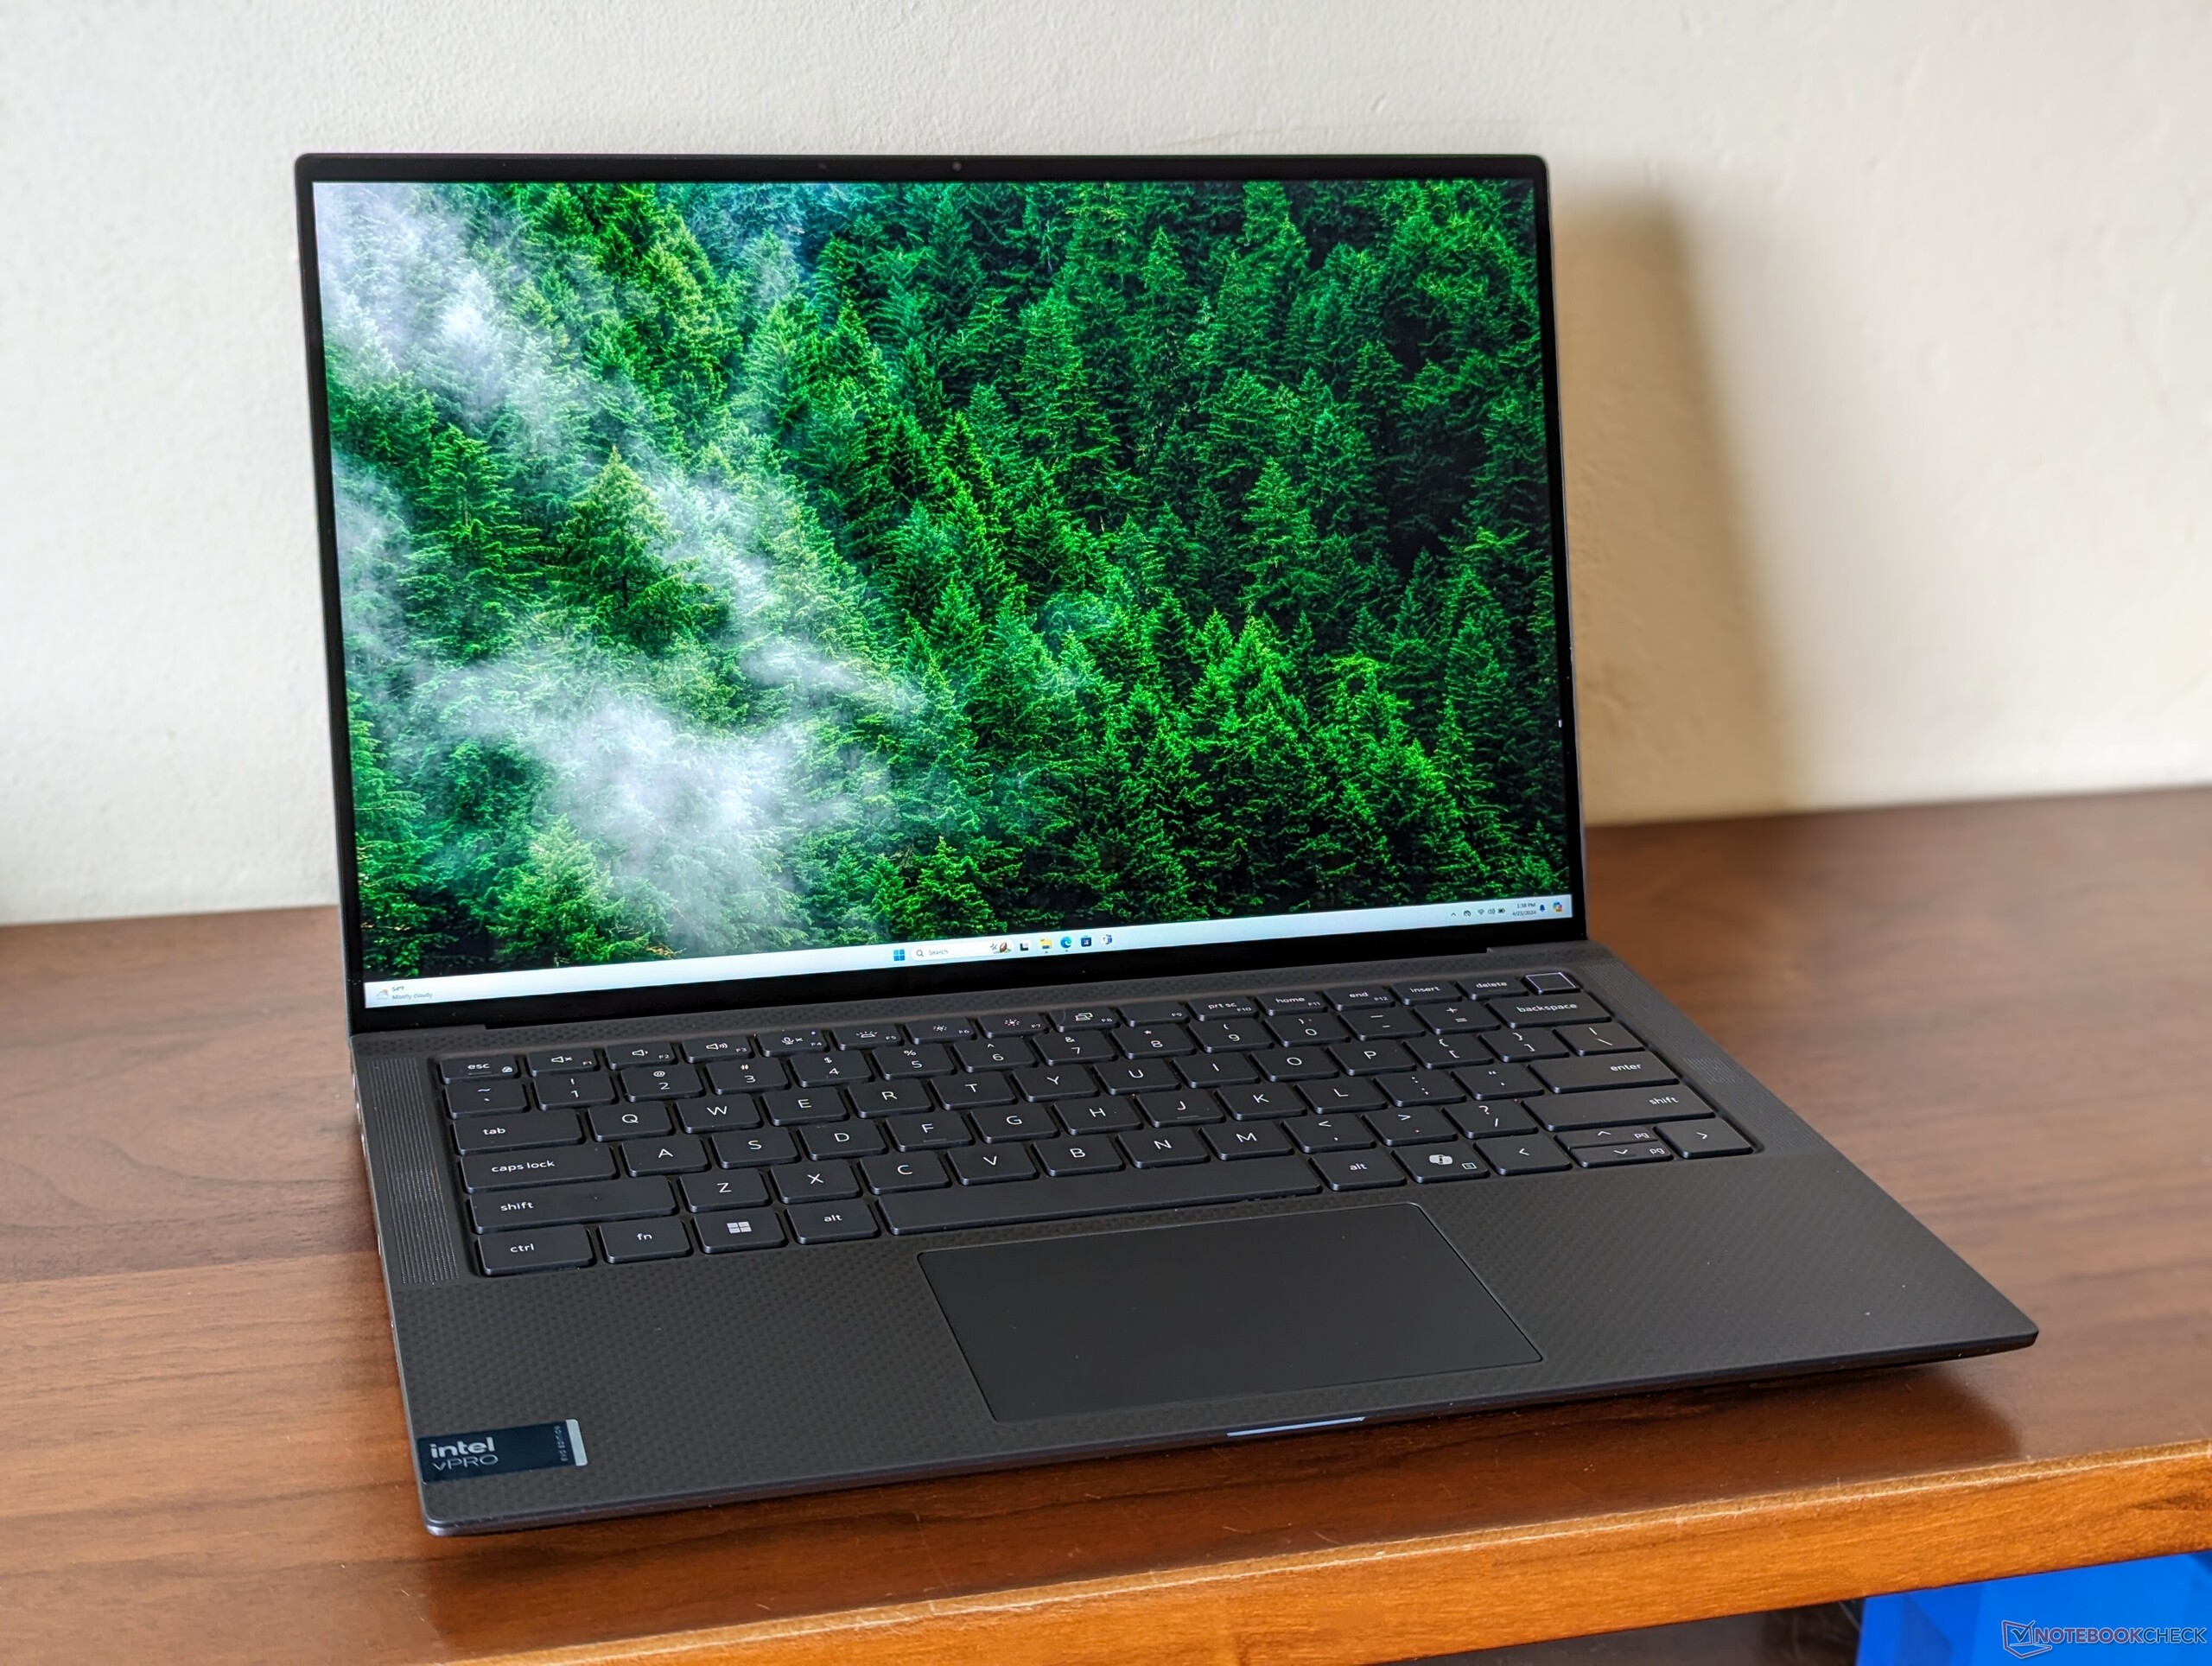
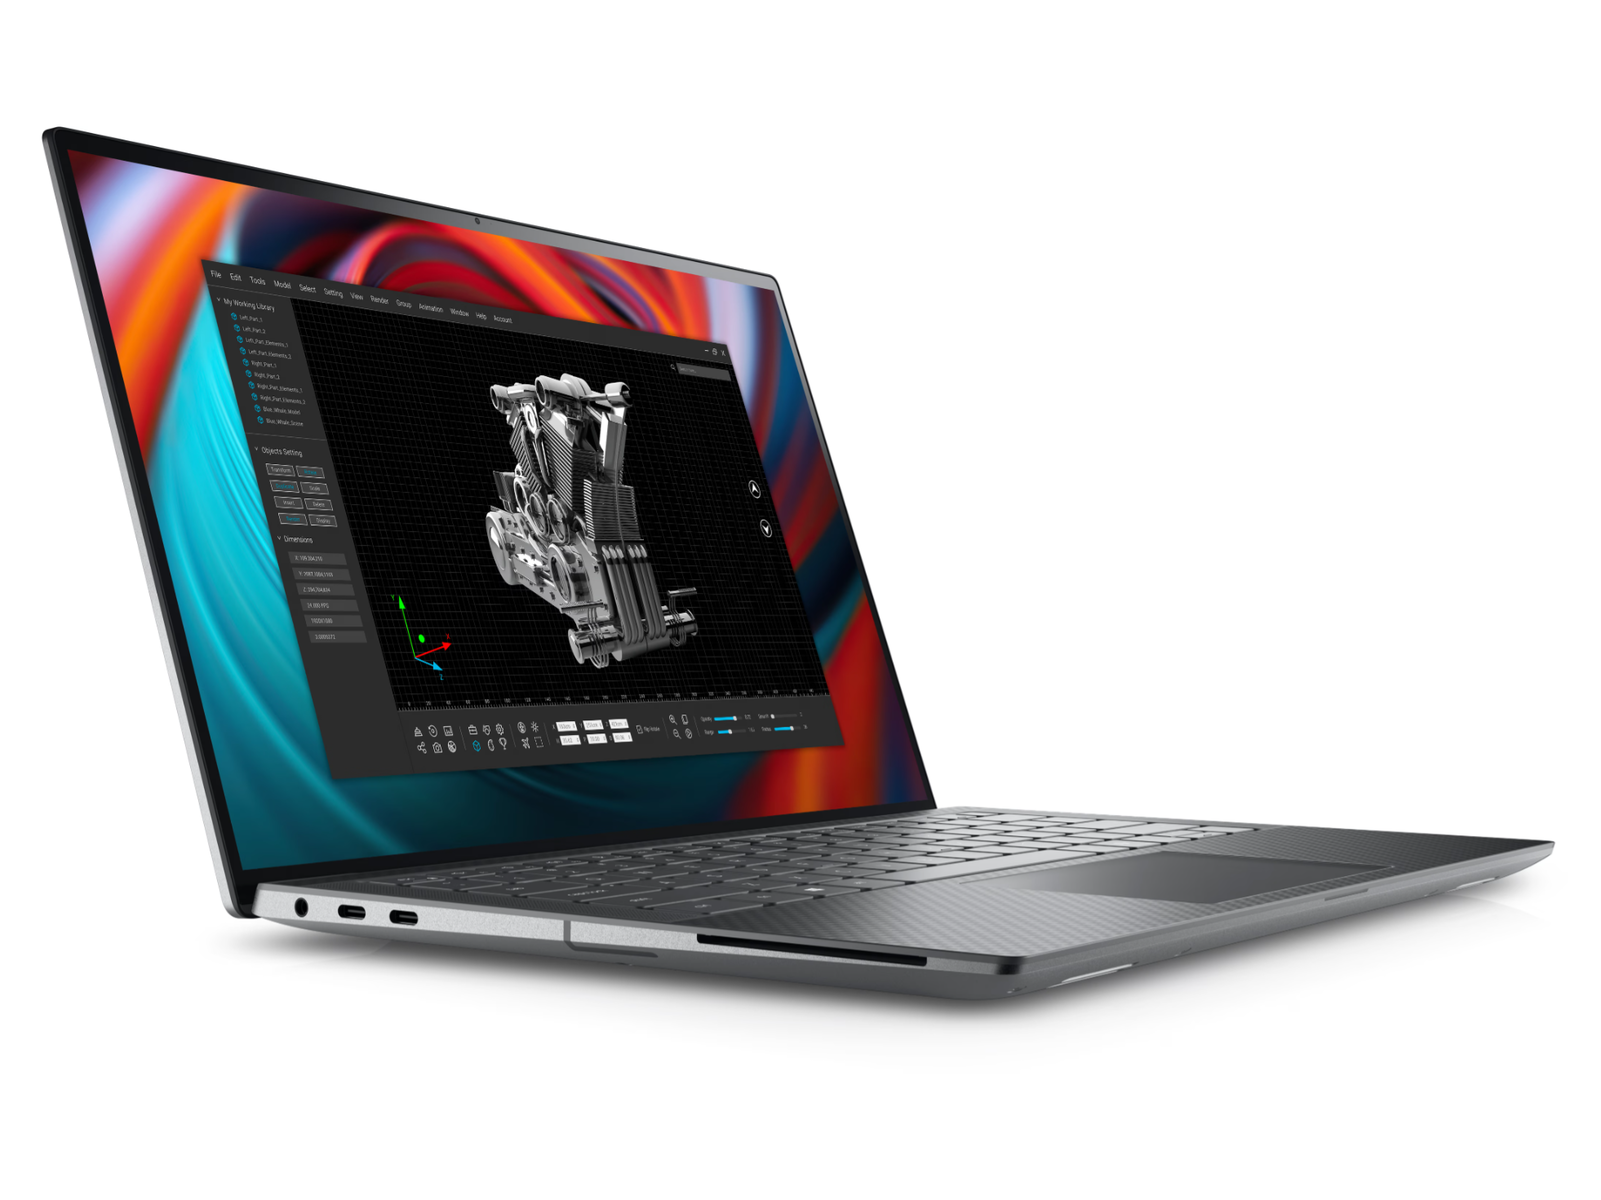
Test du Dell Precision 5490 : maintenant avec Intel Meteor Lake-H vPro

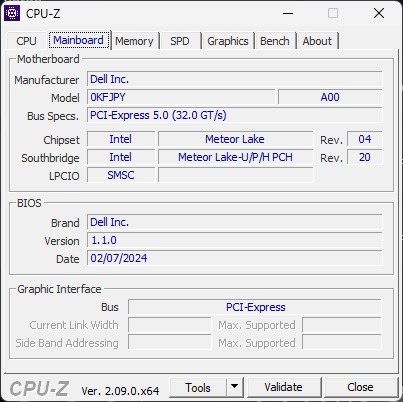
Le 2024 Precision 5490 est une mise à jour du Precision 5480 de l'année dernière. Le dernier modèle utilise le même design de châssis que les Precision 5480 et 5470 ce qui signifie que tous nos commentaires sur les caractéristiques physiques du Precision 5470 s'appliquent également au 5490.
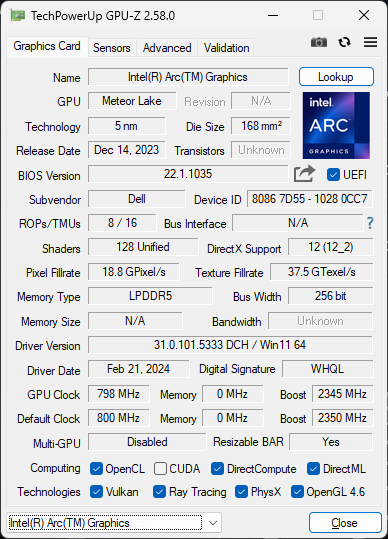
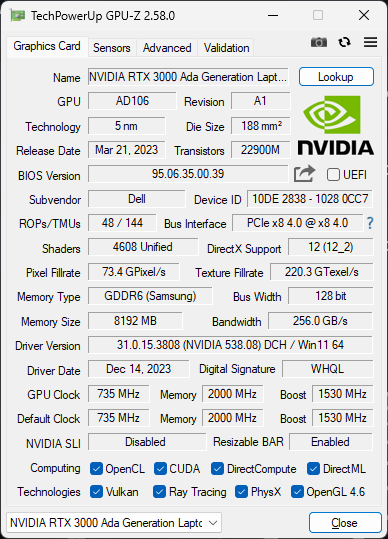
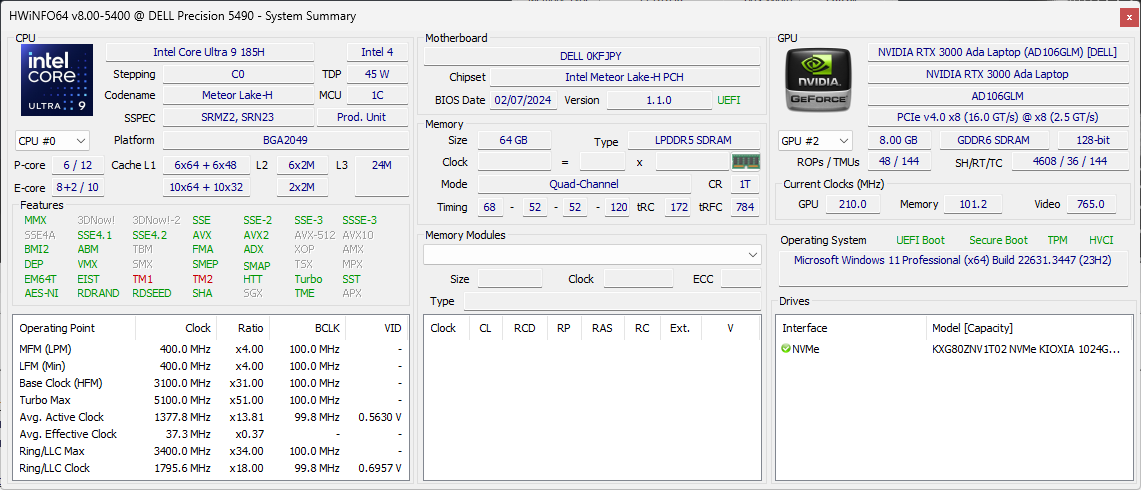
Notre unité de test est la configuration haut de gamme avec le CPU Meteor Lake-H Core Ultra 9 185H pour remplacer les options Raptor Lake-H de l'année dernière. Sinon, tout le reste reste inchangé, y compris l'écran tactile IPS QHD+ 2560 x 1600 et le GPU Nvidia RTX 3000 Ada de 50 W. Les SKUs moins importants peuvent être livrés avec le Core Ultra 5 135H, un écran FHD+ 1920 x 1200, et seulement une carte graphique Arc intégrée à la place.
Parmi les concurrents directs du Precision 5490 figurent d'autres stations de travail ultraportables de 14 pouces, comme le Lenovo ThinkPad P14s ou le HP ZBook Firefly 14 G10.
Plus d'avis sur Dell :
Comparaison avec les concurrents potentiels
Note | Date | Modèle | Poids | Épaisseur | Taille | Résolution | Meilleur prix |
|---|---|---|---|---|---|---|---|
| 89.3 % | 04/24 | Dell Precision 5000 5490 Ultra 9 185H, NVIDIA RTX 3000 Ada Generation Laptop GPU | 1.6 kg | 18.95 mm | 14.00" | 2560x1600 | |
| Lenovo ThinkPad P14s G4 21HF0017GE i7-1370P, RTX A500 Laptop GPU | 1.5 kg | 22.7 mm | 14.00" | 2880x1800 | |||
| 87.4 % | 10/23 | HP ZBook Firefly 14 G10 A R5 PRO 7640HS, Radeon 760M | 1.5 kg | 20 mm | 14.00" | 1920x1200 | |
| 87.4 % | HP ZBook Firefly 14 G9-6B8A2EA i7-1265U, T550 Laptop GPU | 1.5 kg | 19.9 mm | 14.00" | 1920x1200 | ||
| 89.6 % | 09/23 | Dell Precision 5480 i9-13900H, NVIDIA RTX 3000 Ada Generation Laptop GPU | 1.6 kg | 18.95 mm | 14.00" | 2560x1600 | |
| 87.6 % | 09/22 | Dell Precision 5000 5470 i9-12900H, RTX A1000 Laptop GPU | 1.6 kg | 18.95 mm | 14.00" | 2560x1600 |
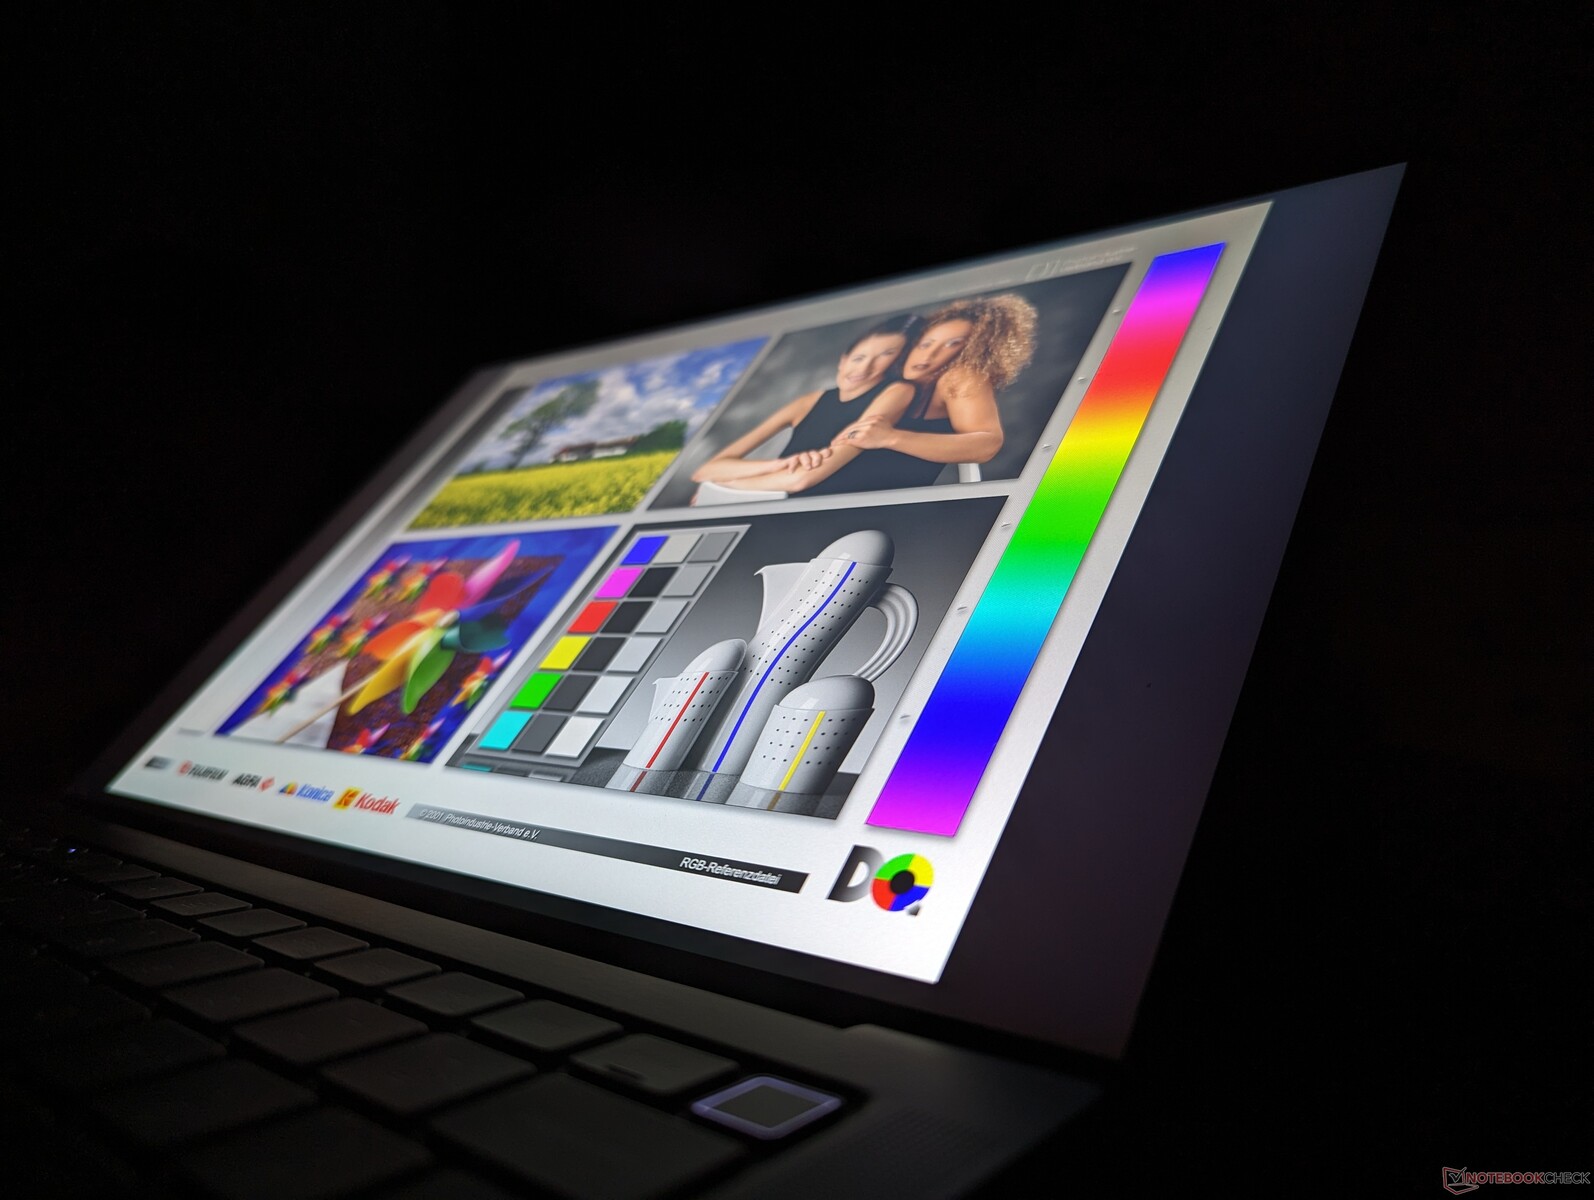
Boîtier - Inspired By XPS
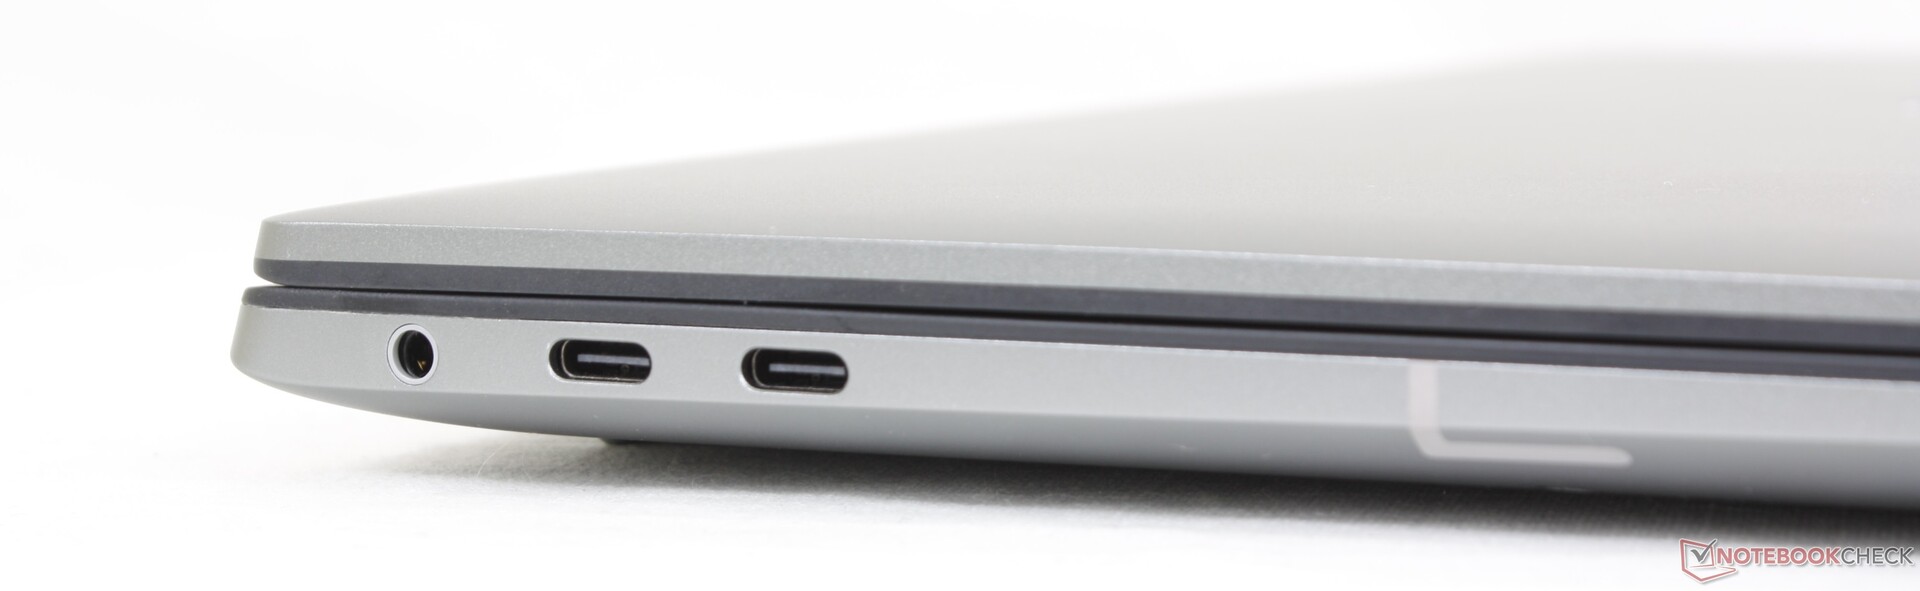
La façon la plus simple de distinguer visuellement le Precision 5490 du Precision 5480 ou 5470 est de chercher la nouvelle touche Co-Pilot sur le clavier. Microsoft exige de tous les grands fabricants qu'ils utilisent cette touche dédiée afin de mieux prendre en charge les prochaines fonctionnalités de Windows AI. Pour le reste, il n'y a pas d'autres changements au niveau du châssis. Nous vous recommandons de consulter notre avis sur le Precision 5470 pour plus d'informations.
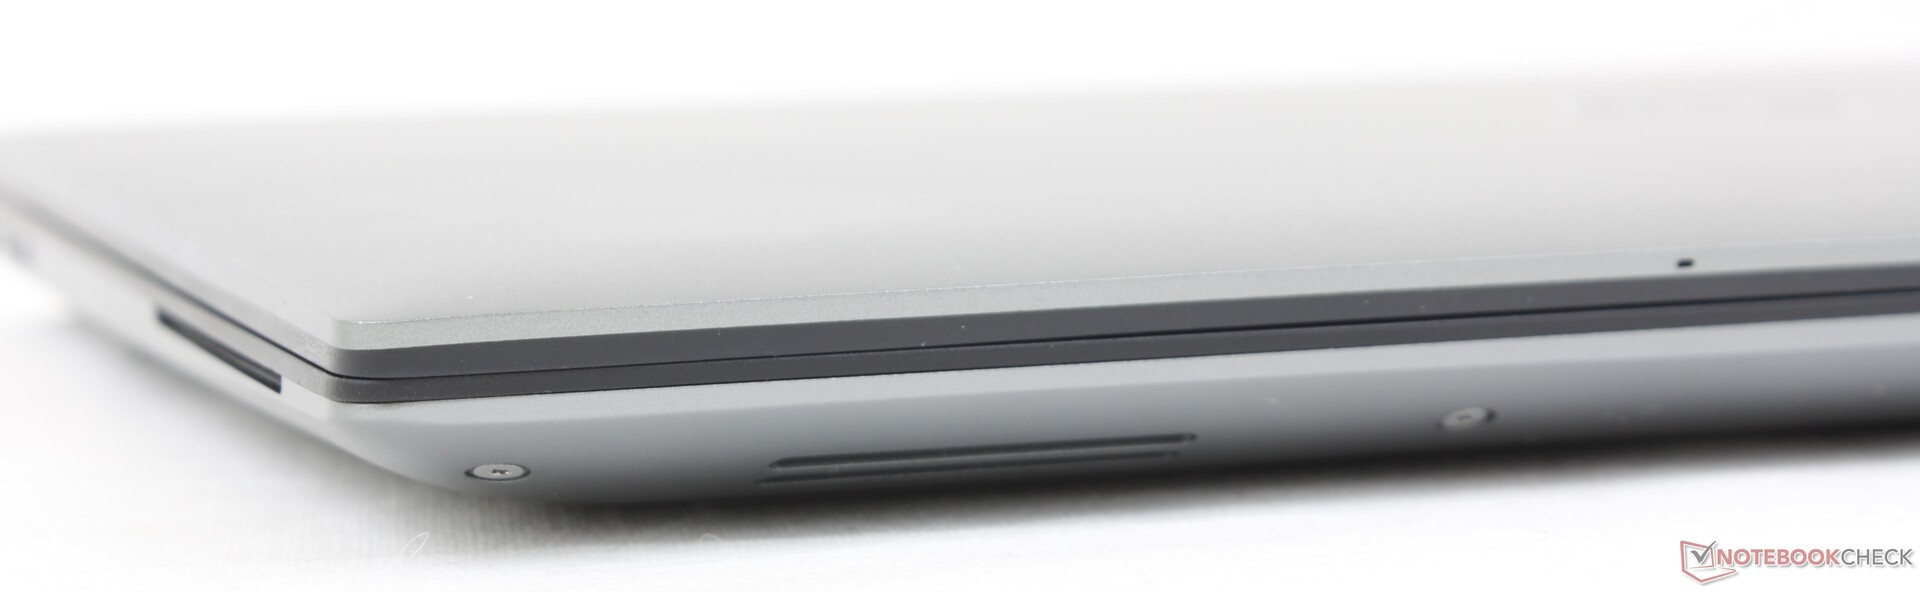
Notez que le lecteur de carte MicroSD reste optionnel.
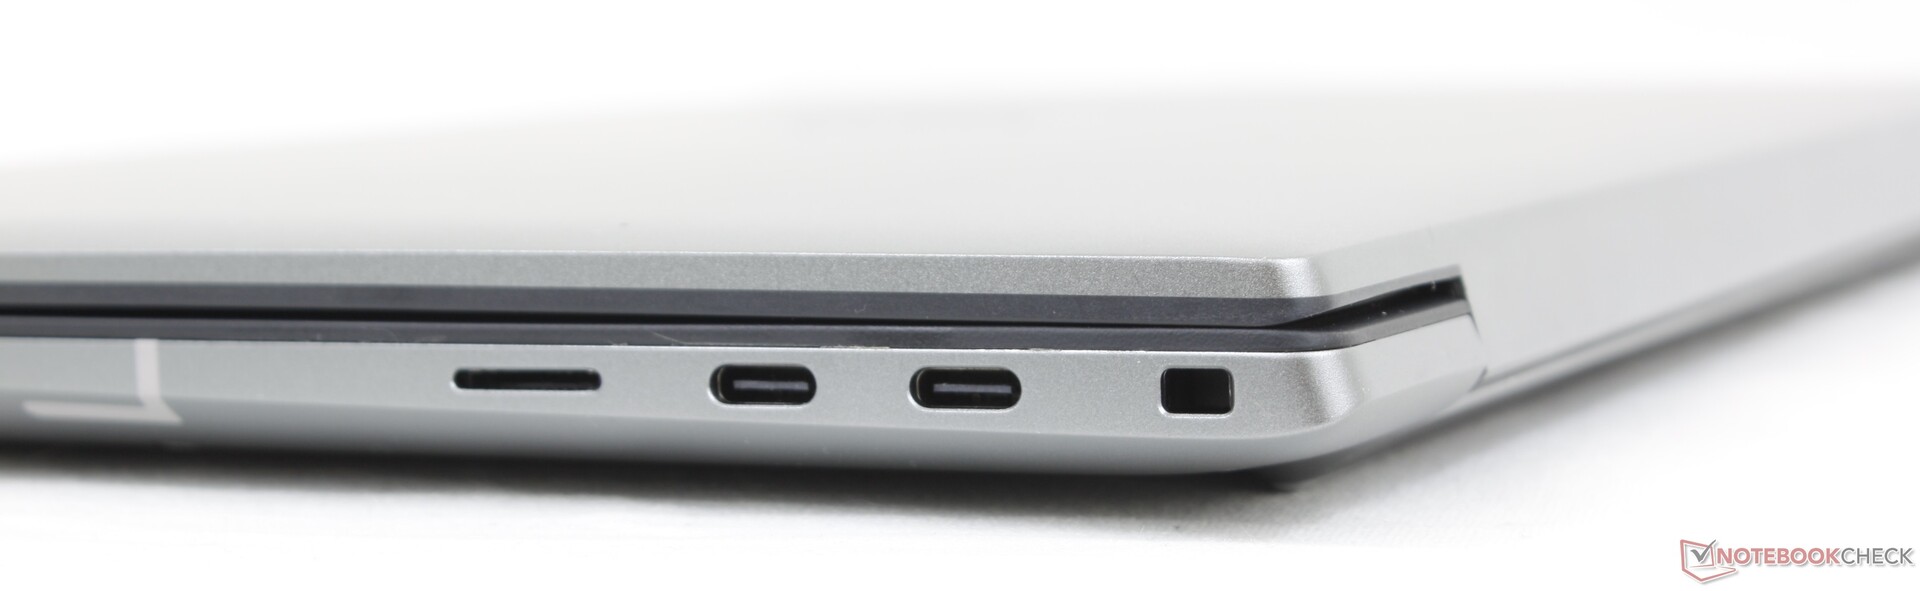
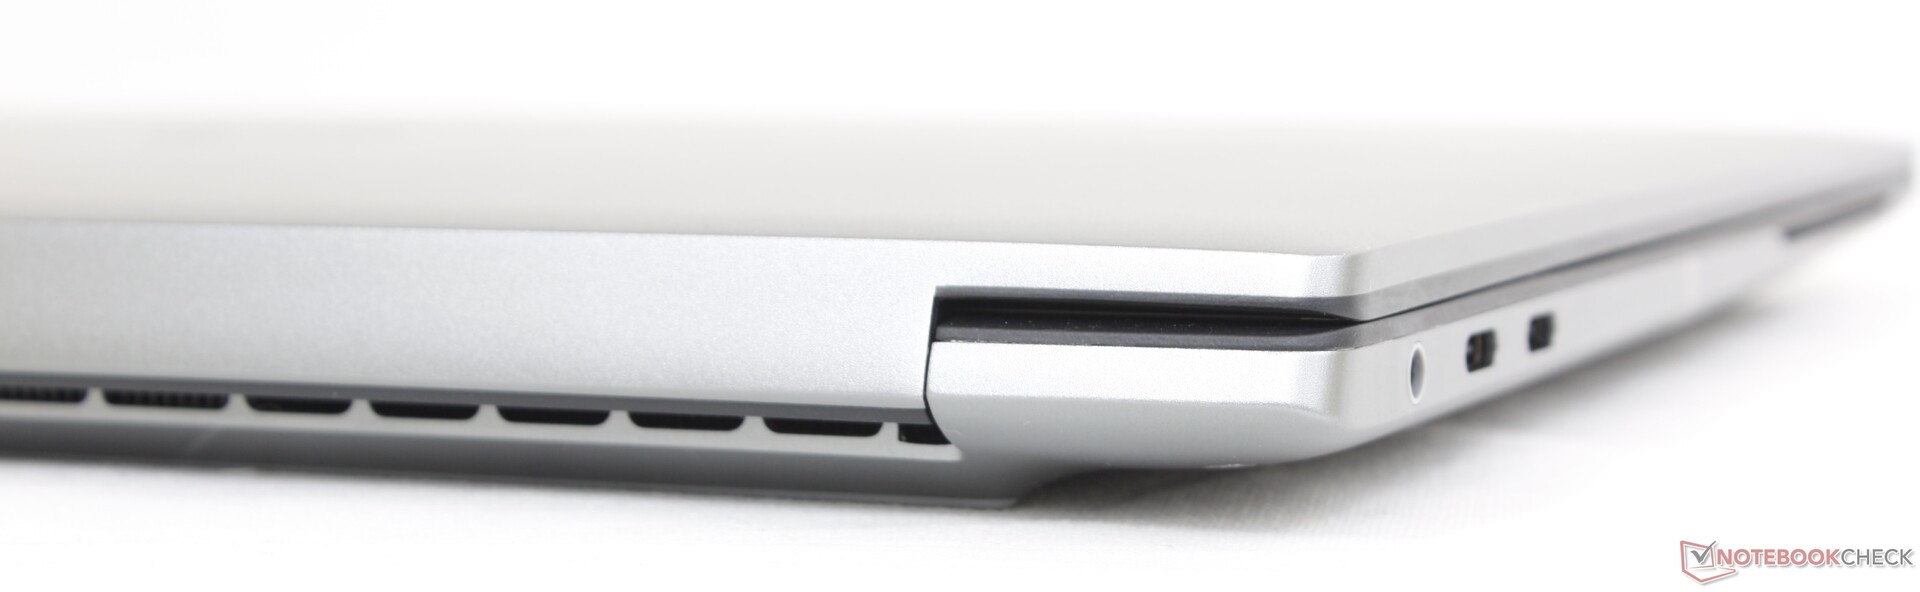
Connectivité
Communication
Le modèle de cette année intègre l'Intel BE200 pour être compatible avec le Wi-Fi 7.
| Networking | |
| iperf3 transmit AXE11000 | |
| Dell Precision 5480 | |
| Dell Precision 5000 5490 | |
| HP ZBook Firefly 14 G10 A | |
| Lenovo ThinkPad P14s G4 21HF0017GE | |
| iperf3 receive AXE11000 | |
| HP ZBook Firefly 14 G10 A | |
| Lenovo ThinkPad P14s G4 21HF0017GE | |
| Dell Precision 5480 | |
| Dell Precision 5000 5490 | |
| iperf3 transmit AXE11000 6GHz | |
| Dell Precision 5000 5490 | |
| Dell Precision 5480 | |
| Dell Precision 5000 5470 | |
| Lenovo ThinkPad P14s G4 21HF0017GE | |
| iperf3 receive AXE11000 6GHz | |
| Lenovo ThinkPad P14s G4 21HF0017GE | |
| Dell Precision 5000 5490 | |
| Dell Precision 5480 | |
| Dell Precision 5000 5470 | |
Webcam


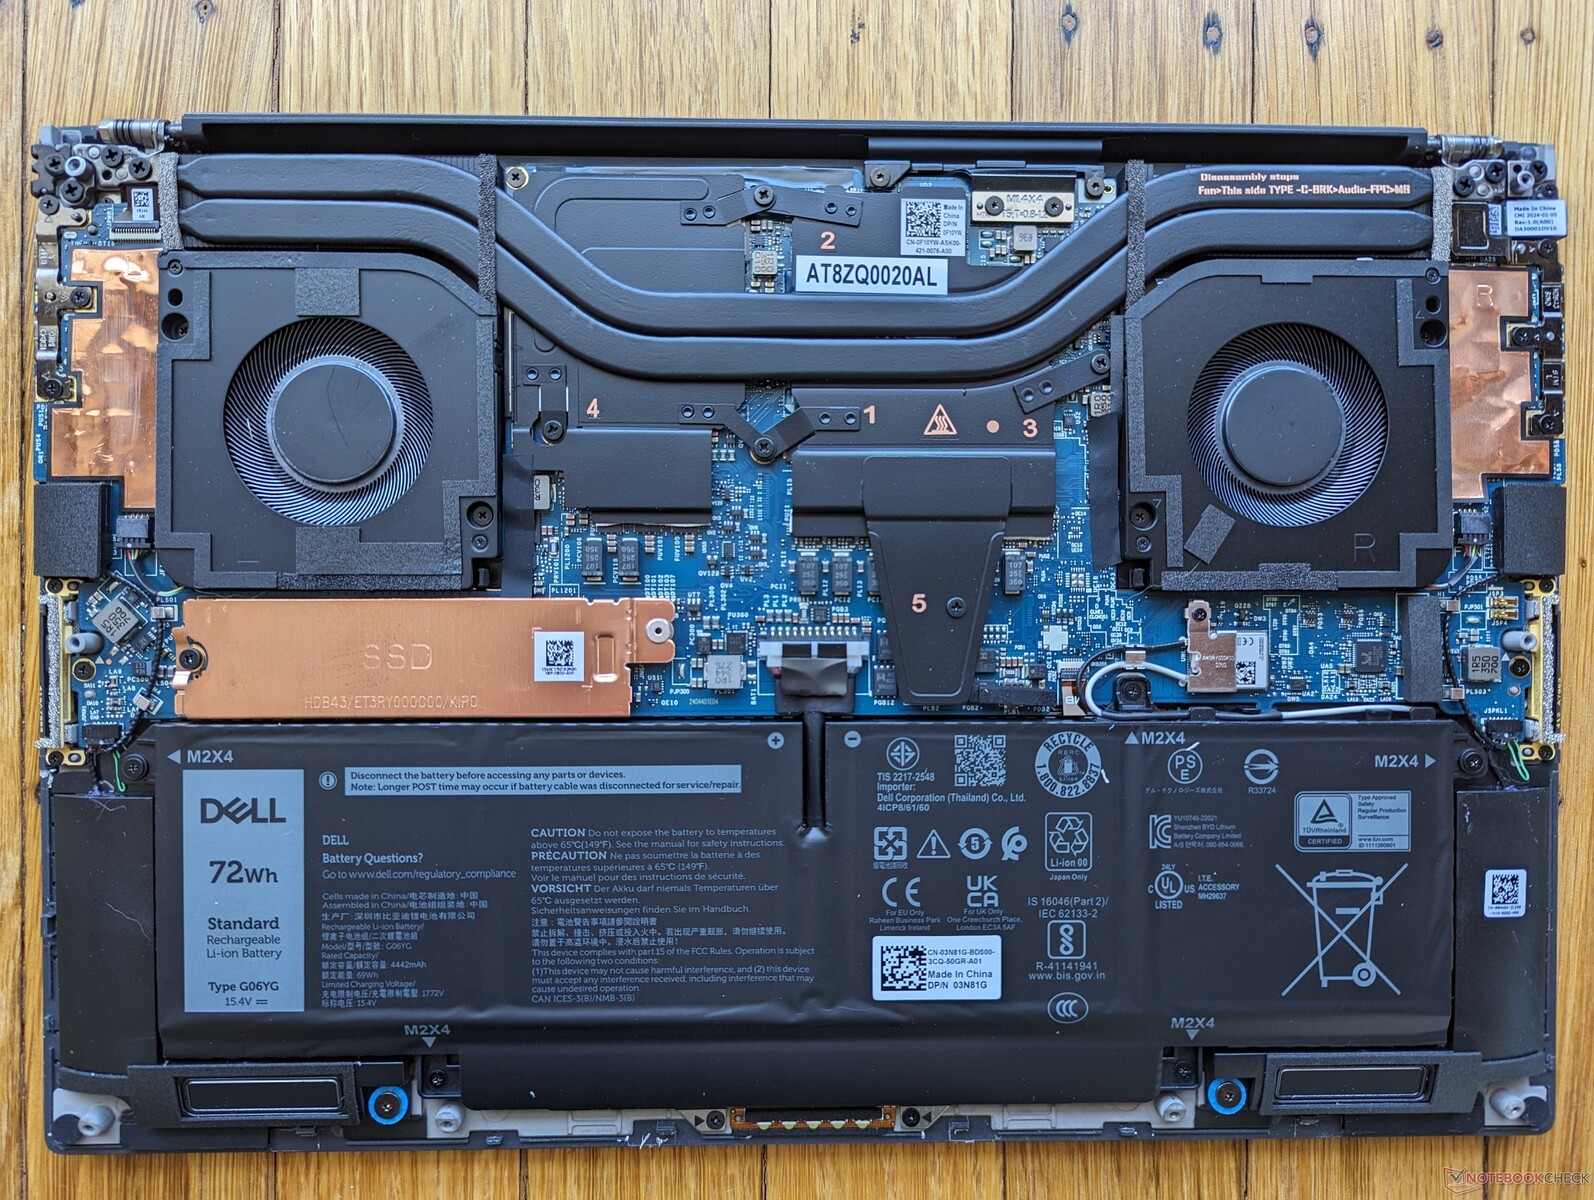
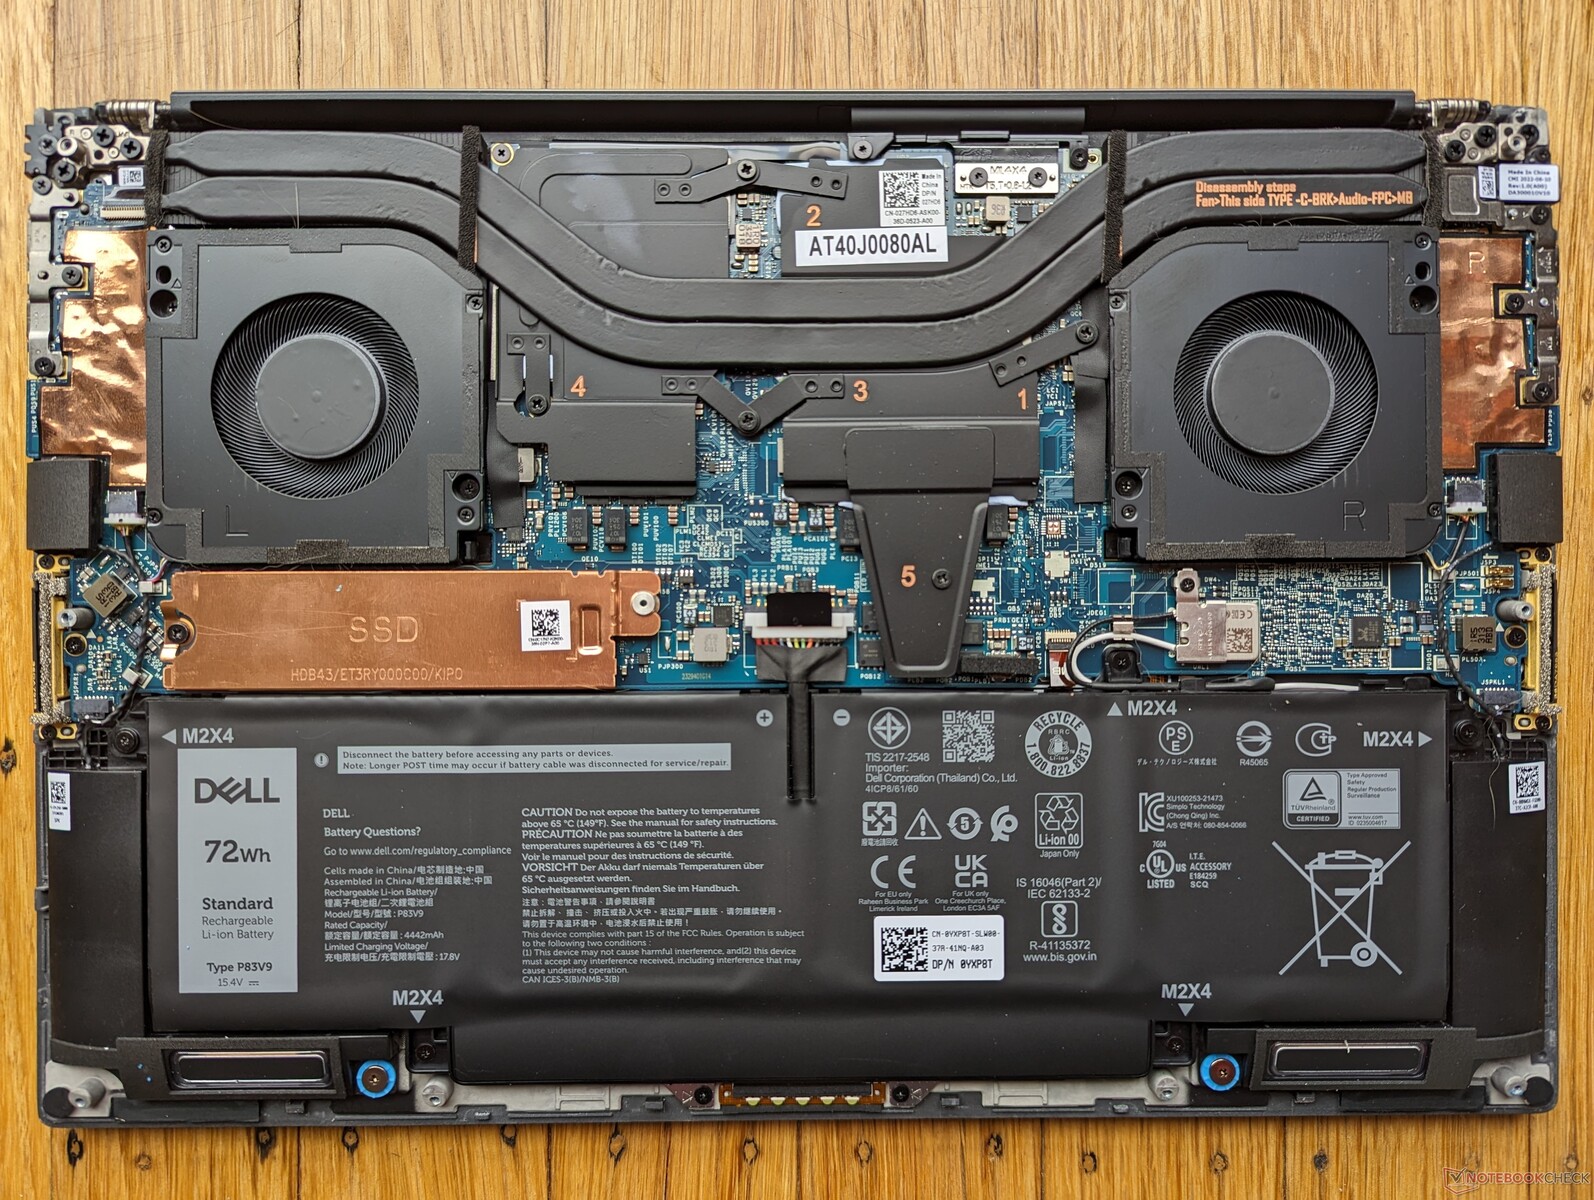
Maintenance
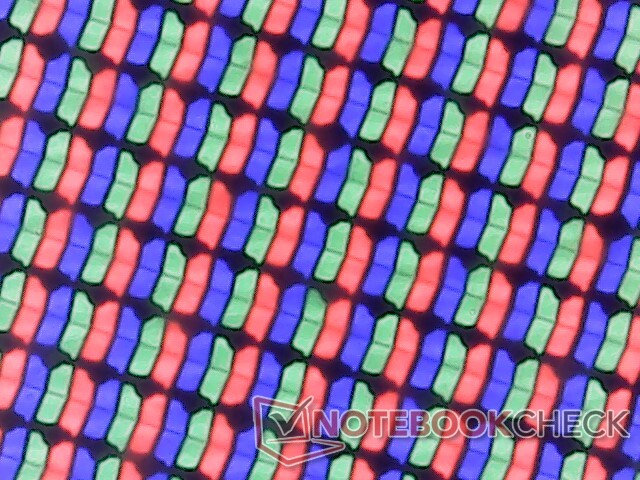
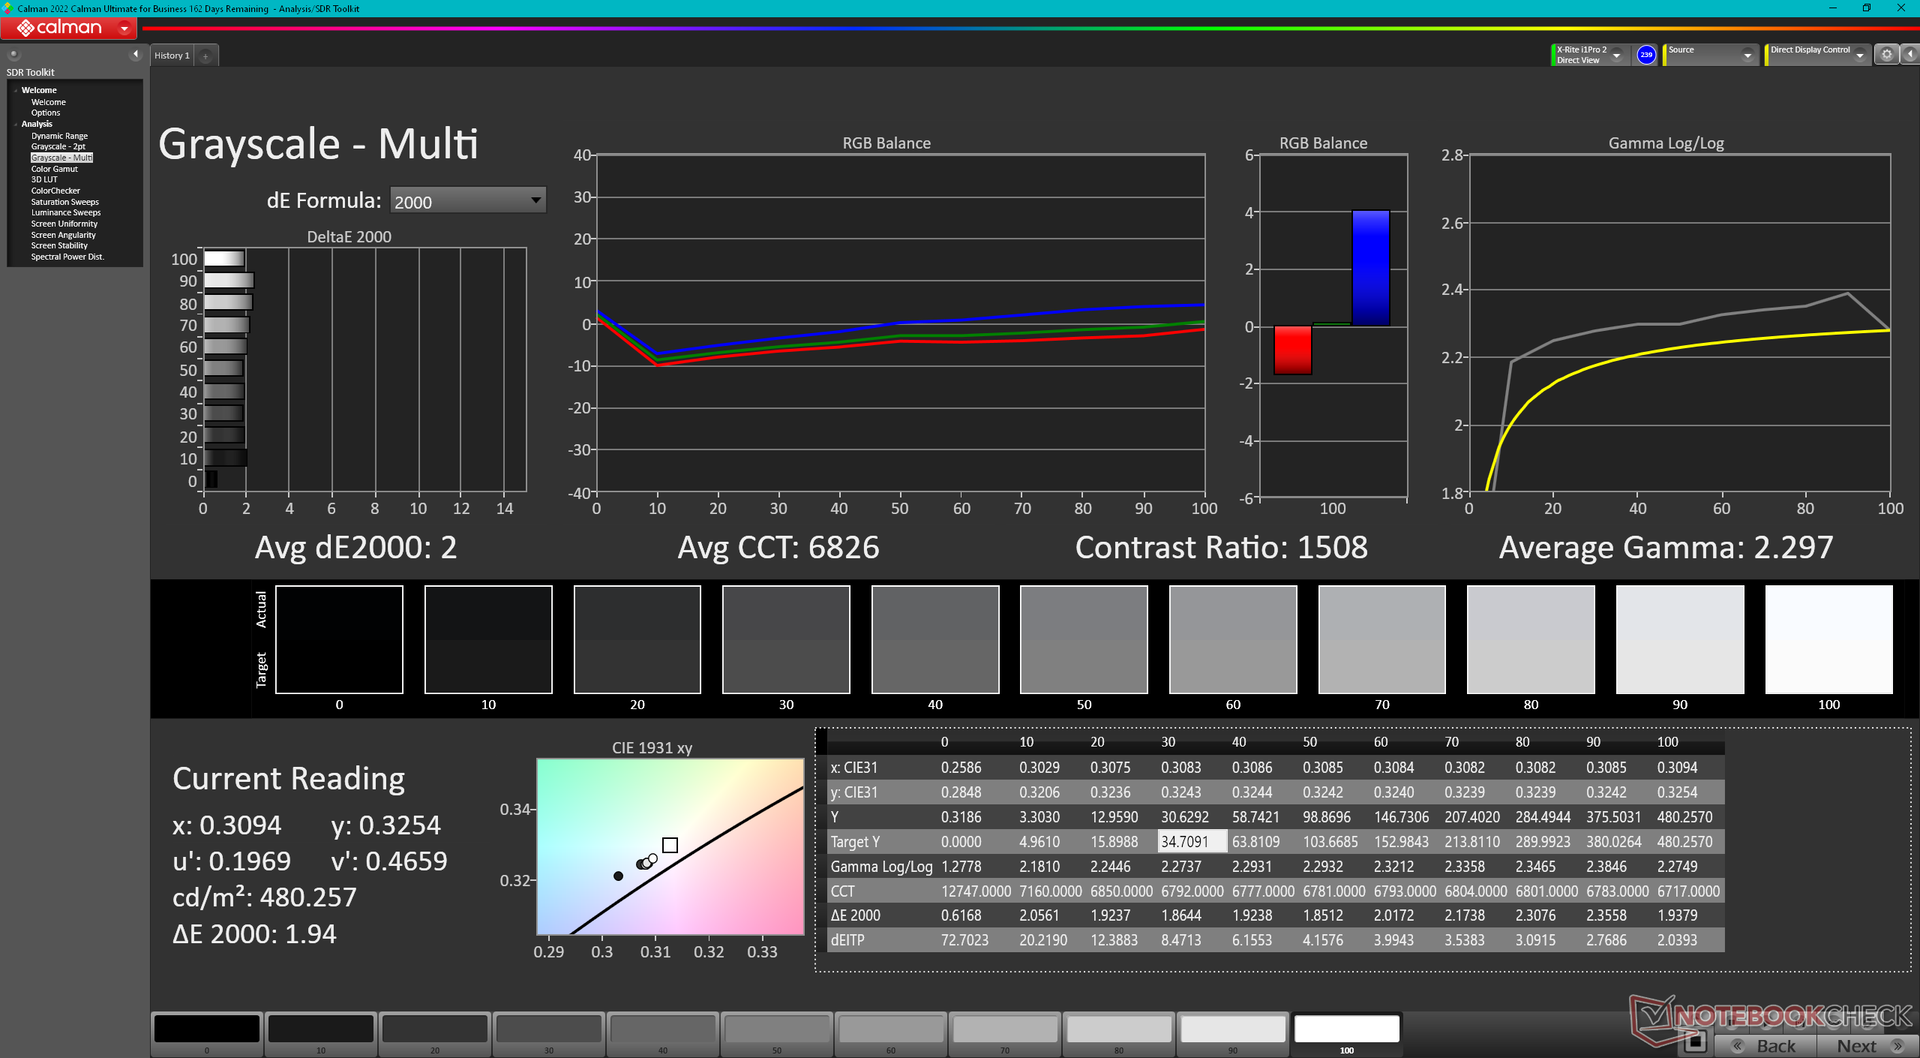
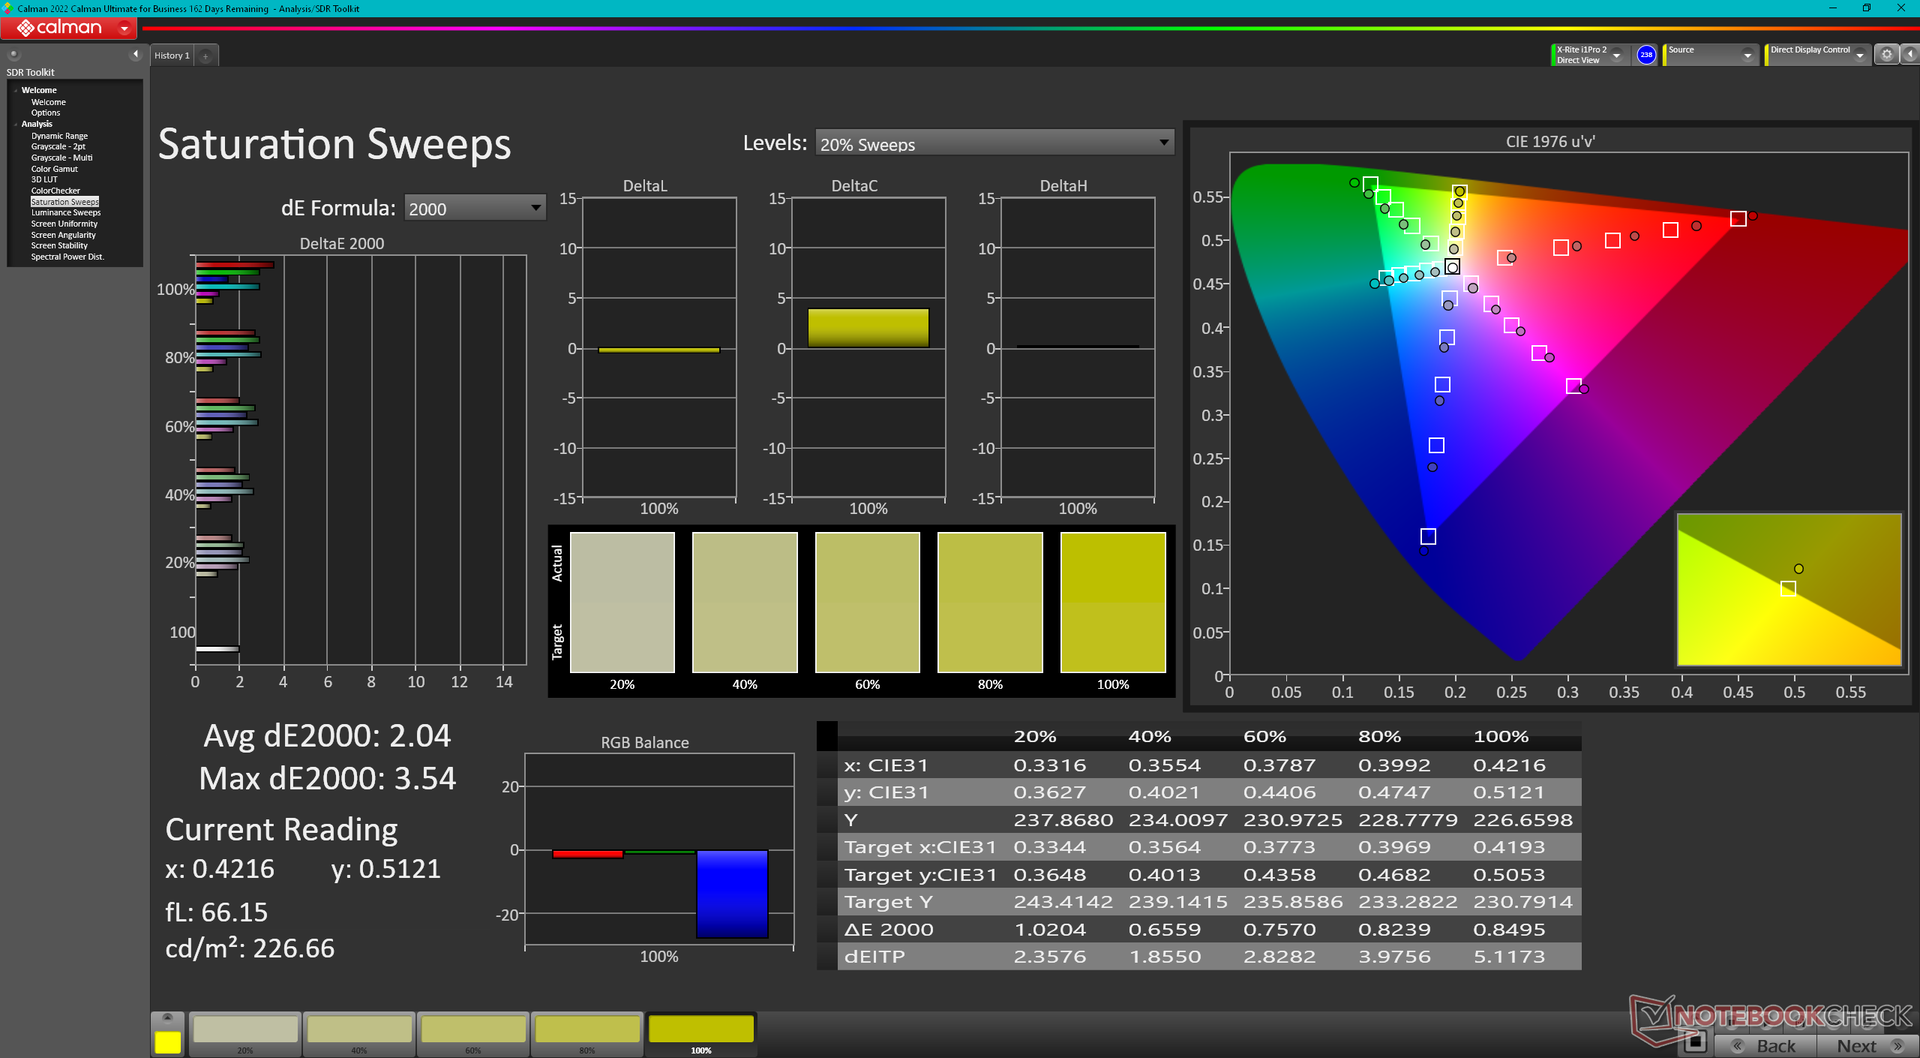
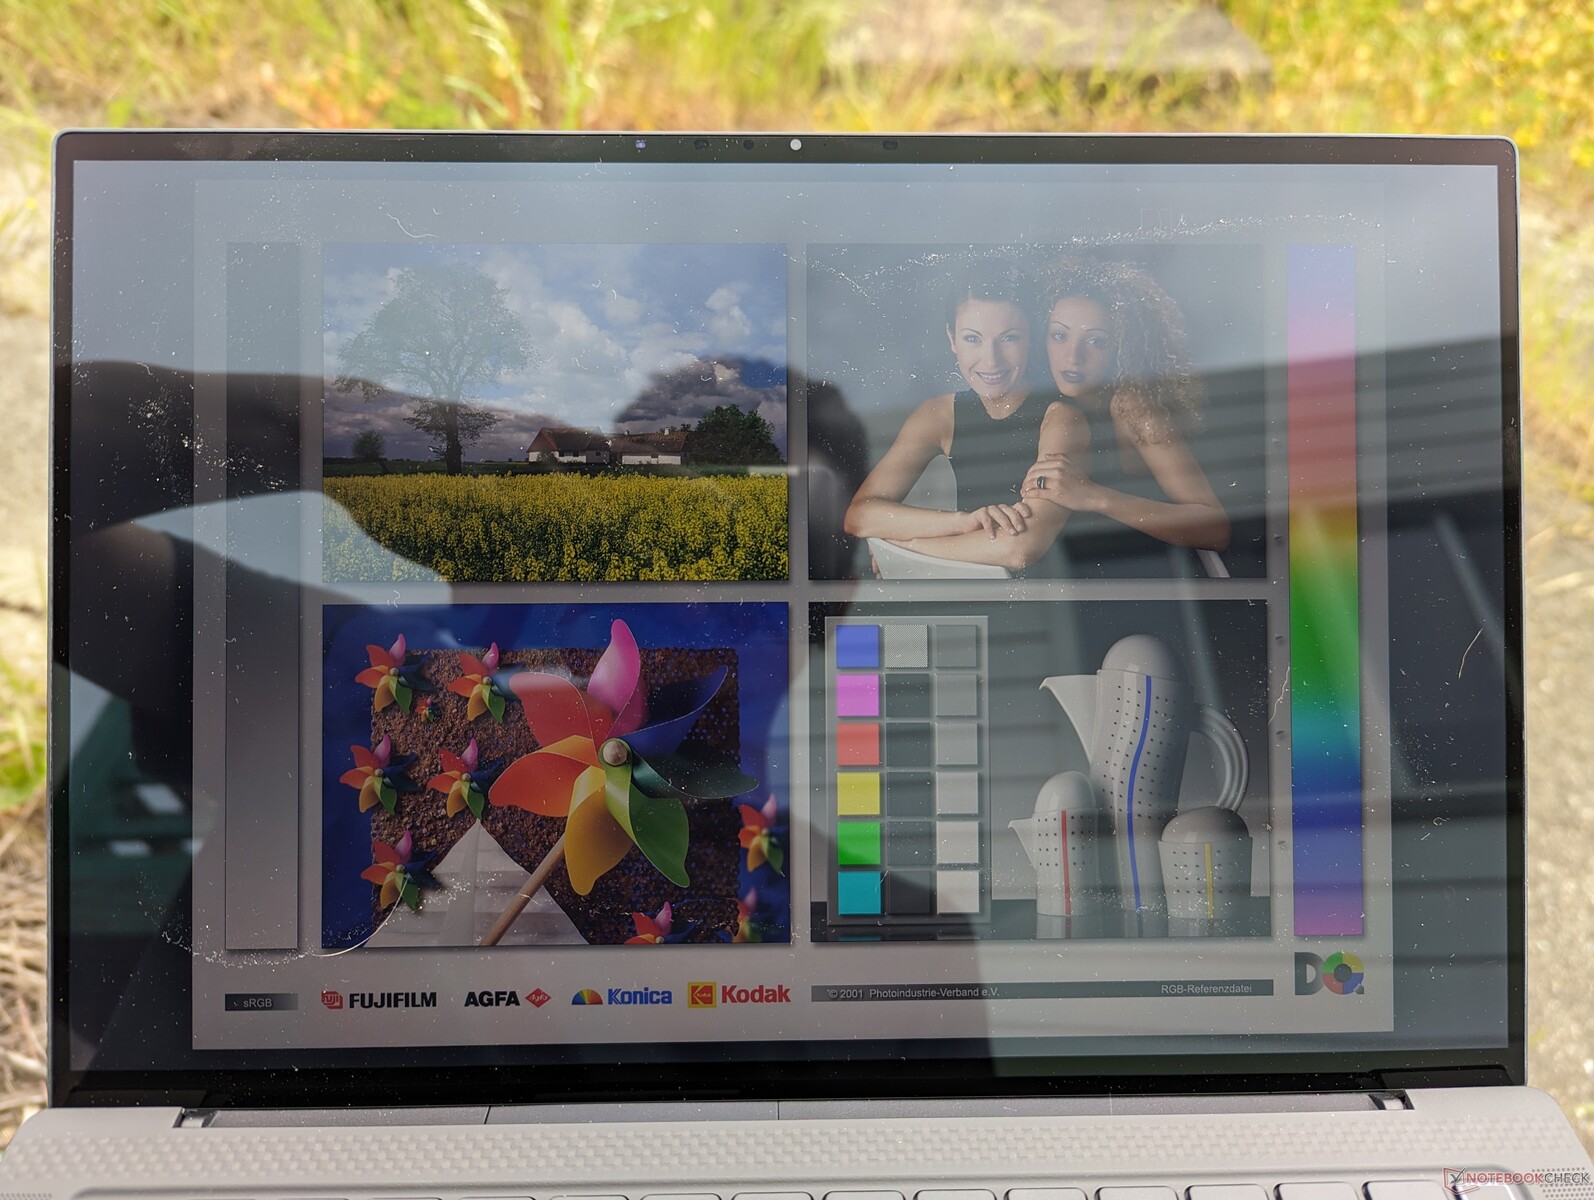
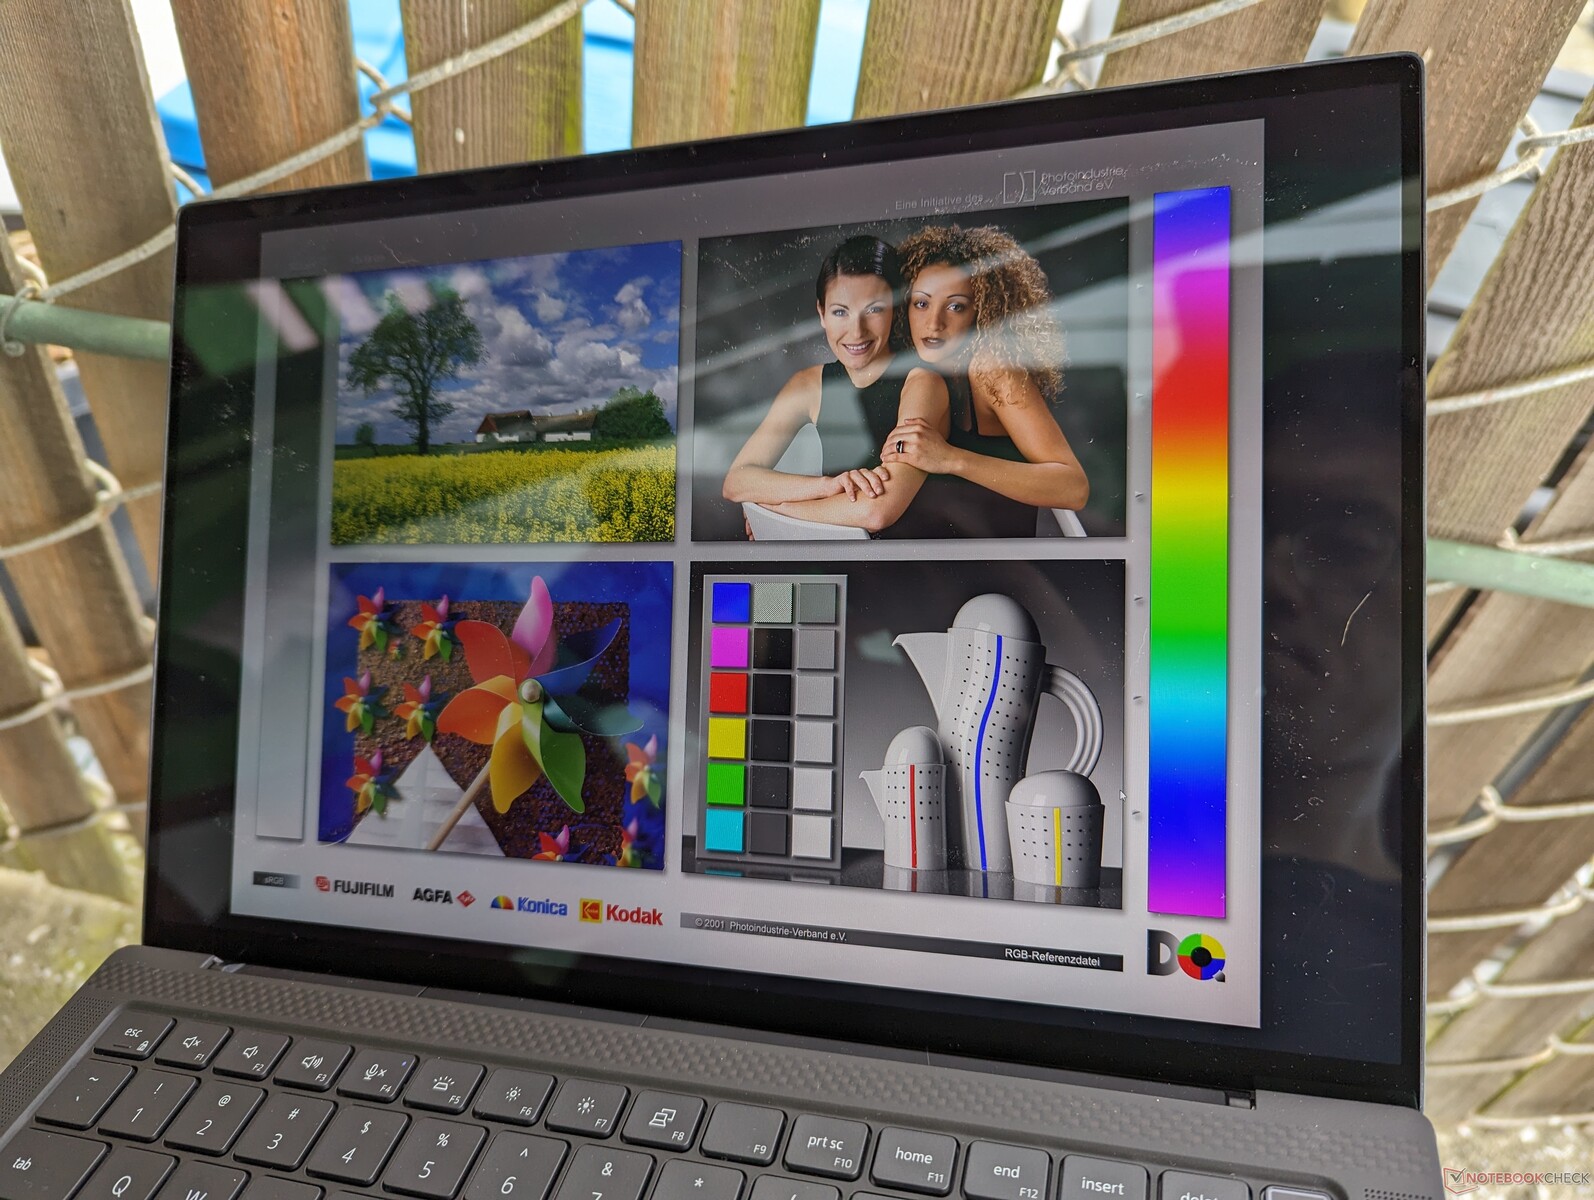
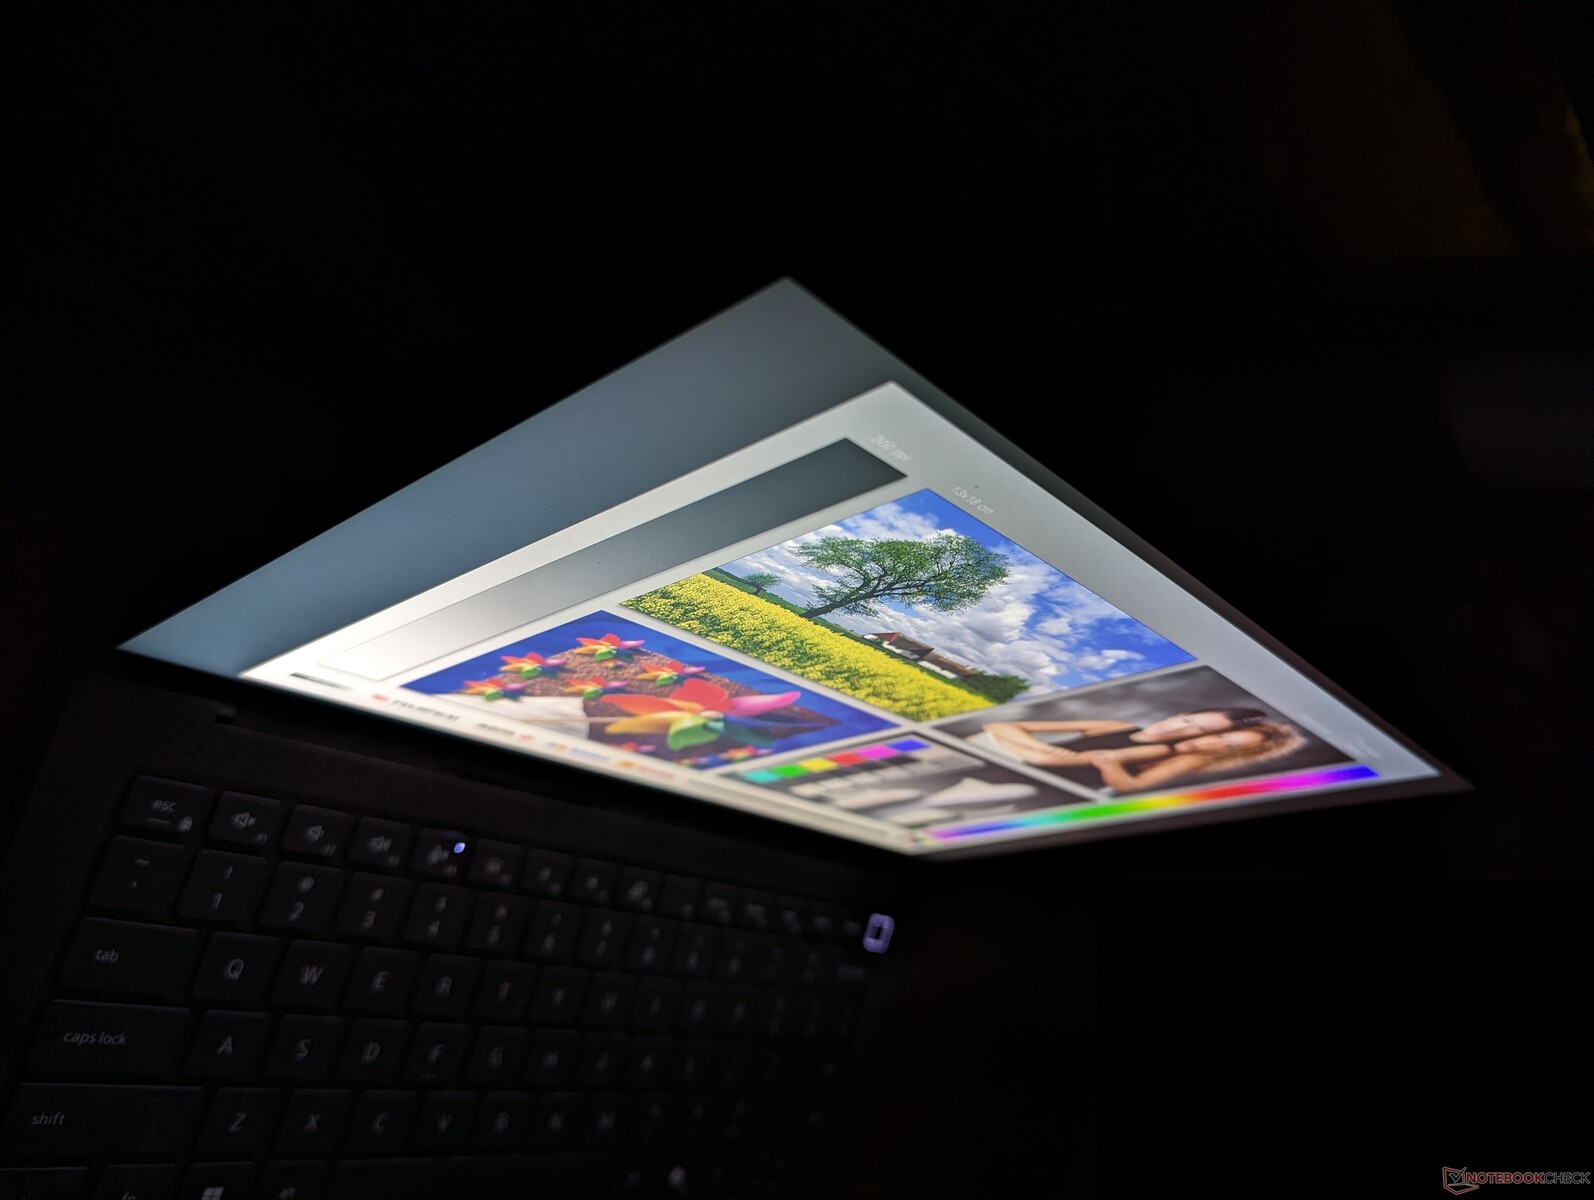
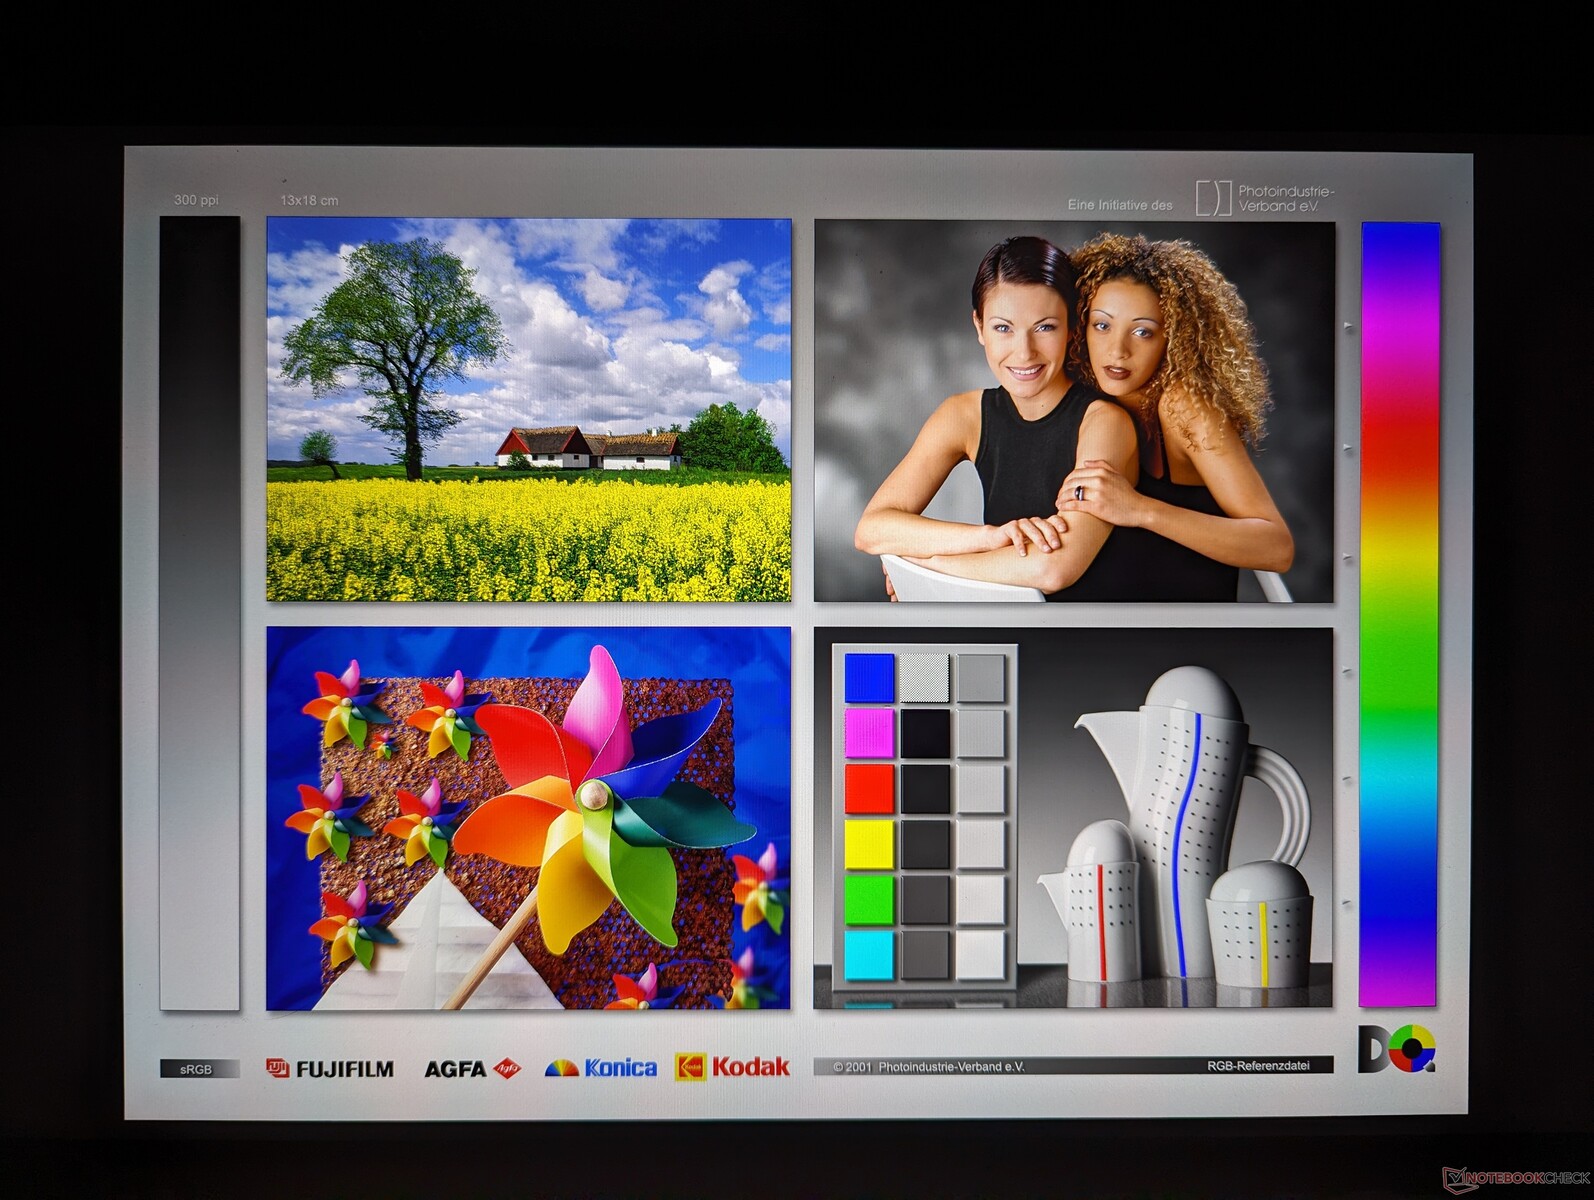
Écran - Le bon vieux IPS
AU Optronics est à nouveau le fournisseur de la dalle QHD+ pour la troisième année consécutive. Bien qu'il ait été remarquable lors de son lancement pour le Precision 5470, ce panneau commence maintenant à montrer des signes de fatigue face aux nouvelles solutions OLED et aux taux de rafraîchissement plus élevés. Le Lenovo ThinkPad P14s G4par exemple, est livré avec une option OLED 1800p qui n'est pas disponible sur le Precision 5490.
| |||||||||||||||||||||||||
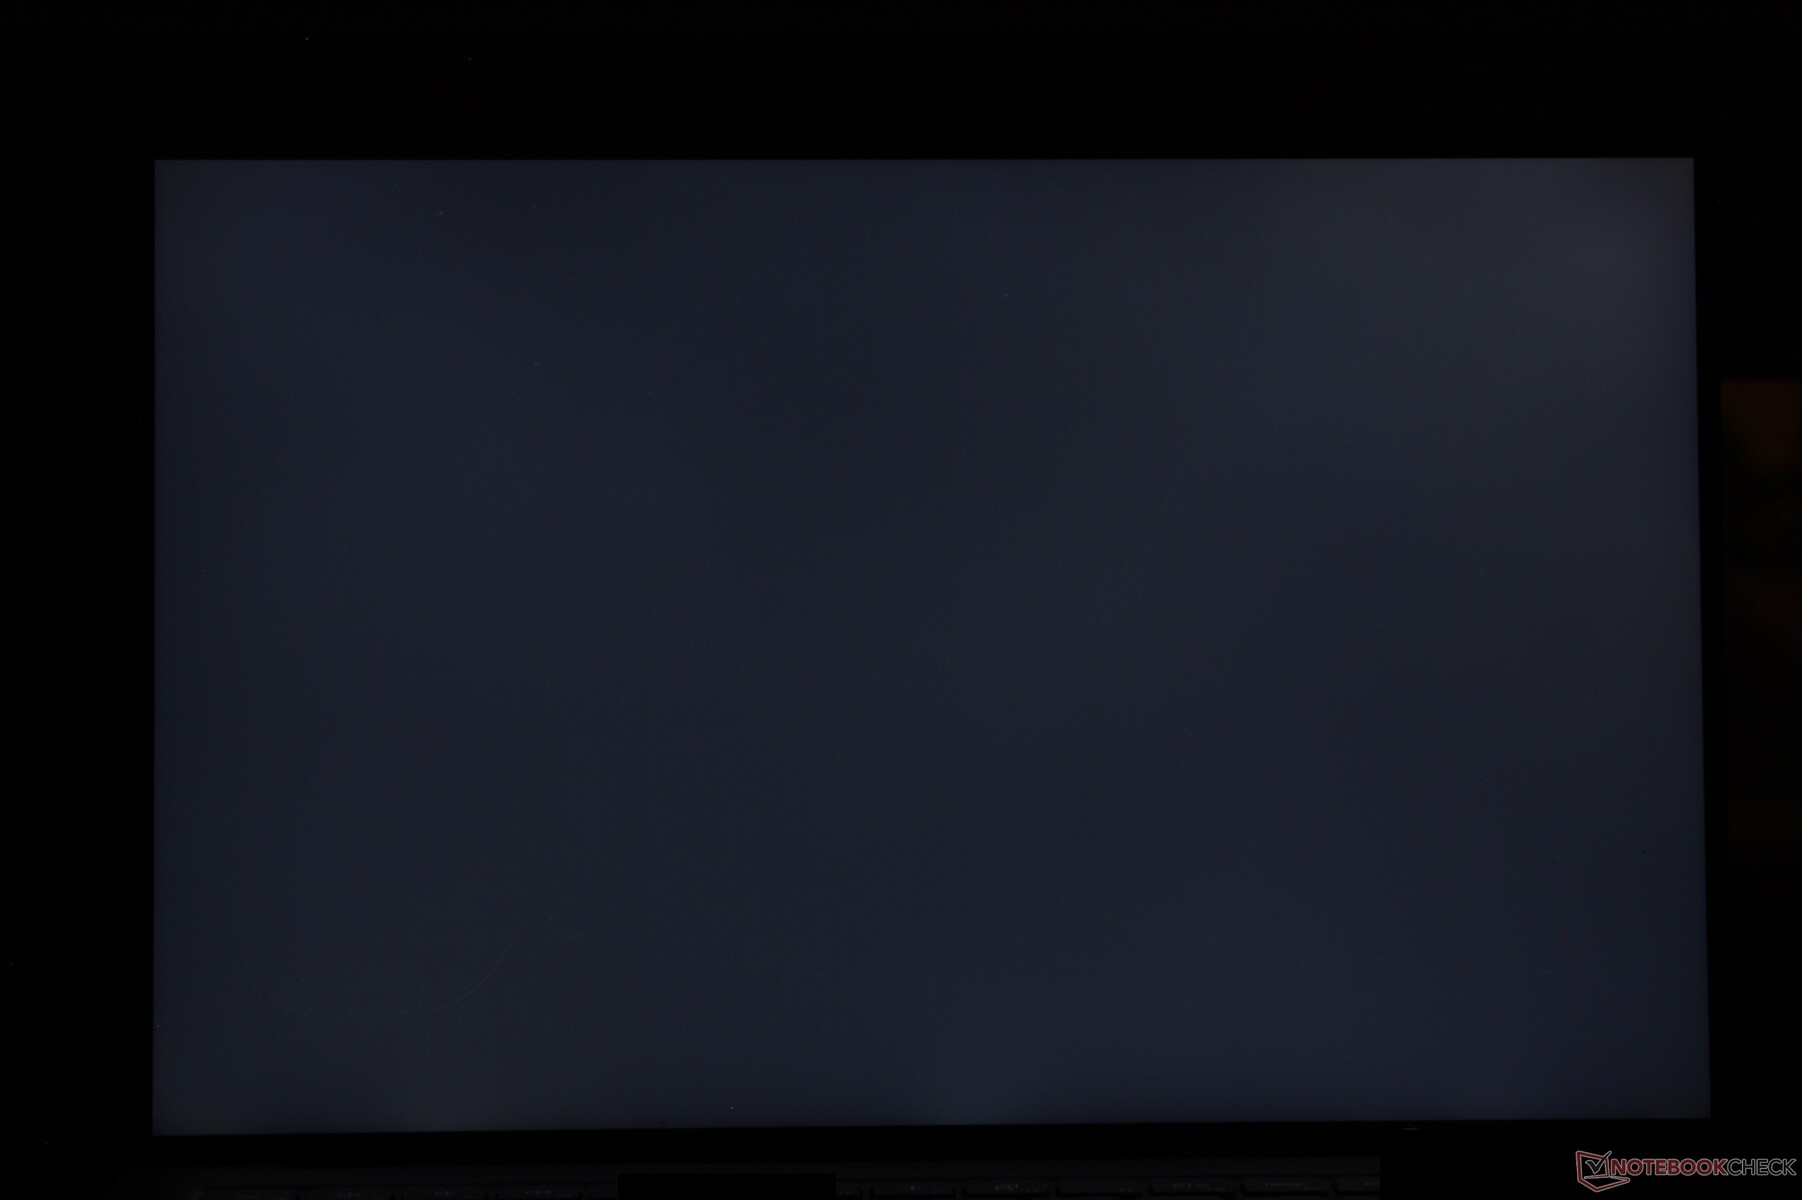
Homogénéité de la luminosité: 90 %
Valeur mesurée au centre, sur batterie: 485.1 cd/m²
Contraste: 1277:1 (Valeurs des noirs: 0.38 cd/m²)
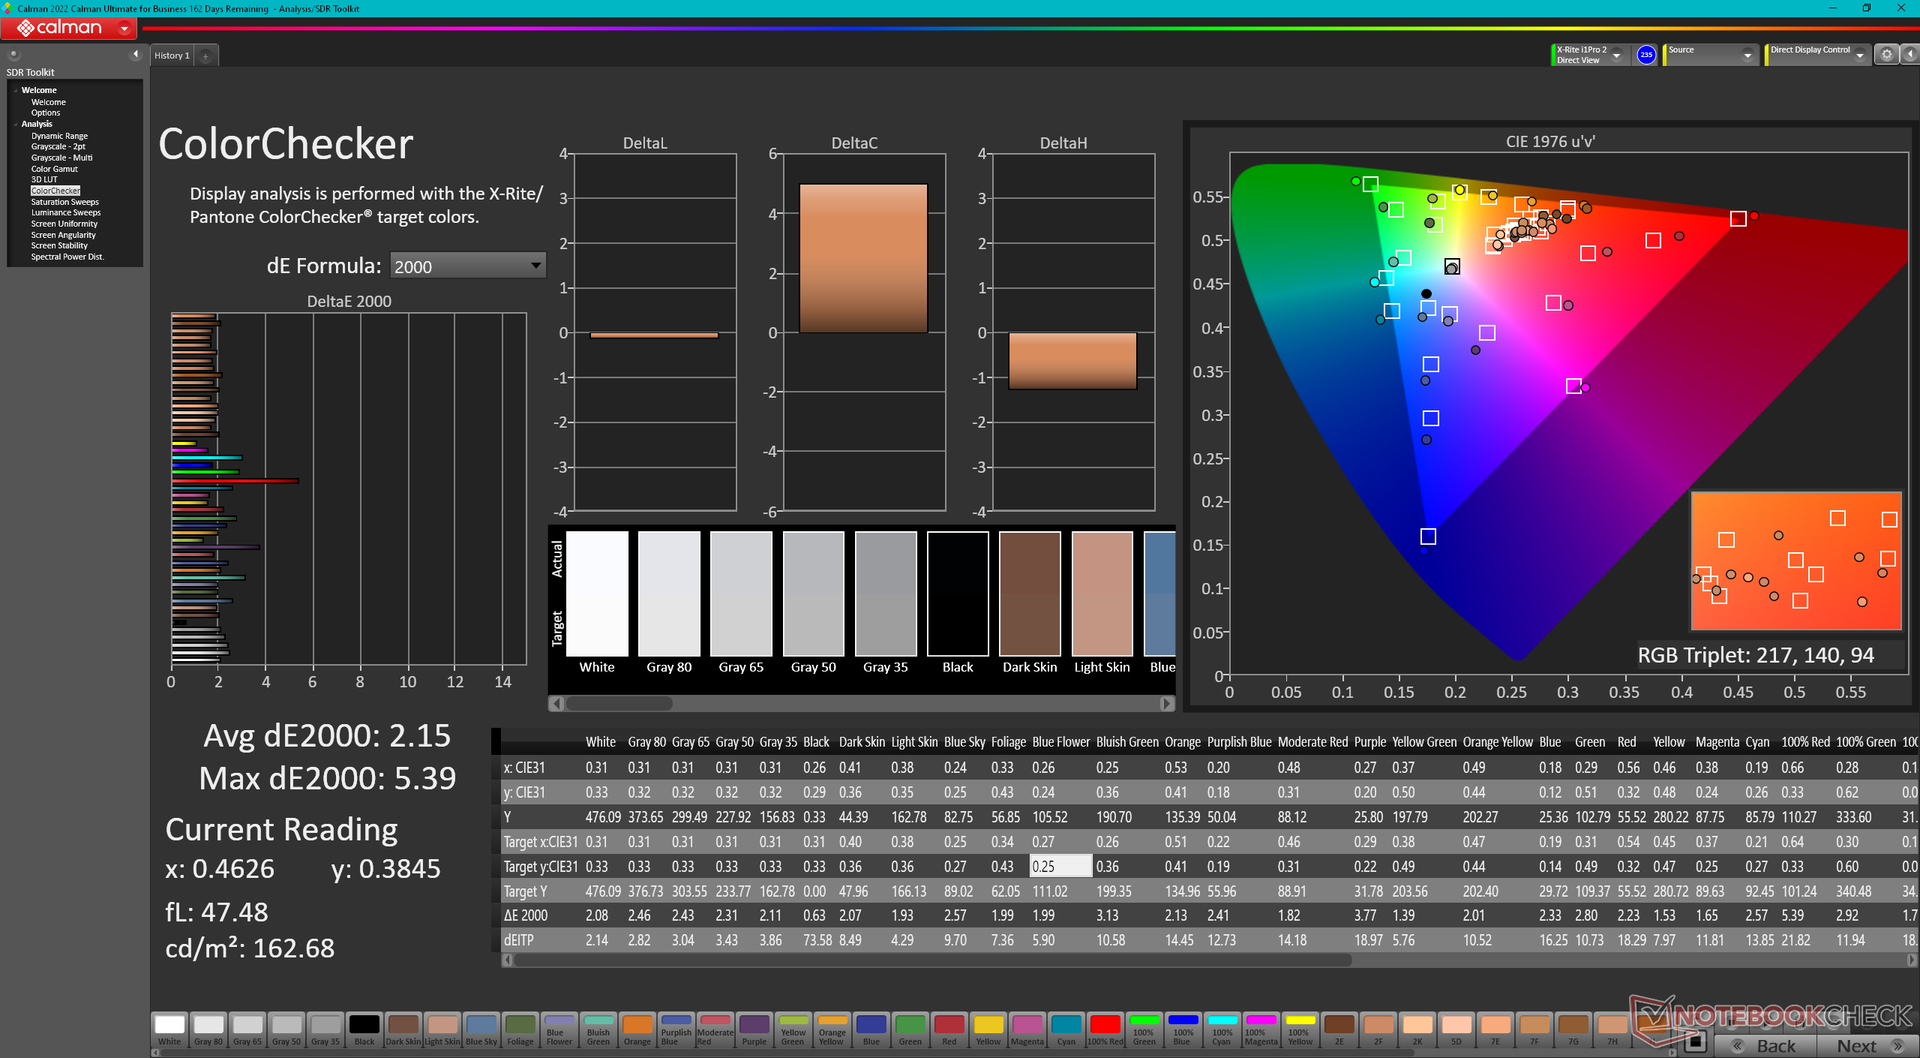
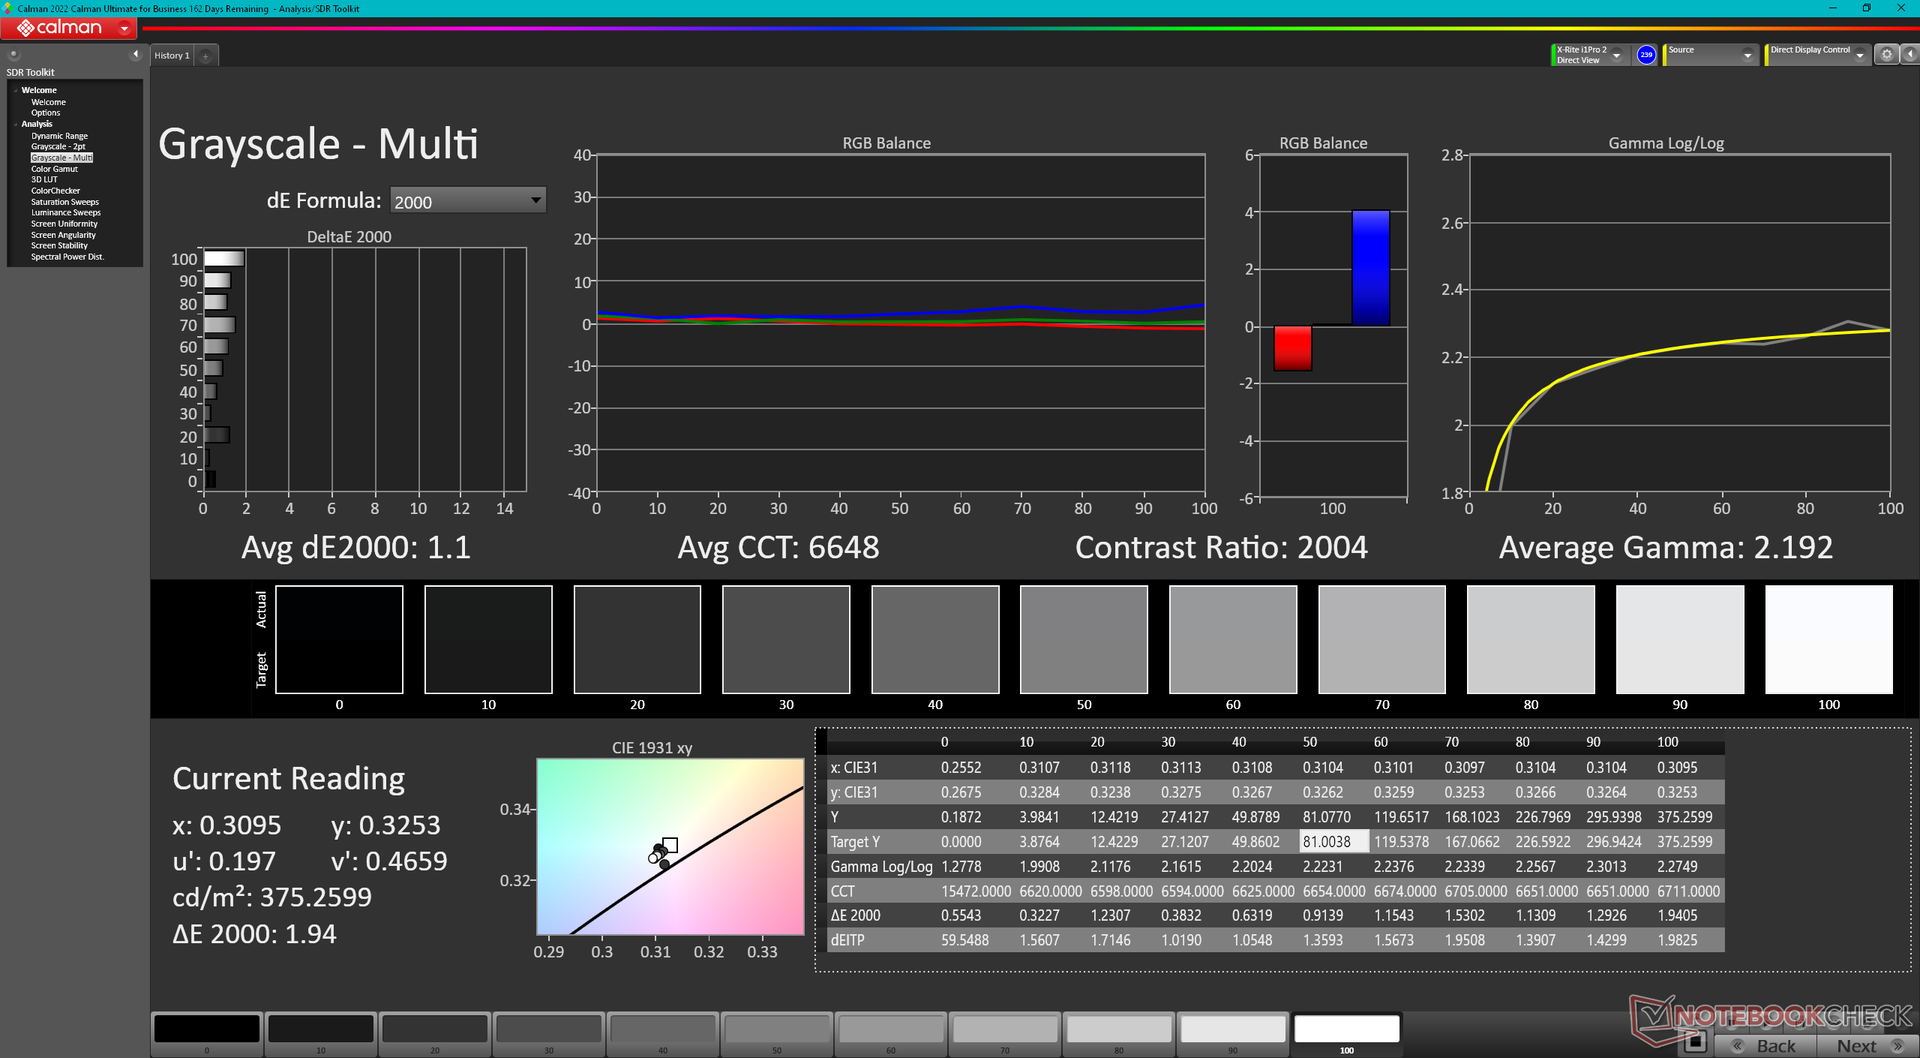
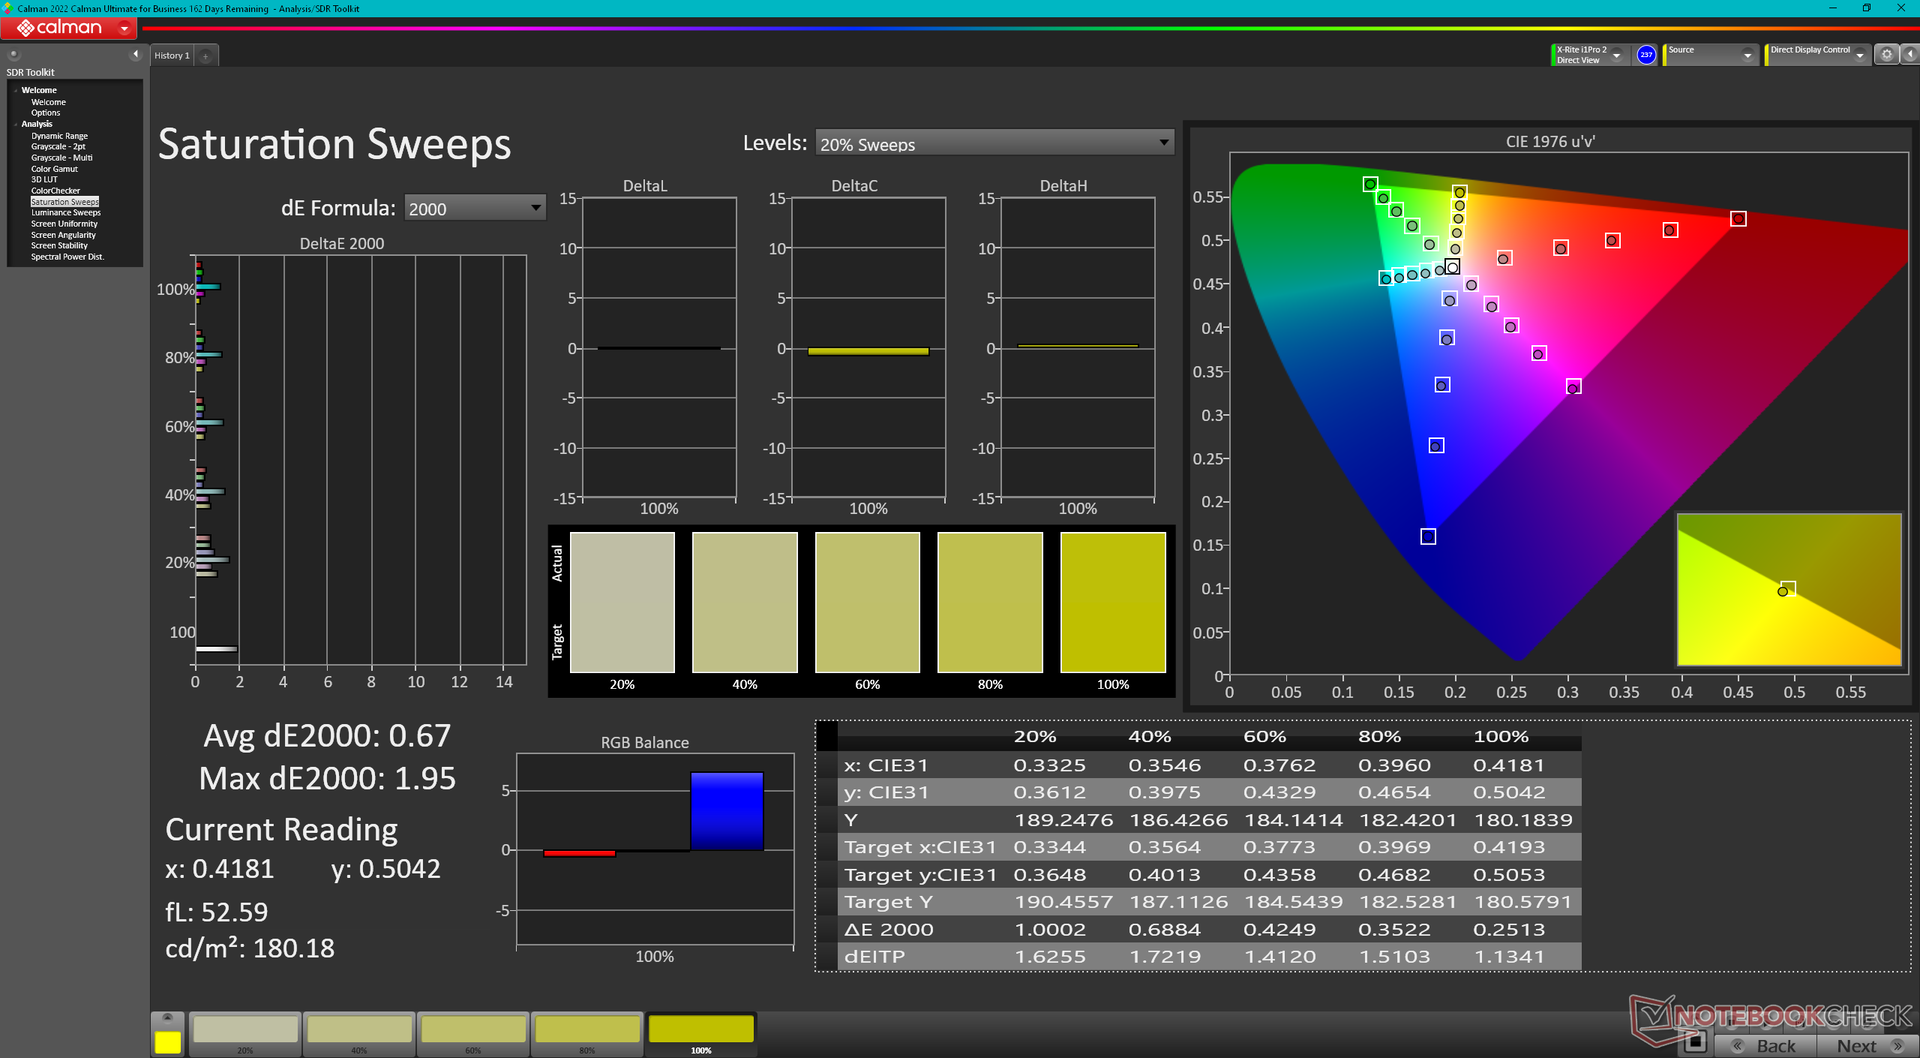
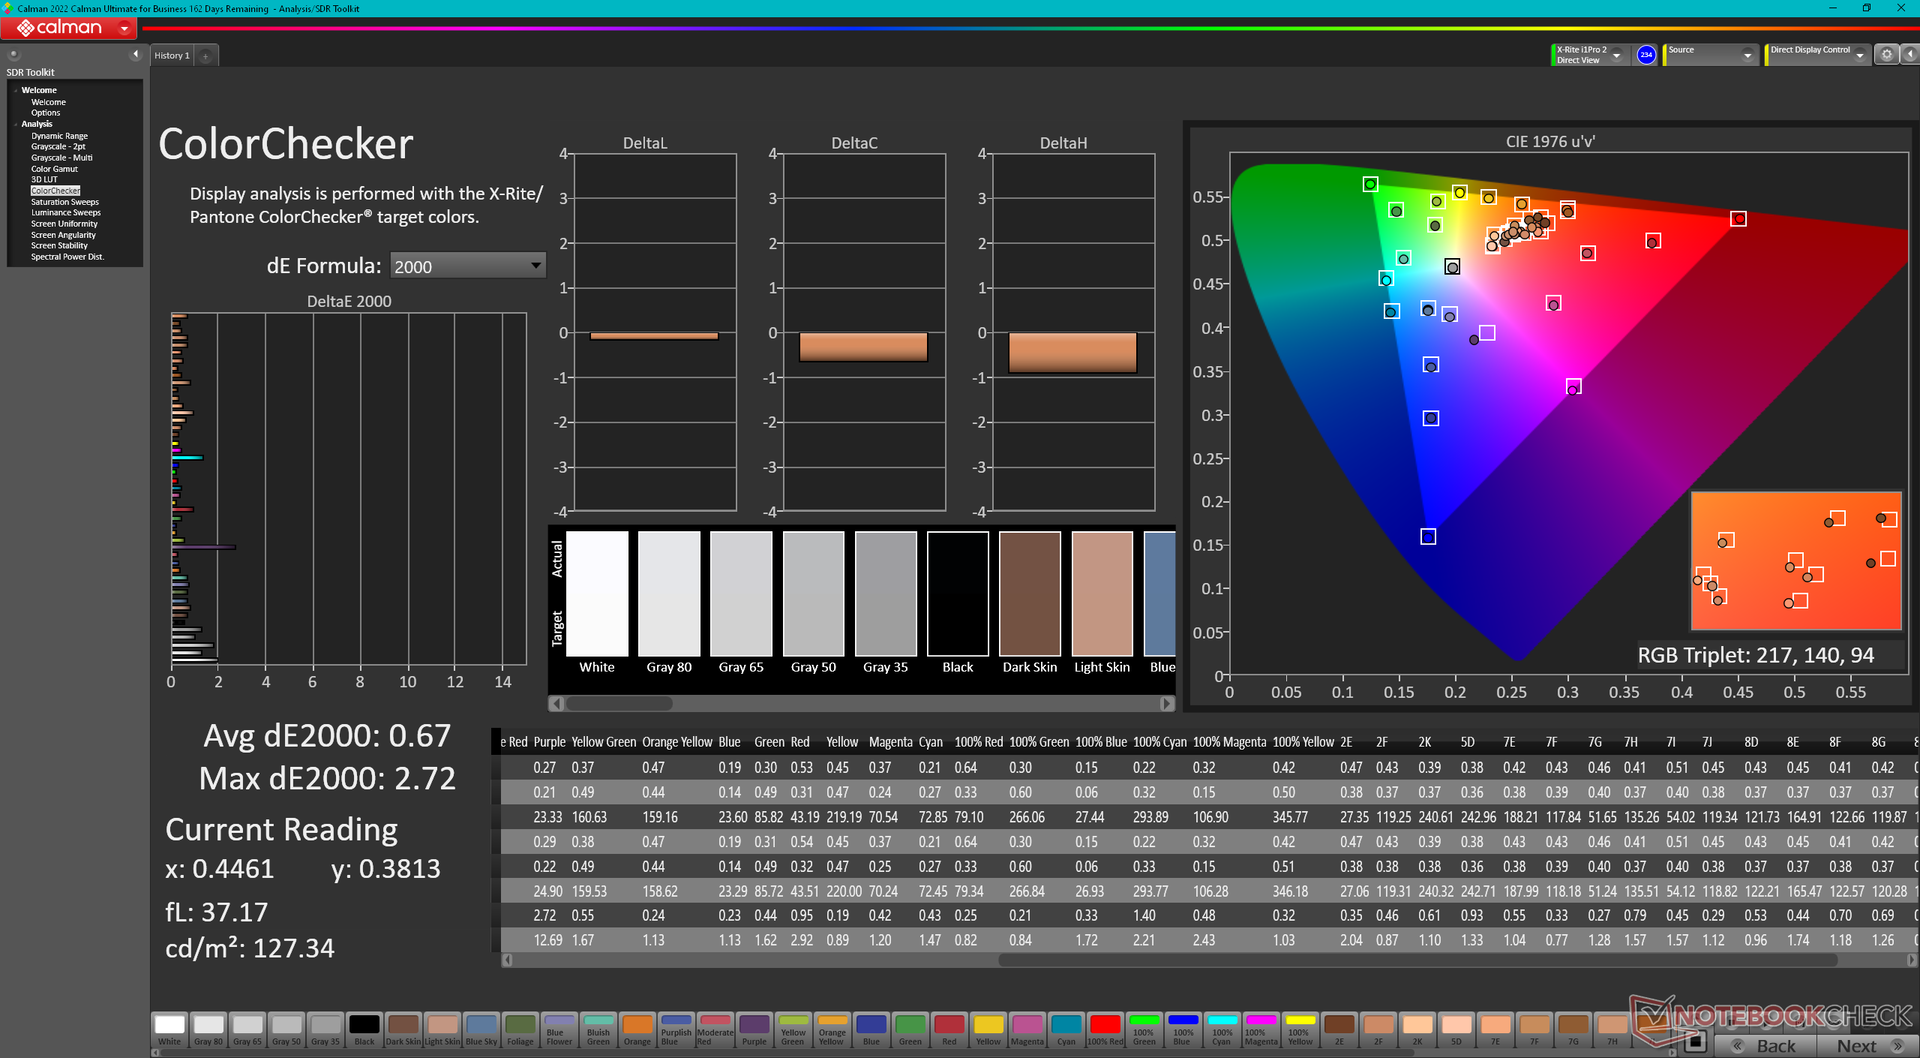
ΔE Color 2.15 | 0.5-29.43 Ø5, calibrated: 0.67
ΔE Greyscale 2 | 0.57-98 Ø5.3
79.5% AdobeRGB 1998 (Argyll 2.2.0 3D)
100% sRGB (Argyll 2.2.0 3D)
79.7% Display P3 (Argyll 2.2.0 3D)
Gamma: 2.3
| Dell Precision 5000 5490 AU Optronics B140QAN, IPS, 2560x1600, 14.00 | Lenovo ThinkPad P14s G4 21HF0017GE ATNA40YK15-0, OLED, 2880x1800, 14.00 | HP ZBook Firefly 14 G10 A CMN1435, IPS, 1920x1200, 14.00 | HP ZBook Firefly 14 G9-6B8A2EA CMN1435, IPS, 1920x1200, 14.00 | Dell Precision 5480 AU Optronics B140QAN, IPS, 2560x1600, 14.00 | Dell Precision 5000 5470 AU Optronics B140QAN, IPS, 2560x1600, 14.00 | |
|---|---|---|---|---|---|---|
| Display | -9% | -8% | -2% | -1% | ||
| Display P3 Coverage | 79.7 | 68.7 -14% | 69.6 -13% | 77.6 -3% | 79.3 -1% | |
| sRGB Coverage | 100 | 98.2 -2% | 99.9 0% | 99.8 0% | 100 0% | |
| AdobeRGB 1998 Coverage | 79.5 | 70.8 -11% | 71.1 -11% | 78 -2% | 78.7 -1% | |
| Response Times | 94% | 9% | 7% | 20% | 2% | |
| Response Time Grey 50% / Grey 80% * | 52.3 ? | 3 ? 94% | 56.2 ? -7% | 56.3 ? -8% | 43.9 ? 16% | 52.4 ? -0% |
| Response Time Black / White * | 33.3 ? | 2.2 ? 93% | 25.2 ? 24% | 26.2 ? 21% | 25.3 ? 24% | 32.4 ? 3% |
| PWM Frequency | 360 ? | |||||
| Screen | -8% | -19% | 4% | -3% | ||
| Brightness middle | 485.1 | 397 -18% | 432 -11% | 472.8 -3% | 537 11% | |
| Brightness | 471 | 367 -22% | 407 -14% | 469 0% | 518 10% | |
| Brightness Distribution | 90 | 86 -4% | 91 1% | 87 -3% | 94 4% | |
| Black Level * | 0.38 | 0.25 34% | 0.28 26% | 0.35 8% | 0.33 13% | |
| Contrast | 1277 | 1588 24% | 1543 21% | 1351 6% | 1627 27% | |
| Colorchecker dE 2000 * | 2.15 | 2.35 -9% | 3.1 -44% | 2.1 2% | 2.97 -38% | |
| Colorchecker dE 2000 max. * | 5.39 | 4.68 13% | 5.6 -4% | 5.54 -3% | 5.33 1% | |
| Colorchecker dE 2000 calibrated * | 0.67 | 1.15 -72% | 0.8 -19% | 0.59 12% | 0.88 -31% | |
| Greyscale dE 2000 * | 2 | 2.4 -20% | 4.5 -125% | 1.7 15% | 2.4 -20% | |
| Gamma | 2.3 96% | 2.067 106% | 2 110% | 2.26 97% | 2.06 107% | |
| CCT | 6826 95% | 6409 101% | 6528 100% | 6493 100% | 6668 97% | |
| Moyenne finale (programmes/paramètres) | 94% /
94% | -3% /
-6% | -7% /
-13% | 7% /
5% | -1% /
-2% |
* ... Moindre est la valeur, meilleures sont les performances
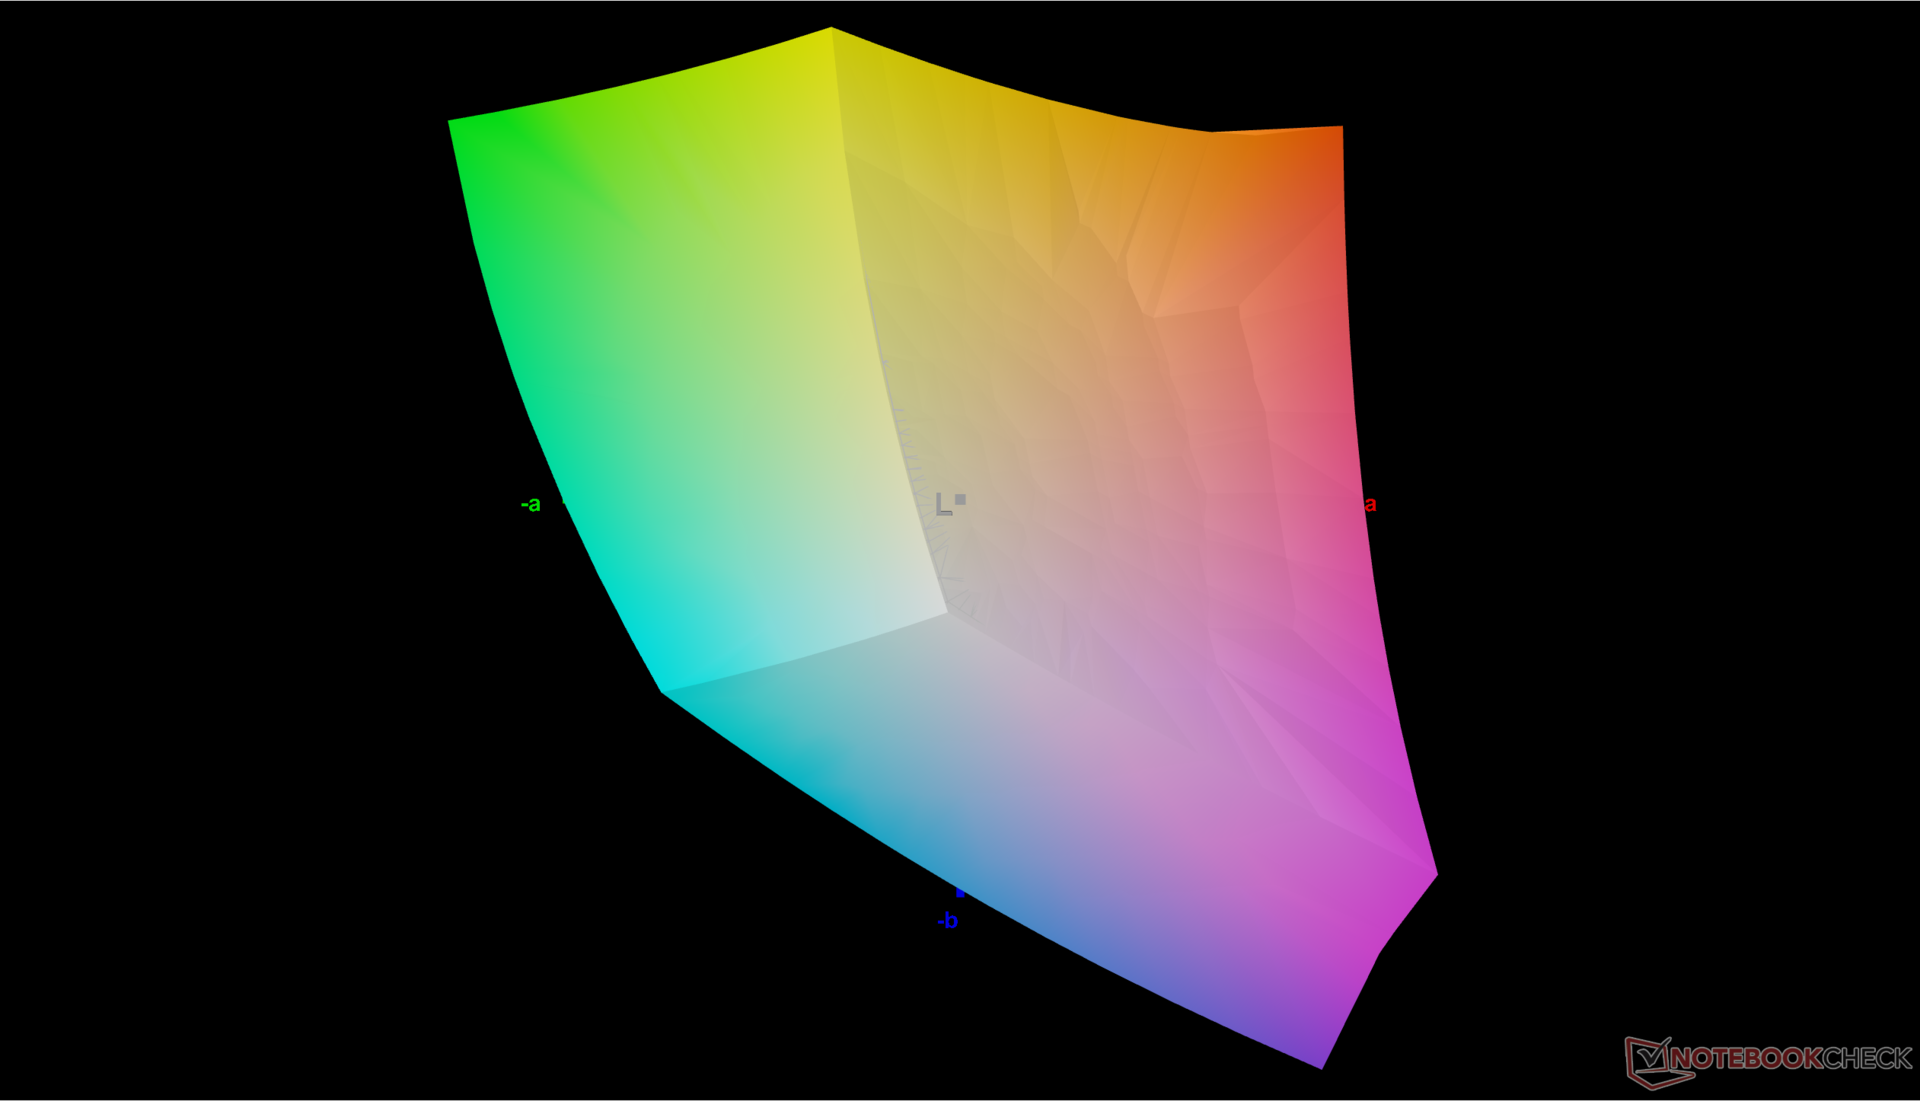
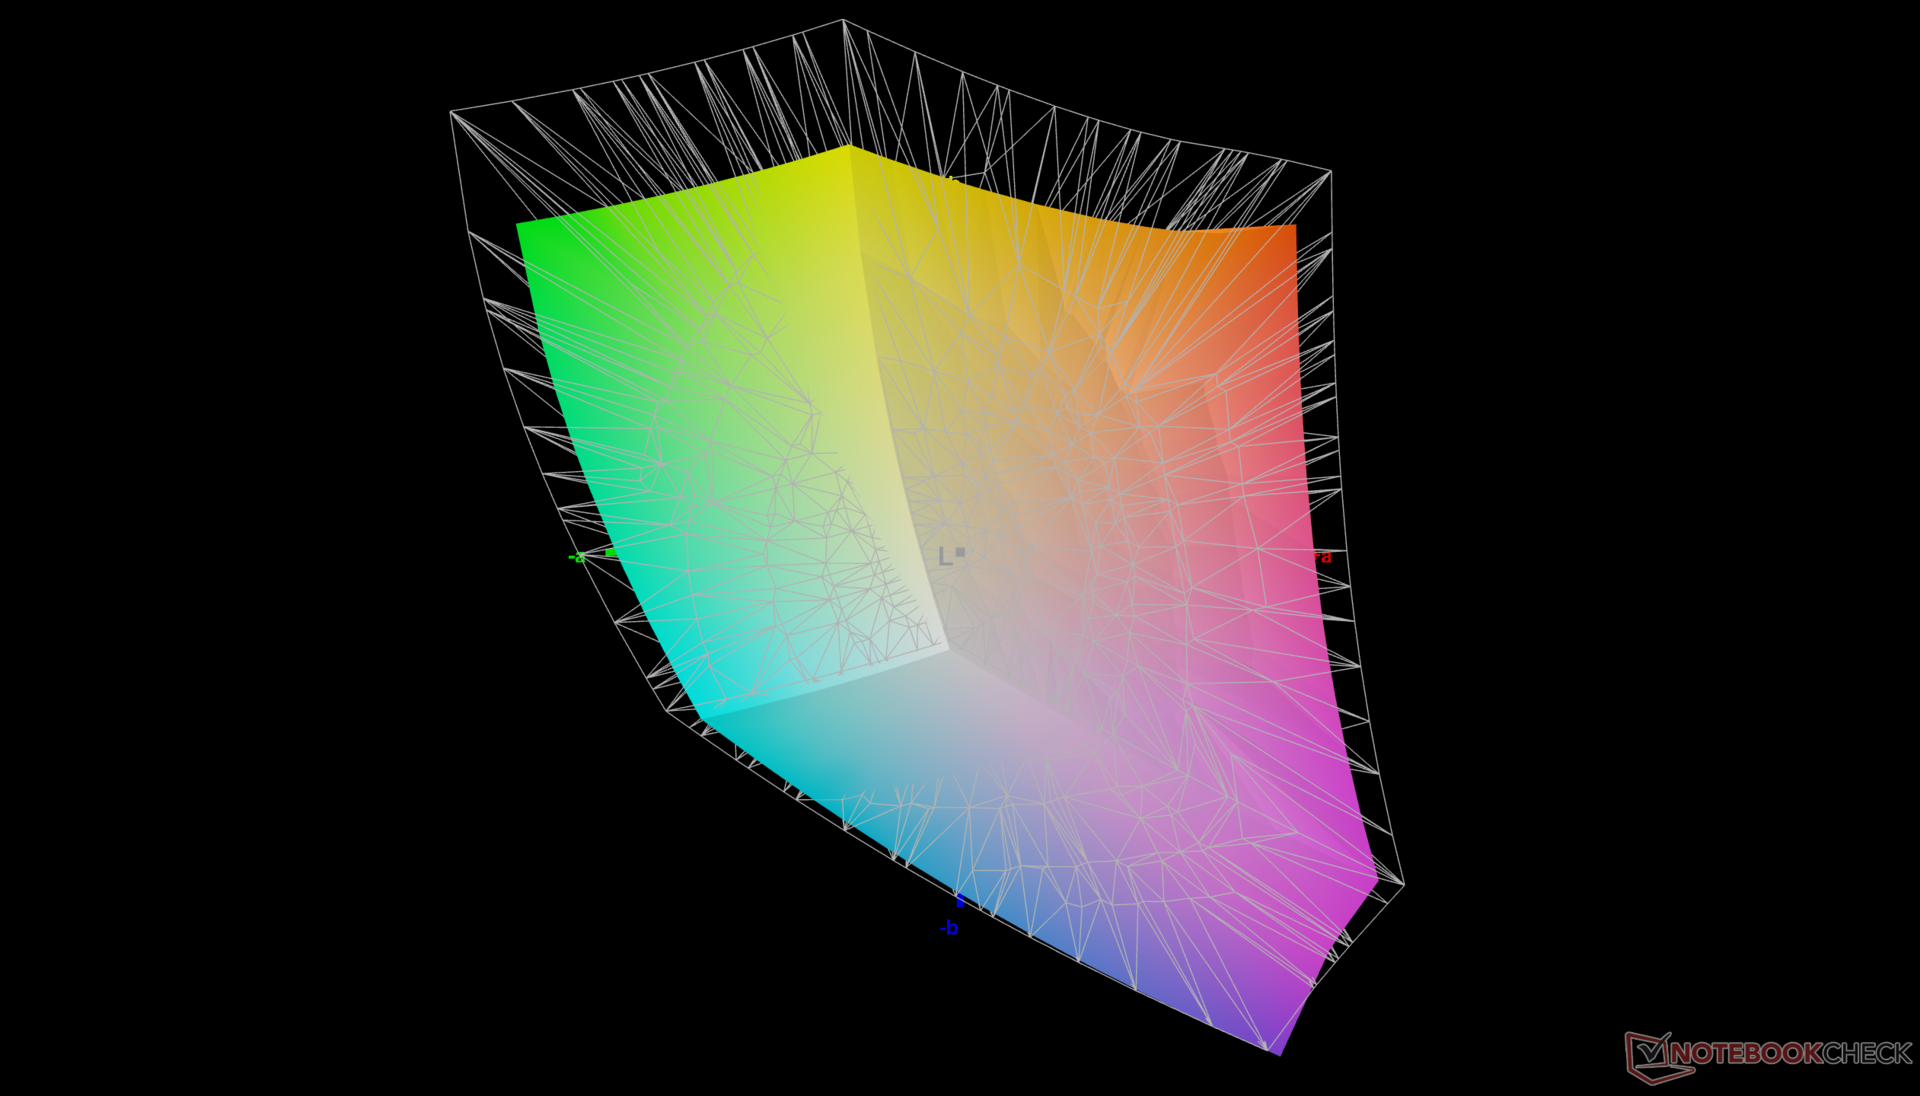
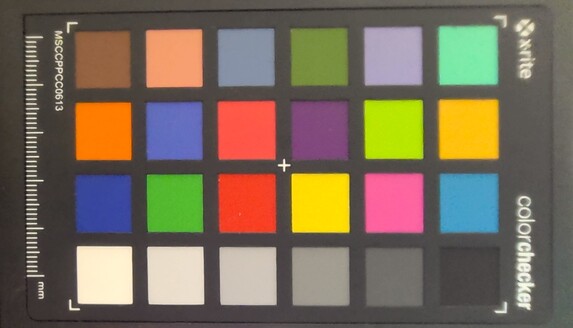
L'écran est bien calibré dès sa sortie de l'emballage, avec des valeurs moyennes d'échelle de gris et de couleur deltaE de seulement 2 et 2,15, respectivement. Seule la norme sRGB est entièrement prise en charge sur toutes les configurations.
Temps de réponse de l'écran
| ↔ Temps de réponse noir à blanc | ||
|---|---|---|
| 33.3 ms ... hausse ↗ et chute ↘ combinées | ↗ 16.2 ms hausse | 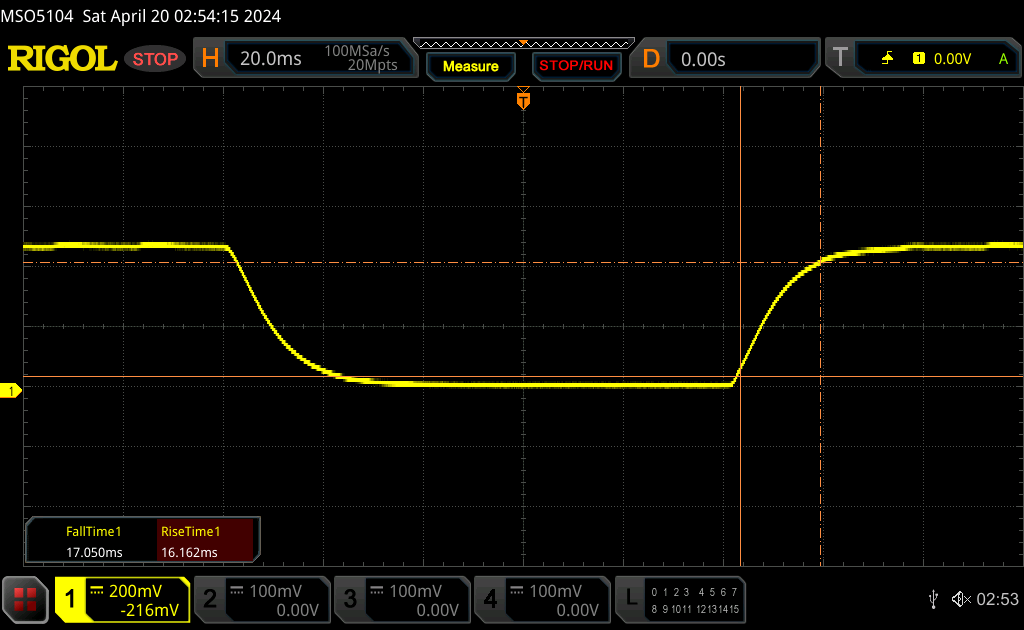 |
| ↘ 17.1 ms chute | ||
| L'écran souffre de latences très élevées, à éviter pour le jeu. En comparaison, tous les appareils testés affichent entre 0.1 (minimum) et 240 (maximum) ms. » 89 % des appareils testés affichent de meilleures performances. Cela signifie que les latences relevées sont moins bonnes que la moyenne (21.4 ms) de tous les appareils testés. | ||
| ↔ Temps de réponse gris 50% à gris 80% | ||
| 52.3 ms ... hausse ↗ et chute ↘ combinées | ↗ 23.6 ms hausse | 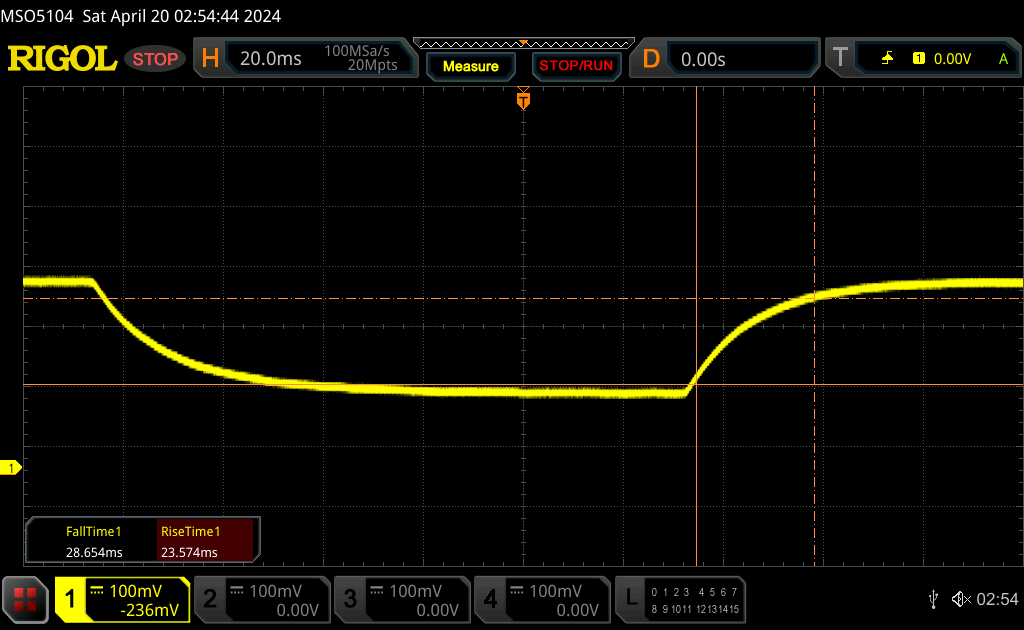 |
| ↘ 28.7 ms chute | ||
| L'écran souffre de latences très élevées, à éviter pour le jeu. En comparaison, tous les appareils testés affichent entre 0.2 (minimum) et 636 (maximum) ms. » 88 % des appareils testés affichent de meilleures performances. Cela signifie que les latences relevées sont moins bonnes que la moyenne (33.7 ms) de tous les appareils testés. | ||
Scintillement / MLI (Modulation de largeur d'impulsion)
| Scintillement / MLI (Modulation de largeur d'impulsion) non décelé | 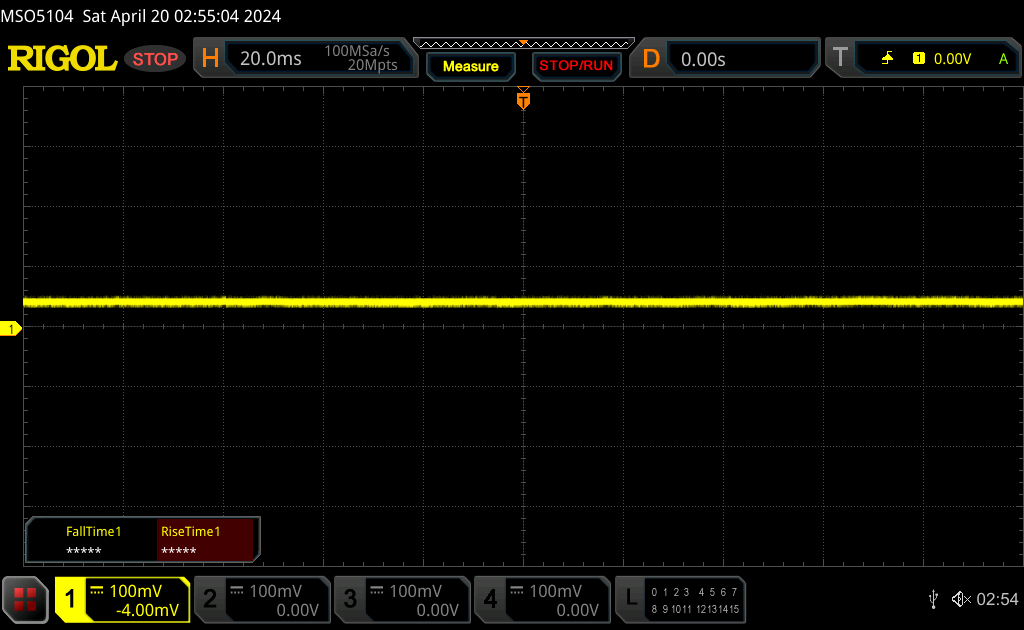 | ||
En comparaison, 53 % des appareils testés n'emploient pas MDI pour assombrir leur écran. Nous avons relevé une moyenne à 17844 (minimum : 5 - maximum : 3846000) Hz dans le cas où une MDI était active. | |||

Performance - Tout sur l'IA
Conditions d'essai
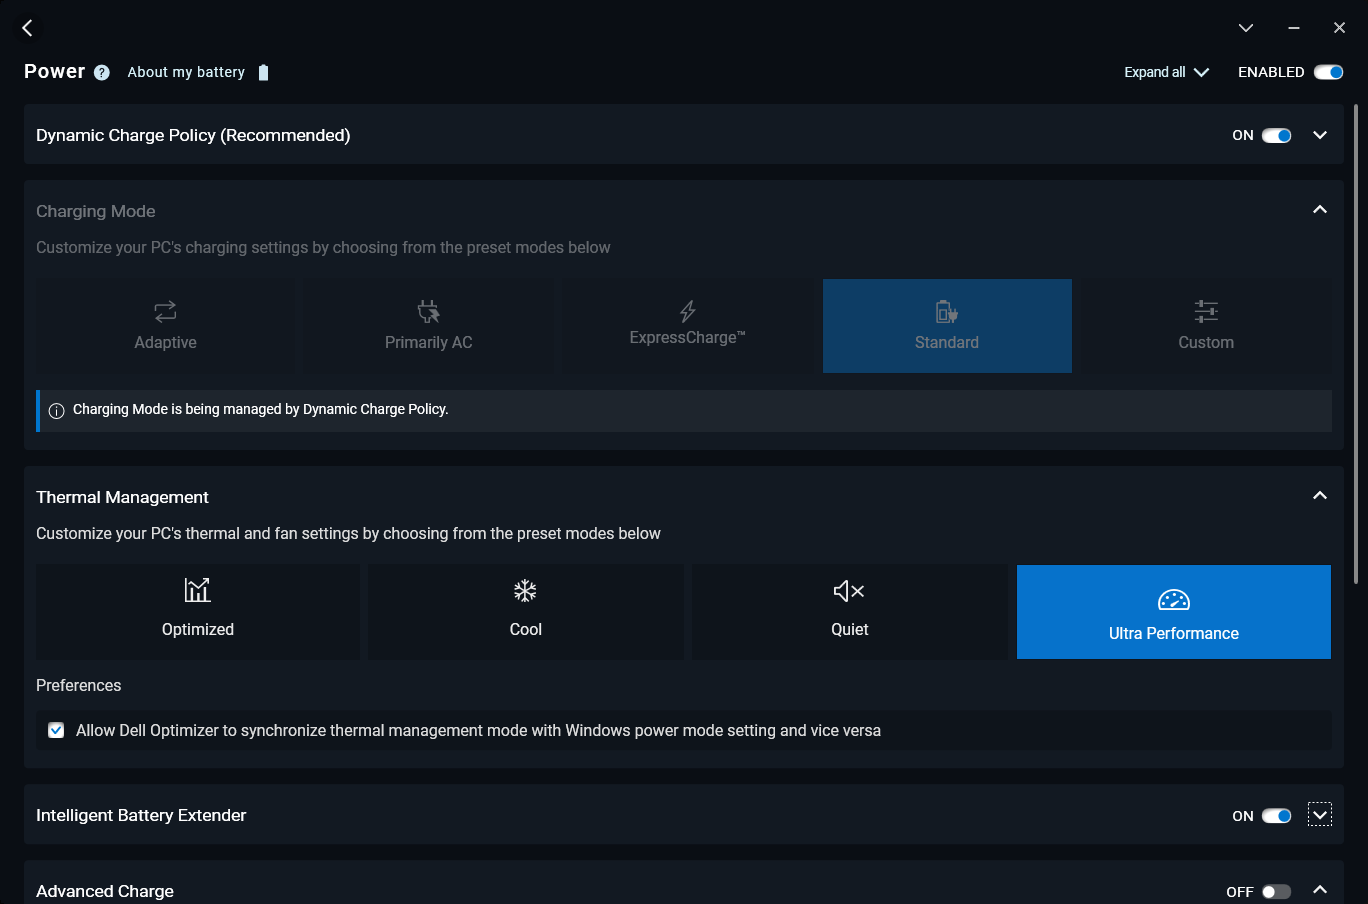
Nous avons réglé l'Optimiseur Dell sur le mode Ultra Performance et le GPU sur Nvidia avant d'exécuter les tests de référence ci-dessous.
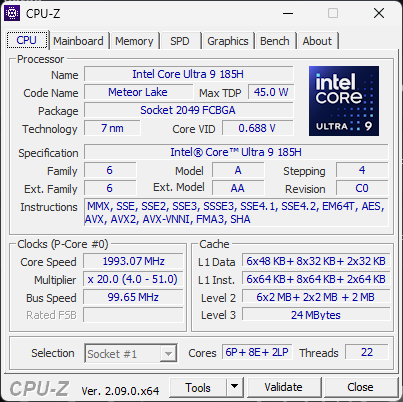
Processeur
Les performances brutes du processeur restent stables par rapport au Core i9-13900H dans l'ordinateur Precision 5480 de l'année dernière. Les avantages éventuels sont au mieux marginaux (jusqu'à 5 %), mais même ce petit écart peut se réduire une fois que les limites de Turbo Boost sont prises en compte, comme le montrent les résultats de la boucle CineBench R15 xT ci-dessous.
Si les fonctions d'intelligence artificielle intégrées ne sont pas importantes, le modèle moins onéreux Ryzen 7 Pro 7840HS sur des modèles concurrents comme le HP Firefly 14 peuvent fournir essentiellement les mêmes performances que les nouveaux modèles Core Ultra 9 185H.
La rétrogradation vers le Core Ultra 5 135H devrait avoir un impact de 15 à 20 % sur les performances du processeur, d'après notre expérience avec les processeurs Core i5-13500H .
Cinebench R15 Multi Loop
Cinebench R23: Multi Core | Single Core
Cinebench R20: CPU (Multi Core) | CPU (Single Core)
Cinebench R15: CPU Multi 64Bit | CPU Single 64Bit
Blender: v2.79 BMW27 CPU
7-Zip 18.03: 7z b 4 | 7z b 4 -mmt1
Geekbench 6.2: Multi-Core | Single-Core
Geekbench 5.5: Multi-Core | Single-Core
HWBOT x265 Benchmark v2.2: 4k Preset
LibreOffice : 20 Documents To PDF
R Benchmark 2.5: Overall mean
| CPU Performance Rating | |
| Dell Precision 5480 | |
| HP ZBook Power 15 G10 | |
| Moyenne Intel Core Ultra 9 185H | |
| Dell Precision 5000 5490 | |
| Lenovo ThinkPad P14s G4 21HF0017GE | |
| Lenovo ThinkPad P14s G4 21K5000LGE | |
| HP ZBook Power 15 G9 6B8C4EA -2! | |
| Dell Precision 5000 5470 -2! | |
| Asus VivoBook 14X K3405 -2! | |
| HP ZBook Firefly 14 G10 A | |
| Lenovo ThinkPad P14s G3 AMD 21J6S05000 -2! | |
| HP ZBook Firefly 14 G9-6B8A2EA -2! | |
| Lenovo ThinkPad P15v G3 21EM001AGE -2! | |
| Dell Precision 5000 5560 -4! | |
| Lenovo ThinkPad P15v G2 21A9000XGE -3! | |
| Lenovo ThinkPad P14s Gen1-20Y10002GE -2! | |
| Cinebench R23 / Multi Core | |
| Moyenne Intel Core Ultra 9 185H (12688 - 19851, n=4) | |
| Dell Precision 5000 5490 | |
| Dell Precision 5480 | |
| HP ZBook Power 15 G10 | |
| Lenovo ThinkPad P14s G4 21HF0017GE | |
| Asus VivoBook 14X K3405 | |
| Lenovo ThinkPad P14s G4 21K5000LGE | |
| HP ZBook Power 15 G9 6B8C4EA | |
| Dell Precision 5000 5470 | |
| Lenovo ThinkPad P15v G3 21EM001AGE | |
| HP ZBook Firefly 14 G10 A | |
| Lenovo ThinkPad P14s G3 AMD 21J6S05000 | |
| Lenovo ThinkPad P15v G2 21A9000XGE | |
| Dell Precision 5000 5560 | |
| HP ZBook Firefly 14 G9-6B8A2EA | |
| Lenovo ThinkPad P14s Gen1-20Y10002GE | |
| Cinebench R23 / Single Core | |
| Dell Precision 5480 | |
| Lenovo ThinkPad P14s G4 21HF0017GE | |
| Moyenne Intel Core Ultra 9 185H (1770 - 1906, n=4) | |
| Dell Precision 5000 5470 | |
| HP ZBook Power 15 G10 | |
| Dell Precision 5000 5490 | |
| HP ZBook Power 15 G9 6B8C4EA | |
| HP ZBook Firefly 14 G9-6B8A2EA | |
| Lenovo ThinkPad P14s G4 21K5000LGE | |
| Asus VivoBook 14X K3405 | |
| HP ZBook Firefly 14 G10 A | |
| Lenovo ThinkPad P14s G3 AMD 21J6S05000 | |
| Dell Precision 5000 5560 | |
| Lenovo ThinkPad P15v G3 21EM001AGE | |
| Lenovo ThinkPad P14s Gen1-20Y10002GE | |
| Cinebench R20 / CPU (Multi Core) | |
| Moyenne Intel Core Ultra 9 185H (4843 - 7651, n=4) | |
| Dell Precision 5000 5490 | |
| HP ZBook Power 15 G10 | |
| Dell Precision 5480 | |
| Lenovo ThinkPad P14s G4 21HF0017GE | |
| Asus VivoBook 14X K3405 | |
| HP ZBook Power 15 G9 6B8C4EA | |
| Lenovo ThinkPad P14s G4 21K5000LGE | |
| Lenovo ThinkPad P15v G3 21EM001AGE | |
| Lenovo ThinkPad P15v G3 21EM001AGE | |
| Dell Precision 5000 5470 | |
| HP ZBook Firefly 14 G10 A | |
| Lenovo ThinkPad P14s G3 AMD 21J6S05000 | |
| Dell Precision 5000 5560 | |
| Lenovo ThinkPad P15v G2 21A9000XGE | |
| HP ZBook Firefly 14 G9-6B8A2EA | |
| Lenovo ThinkPad P14s Gen1-20Y10002GE | |
| Cinebench R20 / CPU (Single Core) | |
| Dell Precision 5480 | |
| Lenovo ThinkPad P14s G4 21HF0017GE | |
| Moyenne Intel Core Ultra 9 185H (680 - 735, n=4) | |
| HP ZBook Power 15 G10 | |
| HP ZBook Power 15 G9 6B8C4EA | |
| Dell Precision 5000 5470 | |
| Dell Precision 5000 5490 | |
| HP ZBook Firefly 14 G9-6B8A2EA | |
| Asus VivoBook 14X K3405 | |
| Lenovo ThinkPad P14s G4 21K5000LGE | |
| HP ZBook Firefly 14 G10 A | |
| Lenovo ThinkPad P14s G3 AMD 21J6S05000 | |
| Dell Precision 5000 5560 | |
| Lenovo ThinkPad P15v G3 21EM001AGE | |
| Lenovo ThinkPad P15v G3 21EM001AGE | |
| Lenovo ThinkPad P15v G2 21A9000XGE | |
| Lenovo ThinkPad P14s Gen1-20Y10002GE | |
| Cinebench R15 / CPU Multi 64Bit | |
| Dell Precision 5000 5490 | |
| Moyenne Intel Core Ultra 9 185H (1582 - 3165, n=6) | |
| HP ZBook Power 15 G10 | |
| Dell Precision 5480 | |
| Lenovo ThinkPad P14s G4 21HF0017GE | |
| Dell Precision 5000 5470 | |
| Lenovo ThinkPad P14s G4 21K5000LGE | |
| Asus VivoBook 14X K3405 | |
| Lenovo ThinkPad P15v G3 21EM001AGE | |
| HP ZBook Power 15 G9 6B8C4EA | |
| Lenovo ThinkPad P14s G3 AMD 21J6S05000 | |
| HP ZBook Firefly 14 G10 A | |
| Lenovo ThinkPad P15v G2 21A9000XGE | |
| Dell Precision 5000 5560 | |
| HP ZBook Firefly 14 G9-6B8A2EA | |
| Lenovo ThinkPad P14s Gen1-20Y10002GE | |
| Cinebench R15 / CPU Single 64Bit | |
| Dell Precision 5480 | |
| HP ZBook Power 15 G10 | |
| Lenovo ThinkPad P14s G4 21K5000LGE | |
| Moyenne Intel Core Ultra 9 185H (257 - 280, n=4) | |
| Lenovo ThinkPad P14s G4 21HF0017GE | |
| Dell Precision 5000 5490 | |
| HP ZBook Power 15 G9 6B8C4EA | |
| HP ZBook Firefly 14 G9-6B8A2EA | |
| Asus VivoBook 14X K3405 | |
| HP ZBook Firefly 14 G10 A | |
| Dell Precision 5000 5470 | |
| Lenovo ThinkPad P14s G3 AMD 21J6S05000 | |
| Dell Precision 5000 5560 | |
| Lenovo ThinkPad P15v G2 21A9000XGE | |
| Lenovo ThinkPad P14s Gen1-20Y10002GE | |
| Lenovo ThinkPad P15v G3 21EM001AGE | |
| Blender / v2.79 BMW27 CPU | |
| HP ZBook Firefly 14 G9-6B8A2EA | |
| Lenovo ThinkPad P14s Gen1-20Y10002GE | |
| Lenovo ThinkPad P15v G2 21A9000XGE | |
| Dell Precision 5000 5560 | |
| Lenovo ThinkPad P14s G3 AMD 21J6S05000 | |
| HP ZBook Firefly 14 G10 A | |
| Lenovo ThinkPad P14s G4 21HF0017GE | |
| Dell Precision 5000 5470 | |
| Lenovo ThinkPad P15v G3 21EM001AGE | |
| Asus VivoBook 14X K3405 | |
| Lenovo ThinkPad P14s G4 21K5000LGE | |
| HP ZBook Power 15 G9 6B8C4EA | |
| Moyenne Intel Core Ultra 9 185H (163 - 285, n=4) | |
| Dell Precision 5480 | |
| Dell Precision 5000 5490 | |
| HP ZBook Power 15 G10 | |
| 7-Zip 18.03 / 7z b 4 | |
| HP ZBook Power 15 G10 | |
| Dell Precision 5000 5490 | |
| Moyenne Intel Core Ultra 9 185H (52522 - 76331, n=4) | |
| Dell Precision 5480 | |
| HP ZBook Power 15 G9 6B8C4EA | |
| Lenovo ThinkPad P14s G4 21K5000LGE | |
| Lenovo ThinkPad P14s G4 21HF0017GE | |
| Lenovo ThinkPad P15v G3 21EM001AGE | |
| Dell Precision 5000 5470 | |
| HP ZBook Firefly 14 G10 A | |
| Asus VivoBook 14X K3405 | |
| Lenovo ThinkPad P14s G3 AMD 21J6S05000 | |
| Dell Precision 5000 5560 | |
| Lenovo ThinkPad P14s Gen1-20Y10002GE | |
| Lenovo ThinkPad P15v G2 21A9000XGE | |
| HP ZBook Firefly 14 G9-6B8A2EA | |
| 7-Zip 18.03 / 7z b 4 -mmt1 | |
| HP ZBook Power 15 G10 | |
| Lenovo ThinkPad P14s G4 21HF0017GE | |
| Dell Precision 5480 | |
| HP ZBook Firefly 14 G10 A | |
| Lenovo ThinkPad P14s G4 21K5000LGE | |
| HP ZBook Power 15 G9 6B8C4EA | |
| Dell Precision 5000 5560 | |
| HP ZBook Firefly 14 G9-6B8A2EA | |
| Asus VivoBook 14X K3405 | |
| Dell Precision 5000 5470 | |
| Dell Precision 5000 5490 | |
| Moyenne Intel Core Ultra 9 185H (4981 - 5781, n=4) | |
| Lenovo ThinkPad P15v G3 21EM001AGE | |
| Lenovo ThinkPad P15v G2 21A9000XGE | |
| Lenovo ThinkPad P14s G3 AMD 21J6S05000 | |
| Lenovo ThinkPad P14s Gen1-20Y10002GE | |
| Geekbench 6.2 / Multi-Core | |
| Dell Precision 5480 | |
| Dell Precision 5000 5490 | |
| Moyenne Intel Core Ultra 9 185H (13351 - 14160, n=4) | |
| HP ZBook Power 15 G10 | |
| Lenovo ThinkPad P14s G4 21HF0017GE | |
| Lenovo ThinkPad P14s G4 21K5000LGE | |
| HP ZBook Firefly 14 G10 A | |
| Geekbench 6.2 / Single-Core | |
| Dell Precision 5480 | |
| Lenovo ThinkPad P14s G4 21HF0017GE | |
| HP ZBook Power 15 G10 | |
| Moyenne Intel Core Ultra 9 185H (2384 - 2570, n=4) | |
| Lenovo ThinkPad P14s G4 21K5000LGE | |
| Dell Precision 5000 5490 | |
| HP ZBook Firefly 14 G10 A | |
| Geekbench 5.5 / Multi-Core | |
| Dell Precision 5480 | |
| Moyenne Intel Core Ultra 9 185H (10441 - 14230, n=4) | |
| Dell Precision 5000 5490 | |
| Dell Precision 5000 5470 | |
| HP ZBook Power 15 G10 | |
| Lenovo ThinkPad P14s G4 21HF0017GE | |
| HP ZBook Power 15 G9 6B8C4EA | |
| Lenovo ThinkPad P14s G4 21K5000LGE | |
| Asus VivoBook 14X K3405 | |
| HP ZBook Firefly 14 G10 A | |
| HP ZBook Firefly 14 G9-6B8A2EA | |
| Lenovo ThinkPad P15v G3 21EM001AGE | |
| Lenovo ThinkPad P14s G3 AMD 21J6S05000 | |
| Lenovo ThinkPad P15v G2 21A9000XGE | |
| Lenovo ThinkPad P14s Gen1-20Y10002GE | |
| Geekbench 5.5 / Single-Core | |
| HP ZBook Power 15 G10 | |
| Dell Precision 5480 | |
| Lenovo ThinkPad P14s G4 21HF0017GE | |
| Moyenne Intel Core Ultra 9 185H (1759 - 1902, n=4) | |
| Dell Precision 5000 5470 | |
| Dell Precision 5000 5490 | |
| HP ZBook Firefly 14 G10 A | |
| Lenovo ThinkPad P14s G4 21K5000LGE | |
| HP ZBook Power 15 G9 6B8C4EA | |
| HP ZBook Firefly 14 G9-6B8A2EA | |
| Asus VivoBook 14X K3405 | |
| Lenovo ThinkPad P14s G3 AMD 21J6S05000 | |
| Lenovo ThinkPad P15v G2 21A9000XGE | |
| Lenovo ThinkPad P15v G3 21EM001AGE | |
| Lenovo ThinkPad P14s Gen1-20Y10002GE | |
| HWBOT x265 Benchmark v2.2 / 4k Preset | |
| HP ZBook Power 15 G10 | |
| Moyenne Intel Core Ultra 9 185H (14.1 - 22.7, n=4) | |
| Dell Precision 5480 | |
| Dell Precision 5000 5490 | |
| Lenovo ThinkPad P14s G4 21K5000LGE | |
| HP ZBook Power 15 G9 6B8C4EA | |
| Asus VivoBook 14X K3405 | |
| Lenovo ThinkPad P14s G4 21HF0017GE | |
| HP ZBook Firefly 14 G10 A | |
| Dell Precision 5000 5470 | |
| Lenovo ThinkPad P14s G3 AMD 21J6S05000 | |
| Lenovo ThinkPad P15v G3 21EM001AGE | |
| Dell Precision 5000 5560 | |
| Lenovo ThinkPad P15v G2 21A9000XGE | |
| HP ZBook Firefly 14 G9-6B8A2EA | |
| Lenovo ThinkPad P14s Gen1-20Y10002GE | |
| LibreOffice / 20 Documents To PDF | |
| Lenovo ThinkPad P15v G3 21EM001AGE | |
| Lenovo ThinkPad P14s Gen1-20Y10002GE | |
| Lenovo ThinkPad P14s G3 AMD 21J6S05000 | |
| HP ZBook Firefly 14 G10 A | |
| HP ZBook Power 15 G10 | |
| Lenovo ThinkPad P15v G2 21A9000XGE | |
| Lenovo ThinkPad P14s G4 21K5000LGE | |
| Asus VivoBook 14X K3405 | |
| Dell Precision 5000 5560 | |
| Dell Precision 5000 5470 | |
| Dell Precision 5480 | |
| HP ZBook Firefly 14 G9-6B8A2EA | |
| HP ZBook Power 15 G9 6B8C4EA | |
| Lenovo ThinkPad P14s G4 21HF0017GE | |
| Dell Precision 5000 5490 | |
| Moyenne Intel Core Ultra 9 185H (39.7 - 44.6, n=4) | |
| R Benchmark 2.5 / Overall mean | |
| Lenovo ThinkPad P14s Gen1-20Y10002GE | |
| Lenovo ThinkPad P15v G2 21A9000XGE | |
| Dell Precision 5000 5560 | |
| Lenovo ThinkPad P14s G3 AMD 21J6S05000 | |
| Lenovo ThinkPad P15v G3 21EM001AGE | |
| Asus VivoBook 14X K3405 | |
| HP ZBook Firefly 14 G10 A | |
| Lenovo ThinkPad P14s G4 21K5000LGE | |
| HP ZBook Firefly 14 G9-6B8A2EA | |
| Dell Precision 5000 5470 | |
| Dell Precision 5000 5490 | |
| HP ZBook Power 15 G9 6B8C4EA | |
| Moyenne Intel Core Ultra 9 185H (0.4457 - 0.4757, n=4) | |
| Dell Precision 5480 | |
| HP ZBook Power 15 G10 | |
| Lenovo ThinkPad P14s G4 21HF0017GE | |
Cinebench R23: Multi Core | Single Core
Cinebench R20: CPU (Multi Core) | CPU (Single Core)
Cinebench R15: CPU Multi 64Bit | CPU Single 64Bit
Blender: v2.79 BMW27 CPU
7-Zip 18.03: 7z b 4 | 7z b 4 -mmt1
Geekbench 6.2: Multi-Core | Single-Core
Geekbench 5.5: Multi-Core | Single-Core
HWBOT x265 Benchmark v2.2: 4k Preset
LibreOffice : 20 Documents To PDF
R Benchmark 2.5: Overall mean
* ... Moindre est la valeur, meilleures sont les performances
AIDA64: FP32 Ray-Trace | FPU Julia | CPU SHA3 | CPU Queen | FPU SinJulia | FPU Mandel | CPU AES | CPU ZLib | FP64 Ray-Trace | CPU PhotoWorxx
| Performance Rating | |
| Moyenne Intel Core Ultra 9 185H | |
| Dell Precision 5480 | |
| Dell Precision 5000 5490 | |
| HP ZBook Firefly 14 G10 A | |
| Dell Precision 5000 5470 | |
| Lenovo ThinkPad P14s G4 21HF0017GE | |
| HP ZBook Firefly 14 G9-6B8A2EA | |
| AIDA64 / FP32 Ray-Trace | |
| HP ZBook Firefly 14 G10 A | |
| Dell Precision 5480 | |
| Moyenne Intel Core Ultra 9 185H (9220 - 18502, n=4) | |
| Dell Precision 5000 5490 | |
| Dell Precision 5000 5470 | |
| Lenovo ThinkPad P14s G4 21HF0017GE | |
| HP ZBook Firefly 14 G9-6B8A2EA | |
| AIDA64 / FPU Julia | |
| Moyenne Intel Core Ultra 9 185H (48865 - 95213, n=4) | |
| HP ZBook Firefly 14 G10 A | |
| Dell Precision 5000 5490 | |
| Dell Precision 5480 | |
| Dell Precision 5000 5470 | |
| Lenovo ThinkPad P14s G4 21HF0017GE | |
| HP ZBook Firefly 14 G9-6B8A2EA | |
| AIDA64 / CPU SHA3 | |
| Dell Precision 5000 5490 | |
| Moyenne Intel Core Ultra 9 185H (2394 - 4382, n=4) | |
| Dell Precision 5480 | |
| HP ZBook Firefly 14 G10 A | |
| Dell Precision 5000 5470 | |
| Lenovo ThinkPad P14s G4 21HF0017GE | |
| HP ZBook Firefly 14 G9-6B8A2EA | |
| AIDA64 / CPU Queen | |
| Dell Precision 5480 | |
| Dell Precision 5000 5470 | |
| Lenovo ThinkPad P14s G4 21HF0017GE | |
| Dell Precision 5000 5490 | |
| HP ZBook Firefly 14 G10 A | |
| Moyenne Intel Core Ultra 9 185H (66785 - 94589, n=4) | |
| HP ZBook Firefly 14 G9-6B8A2EA | |
| AIDA64 / FPU SinJulia | |
| HP ZBook Firefly 14 G10 A | |
| Dell Precision 5000 5490 | |
| Moyenne Intel Core Ultra 9 185H (7255 - 11392, n=4) | |
| Dell Precision 5480 | |
| Dell Precision 5000 5470 | |
| Lenovo ThinkPad P14s G4 21HF0017GE | |
| HP ZBook Firefly 14 G9-6B8A2EA | |
| AIDA64 / FPU Mandel | |
| HP ZBook Firefly 14 G10 A | |
| Moyenne Intel Core Ultra 9 185H (24004 - 47315, n=4) | |
| Dell Precision 5480 | |
| Dell Precision 5000 5490 | |
| Dell Precision 5000 5470 | |
| Lenovo ThinkPad P14s G4 21HF0017GE | |
| HP ZBook Firefly 14 G9-6B8A2EA | |
| AIDA64 / CPU AES | |
| Moyenne Intel Core Ultra 9 185H (53116 - 94250, n=4) | |
| Dell Precision 5000 5490 | |
| Dell Precision 5480 | |
| HP ZBook Firefly 14 G10 A | |
| Lenovo ThinkPad P14s G4 21HF0017GE | |
| HP ZBook Firefly 14 G9-6B8A2EA | |
| Dell Precision 5000 5470 | |
| AIDA64 / CPU ZLib | |
| Moyenne Intel Core Ultra 9 185H (678 - 1341, n=4) | |
| Dell Precision 5000 5490 | |
| Dell Precision 5480 | |
| Lenovo ThinkPad P14s G4 21HF0017GE | |
| HP ZBook Firefly 14 G10 A | |
| HP ZBook Firefly 14 G9-6B8A2EA | |
| Dell Precision 5000 5470 | |
| AIDA64 / FP64 Ray-Trace | |
| HP ZBook Firefly 14 G10 A | |
| Dell Precision 5480 | |
| Moyenne Intel Core Ultra 9 185H (4428 - 9768, n=4) | |
| Dell Precision 5000 5490 | |
| Dell Precision 5000 5470 | |
| Lenovo ThinkPad P14s G4 21HF0017GE | |
| HP ZBook Firefly 14 G9-6B8A2EA | |
| AIDA64 / CPU PhotoWorxx | |
| Moyenne Intel Core Ultra 9 185H (50237 - 53918, n=4) | |
| Dell Precision 5000 5490 | |
| Dell Precision 5480 | |
| Dell Precision 5000 5470 | |
| HP ZBook Firefly 14 G9-6B8A2EA | |
| Lenovo ThinkPad P14s G4 21HF0017GE | |
| HP ZBook Firefly 14 G10 A | |
Test de stress
La fréquence d'horloge du cœur et la consommation d'énergie de la carte atteignaient respectivement 3,3 GHz et 92 W lors de l'initialisation du stress Prime95. Cependant, ils retombent très rapidement à 2,2 GHz et 55 W en moyenne pour maintenir une température de cœur très élevée de 101 C. Les résultats sont similaires à ceux que nous avons enregistrés sur le Precision 5480 de l'année dernière, si ce n'est qu'ils sont légèrement plus chauds.
Il est intéressant de noter que la consommation d'énergie de la carte GPU lors de l'utilisation de Witcher 3 s'est stabilisée à 35 W alors que le GPU du Precision 5480 de l'année dernière s'est stabilisé à 45 W même en mode Ultra Performance. La consommation d'énergie de la carte peut expliquer en partie les performances graphiques légèrement plus lentes décrites dans la section Performances du GPU ci-dessous.
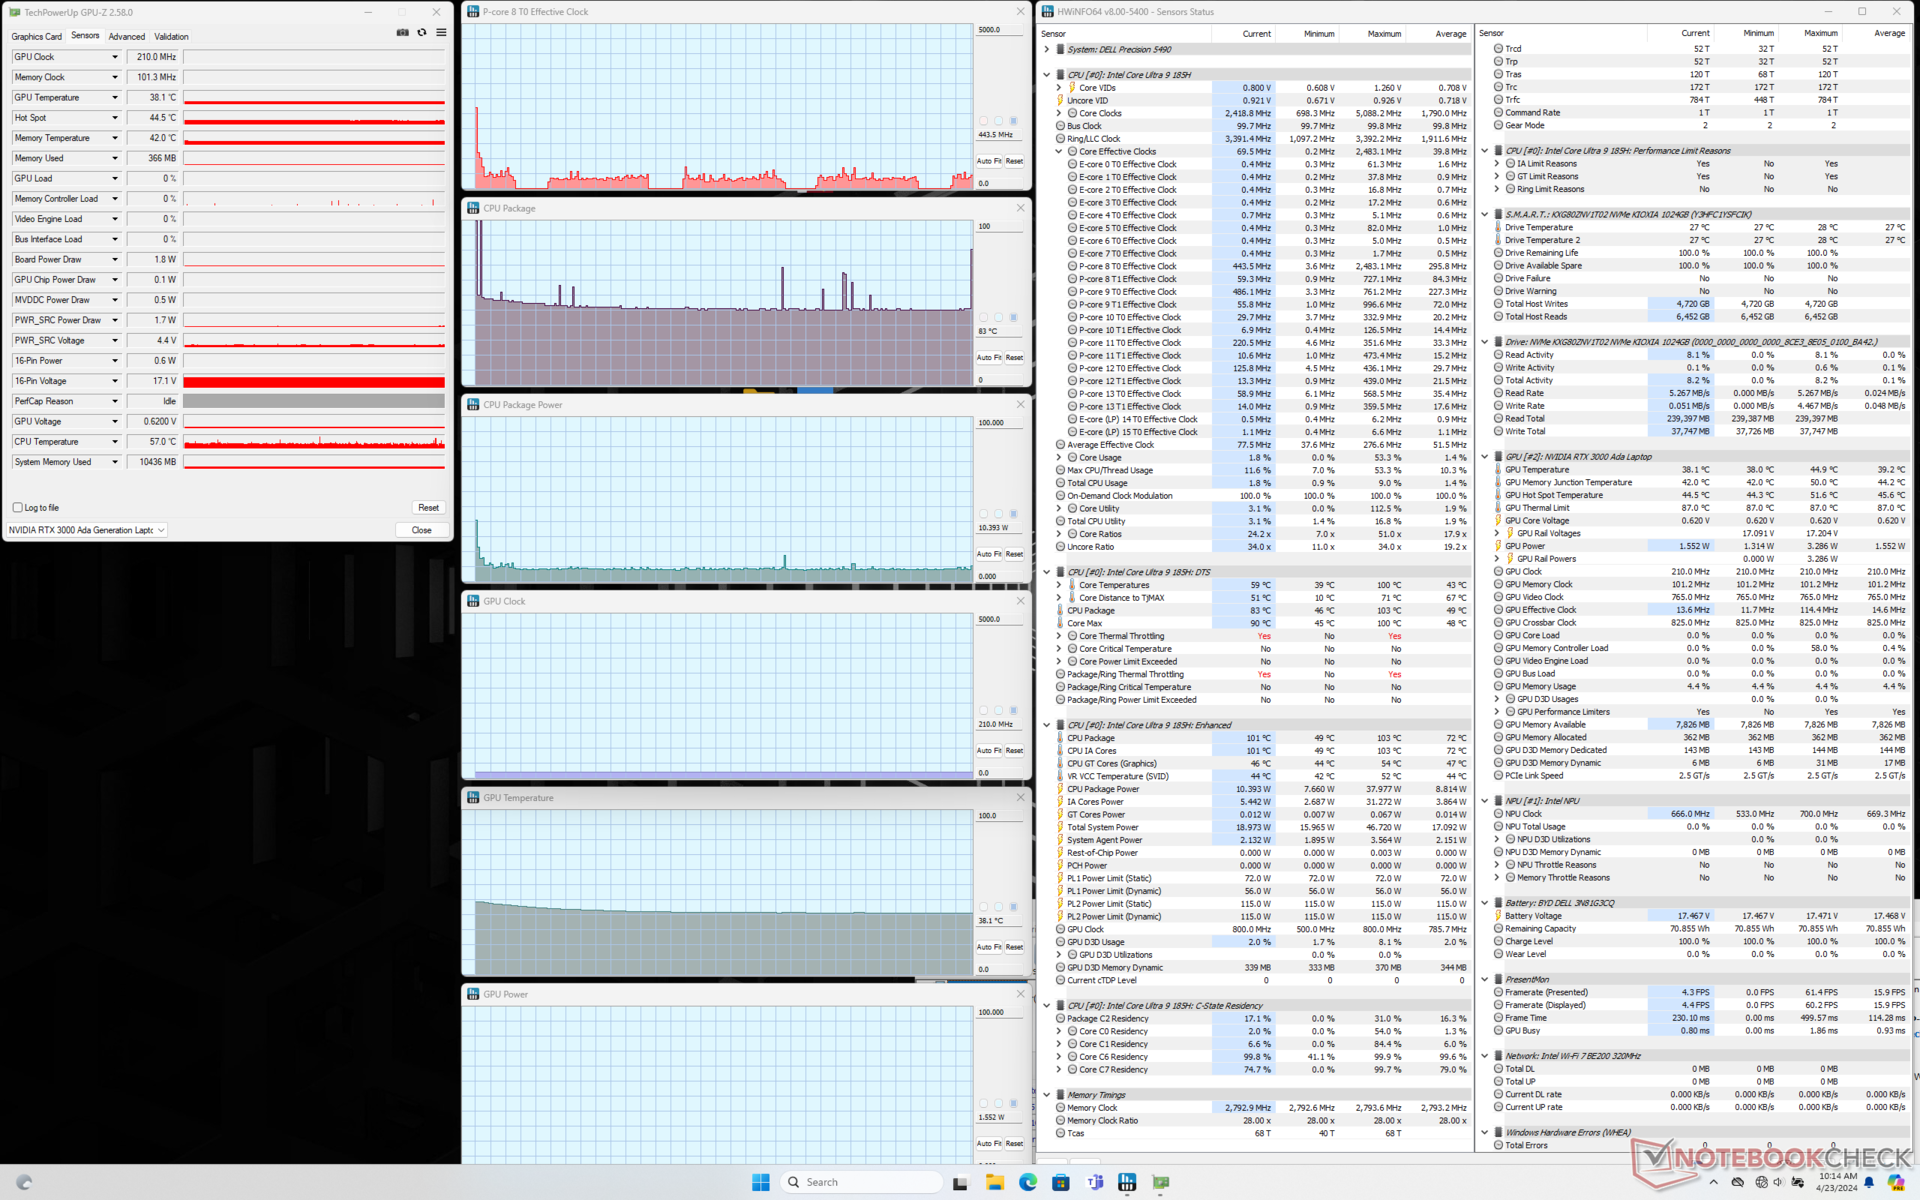
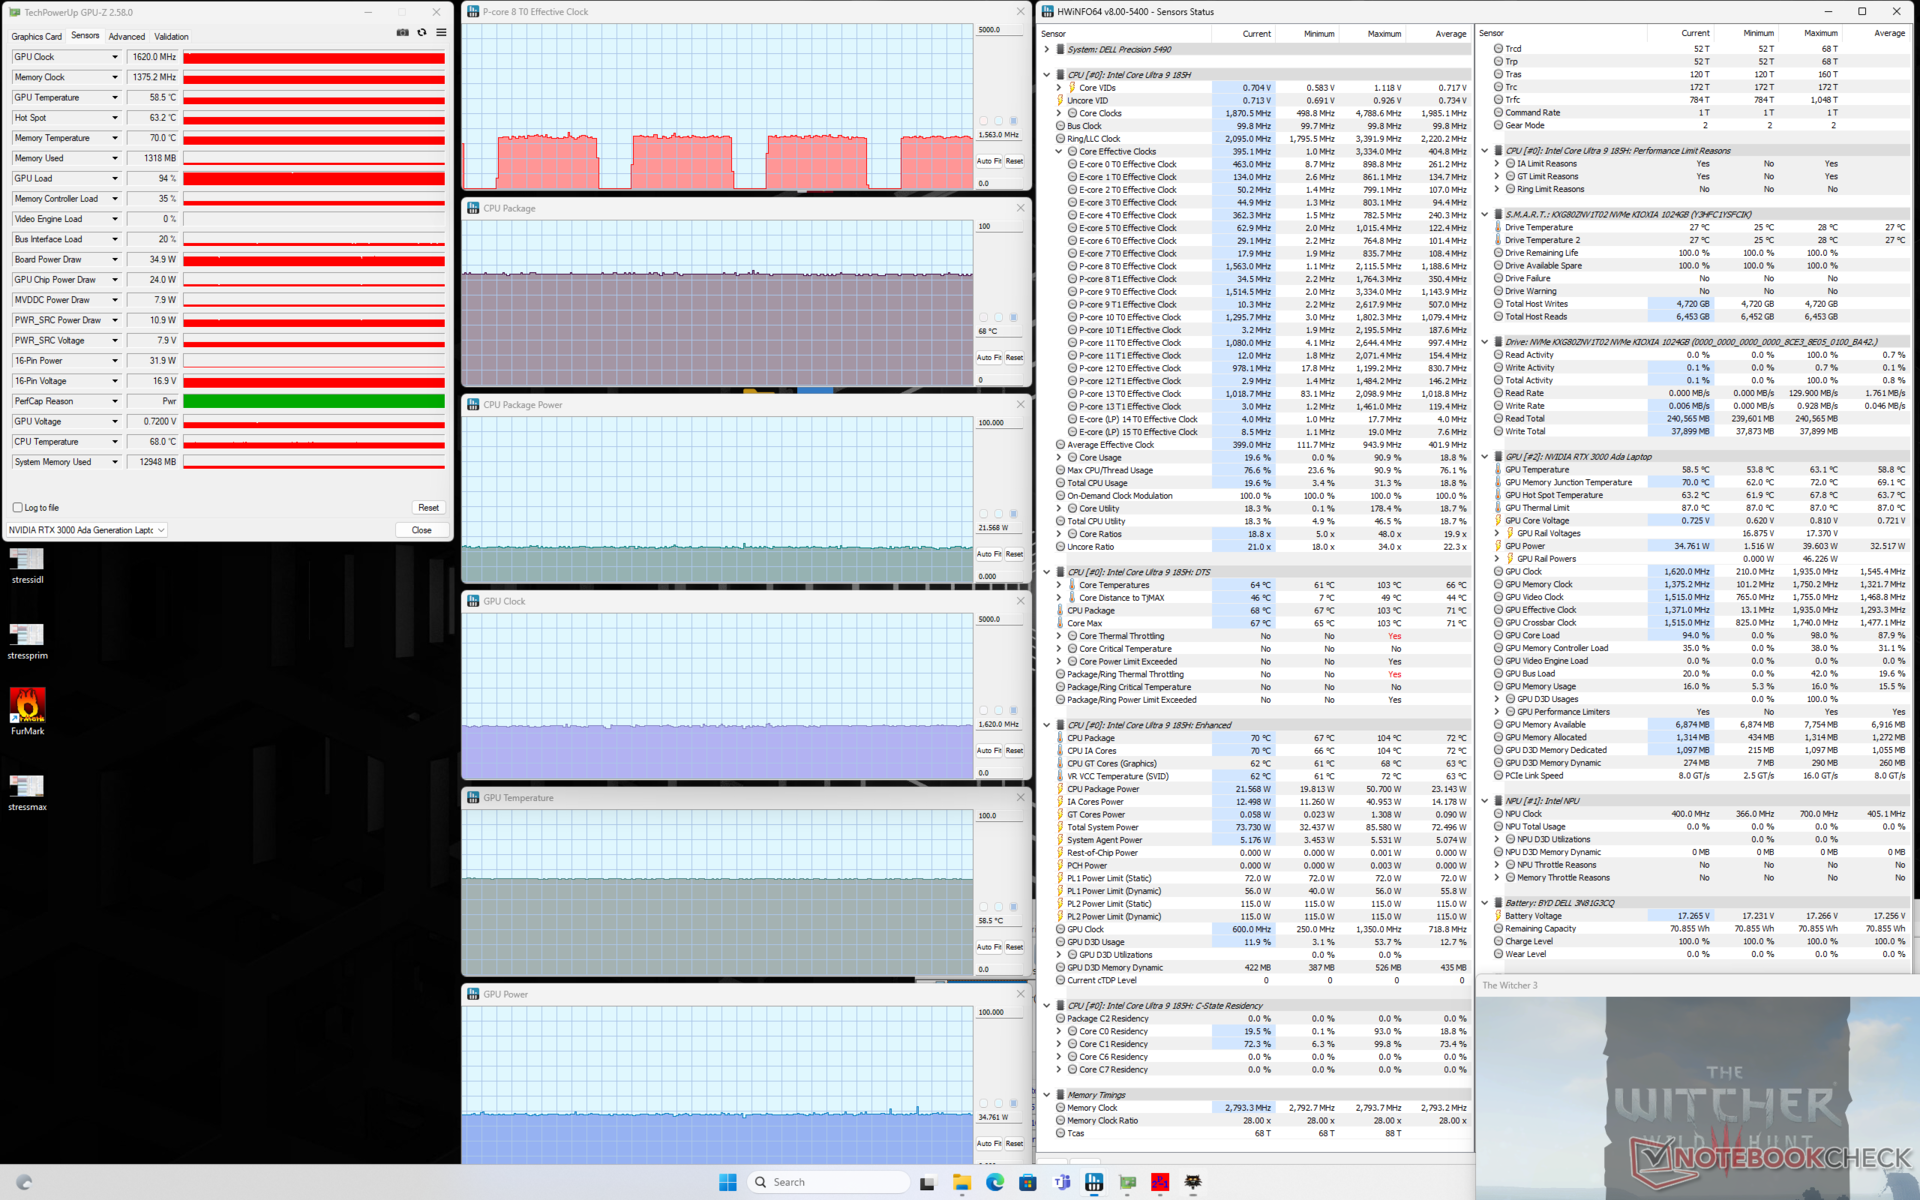
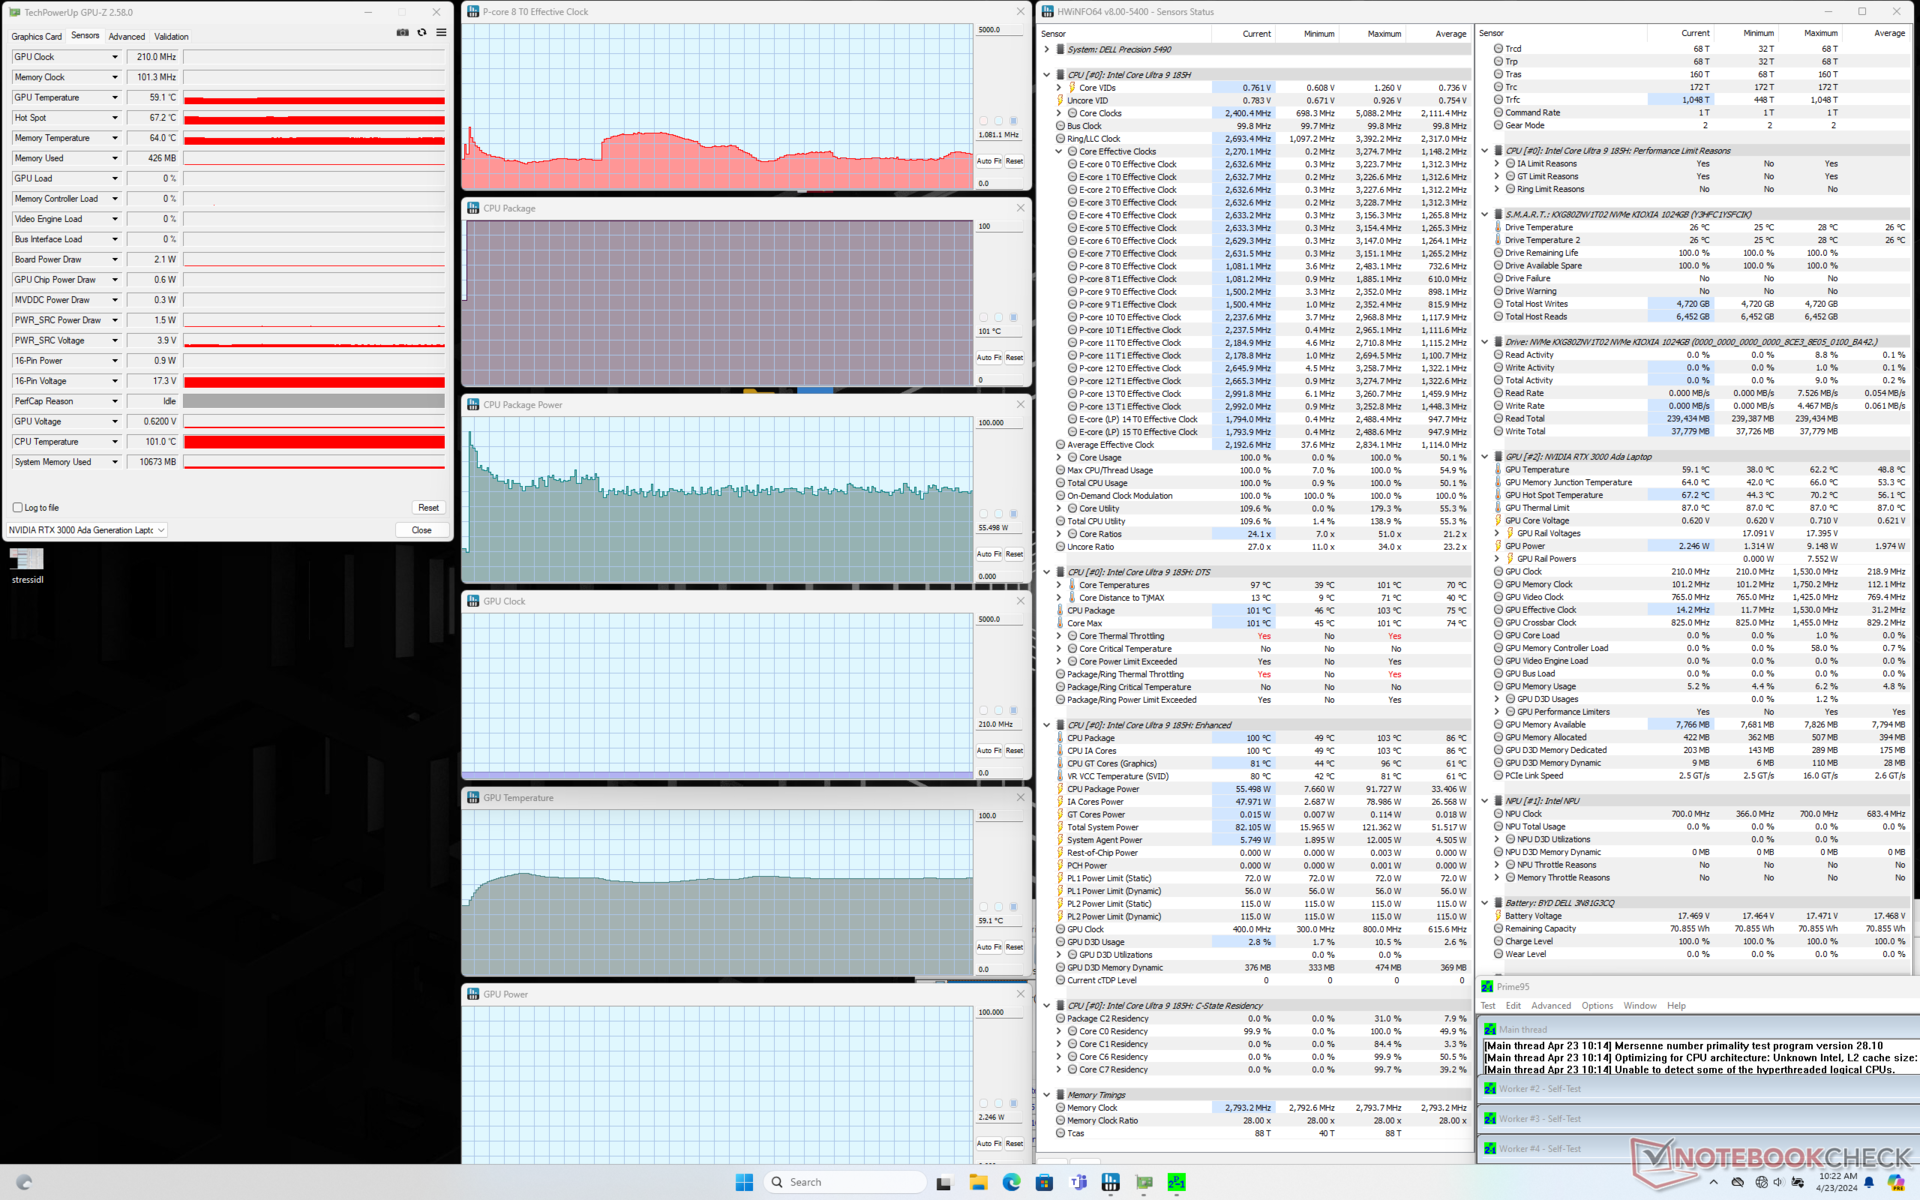
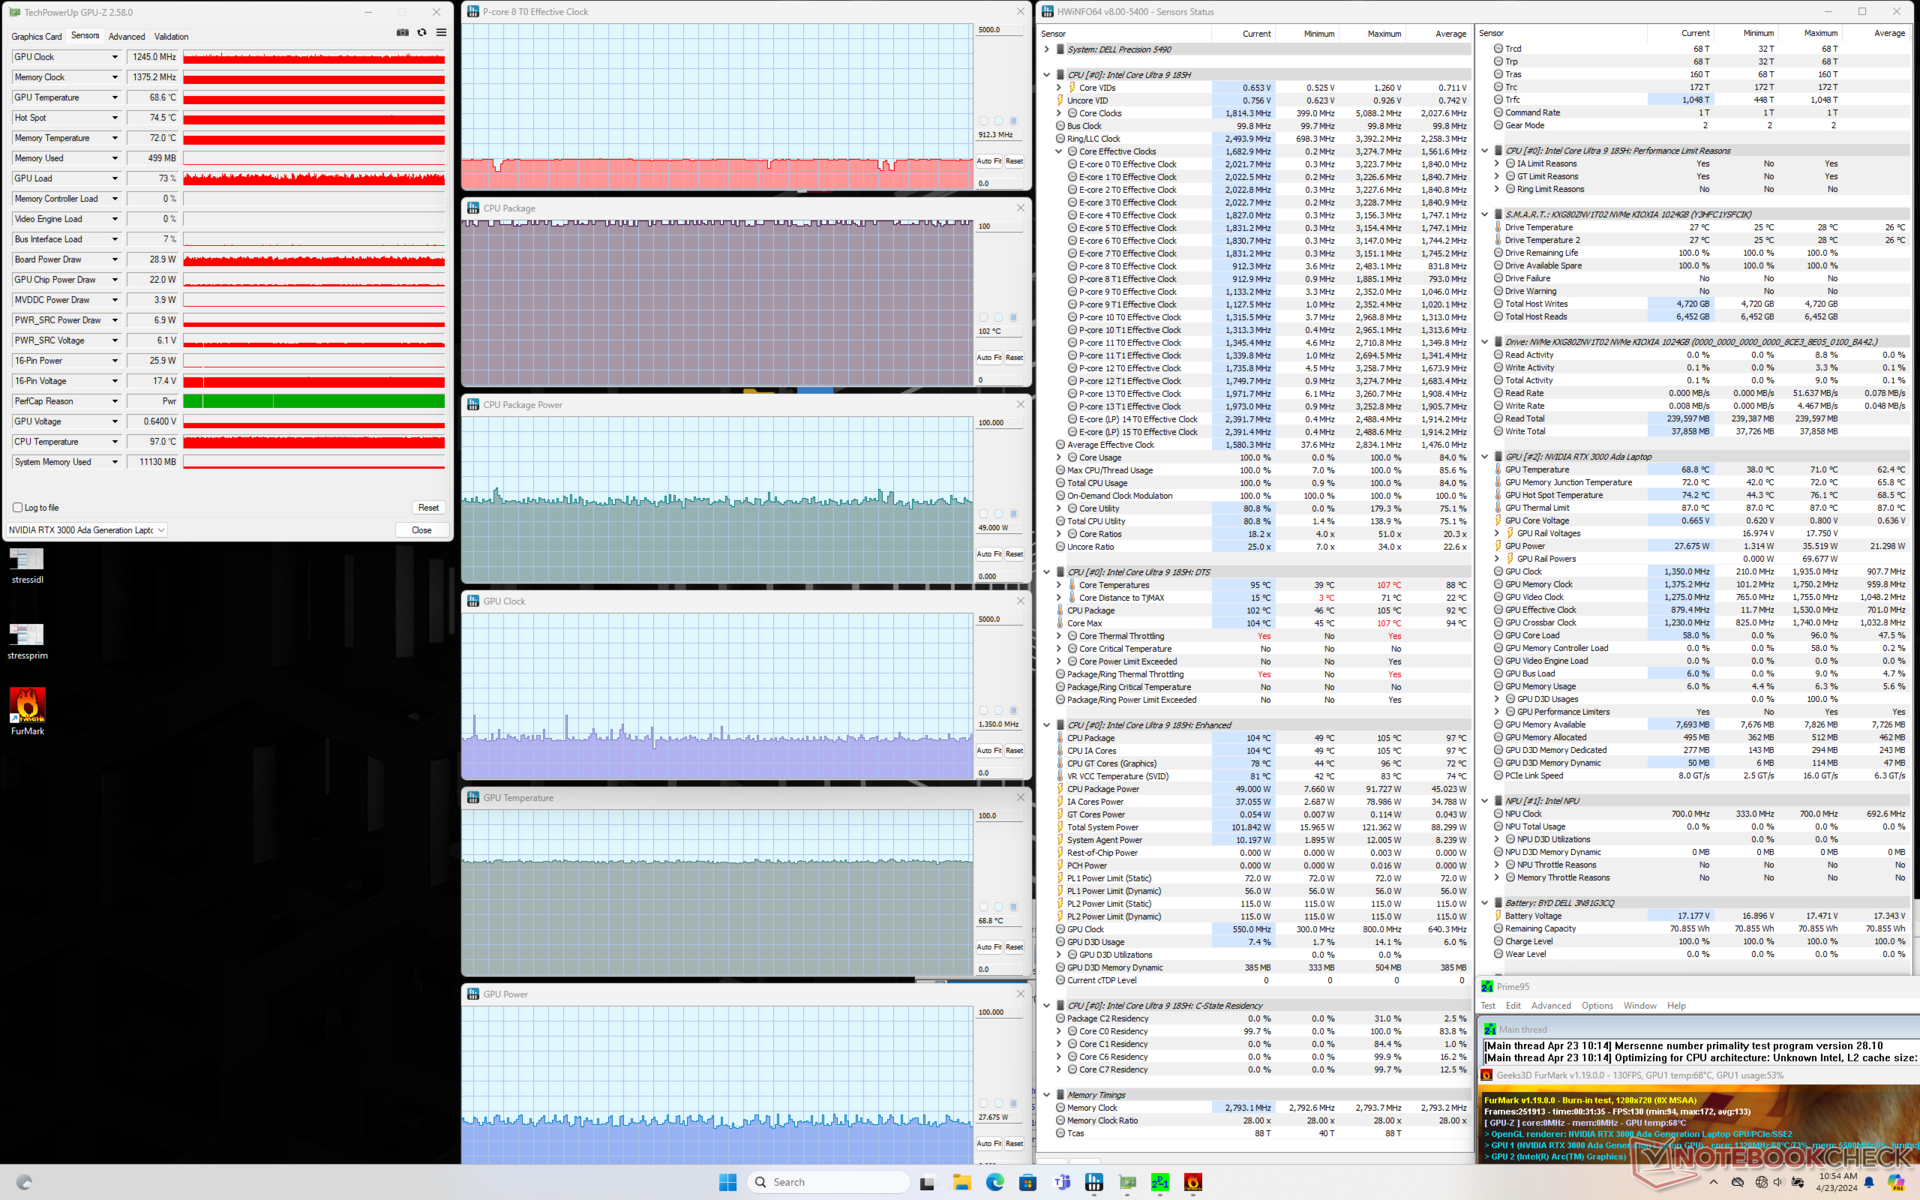
| Horloge du CPU (GHz) | Horloge du GPU (MHz) | Température moyenne du CPU (°C) | Température moyenne du GPU (°C) | |
| Système au repos | -- | -- | 45 | 38 |
| Prime95 Stress | 2.2 | -- | 101 | 59 |
| Prime95 + FurMark Stress | 1.6 | ~1350 | 101 | 69 |
| Witcher 3 Stress | 0,4 | 1620 | 68 | 59 |
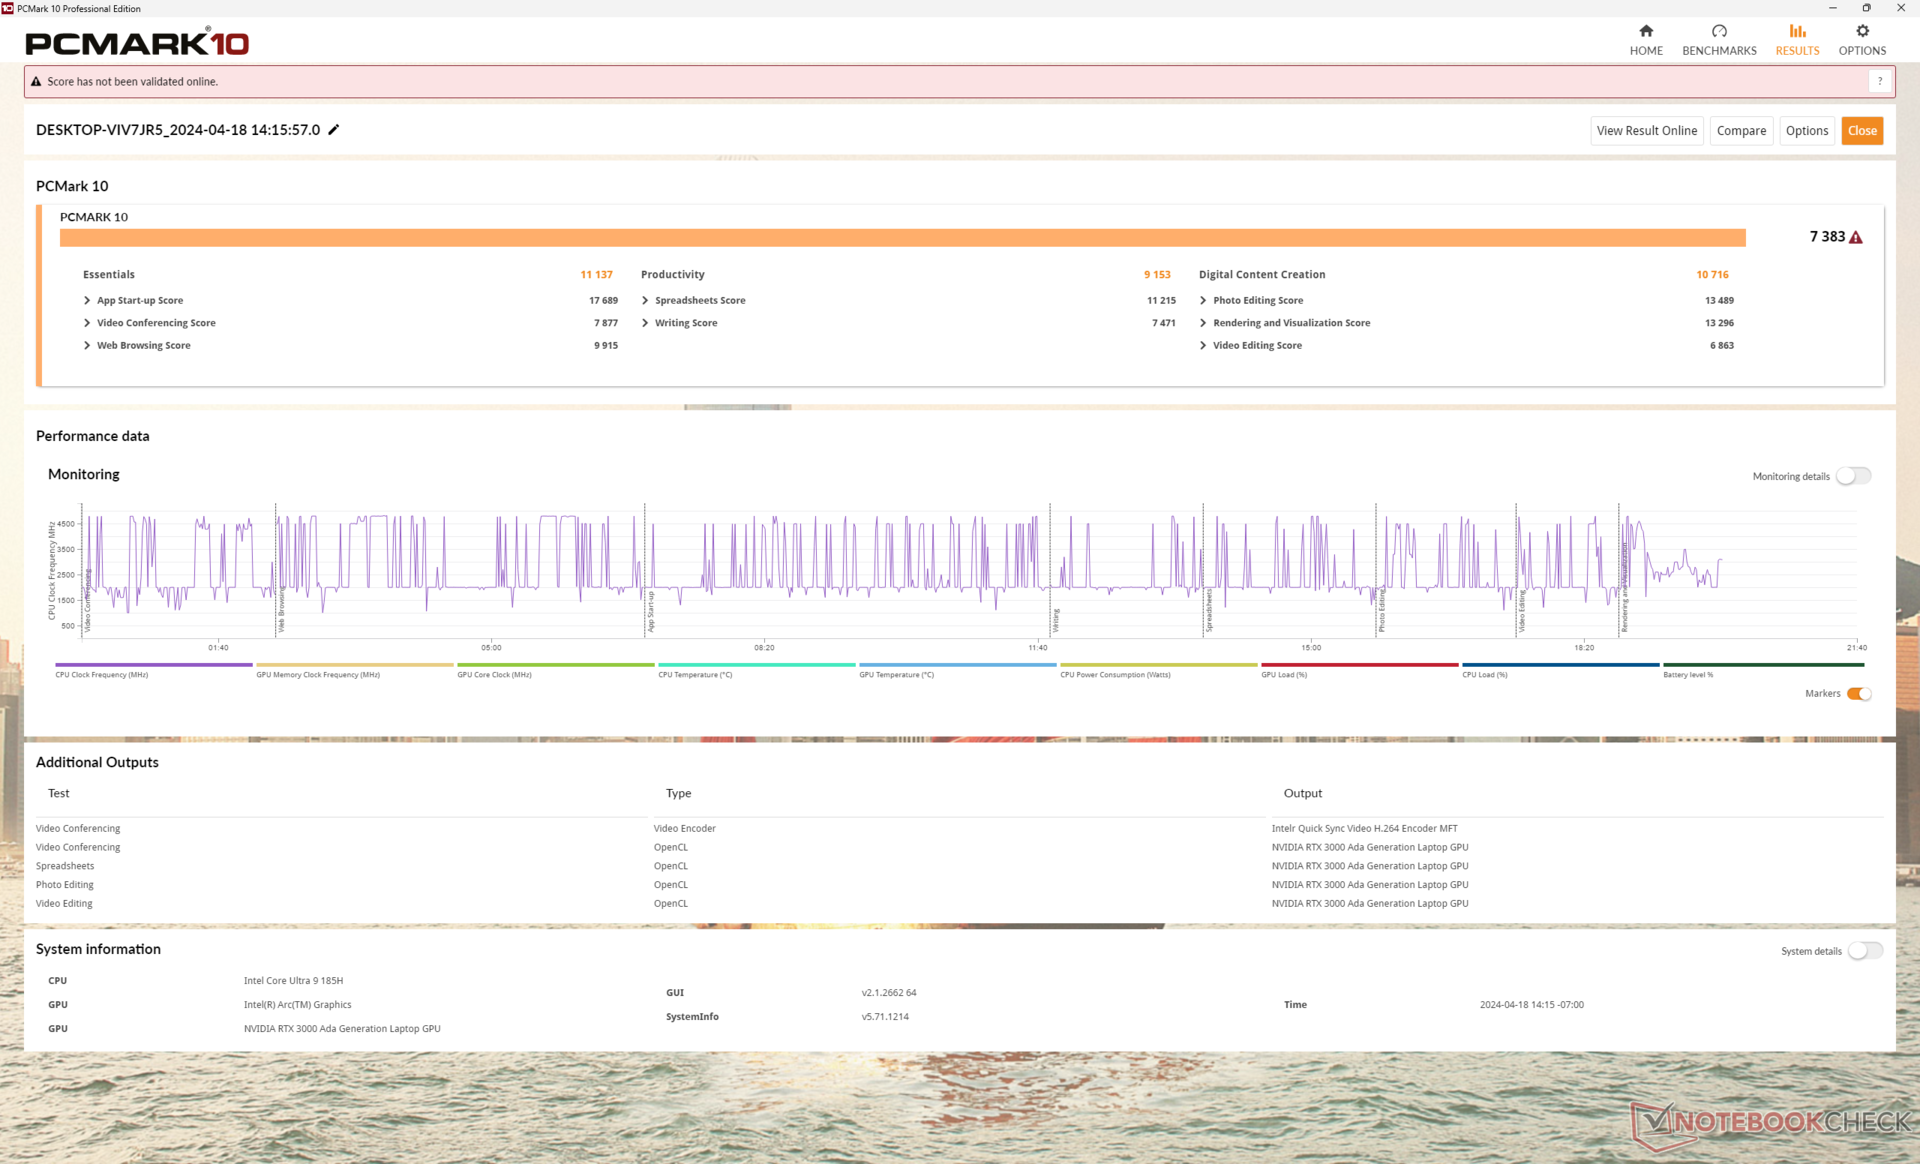
Performance du système
Les résultats de PCMark sont presque identiques à ceux que nous avons enregistrés sur le Precision 5480 de l'année dernière et ne suggèrent pas d'avantages majeurs en termes de performances pour les tâches multitâches générales ou d'édition vidéo. Les benchmarks PCMark AI, que nous n'avons pas encore exécutés, peuvent mieux différencier les ordinateurs portables avec NPU intégré comme notre Precision 5490 des modèles plus anciens.
CrossMark: Overall | Productivity | Creativity | Responsiveness
WebXPRT 3: Overall
WebXPRT 4: Overall
Mozilla Kraken 1.1: Total
| PCMark 10 / Score | |
| Dell Precision 5480 | |
| Dell Precision 5000 5490 | |
| Moyenne Intel Core Ultra 9 185H, NVIDIA RTX 3000 Ada Generation Laptop GPU () | |
| Dell Precision 5000 5470 | |
| HP ZBook Firefly 14 G10 A | |
| HP ZBook Firefly 14 G9-6B8A2EA | |
| PCMark 10 / Essentials | |
| Dell Precision 5480 | |
| Dell Precision 5000 5490 | |
| Moyenne Intel Core Ultra 9 185H, NVIDIA RTX 3000 Ada Generation Laptop GPU () | |
| Dell Precision 5000 5470 | |
| HP ZBook Firefly 14 G9-6B8A2EA | |
| HP ZBook Firefly 14 G10 A | |
| PCMark 10 / Productivity | |
| HP ZBook Firefly 14 G9-6B8A2EA | |
| Dell Precision 5480 | |
| HP ZBook Firefly 14 G10 A | |
| Dell Precision 5000 5490 | |
| Moyenne Intel Core Ultra 9 185H, NVIDIA RTX 3000 Ada Generation Laptop GPU () | |
| Dell Precision 5000 5470 | |
| PCMark 10 / Digital Content Creation | |
| Dell Precision 5480 | |
| Dell Precision 5000 5490 | |
| Moyenne Intel Core Ultra 9 185H, NVIDIA RTX 3000 Ada Generation Laptop GPU () | |
| Dell Precision 5000 5470 | |
| HP ZBook Firefly 14 G10 A | |
| HP ZBook Firefly 14 G9-6B8A2EA | |
| CrossMark / Overall | |
| Dell Precision 5480 | |
| Lenovo ThinkPad P14s G4 21HF0017GE | |
| Dell Precision 5000 5470 | |
| Dell Precision 5000 5490 | |
| Moyenne Intel Core Ultra 9 185H, NVIDIA RTX 3000 Ada Generation Laptop GPU () | |
| HP ZBook Firefly 14 G9-6B8A2EA | |
| CrossMark / Productivity | |
| Dell Precision 5480 | |
| Lenovo ThinkPad P14s G4 21HF0017GE | |
| Dell Precision 5000 5470 | |
| Dell Precision 5000 5490 | |
| Moyenne Intel Core Ultra 9 185H, NVIDIA RTX 3000 Ada Generation Laptop GPU () | |
| HP ZBook Firefly 14 G9-6B8A2EA | |
| CrossMark / Creativity | |
| Dell Precision 5480 | |
| Dell Precision 5000 5470 | |
| Lenovo ThinkPad P14s G4 21HF0017GE | |
| Dell Precision 5000 5490 | |
| Moyenne Intel Core Ultra 9 185H, NVIDIA RTX 3000 Ada Generation Laptop GPU () | |
| HP ZBook Firefly 14 G9-6B8A2EA | |
| CrossMark / Responsiveness | |
| Dell Precision 5480 | |
| Lenovo ThinkPad P14s G4 21HF0017GE | |
| Dell Precision 5000 5470 | |
| Dell Precision 5000 5490 | |
| Moyenne Intel Core Ultra 9 185H, NVIDIA RTX 3000 Ada Generation Laptop GPU () | |
| HP ZBook Firefly 14 G9-6B8A2EA | |
| WebXPRT 3 / Overall | |
| Dell Precision 5480 | |
| Dell Precision 5000 5470 | |
| Lenovo ThinkPad P14s G4 21HF0017GE | |
| Dell Precision 5000 5490 | |
| Moyenne Intel Core Ultra 9 185H, NVIDIA RTX 3000 Ada Generation Laptop GPU () | |
| HP ZBook Firefly 14 G9-6B8A2EA | |
| HP ZBook Firefly 14 G10 A | |
| HP ZBook Firefly 14 G10 A | |
| WebXPRT 4 / Overall | |
| Dell Precision 5480 | |
| Dell Precision 5000 5470 | |
| Dell Precision 5000 5490 | |
| Moyenne Intel Core Ultra 9 185H, NVIDIA RTX 3000 Ada Generation Laptop GPU () | |
| HP ZBook Firefly 14 G9-6B8A2EA | |
| Mozilla Kraken 1.1 / Total | |
| HP ZBook Firefly 14 G10 A | |
| HP ZBook Firefly 14 G10 A | |
| HP ZBook Firefly 14 G9-6B8A2EA | |
| Dell Precision 5000 5470 | |
| Dell Precision 5000 5490 | |
| Moyenne Intel Core Ultra 9 185H, NVIDIA RTX 3000 Ada Generation Laptop GPU () | |
| Dell Precision 5480 | |
| Lenovo ThinkPad P14s G4 21HF0017GE | |
* ... Moindre est la valeur, meilleures sont les performances
| PCMark 10 Score | 7383 points | |
Aide | ||
| AIDA64 / Memory Copy | |
| Dell Precision 5000 5490 | |
| Moyenne Intel Core Ultra 9 185H (91178 - 95718, n=4) | |
| Dell Precision 5480 | |
| Dell Precision 5000 5470 | |
| HP ZBook Firefly 14 G10 A | |
| Lenovo ThinkPad P14s G4 21HF0017GE | |
| HP ZBook Firefly 14 G9-6B8A2EA | |
| AIDA64 / Memory Read | |
| Moyenne Intel Core Ultra 9 185H (83175 - 87768, n=4) | |
| Dell Precision 5000 5490 | |
| Dell Precision 5000 5470 | |
| Dell Precision 5480 | |
| HP ZBook Firefly 14 G9-6B8A2EA | |
| HP ZBook Firefly 14 G10 A | |
| Lenovo ThinkPad P14s G4 21HF0017GE | |
| AIDA64 / Memory Write | |
| Dell Precision 5000 5490 | |
| Dell Precision 5480 | |
| Moyenne Intel Core Ultra 9 185H (73682 - 93871, n=4) | |
| HP ZBook Firefly 14 G10 A | |
| Lenovo ThinkPad P14s G4 21HF0017GE | |
| HP ZBook Firefly 14 G9-6B8A2EA | |
| Dell Precision 5000 5470 | |
| AIDA64 / Memory Latency | |
| Dell Precision 5000 5490 | |
| Moyenne Intel Core Ultra 9 185H (129.6 - 144.5, n=4) | |
| Dell Precision 5000 5470 | |
| HP ZBook Firefly 14 G10 A | |
| Lenovo ThinkPad P14s G4 21HF0017GE | |
| Dell Precision 5480 | |
| HP ZBook Firefly 14 G9-6B8A2EA | |
* ... Moindre est la valeur, meilleures sont les performances
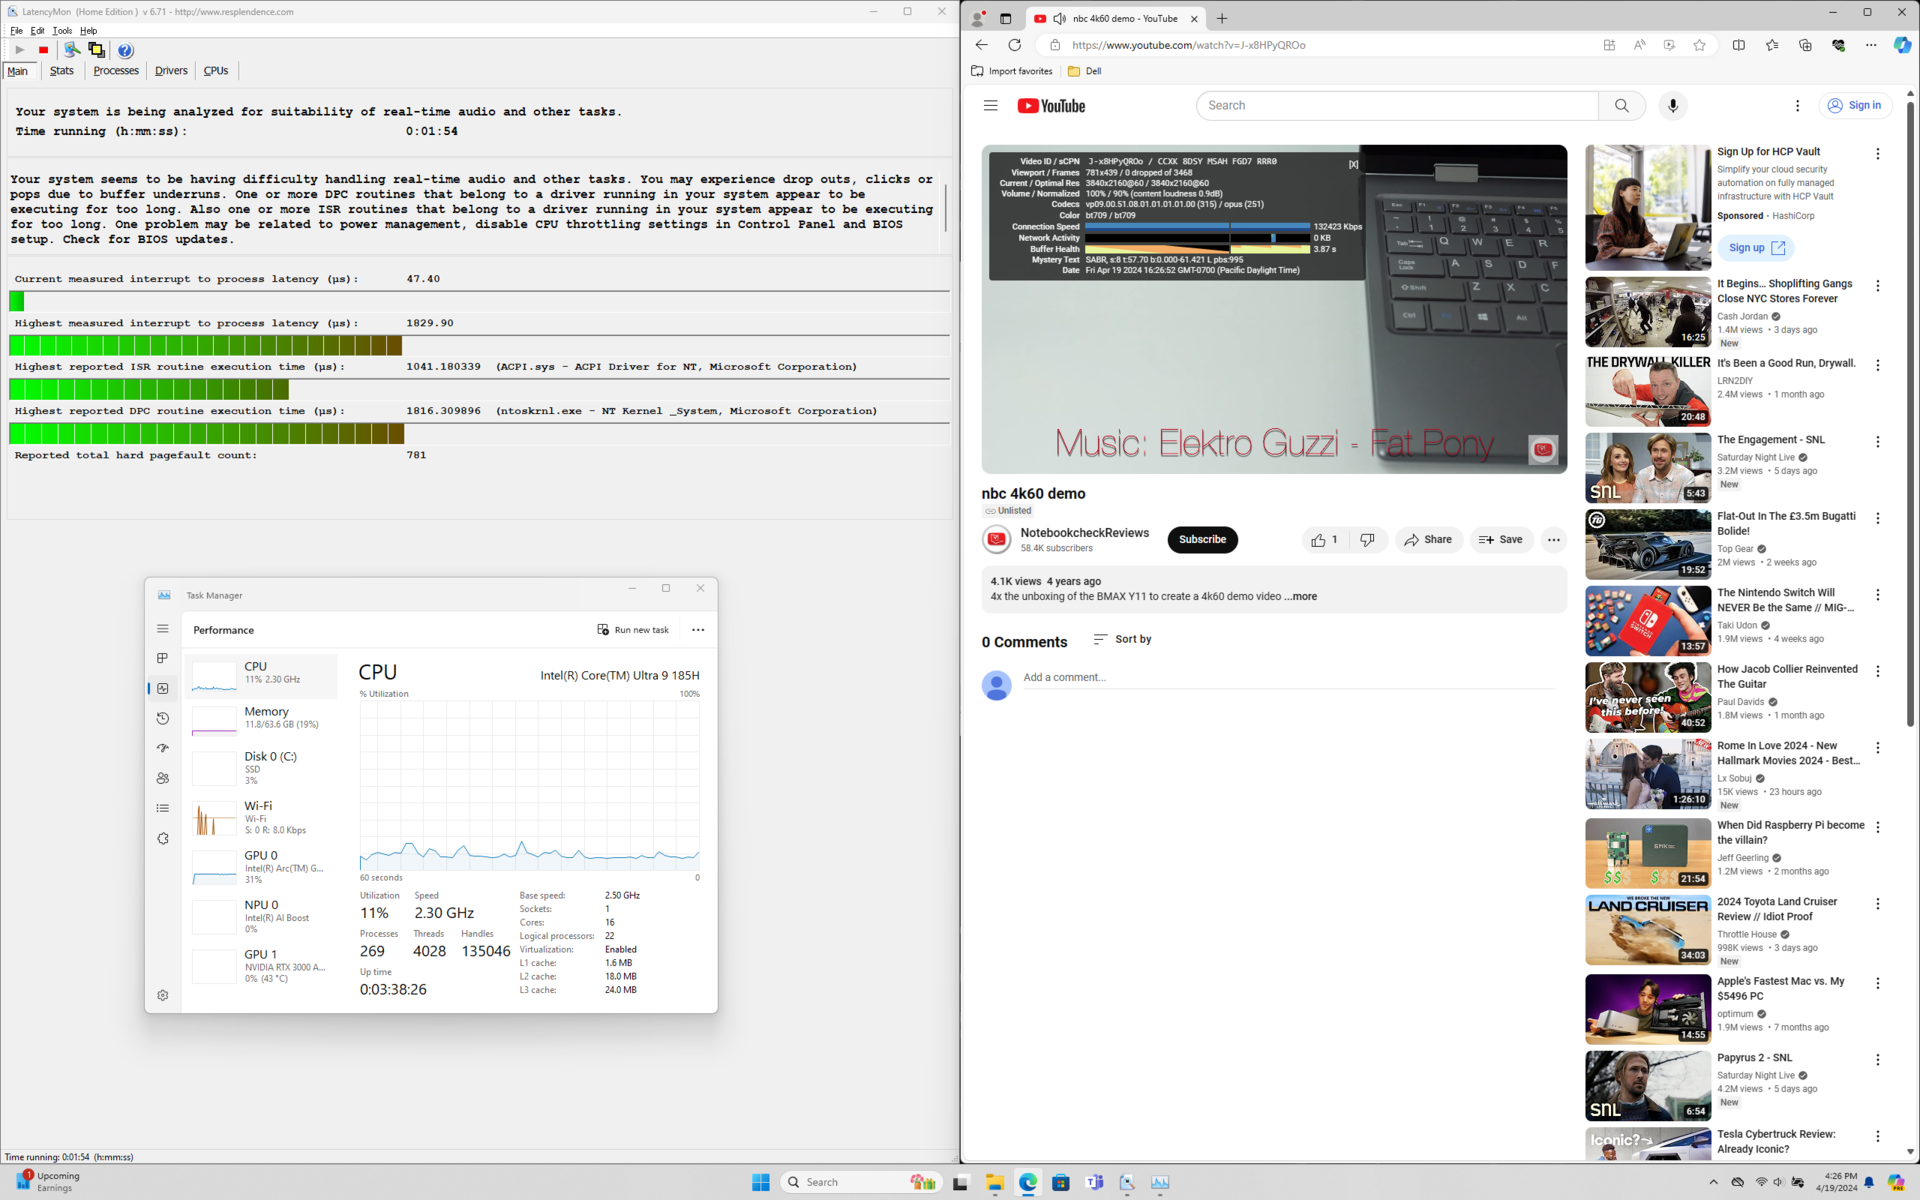
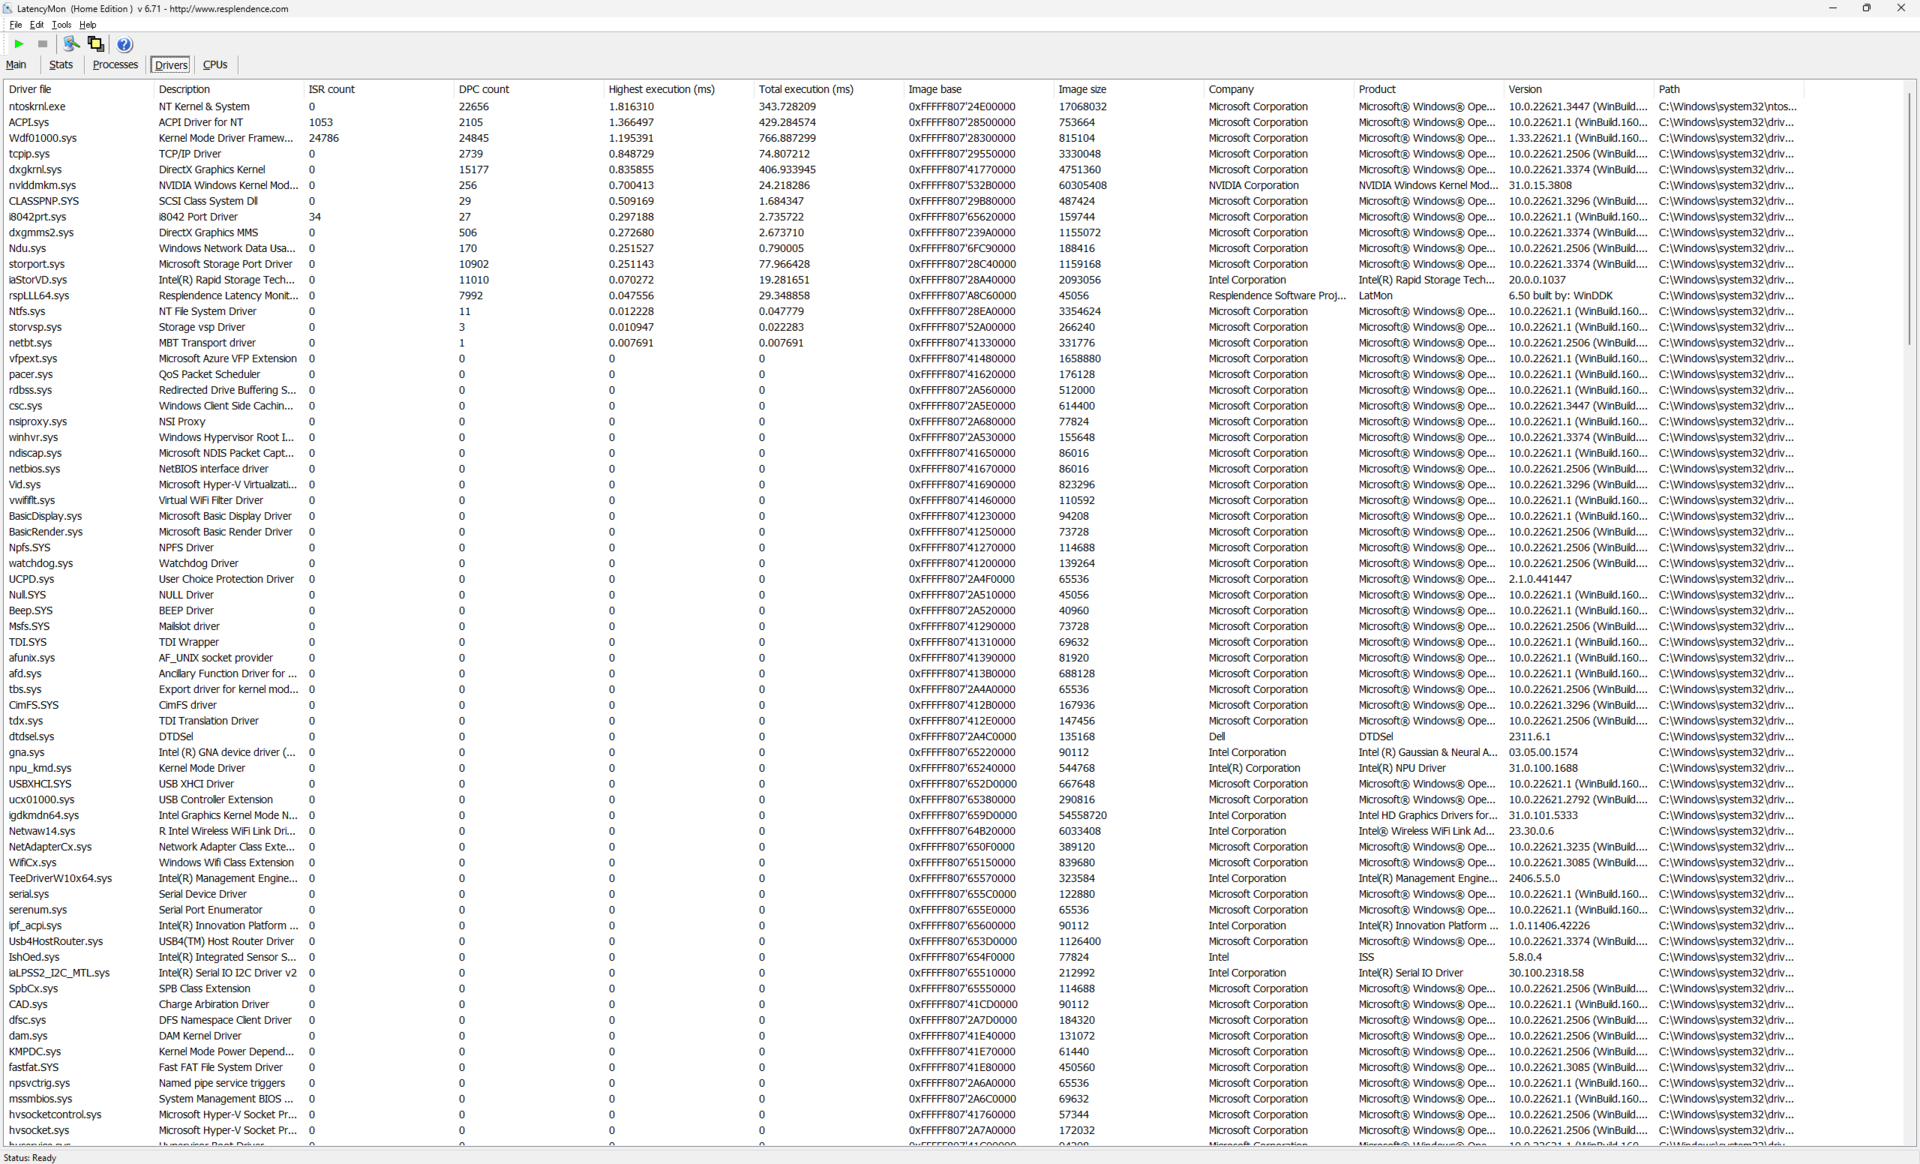
Latence DPC
LatencyMon montre à nouveau des problèmes mineurs de DPC lors de l'ouverture de plusieurs onglets de notre page d'accueil. la lecture de vidéos 4K à 60 FPS est par ailleurs parfaite, sans aucune perte d'images.
| DPC Latencies / LatencyMon - interrupt to process latency (max), Web, Youtube, Prime95 | |
| Dell Precision 5000 5490 | |
| Dell Precision 5480 | |
| HP ZBook Firefly 14 G10 A | |
| Dell Precision 5000 5470 | |
* ... Moindre est la valeur, meilleures sont les performances
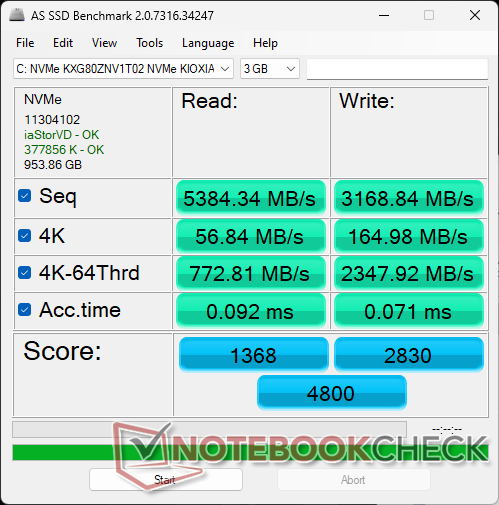
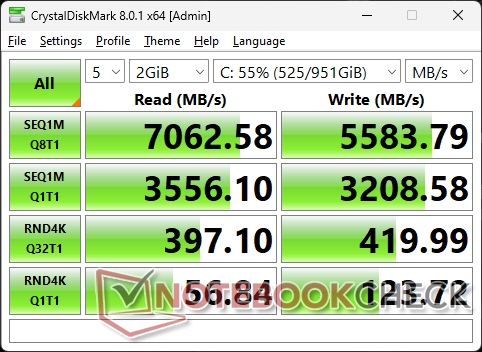
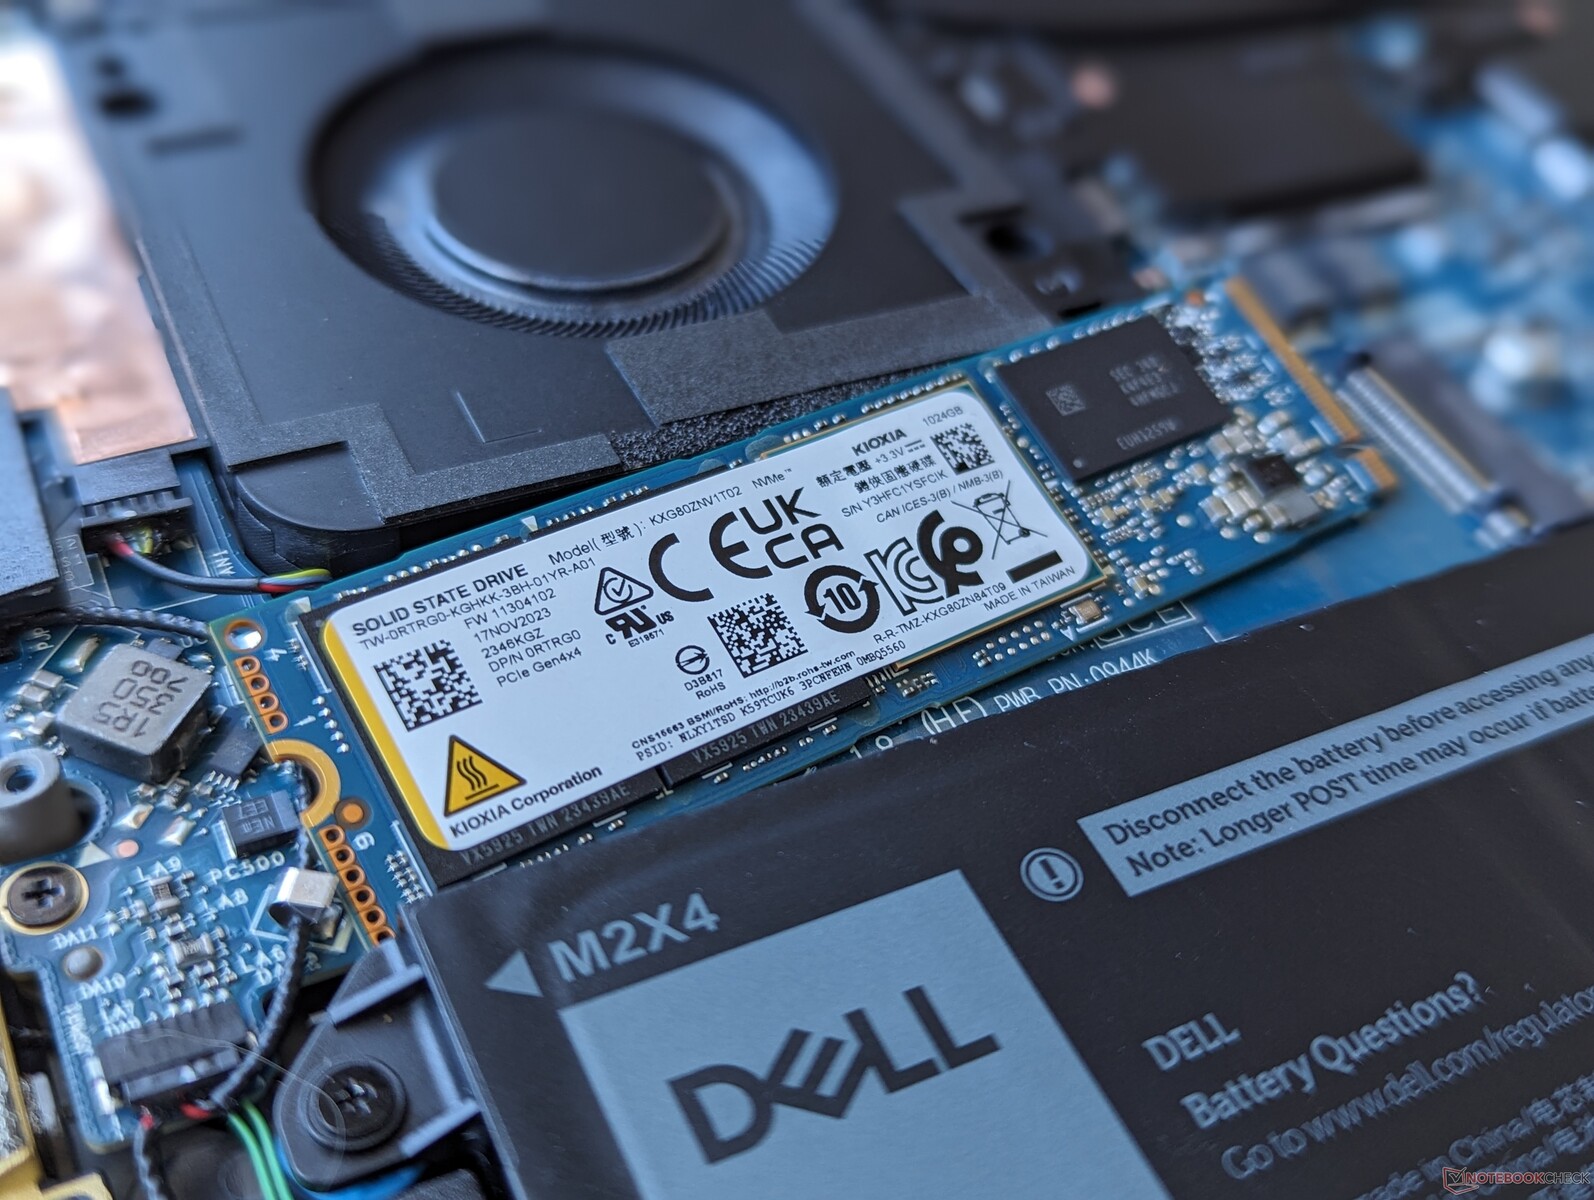
Dispositifs de stockage
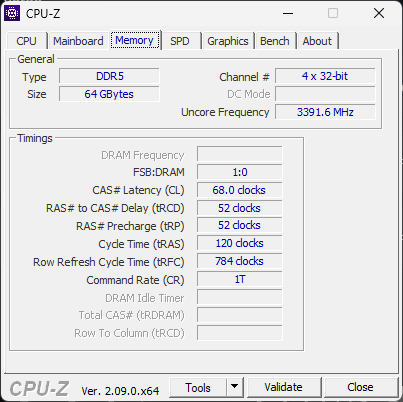
Notre unité est livrée avec le Kioxia KXG80ZNV1T02 au lieu du Samsung PM9A1 du modèle de l'année dernière. Les performances globales sont à peu près les mêmes, bien que les taux de lecture des petits blocs de 4K soient légèrement inférieurs.

| Drive Performance Rating - Percent | |
| Lenovo ThinkPad P14s G4 21HF0017GE | |
| Dell Precision 5480 | |
| Dell Precision 5000 5470 | |
| HP ZBook Firefly 14 G9-6B8A2EA | |
| Dell Precision 5000 5490 | |
| HP ZBook Firefly 14 G10 A | |
* ... Moindre est la valeur, meilleures sont les performances
Disk Throttling: DiskSpd Read Loop, Queue Depth 8
Performance du GPU - RTX 3000 Ada
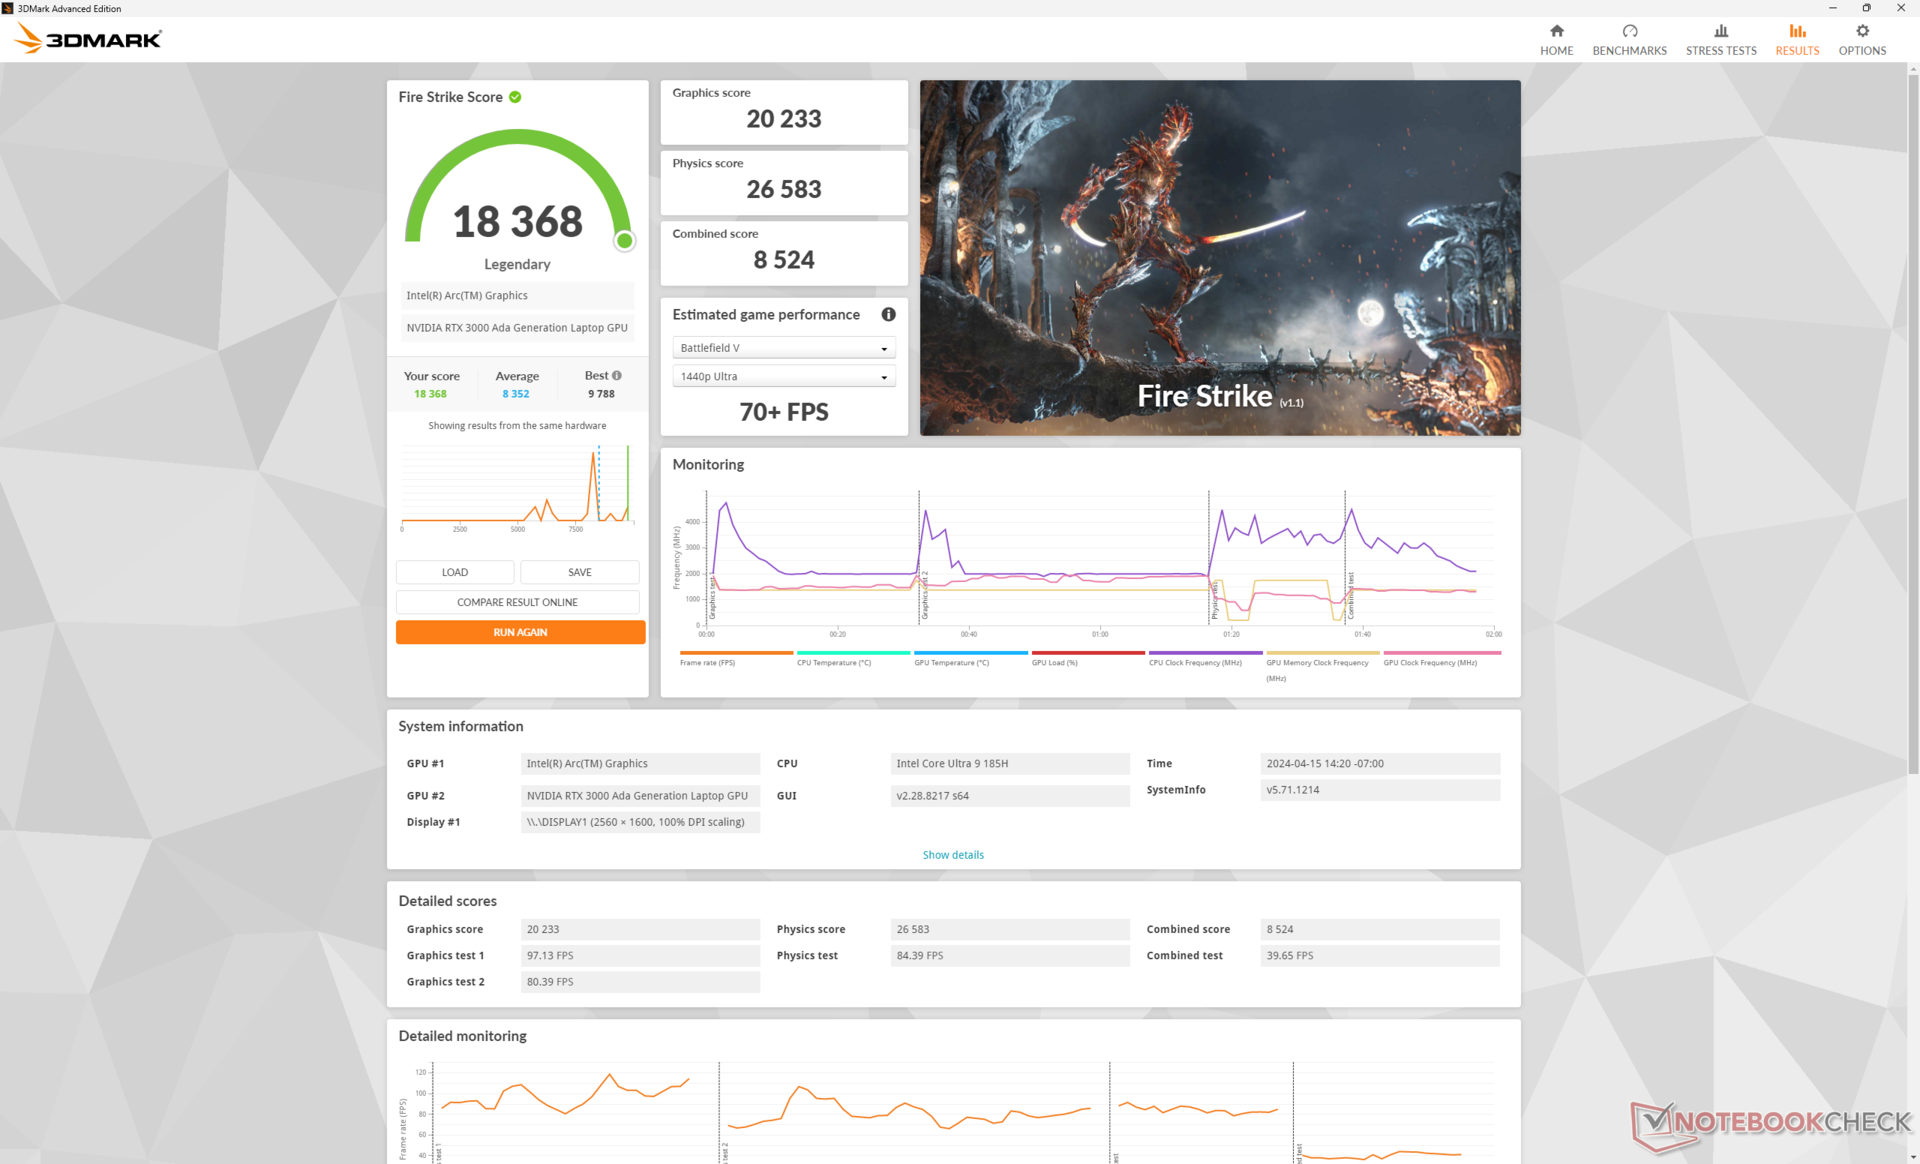
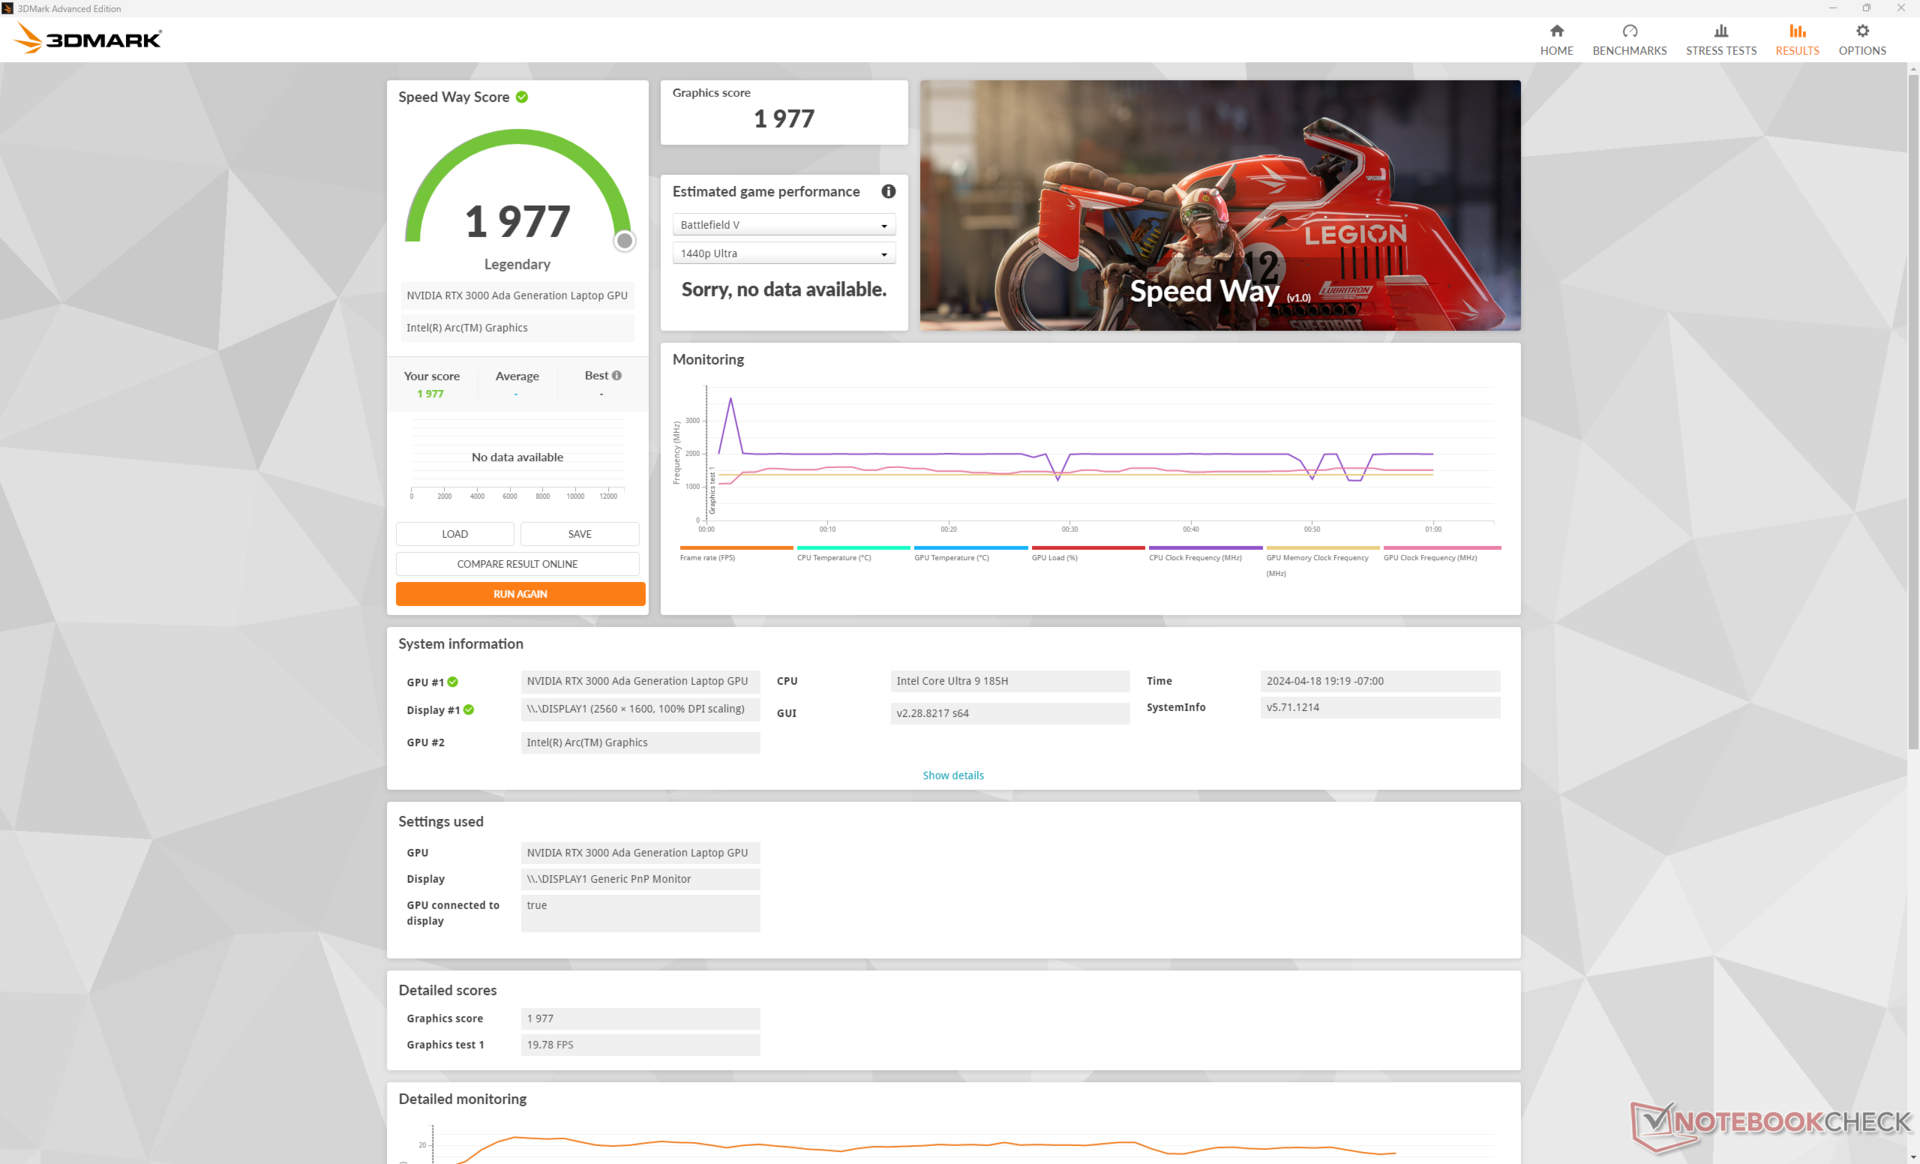
La RTX 3000 Ada est de retour sans aucun changement et sans aucun avantage en termes de performances par rapport à la Precision 5480. En fait, les performances moyennes peuvent être légèrement inférieures dans de nombreux cas, y compris dans certains jeux et dans les benchmarks 3DMark. Malgré cela, la Precision 5490 reste l'une des stations de travail de 14 pouces les plus rapides.
| Profil de puissance | Score graphique | Score physique | Score combiné |
| Mode Performance | 20233 | 26583 | 8524 |
| Mode équilibré | 19308 (-5%) | 25981 (-2%) | 7568 (-11%) |
| Alimentation par batterie | 19040 (-6%) | 20532 (-23%) | 7331 (-14%) |
L'exécution en mode équilibré au lieu du mode performance n'a qu'un impact marginal sur les performances, comme le montrent les résultats de notre site Fire Strike ci-dessus. La consommation de la batterie réduit les performances du processeur de manière plus significative que les performances graphiques.
| 3DMark Performance Rating - Percent | |
| Moyenne NVIDIA RTX 3000 Ada Generation Laptop GPU -3! | |
| Dell Precision 5000 5490 -3! | |
| Dell Precision 5480 -5! | |
| HP ZBook Power 15 G10 -11! | |
| HP ZBook Power 15 G9 6B8C4EA -18! | |
| Dell Precision 5000 5560 -4! | |
| Dell Precision 5000 5470 -11! | |
| Lenovo ThinkPad P15v G3 21EM001AGE -12! | |
| Lenovo ThinkPad P14s G4 21HF0017GE -22! | |
| Lenovo ThinkPad P14s G4 21K5000LGE -21! | |
| Lenovo ThinkPad P15v G2 21A9000XGE -19! | |
| Lenovo ThinkPad P14s G3 AMD 21J6S05000 -19! | |
| HP ZBook Firefly 14 G9-6B8A2EA -19! | |
| HP ZBook Firefly 14 G10 A -35! | |
| Lenovo ThinkPad P14s Gen1-20Y10002GE -19! | |
| 3DMark 11 - 1280x720 Performance GPU | |
| Dell Precision 5480 | |
| Moyenne NVIDIA RTX 3000 Ada Generation Laptop GPU (28283 - 29411, n=2) | |
| Dell Precision 5000 5490 | |
| HP ZBook Power 15 G10 | |
| HP ZBook Power 15 G9 6B8C4EA | |
| Dell Precision 5000 5560 | |
| Lenovo ThinkPad P15v G3 21EM001AGE | |
| Dell Precision 5000 5470 | |
| Lenovo ThinkPad P14s G4 21K5000LGE | |
| Lenovo ThinkPad P15v G2 21A9000XGE | |
| Lenovo ThinkPad P14s G3 AMD 21J6S05000 | |
| Lenovo ThinkPad P14s G4 21HF0017GE | |
| HP ZBook Firefly 14 G10 A | |
| HP ZBook Firefly 14 G9-6B8A2EA | |
| Lenovo ThinkPad P14s Gen1-20Y10002GE | |
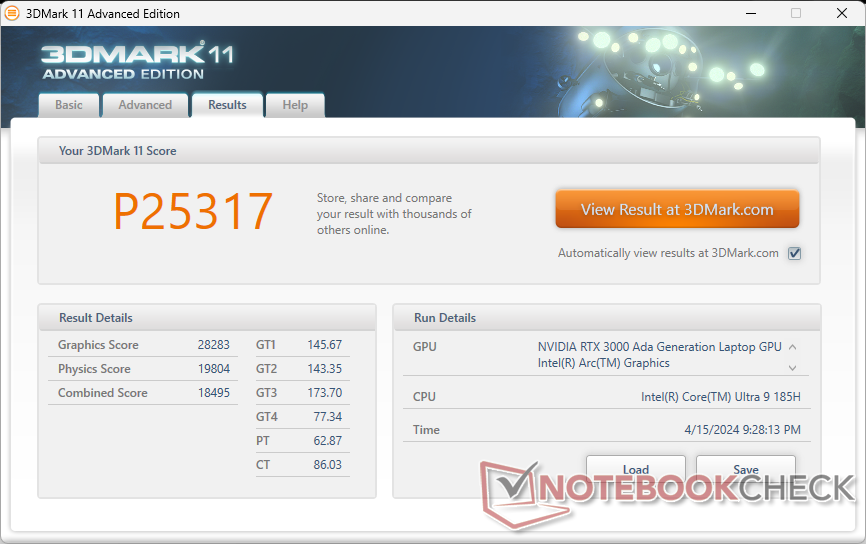
| 3DMark 11 Performance | 25317 points | |
| 3DMark Cloud Gate Standard Score | 45774 points | |
| 3DMark Fire Strike Score | 18368 points | |
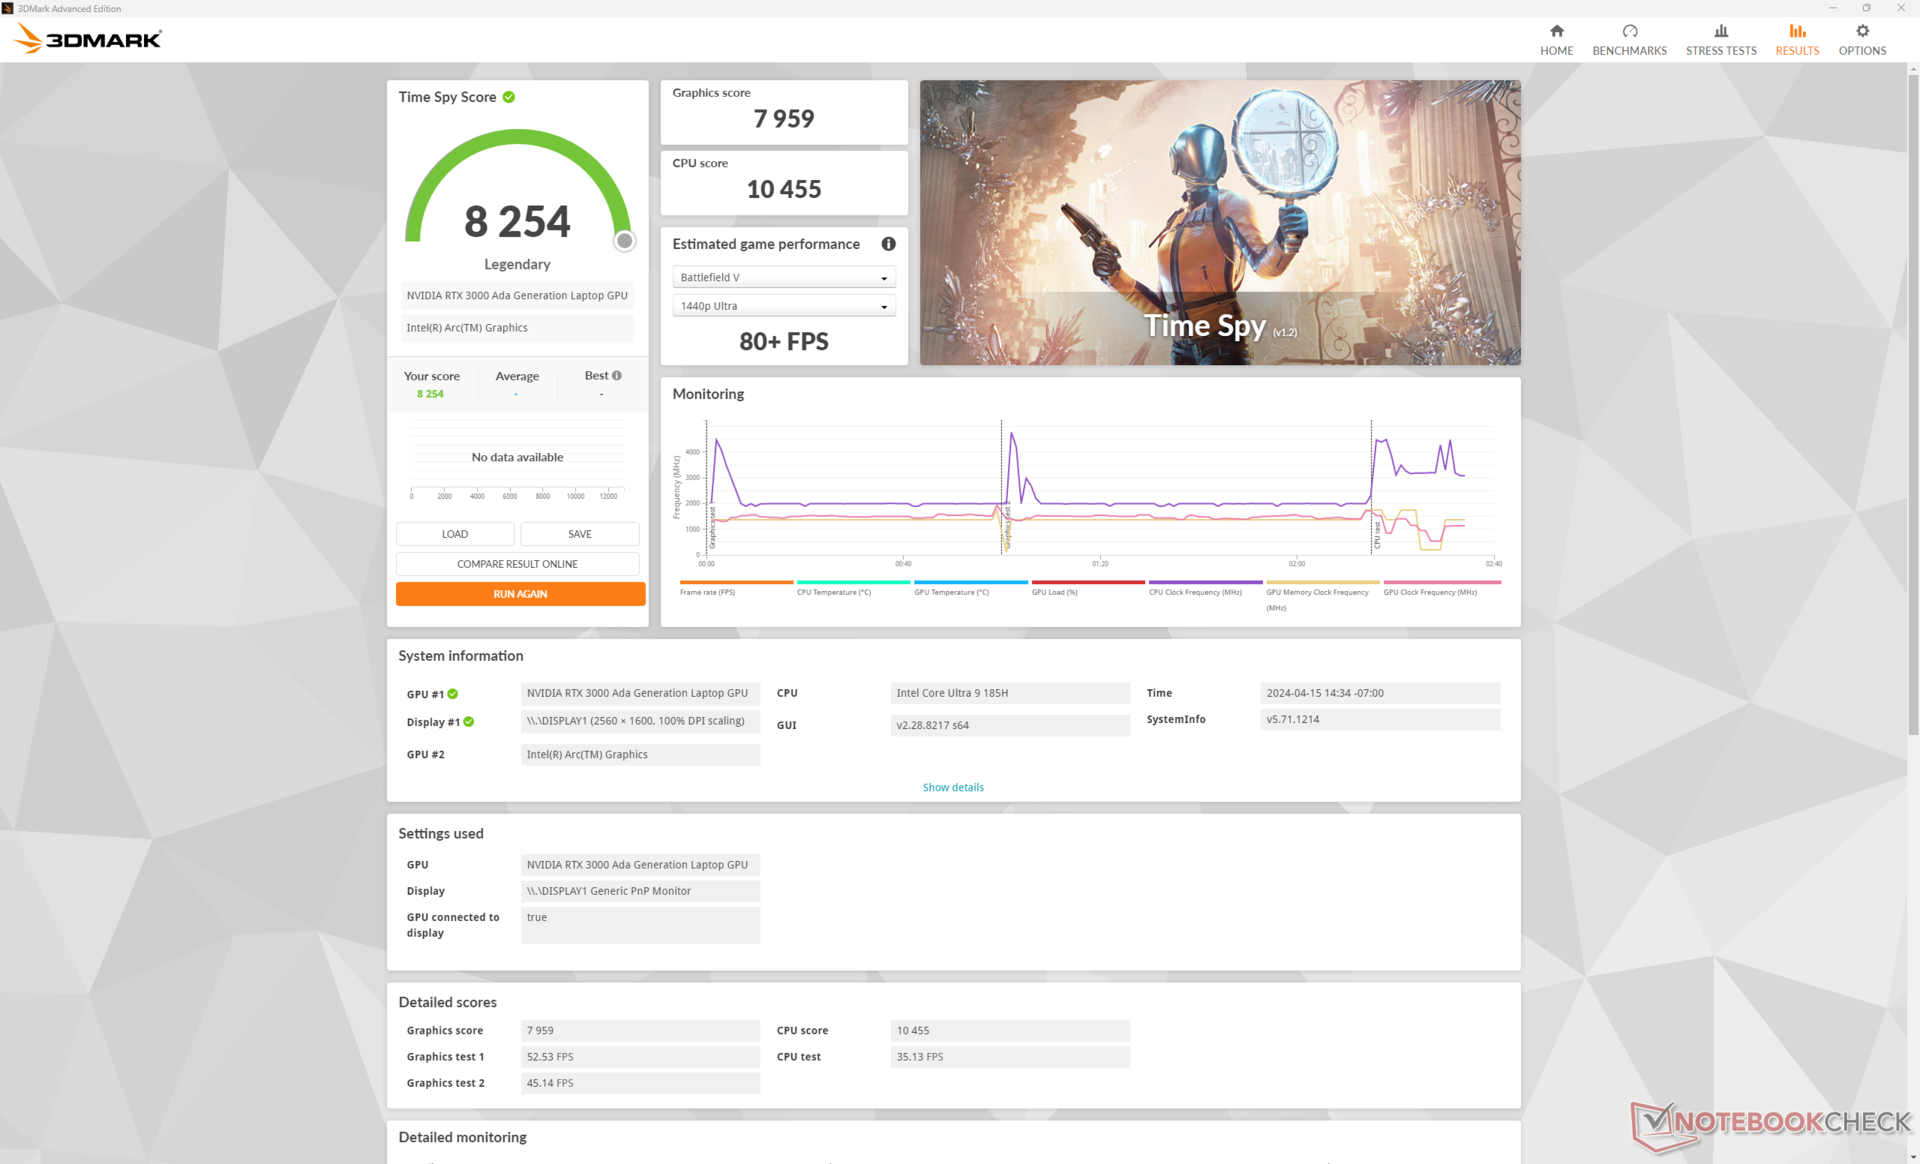
| 3DMark Time Spy Score | 8254 points | |
Aide | ||
* ... Moindre est la valeur, meilleures sont les performances
| Performance Rating - Percent | |
| Dell Precision 5480 | |
| Dell Precision 5000 5490 | |
| HP ZBook Power 15 G10 | |
| Dell Precision 5000 5560 -1! | |
| HP ZBook Power 15 G9 6B8C4EA | |
| Dell Precision 5000 5470 | |
| Lenovo ThinkPad P15v G3 21EM001AGE | |
| Lenovo ThinkPad P14s G4 21HF0017GE | |
| Lenovo ThinkPad P15v G2 21A9000XGE | |
| HP ZBook Firefly 14 G9-6B8A2EA | |
| Lenovo ThinkPad P14s G4 21K5000LGE | |
| Lenovo ThinkPad P14s G3 AMD 21J6S05000 | |
| Lenovo ThinkPad P14s Gen1-20Y10002GE -3! | |
| HP ZBook Firefly 14 G10 A | |
| The Witcher 3 - 1920x1080 Ultra Graphics & Postprocessing (HBAO+) | |
| Dell Precision 5000 5490 | |
| Dell Precision 5480 | |
| HP ZBook Power 15 G10 | |
| Dell Precision 5000 5560 | |
| HP ZBook Power 15 G9 6B8C4EA | |
| Lenovo ThinkPad P15v G3 21EM001AGE | |
| Dell Precision 5000 5470 | |
| Lenovo ThinkPad P15v G2 21A9000XGE | |
| Lenovo ThinkPad P14s G4 21HF0017GE | |
| Lenovo ThinkPad P14s G4 21K5000LGE | |
| Lenovo ThinkPad P14s G3 AMD 21J6S05000 | |
| HP ZBook Firefly 14 G10 A | |
| HP ZBook Firefly 14 G9-6B8A2EA | |
| Final Fantasy XV Benchmark - 1920x1080 High Quality | |
| Dell Precision 5480 | |
| Dell Precision 5000 5490 | |
| HP ZBook Power 15 G10 | |
| HP ZBook Power 15 G9 6B8C4EA | |
| Dell Precision 5000 5560 | |
| Lenovo ThinkPad P15v G3 21EM001AGE | |
| Dell Precision 5000 5470 | |
| Lenovo ThinkPad P15v G2 21A9000XGE | |
| Lenovo ThinkPad P14s G4 21HF0017GE | |
| Lenovo ThinkPad P14s G4 21K5000LGE | |
| Lenovo ThinkPad P14s G3 AMD 21J6S05000 | |
| HP ZBook Firefly 14 G9-6B8A2EA | |
| HP ZBook Firefly 14 G10 A | |
| Strange Brigade - 1920x1080 ultra AA:ultra AF:16 | |
| Dell Precision 5480 | |
| HP ZBook Power 15 G10 | |
| Dell Precision 5000 5490 | |
| HP ZBook Power 15 G9 6B8C4EA | |
| Lenovo ThinkPad P15v G3 21EM001AGE | |
| Dell Precision 5000 5470 | |
| Lenovo ThinkPad P15v G2 21A9000XGE | |
| Lenovo ThinkPad P14s G4 21HF0017GE | |
| Lenovo ThinkPad P14s G4 21K5000LGE | |
| HP ZBook Firefly 14 G9-6B8A2EA | |
| HP ZBook Firefly 14 G10 A | |
| Lenovo ThinkPad P14s G3 AMD 21J6S05000 | |
| Dota 2 Reborn - 1920x1080 ultra (3/3) best looking | |
| Dell Precision 5480 | |
| Dell Precision 5000 5470 | |
| HP ZBook Power 15 G10 | |
| Dell Precision 5000 5490 | |
| Dell Precision 5000 5560 | |
| HP ZBook Power 15 G9 6B8C4EA | |
| Lenovo ThinkPad P14s G4 21HF0017GE | |
| Lenovo ThinkPad P15v G2 21A9000XGE | |
| Lenovo ThinkPad P15v G3 21EM001AGE | |
| HP ZBook Firefly 14 G9-6B8A2EA | |
| Lenovo ThinkPad P14s G4 21K5000LGE | |
| HP ZBook Firefly 14 G10 A | |
| Lenovo ThinkPad P14s G3 AMD 21J6S05000 | |
| Lenovo ThinkPad P14s Gen1-20Y10002GE | |
| X-Plane 11.11 - 1920x1080 high (fps_test=3) | |
| Dell Precision 5480 | |
| HP ZBook Power 15 G9 6B8C4EA | |
| Dell Precision 5000 5490 | |
| Dell Precision 5000 5470 | |
| Dell Precision 5000 5560 | |
| Lenovo ThinkPad P14s G4 21HF0017GE | |
| Lenovo ThinkPad P15v G2 21A9000XGE | |
| Lenovo ThinkPad P15v G3 21EM001AGE | |
| HP ZBook Firefly 14 G9-6B8A2EA | |
| HP ZBook Power 15 G10 | |
| Lenovo ThinkPad P14s G3 AMD 21J6S05000 | |
| Lenovo ThinkPad P14s Gen1-20Y10002GE | |
| Lenovo ThinkPad P14s G4 21K5000LGE | |
| HP ZBook Firefly 14 G10 A | |
| Cyberpunk 2077 2.0 Phantom Liberty | |
| 1920x1080 Low Preset (FSR off) | |
| Dell Precision 5000 5490 | |
| Moyenne NVIDIA RTX 3000 Ada Generation Laptop GPU () | |
| HP ZBook Power 15 G10 | |
| 1920x1080 Medium Preset (FSR off) | |
| Dell Precision 5000 5490 | |
| Moyenne NVIDIA RTX 3000 Ada Generation Laptop GPU () | |
| HP ZBook Power 15 G10 | |
| 1920x1080 High Preset (FSR off) | |
| Dell Precision 5000 5490 | |
| Moyenne NVIDIA RTX 3000 Ada Generation Laptop GPU () | |
| HP ZBook Power 15 G10 | |
| 1920x1080 Ultra Preset (FSR off) | |
| Dell Precision 5000 5490 | |
| Moyenne NVIDIA RTX 3000 Ada Generation Laptop GPU () | |
| HP ZBook Power 15 G10 | |
| 1920x1080 Ray Tracing Ultra Preset (DLSS off) | |
| Dell Precision 5000 5490 | |
| Moyenne NVIDIA RTX 3000 Ada Generation Laptop GPU () | |
| HP ZBook Power 15 G10 | |
| Baldur's Gate 3 | |
| 1920x1080 Low Preset | |
| Dell Precision 5000 5490 | |
| Moyenne NVIDIA RTX 3000 Ada Generation Laptop GPU () | |
| HP ZBook Firefly 14 G10 A | |
| 1920x1080 Medium Preset | |
| Dell Precision 5000 5490 | |
| Moyenne NVIDIA RTX 3000 Ada Generation Laptop GPU () | |
| HP ZBook Firefly 14 G10 A | |
| 1920x1080 High Preset | |
| Dell Precision 5000 5490 | |
| Moyenne NVIDIA RTX 3000 Ada Generation Laptop GPU () | |
| HP ZBook Firefly 14 G10 A | |
| 1920x1080 Ultra Preset | |
| Dell Precision 5000 5490 | |
| Moyenne NVIDIA RTX 3000 Ada Generation Laptop GPU () | |
| Tiny Tina's Wonderlands | |
| 1920x1080 Low Preset (DX12) | |
| Dell Precision 5480 | |
| Moyenne NVIDIA RTX 3000 Ada Generation Laptop GPU (153.9 - 156, n=2) | |
| Dell Precision 5000 5490 | |
| HP ZBook Power 15 G10 | |
| 1920x1080 Medium Preset (DX12) | |
| Dell Precision 5480 | |
| Moyenne NVIDIA RTX 3000 Ada Generation Laptop GPU (125.4 - 131.4, n=2) | |
| Dell Precision 5000 5490 | |
| HP ZBook Power 15 G10 | |
| 1920x1080 High Preset (DX12) | |
| Dell Precision 5000 5490 | |
| Moyenne NVIDIA RTX 3000 Ada Generation Laptop GPU (88 - 88.5, n=2) | |
| Dell Precision 5480 | |
| HP ZBook Power 15 G10 | |
| 1920x1080 Badass Preset (DX12) | |
| Dell Precision 5000 5490 | |
| Moyenne NVIDIA RTX 3000 Ada Generation Laptop GPU (69 - 70.2, n=2) | |
| Dell Precision 5480 | |
| HP ZBook Power 15 G10 | |
Witcher 3 FPS Chart
| Bas | Moyen | Élevé | Ultra | |
| The Witcher 3 (2015) | 344 | 249.5 | 145.8 | 79.5 |
| Dota 2 Reborn (2015) | 168 | 151.3 | 136 | 123.3 |
| Final Fantasy XV Benchmark (2018) | 128.8 | 91.9 | 72.9 | |
| X-Plane 11.11 (2018) | 109.9 | 102.1 | 76.7 | |
| Far Cry 5 (2018) | 115 | 105 | 104 | 96 |
| Strange Brigade (2018) | 282 | 182.4 | 151.4 | 132.5 |
| Tiny Tina's Wonderlands (2022) | 153.9 | 125.4 | 88.5 | 70.2 |
| F1 22 (2022) | 183.6 | 168 | 127.5 | 50.4 |
| Baldur's Gate 3 (2023) | 92 | 78.8 | 70.1 | 68.8 |
| Cyberpunk 2077 2.0 Phantom Liberty (2023) | 87.2 | 72.7 | 60.7 | 52.1 |
Émissions
Bruit du système
Le bruit du ventilateur et le plafond sont essentiellement identiques à ce que nous avons enregistré sur le Precision 5480. Le plafond en particulier continue d'être plus élevé ou plus bruyant que les autres stations de travail de 14 pouces, principalement en raison du GPU plus rapide du système Dell. Cette année, le Precision 5490 peut au moins fonctionner plus silencieusement pendant de longues périodes avant que les ventilateurs ne commencent à monter en puissance.
Degré de la nuisance sonore
| Au repos |
| 23.8 / 23.8 / 24.7 dB(A) |
| Fortement sollicité |
| 38.9 / 51.4 dB(A) |
 | ||
30 dB silencieux 40 dB(A) audible 50 dB(A) bruyant |
||
min: | ||
| Dell Precision 5000 5490 NVIDIA RTX 3000 Ada Generation Laptop GPU, Ultra 9 185H, Kioxia XG8 KXG80ZNV1T02 | Lenovo ThinkPad P14s G4 21HF0017GE RTX A500 Laptop GPU, i7-1370P, SK Hynix HFS002TEJ9X162N | HP ZBook Firefly 14 G10 A Radeon 760M, R5 PRO 7640HS, Samsung PM9B1 512GB MZVL4512HBLU | HP ZBook Firefly 14 G9-6B8A2EA T550 Laptop GPU, i7-1265U, Micron 3400 1TB MTFDKBA1T0TFH | Dell Precision 5480 NVIDIA RTX 3000 Ada Generation Laptop GPU, i9-13900H, Samsung PM9A1 MZVL21T0HCLR | Dell Precision 5000 5470 RTX A1000 Laptop GPU, i9-12900H, Samsung PM9A1 MZVL21T0HCLR | |
|---|---|---|---|---|---|---|
| Noise | -4% | 4% | 0% | -2% | ||
| off / environment * | 22.8 | 25 -10% | 23.6 -4% | 23.5 -3% | 23 -1% | |
| Idle Minimum * | 23.8 | 25 -5% | 23.6 1% | 23.5 1% | 23.3 2% | |
| Idle Average * | 23.8 | 26 -9% | 23.6 1% | 23.5 1% | 23.3 2% | |
| Idle Maximum * | 24.7 | 27 -9% | 23.6 4% | 23.5 5% | 23.3 6% | |
| Load Average * | 38.9 | 45 -16% | 42.5 -9% | 39.9 -3% | 48.5 -25% | |
| Witcher 3 ultra * | 49.9 | 45 10% | 42.5 15% | 50.1 -0% | 48.6 3% | |
| Load Maximum * | 51.4 | 46 11% | 42.5 17% | 51 1% | 50.4 2% |
* ... Moindre est la valeur, meilleures sont les performances
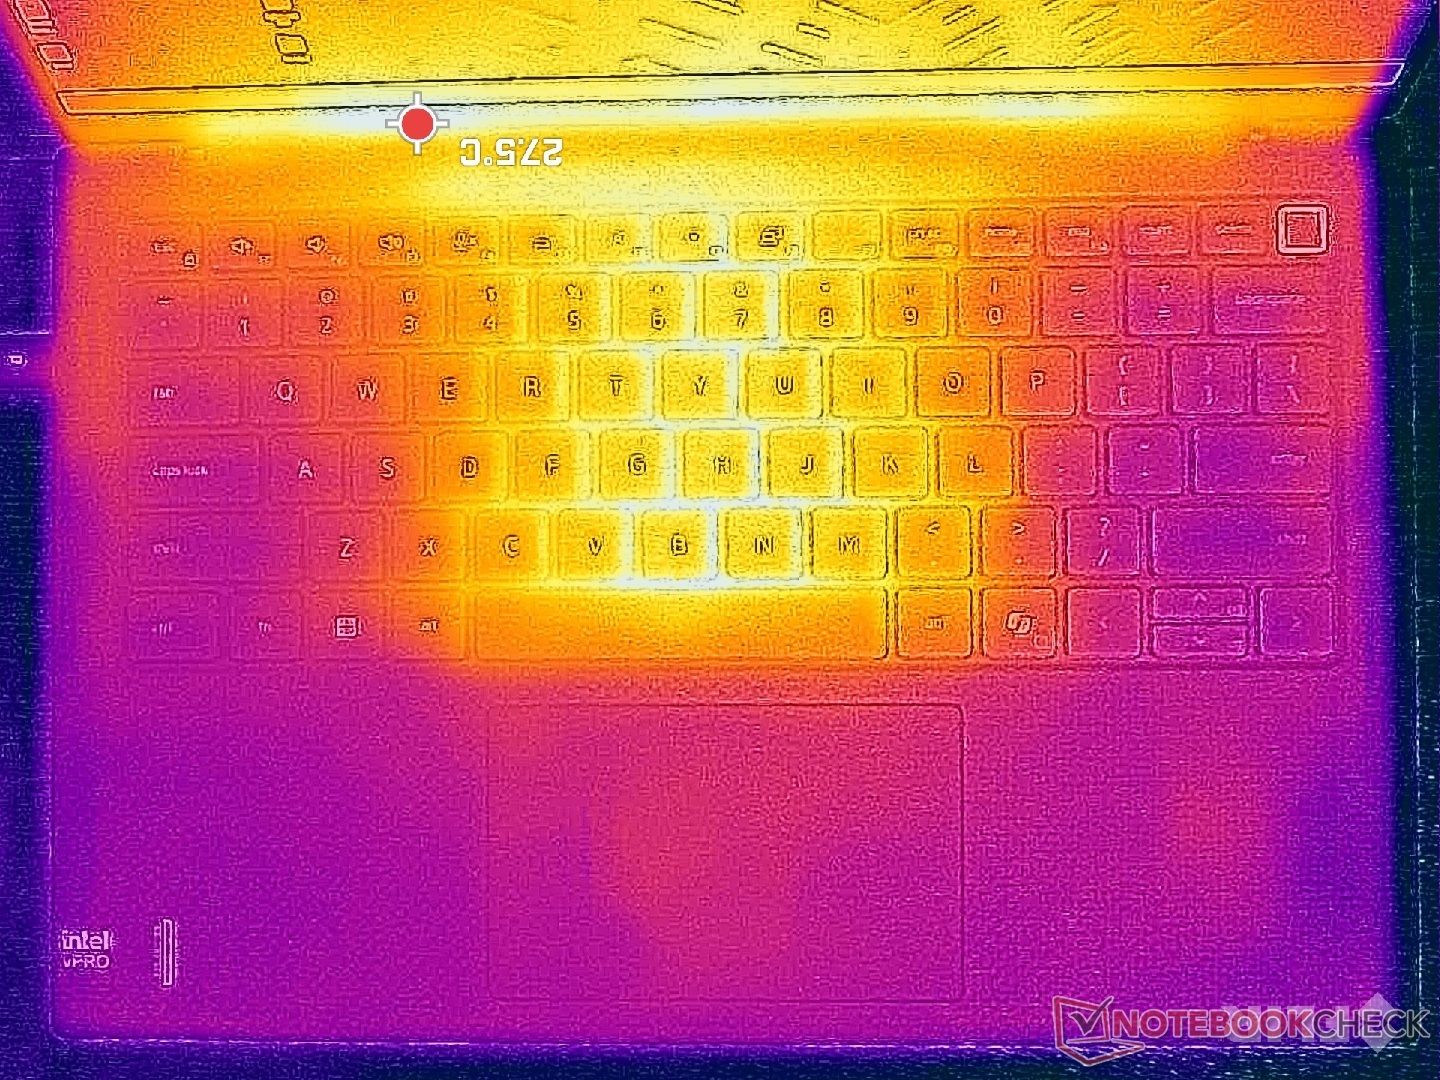
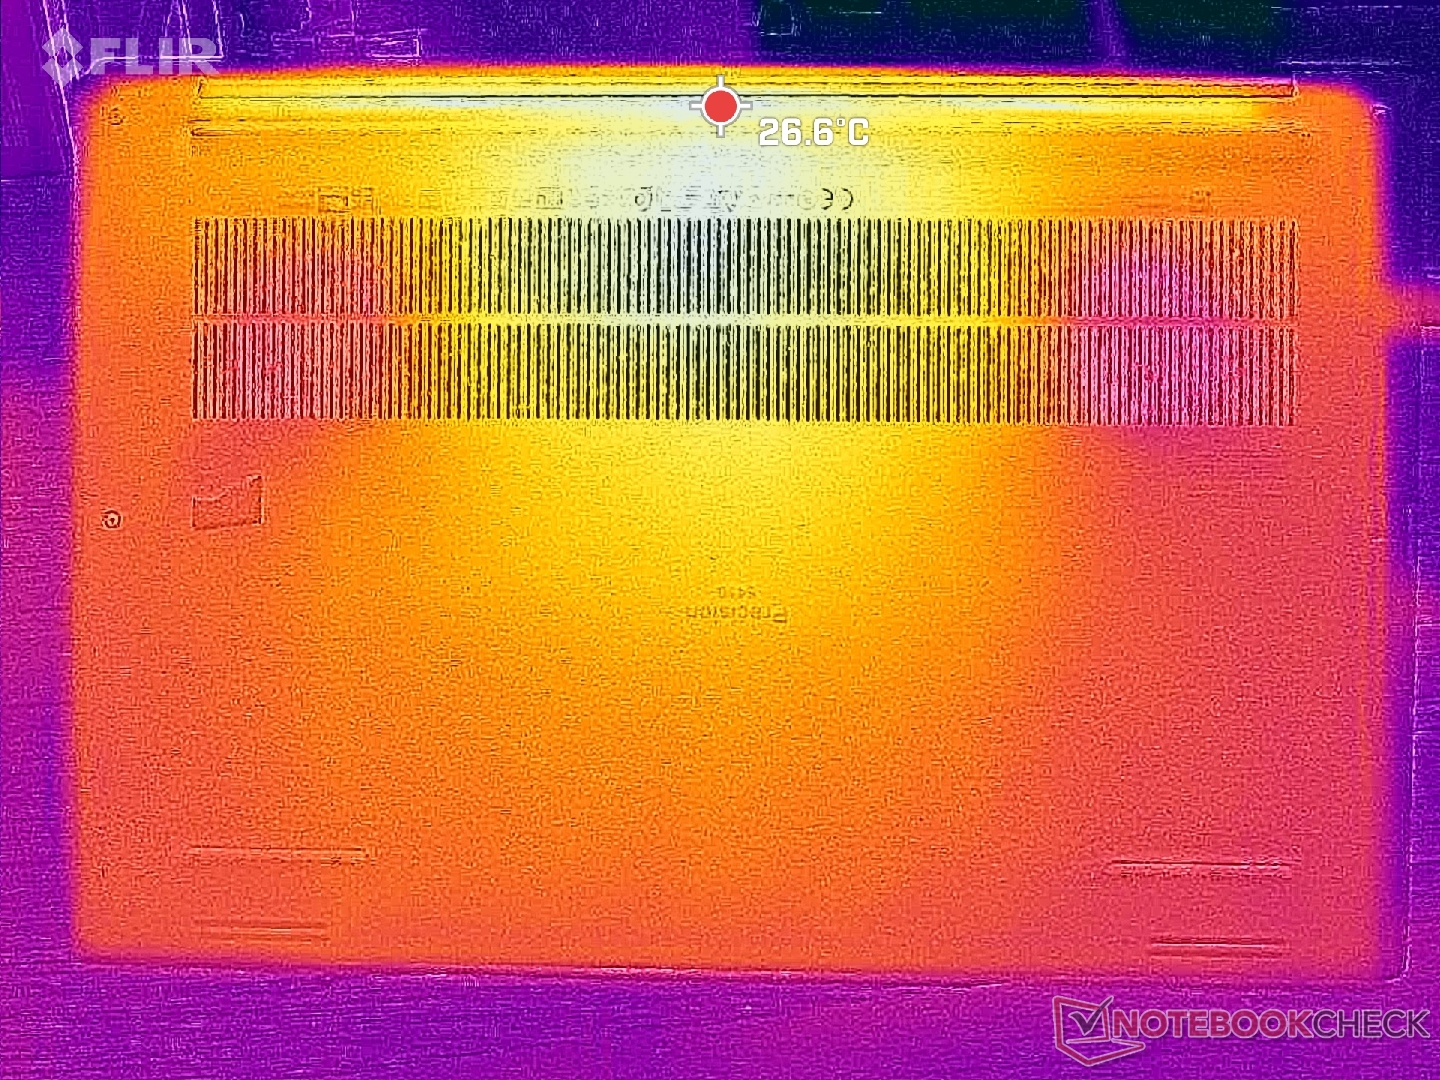
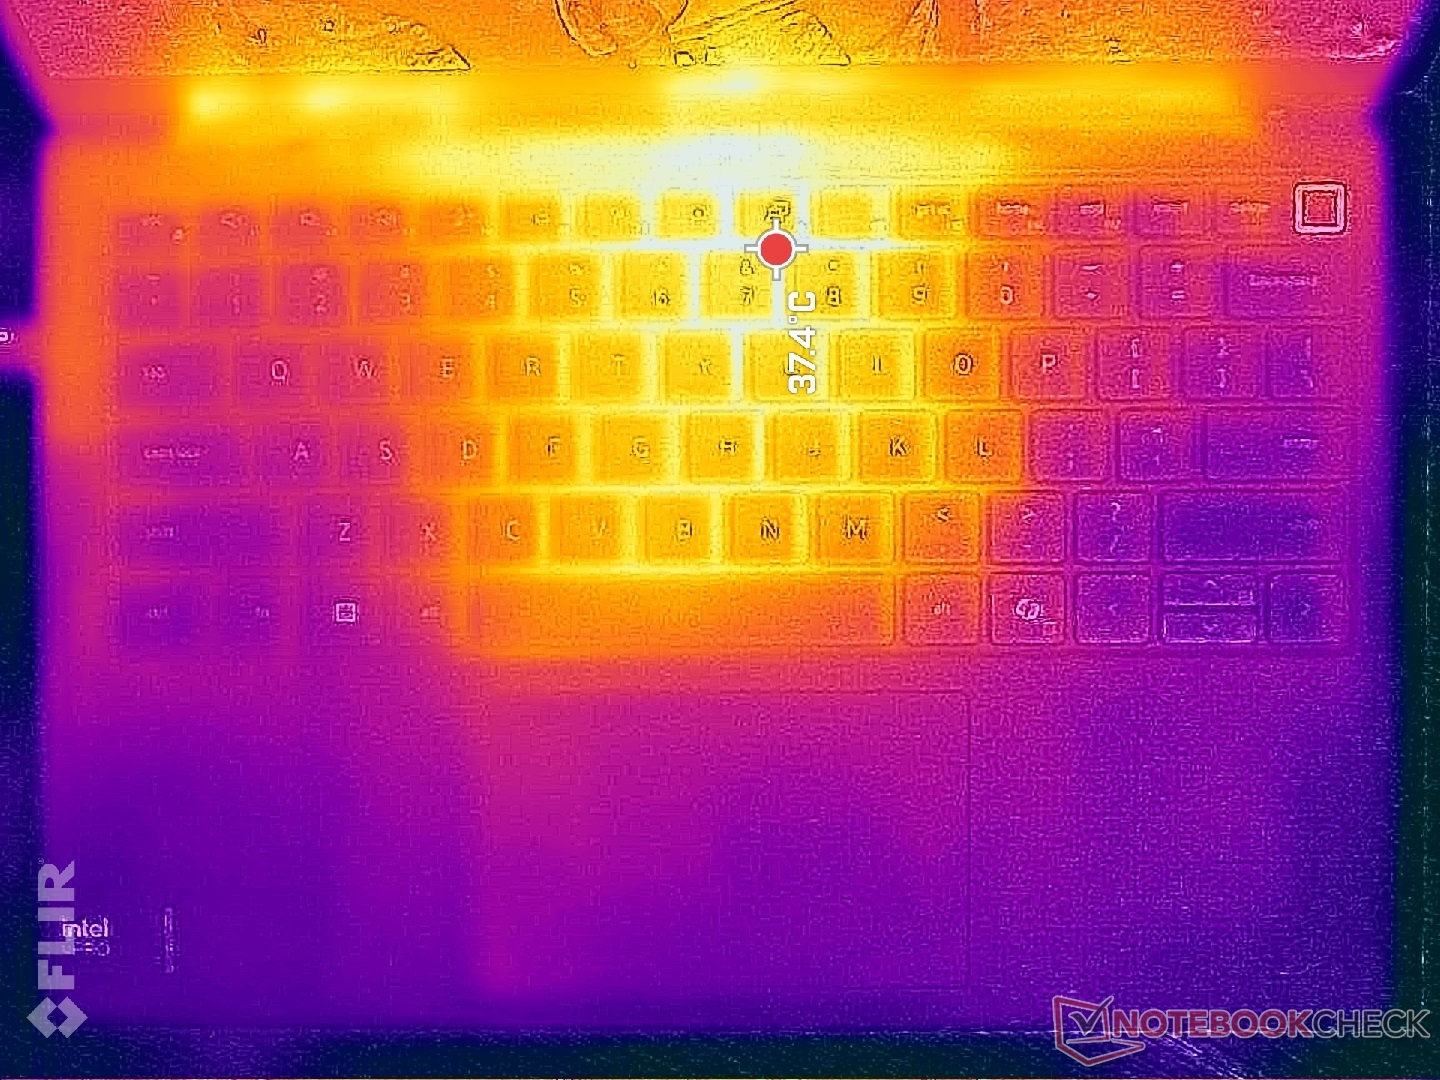
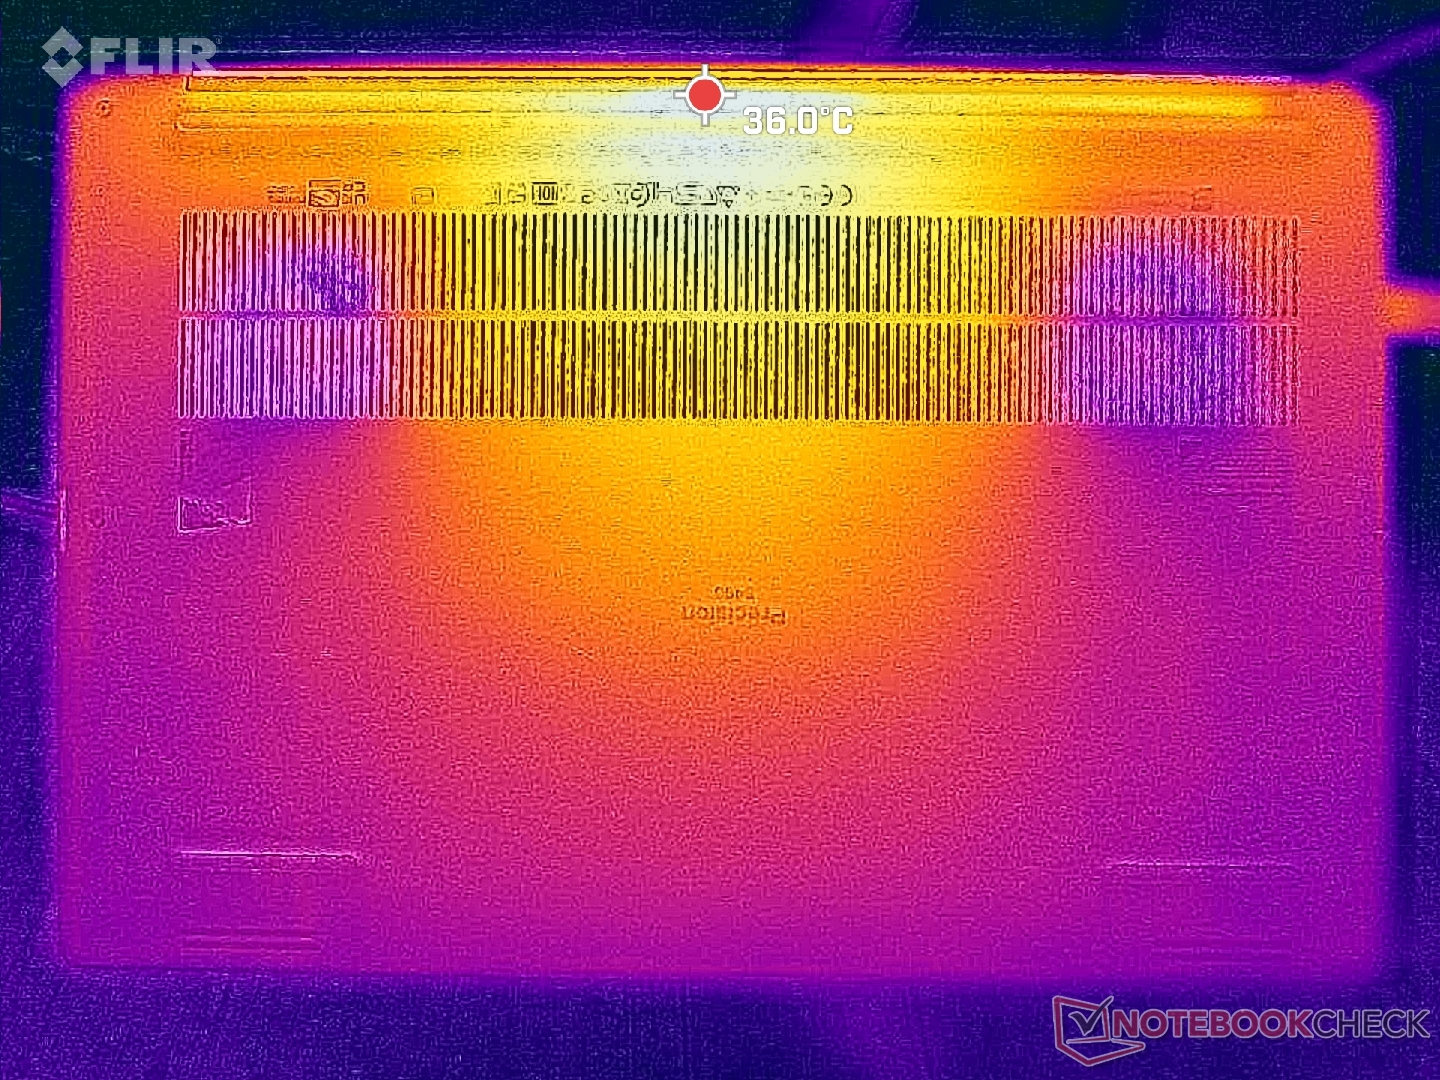
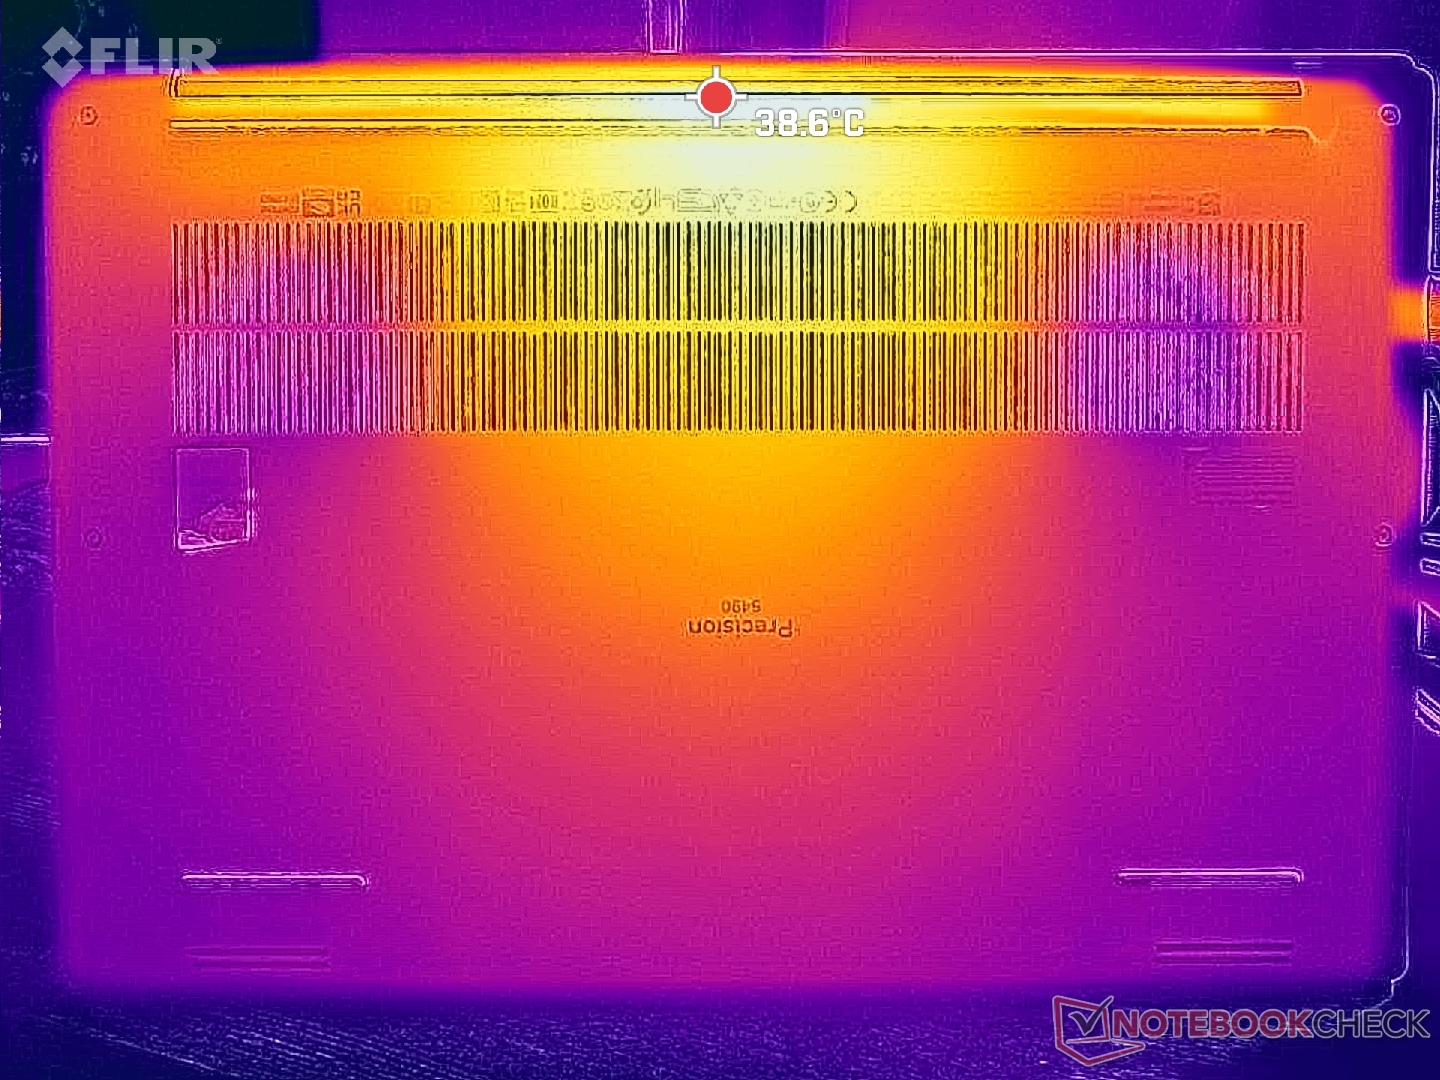
Température
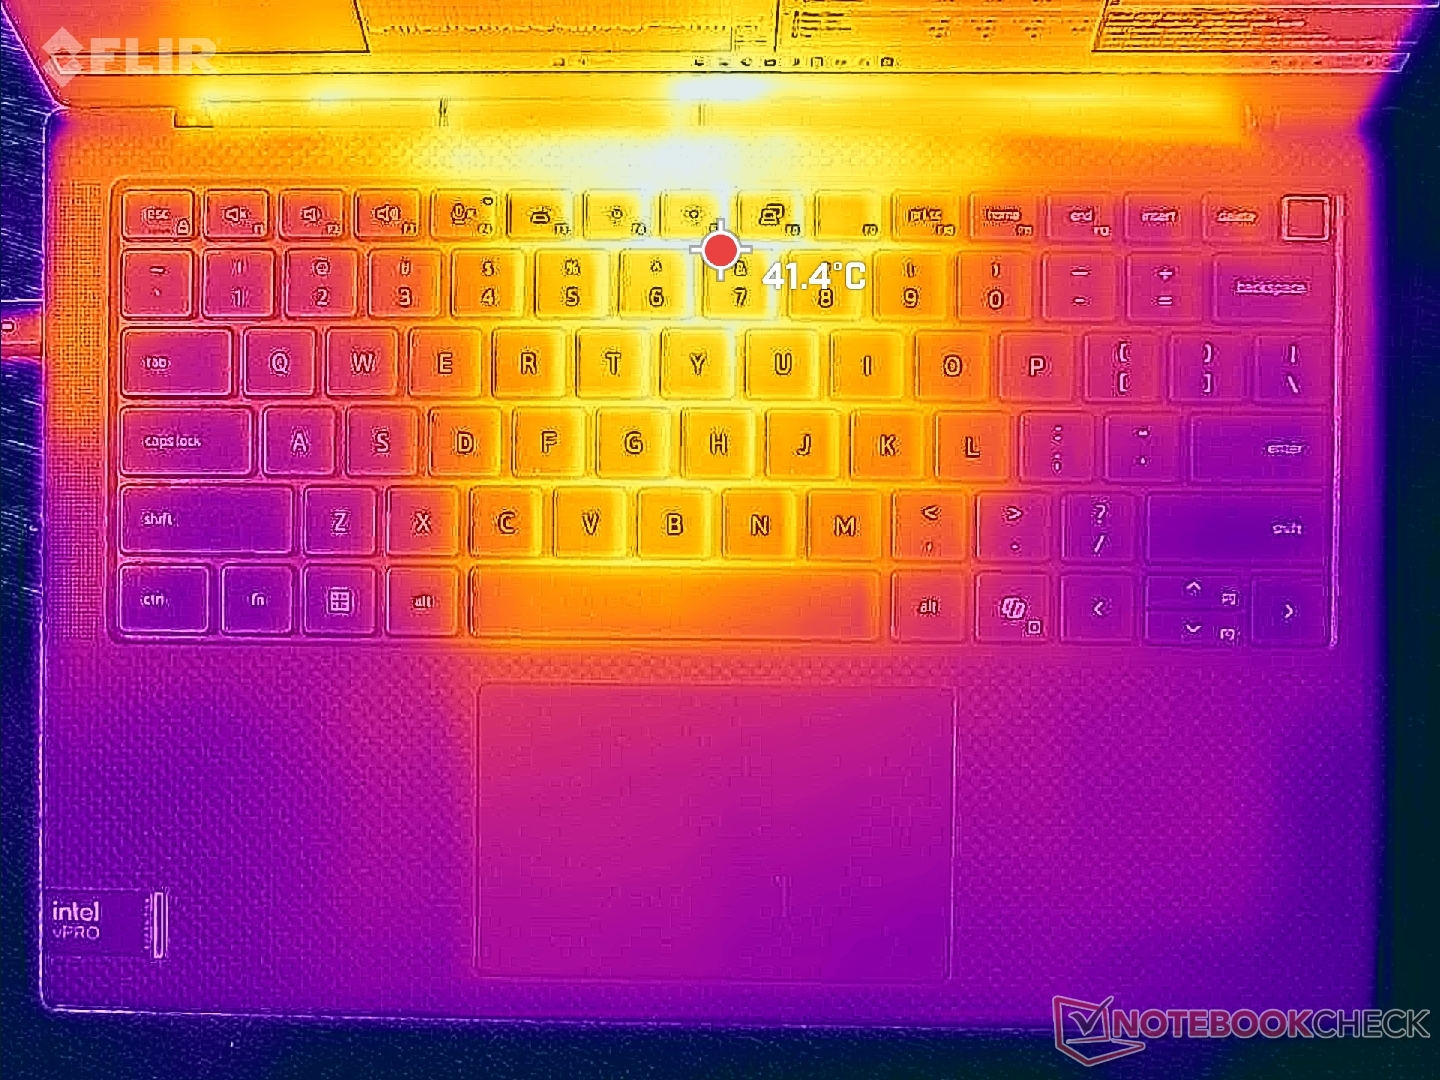
Le développement de la température est symétrique et les points chauds sont les plus proches du centre du clavier, tandis que les côtés et les repose-paumes sont beaucoup plus froids. Les points chauds sont néanmoins nettement moins chauds que sur le HP ZBook Firefly 14 G10 de plusieurs degrés Celsius.
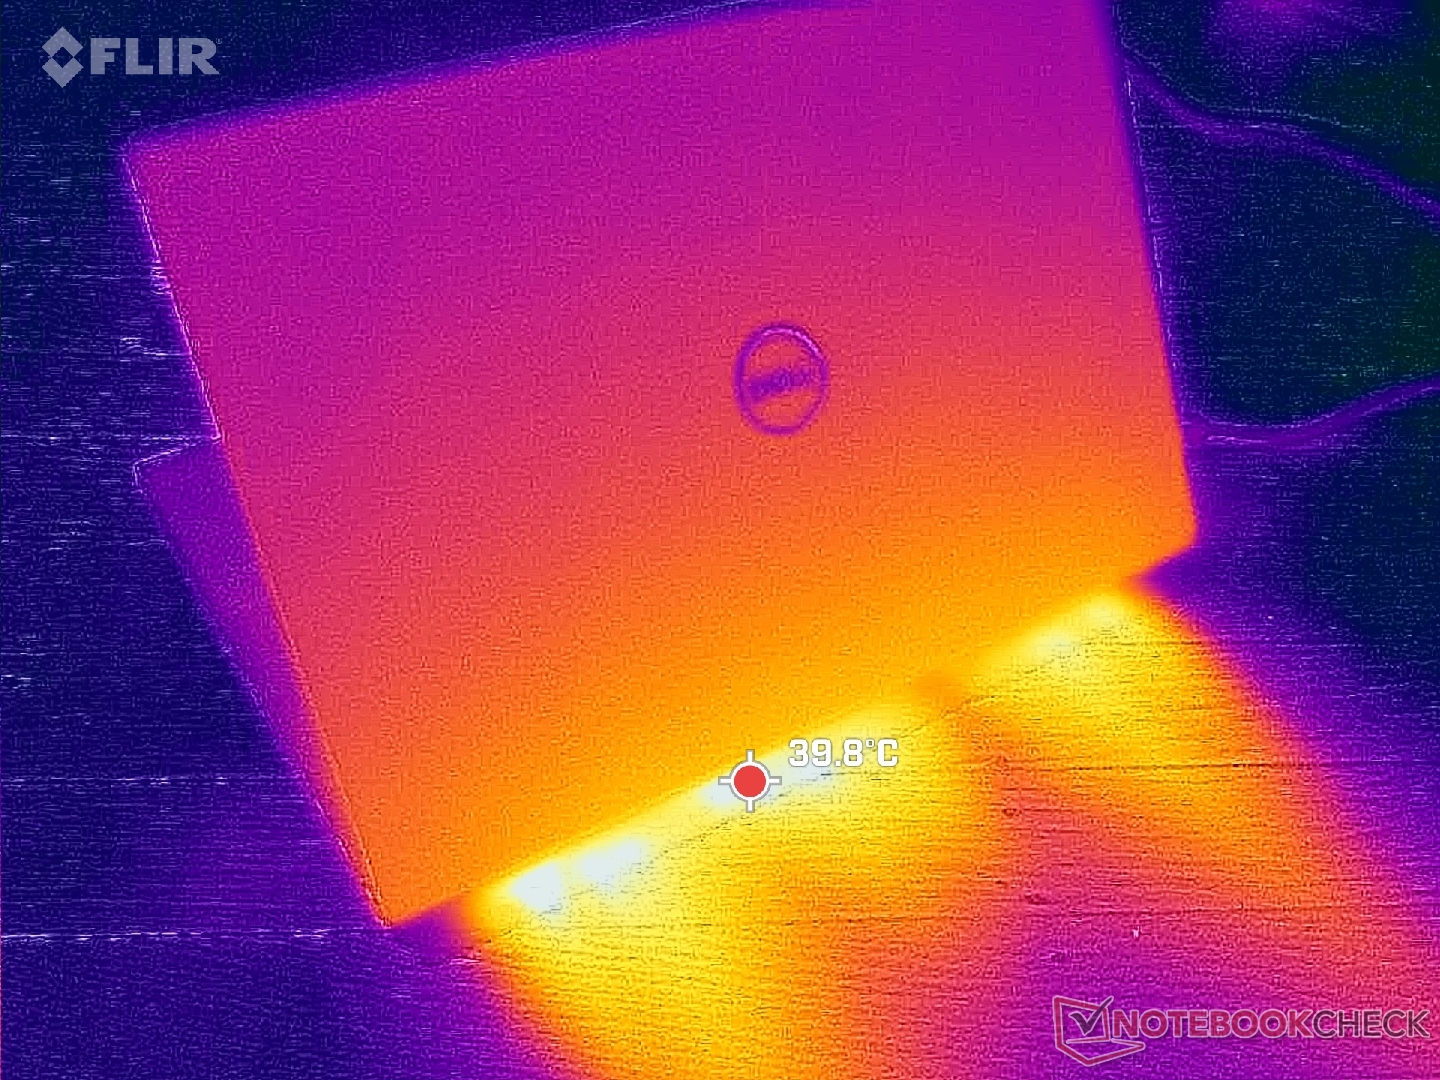
(±) La température maximale du côté supérieur est de 43.2 °C / 110 F, par rapport à la moyenne de 38.2 °C / 101 F, allant de 22.2 à 69.8 °C pour la classe Workstation.
(+) Le fond chauffe jusqu'à un maximum de 38.4 °C / 101 F, contre une moyenne de 41.2 °C / 106 F
(+) En utilisation inactive, la température moyenne du côté supérieur est de 29 °C / 84 F, par rapport à la moyenne du dispositif de 32 °C / 90 F.
(+) En jouant à The Witcher 3, la température moyenne du côté supérieur est de 31.7 °C / 89 F, alors que la moyenne de l'appareil est de 32 °C / 90 F.
(+) Les repose-poignets et le pavé tactile sont plus froids que la température de la peau avec un maximum de 27.6 °C / 81.7 F et sont donc froids au toucher.
(±) La température moyenne de la zone de l'appui-paume de dispositifs similaires était de 27.8 °C / 82 F (+0.2 °C / #0.3 F).
| Dell Precision 5000 5490 Intel Core Ultra 9 185H, NVIDIA RTX 3000 Ada Generation Laptop GPU | Lenovo ThinkPad P14s G4 21HF0017GE Intel Core i7-1370P, NVIDIA RTX A500 Laptop GPU | HP ZBook Firefly 14 G10 A AMD Ryzen 5 PRO 7640HS, AMD Radeon 760M | HP ZBook Firefly 14 G9-6B8A2EA Intel Core i7-1265U, NVIDIA T550 Laptop GPU | Dell Precision 5480 Intel Core i9-13900H, NVIDIA RTX 3000 Ada Generation Laptop GPU | Dell Precision 5000 5470 Intel Core i9-12900H, NVIDIA RTX A1000 Laptop GPU | |
|---|---|---|---|---|---|---|
| Heat | -13% | -4% | 2% | -13% | -3% | |
| Maximum Upper Side * | 43.2 | 55.3 -28% | 50 -16% | 41.2 5% | 44 -2% | 41.8 3% |
| Maximum Bottom * | 38.4 | 48.7 -27% | 51 -33% | 47.9 -25% | 38.2 1% | 36 6% |
| Idle Upper Side * | 31.6 | 31 2% | 25 21% | 26.5 16% | 38.8 -23% | 34.6 -9% |
| Idle Bottom * | 30.6 | 29.9 2% | 27 12% | 27 12% | 38.6 -26% | 33.6 -10% |
* ... Moindre est la valeur, meilleures sont les performances
Intervenants
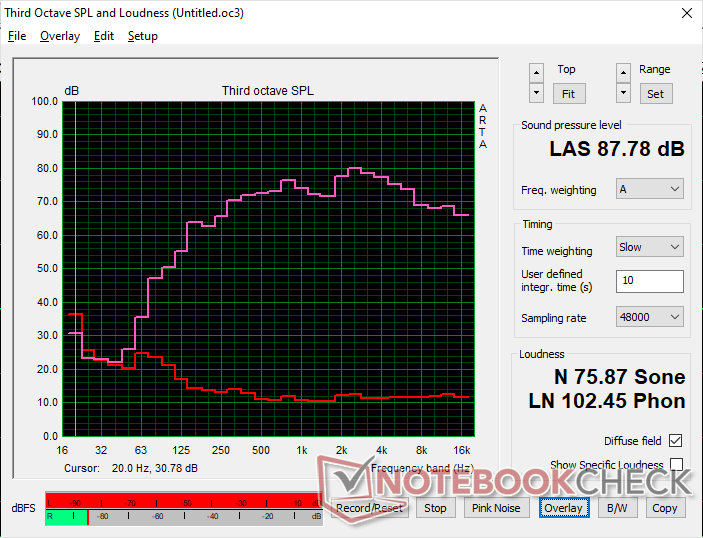
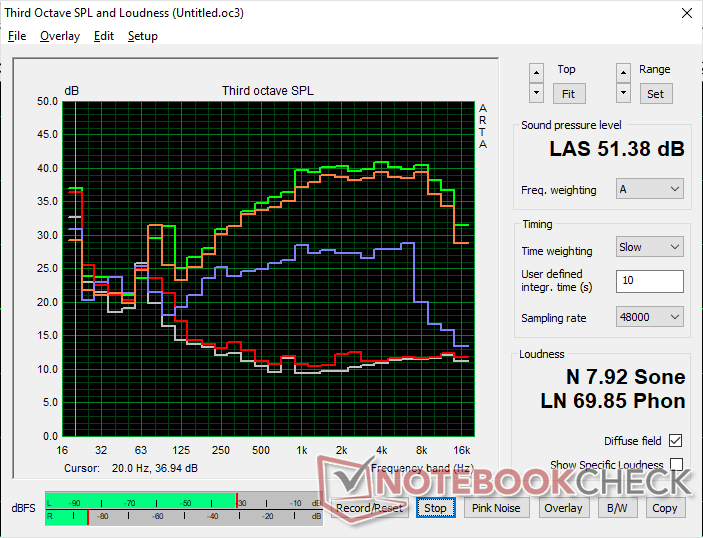
Dell Precision 5000 5490 analyse audio
(+) | les haut-parleurs peuvent jouer relativement fort (87.8# dB)
Bass 100 - 315 Hz
(±) | basse réduite - en moyenne 10.9% inférieure à la médiane
(±) | la linéarité des basses est moyenne (7.2% delta à la fréquence précédente)
Mids 400 - 2000 Hz
(+) | médiane équilibrée - seulement 1.7% de la médiane
(+) | les médiums sont linéaires (3.5% delta à la fréquence précédente)
Aiguës 2 - 16 kHz
(+) | des sommets équilibrés - à seulement 4.4% de la médiane
(+) | les aigus sont linéaires (3.4% delta à la fréquence précédente)
Overall 100 - 16.000 Hz
(+) | le son global est linéaire (9.2% différence à la médiane)
Par rapport à la même classe
» 3% de tous les appareils testés de cette catégorie étaient meilleurs, 2% similaires, 95% pires
» Le meilleur avait un delta de 7%, la moyenne était de 18%, le pire était de 35%.
Par rapport à tous les appareils testés
» 2% de tous les appareils testés étaient meilleurs, 1% similaires, 97% pires
» Le meilleur avait un delta de 4%, la moyenne était de 25%, le pire était de 134%.
Apple MacBook Pro 16 2021 M1 Pro analyse audio
(+) | les haut-parleurs peuvent jouer relativement fort (84.7# dB)
Bass 100 - 315 Hz
(+) | bonne basse - seulement 3.8% loin de la médiane
(+) | les basses sont linéaires (5.2% delta à la fréquence précédente)
Mids 400 - 2000 Hz
(+) | médiane équilibrée - seulement 1.3% de la médiane
(+) | les médiums sont linéaires (2.1% delta à la fréquence précédente)
Aiguës 2 - 16 kHz
(+) | des sommets équilibrés - à seulement 1.9% de la médiane
(+) | les aigus sont linéaires (2.7% delta à la fréquence précédente)
Overall 100 - 16.000 Hz
(+) | le son global est linéaire (4.6% différence à la médiane)
Par rapport à la même classe
» 0% de tous les appareils testés de cette catégorie étaient meilleurs, 0% similaires, 100% pires
» Le meilleur avait un delta de 5%, la moyenne était de 18%, le pire était de 45%.
Par rapport à tous les appareils testés
» 0% de tous les appareils testés étaient meilleurs, 0% similaires, 100% pires
» Le meilleur avait un delta de 4%, la moyenne était de 25%, le pire était de 134%.
Gestion de l'énergie
Consommation électrique
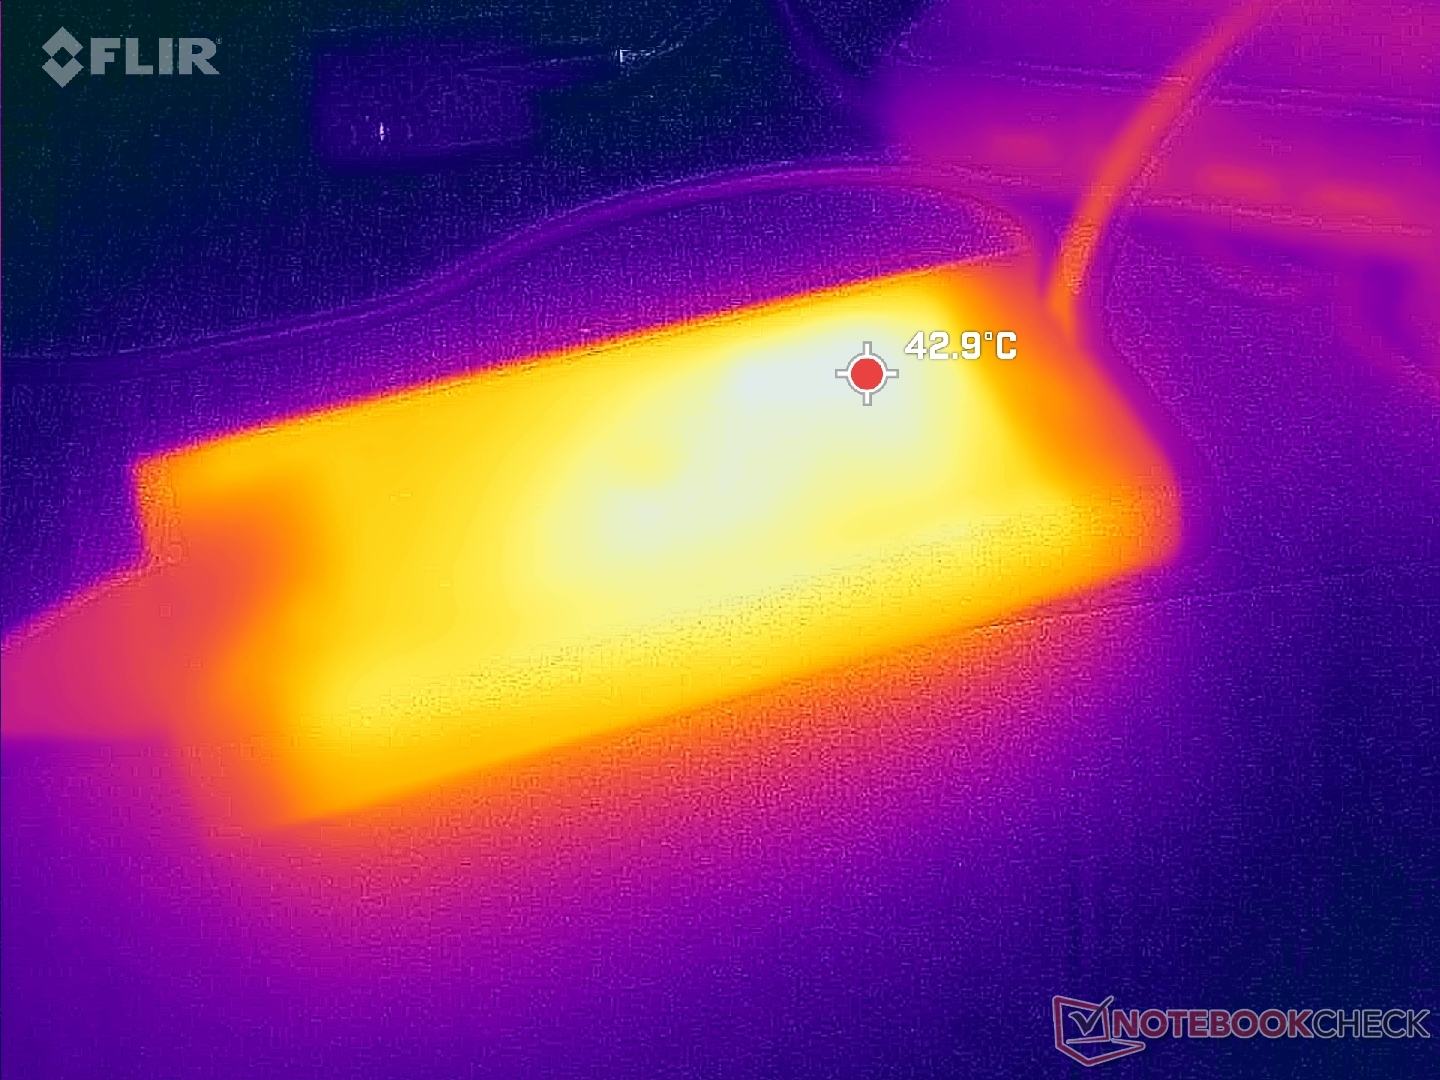
Le fonctionnement Witcher 3 exige une moyenne de 88 W pour être proche de ce que nous avons enregistré sur le Precision 5480 malgré les différences de CPU. Par rapport à d'autres stations de travail de 14 pouces, le Precision 5490 est l'un des plus gourmands, ce qui s'aligne sur ses performances relativement rapides.
Un adaptateur USB-C plus petit de 100 W est livré avec les configurations qui n'utilisent pas de graphiques discrets. Sinon, un adaptateur USB-C de 130 W est livré en standard.
(Note de la rédaction: cette section sera mise à jour lorsque les réparations de notre multimètre Metrahit Energy seront terminées dans le courant du mois. Nous vous prions de nous excuser pour la gêne occasionnée)
| Éteint/en veille | |
| Au repos | |
| Fortement sollicité |
|
| Dell Precision 5000 5490 Ultra 9 185H, NVIDIA RTX 3000 Ada Generation Laptop GPU, Kioxia XG8 KXG80ZNV1T02, IPS, 2560x1600, 14.00 | Lenovo ThinkPad P14s G4 21HF0017GE i7-1370P, RTX A500 Laptop GPU, SK Hynix HFS002TEJ9X162N, OLED, 2880x1800, 14.00 | HP ZBook Firefly 14 G10 A R5 PRO 7640HS, Radeon 760M, Samsung PM9B1 512GB MZVL4512HBLU, IPS, 1920x1200, 14.00 | HP ZBook Firefly 14 G9-6B8A2EA i7-1265U, T550 Laptop GPU, Micron 3400 1TB MTFDKBA1T0TFH, IPS, 1920x1200, 14.00 | Dell Precision 5480 i9-13900H, NVIDIA RTX 3000 Ada Generation Laptop GPU, Samsung PM9A1 MZVL21T0HCLR, IPS, 2560x1600, 14.00 | Dell Precision 5000 5470 i9-12900H, RTX A1000 Laptop GPU, Samsung PM9A1 MZVL21T0HCLR, IPS, 2560x1600, 14.00 | |
|---|---|---|---|---|---|---|
| Power Consumption | 51% | 52% | -24% | 11% | ||
| Idle Minimum * | 11.1 | 3 73% | 4.2 62% | 14.9 -34% | 4.3 61% | |
| Idle Average * | 14.8 | 4 73% | 6.5 56% | 19.5 -32% | 8.9 40% | |
| Idle Maximum * | 16.5 | 8 52% | 7.2 56% | 27.2 -65% | 18.9 -15% | |
| Load Average * | 70.1 | 56 20% | 47.7 32% | 81.6 -16% | 94 -34% | |
| Witcher 3 ultra * | 93.1 | 58.2 37% | 42.9 54% | 90.4 3% | 83.2 11% | |
| Load Maximum * | 137.5 | 66 52% | 68.2 50% | 137.8 -0% | 137.5 -0% |
* ... Moindre est la valeur, meilleures sont les performances
Power Consumption Witcher 3 / Stresstest
Power Consumption external Monitor
Autonomie de la batterie
L'autonomie de la batterie est presque identique à celle que nous avons enregistrée sur le Precision 5480, puisque les deux modèles partagent des composants et des niveaux de performance similaires.
| Dell Precision 5000 5490 Ultra 9 185H, NVIDIA RTX 3000 Ada Generation Laptop GPU, 72 Wh | Lenovo ThinkPad P14s G4 21HF0017GE i7-1370P, RTX A500 Laptop GPU, 52.5 Wh | HP ZBook Firefly 14 G10 A R5 PRO 7640HS, Radeon 760M, 51 Wh | HP ZBook Firefly 14 G9-6B8A2EA i7-1265U, T550 Laptop GPU, 51 Wh | Dell Precision 5480 i9-13900H, NVIDIA RTX 3000 Ada Generation Laptop GPU, 72 Wh | Dell Precision 5000 5470 i9-12900H, RTX A1000 Laptop GPU, 72 Wh | |
|---|---|---|---|---|---|---|
| Autonomie de la batterie | 19% | -19% | 0% | -13% | ||
| WiFi v1.3 | 658 | 782 19% | 530 -19% | 655 0% | 573 -13% | |
| Load | 55 | 63 | ||||
| Reader / Idle | 883 |
Points positifs
Points négatifs
Verdict - Presque impossible à distinguer du Precision 5480
Les Precision 5480 a apporté une amélioration significative du GPU par rapport au Precision 5470 en raison du changement de génération de GPU, même si leurs châssis étaient identiques. Pour le Precision 5490, cependant, le modèle n'introduit pas de nouvelles options de GPU et la RTX 3000 Ada reste donc la configuration haut de gamme. Si la performance du GPU est une priorité, le Precision 5490 fonctionnera de la même manière que le Precision 5480.
Les performances du CPU et les performances graphiques stagnent entre le Precision 5490 et le Precision 5480. Le dernier modèle se concentre sur l'accélération de l'intelligence artificielle, qui n'en est qu'à ses débuts au moment de la publication.
En dehors du GPU, le saut du CPU de Raptor Lake-H à Meteor Lake-H n'apporte pas d'avantages majeurs en termes de performances brutes. Son NPU intégré, qui est le principal argument de vente du Precision 5490, n'a que peu d'applications à l'heure où nous écrivons ces lignes. Acheter le Precision 5490 aujourd'hui signifie donc investir dans l'accélération locale de l'IA et les futures fonctionnalités Windows AI.
Pour les futurs modèles, nous aimerions voir des options d'affichage supplémentaires, en particulier pour les applications qui exigent des couleurs P3 et des temps de réponse noir-blanc plus rapides. Des alternatives comme le ThinkPad P14s proposent un écran OLED, alors que notre Precision ne dispose que d'un écran IPS.
Prix et disponibilité
Dell livre maintenant le Precision 5490 à partir de $2250 USD pour la configuration de base Core Ultra 5, RTX 1000 Ada, et 1200p jusqu'à plus de $3900 pour la configuration haut de gamme Core Ultra 9, RTX 3000 Ada, et 1600p.
Dell Precision 5000 5490
-
04/25/2024 v7
Allen Ngo
Transparency
The present review sample was made available to the author as a loan by the manufacturer or a shop for the purposes of review. The lender had no influence on this review, nor did the manufacturer receive a copy of this review before publication. There was no obligation to publish this review.
Pricecompare

