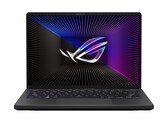
Test de l'Asus ROG Zephyrus G14 GA402RJ : un écran lumineux et de belles performances
AMD Ryzen 7 6800HS | AMD Radeon RX 6700S | 14.00" | 1.7 kg

L'AMD Radeon RX 6700S est une carte graphique mobile haut de gamme destinée aux ordinateurs portables de jeu. Elle utilise la puce Navi 22 basée sur la nouvelle architecture RDNA 2. Elle utilise 2 304 des 2 560 shaders (= 36 CU), 144 ? TMUs, et 64 ROPs. Le système de mémoire à 160 bits relie 10 Go de GDDR6 avec une horloge mémoire de 2 GHz. En outre, le RX6800S comprend 80 Mo de cache Infinity. AMD a spécifié une horloge de jeu de 2 GHz pour une performance FP32 théorique de 7,9 TFLOPS à un TDP de 80 Watt. Cela signifie que le GPU est en théorie plus lent qu'une Radeon RX 6650M (8,85 TFLOPS). Le 6700S est la variante d'économie d'énergie du RX 6700M et présente des vitesses d'horloge plus basses et un TDP inférieur.
Les performances de jeu du RX 6700S devraient être similaires à celles du Radeon RX 6650M. AMD précise que les performances sont similaires à celles d'une RTX 3060 à faible consommation. Lorsque les effets de Raytracing sont activés, il se retrouve derrière les GPU GeForce.
La puce Navi 22 est fabriquée par TSMC selon le procédé moderne de 7 nm.
Radeon RX 6000M Gamme
| ||||||||||||||||||||||||||||||||||||||||||||||
| Architecture | RDNA 2 | |||||||||||||||||||||||||||||||||||||||||||||
| Pipelines | 1792 - unifiés | |||||||||||||||||||||||||||||||||||||||||||||
| TMUs | 112 | |||||||||||||||||||||||||||||||||||||||||||||
| ROPs | 64 | |||||||||||||||||||||||||||||||||||||||||||||
| Raytracing Cores | 28 | |||||||||||||||||||||||||||||||||||||||||||||
| Fréquence du noyau interne | 1700 - 1890 (Boost) MHz | |||||||||||||||||||||||||||||||||||||||||||||
| Theoretical Performance | 15.84 TFLOPS FP16, 7.92 TFLOPS FP32 | |||||||||||||||||||||||||||||||||||||||||||||
| Cache | L2: 2 Mo, L3: 32 Mo | |||||||||||||||||||||||||||||||||||||||||||||
| Fréquence de la mémoire | 14000 effective = 1750 MHz | |||||||||||||||||||||||||||||||||||||||||||||
| Largeur du bus mémoire | 128 Bit | |||||||||||||||||||||||||||||||||||||||||||||
| Type de mémoire | GDDR6 | |||||||||||||||||||||||||||||||||||||||||||||
| Quantité maximale possible de mémoire embarquée | 10 GB | |||||||||||||||||||||||||||||||||||||||||||||
| Mémoire partagée | non | |||||||||||||||||||||||||||||||||||||||||||||
| Memory Bandwidth | 224 GB/s | |||||||||||||||||||||||||||||||||||||||||||||
| API | DirectX 12, Shader 6.4, OpenGL 4.6 | |||||||||||||||||||||||||||||||||||||||||||||
| Consommation d'énergie | 80 Watt(s) | |||||||||||||||||||||||||||||||||||||||||||||
| Nombre de transistors | 17.2 Billion | |||||||||||||||||||||||||||||||||||||||||||||
| technologie | 7 nm | |||||||||||||||||||||||||||||||||||||||||||||
| PCIe | 4.0 x8 | |||||||||||||||||||||||||||||||||||||||||||||
| Caractéristiques | DisplayPort 1.4 w/DFSC, HDMI 2.0b, Radeon Media Engine (H.264 4K150 decode, 4K90 encode / H.265 4K90 decode, 4K60 encode / VP9 4K90 decode) | |||||||||||||||||||||||||||||||||||||||||||||
| Dimension de l'ordinateur portable | de taille moyenne | |||||||||||||||||||||||||||||||||||||||||||||
| Date de présentation | 04.01.2022 | |||||||||||||||||||||||||||||||||||||||||||||
| Lien redirigeant vers la page du fabricant | www.amd.com | |||||||||||||||||||||||||||||||||||||||||||||
Les benchmarks qui suivent sont tirés de tests effectués dans nos critiques des ordinateurs portables. Les performances dépendent du type et de la quantité de mémoire graphique embaquée, mais aussi de sa fréquence, du processeur, des paramètres système, des pilotes et du système d'exploitation. Les résultats ne sont donc pas représentatifs de tous les appareils intégrant cette carte graphique. Pour plus de détails sur les résultats, cliquez sur le nombre d'images par seconde.


| Bas | Moyen | Élevé | Ultra | QHD | 4K | |
|---|---|---|---|---|---|---|
| The Quarry | 95.3 | 76.1 | 54.8 | 35.3 | ||
| F1 22 | 211 | 161 | 37 | 21 | ||
| Vampire Bloodhunt | 202 | 179.5 | 165.4 | 97.9 | ||
| Ghostwire Tokyo | 116.4 | 115.3 | 115.2 | 59.8 | ||
| Tiny Tina's Wonderlands | 133 | 82.4 | 62.4 | 39.1 | ||
| Cyberpunk 2077 1.6 | 99.1 | 74 | 59.7 | 31.2 | ||
| Elex 2 | 70.7 | 64.8 | 59.2 | 38.3 | ||
| GRID Legends | 194 | 147 | 114 | 88.1 | ||
| Elden Ring | 59.9 | 59.9 | 59.9 | 56.6 | ||
| Dying Light 2 | 64.8 | 50.9 | 31.1 | |||
| Rainbow Six Extraction | 159 | 157 | 126 | 66 | ||
| God of War | 79 | 69.4 | 50.5 | 38.9 | ||
| Halo Infinite | 97.9 | 80.8 | 75.9 | 53.9 | ||
| Farming Simulator 22 | 155.9 | 134.2 | 119.8 | 104.5 | ||
| Forza Horizon 5 | 140 | 138 | 74 | 54 | ||
| Riders Republic | 100 | 91 | 88 | 59 | ||
| Guardians of the Galaxy | 112 | 111 | 104 | 68 | ||
| Back 4 Blood | 200 | 171.3 | 157.3 | 92.4 | ||
| Far Cry 6 | 107 | 93 | 86 | 59 | ||
| Alan Wake Remastered | 133.3 | 120.8 | 78.2 | |||
| Deathloop | 110.8 | 89 | 66.3 | 39.6 | ||
| Days Gone | 117.4 | 106.5 | 77.2 | 50.6 | ||
| Mass Effect Legendary Edition | 98.4 | 95.3 | ||||
| Resident Evil Village | 195.7 | 180.1 | 142.8 | 92.3 | ||
| Outriders | 115.5 | 111.3 | 96.9 | 56.3 | ||
| Hitman 3 | 178 | 159 | 146 | 83.4 | ||
| Yakuza Like a Dragon | 98.5 | 94.7 | 83.5 | 48.9 | ||
| Assassin´s Creed Valhalla | 113 | 93 | 79 | 49 | ||
| Dirt 5 | 116 | 98 | 80.3 | 67.7 | ||
| Watch Dogs Legion | 109 | 96 | 59 | 38 | ||
| Star Wars Squadrons | 286 | 245 | 224 | 146.7 | ||
| Mafia Definitive Edition | 92 | 84.3 | 51.2 | |||
| Serious Sam 4 | 102 | 94.9 | 82.9 | 73.1 | ||
| Crysis Remastered | 171.2 | 55 | 46.6 | 28.4 | ||
| Death Stranding | 139.8 | 129.8 | 128 | 85.4 | ||
| Gears Tactics | 189 | 123 | 88.1 | 56.7 | ||
| Doom Eternal | 218 | 194.7 | 189.7 | 120.8 | ||
| Hunt Showdown | 124.7 | 99.3 | 72 | |||
| Strange Brigade | 227 | 182.7 | 157.3 | |||
| Far Cry 5 | 110 | 103 | 97 | 79 | ||
| X-Plane 11.11 | 65.4 | 51.7 | 45.2 | |||
| Final Fantasy XV Benchmark | 106.7 | 78.6 | ||||
| Dota 2 Reborn | 145.1 | 114.7 | 103 | |||
| The Witcher 3 | 246 | 144 | 84.3 | |||
| GTA V | 170.9 | 154.7 | 81.3 | |||
| Bas | Moyen | Élevé | Ultra | QHD | 4K | < 30 fps < 60 fps < 120 fps ≥ 120 fps | 1 1 | 2 21 20 | 4 23 17 | 8 22 9 | 2 20 15 2 | |
Pour plus de jeux susceptibles d'être fluides avec cette carte graphique et obtenir une liste exhaustive de tous les jeux et cartes graphiques testés, consultez notre liste des jeux.

Asus ROG Zephyrus G14 GA402RJ: AMD Ryzen 7 6800HS, 14.00", 1.7 kg
Autres tests » Asus ROG Zephyrus G14 GA402RJ
Asus ROG Zephyrus G14 GA402RJ-L8116W: AMD Ryzen 7 6800HS, 14.00", 1.7 kg
Autres tests » Asus ROG Zephyrus G14 GA402RJ-L8116W
* Position approximative de la carte graphique
Top 10
» Le Top 10 des PC portables multimédia
» Le Top 10 des PC portables de jeu
» Le Top 10 des PC portables de jeu légers
» Le Top 10 des ordinateurs portables bureautiques
» Le Top 10 des PC portables bureautiques premium/professionnels
» Le Top 10 des Stations de travail mobiles
» Le Top 10 des Ultraportables
» Le Top 10 des Ultrabooks
» Le Top 10 des Convertibles
» Le Top 10 des Tablettes
» Le Top 10 des Tablettes Windows
» Le Top 10 des Smartphones
» Le Top 10 des PC Portables á moins de 300 euros
» Le Top 10 des PC Portables á moins de 500 euros
» Le Top 25 des meilleurs écrans d'ordinateurs