Critiques du Intel Core i7-1195G7 processeur
Test du Geekom Mini IT11 SFF : un PC Tiger Lake solide et compact
Le Geekom Mini IT11 est un ordinateur de bureau de petite taille solidement construit, doté de nombreux ports et d'une puissance CPU suffisante pour le travail multimédia général. Il a du mal à gérer la chaleur lorsque l'iGPU est complètement chargé. En fin de compte, le Mini IT11 est un bon rapport qualité/prix.
Intel Core i7-1195G7, Iris Xe G7 96EUs, 565 gTest de l'Asus ExpertBook B7 Flip : PC 2-en-1 avec modem 5G et une bonne autonomie
L'ExpertBook offre un modem 5G, deux ports Thunderbolt 4 et un écran tactile de 14 pouces (1920x1200 pixels) avec un rapport d'aspect 16:10. L'écran tactile peut être utilisé à la fois par saisie tactile et avec le stylet Asus inclus.
Intel Core i7-1195G7, Iris Xe G7 96EUs, 14", 1.4 kgTest du Gigabyte U4 UD : PC portable léger au bon potentiel parfois gaspillé
Un processeur d'une vitesse allant jusqu'à 5 GHz combiné à 16 Go de RAM promet de bonnes performances. Lisez notre test pour savoir si le Gigabyte U4 UD, un ordinateur compact de 14 pouces, peut répondre à ces attentes, et comment il se positionne en termes de performances graphiques, d'autonomie de batterie, etc.
Intel Core i7-1195G7, Iris Xe G7 96EUs, 14", 958 gTest de l'UMPC GPD Pocket 3 : convertible plus rapide que nombre de PC portables Intel EVO
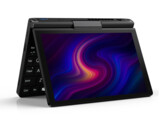
Le Pocket 3 de 8 pouces intègre un grand nombre de fonctionnalités que l'on retrouve sur les ordinateurs portables de taille normale, notamment un processeur Core i7 de 11e génération, le Wi-Fi 6E, un SSD NVMe PCIe4, Thunderbolt 4, la prise en charge de Windows 11 et même RS-232. Nous n'avons trouvé que quelques réserves flagrantes qui, nous l'espérons, seront corrigées dans les futures révisions.
Intel Core i7-1195G7, Iris Xe G7 96EUs, 8", 730 gTest du VAIO SX14 2021 : l'ultrabook Core i7 à 2 500 euros
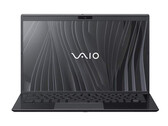
Vaio veut vous faire payer Apple pour un PC Windows. Alors que la configuration Core i5 d'entrée de gamme a un prix raisonnable pour ce que vous obtenez, notre configuration Core i7 haut de gamme n'offre pas beaucoup plus pour justifier son énorme surcoût de 700 $.
Intel Core i7-1195G7, Iris Xe G7 96EUs, 14", 1.1 kgMSI Prestige 14 Evo A11MO-026US: Intel Iris Xe Graphics G7 96EUs, 14.00", 1.2 kg
Critique » Test du MSI Prestige 14 Evo : quelles sont les capacités du nouveau Core i7-1195G7 ?
HP 15s-fq4088ns: Intel Iris Xe Graphics G7 96EUs, 15.60", 1.7 kg
Autres tests » HP 15s-fq4088ns
Acer Aspire Vero AV15-51-7617: Intel Iris Xe Graphics G7 96EUs, 15.60", 1.8 kg
Autres tests » Acer Aspire Vero AV15-51-7617
Infinix Inbook X2 Plus, i7-1195G7: Intel Iris Xe Graphics G7 96EUs, 15.60", 1.7 kg
Autres tests » Infinix Inbook X2 Plus, i7-1195G7
HP 15s-fq4009ns: Intel Iris Xe Graphics G7 96EUs, 15.60", 1.7 kg
Autres tests » HP 15s-fq4009ns
HP Envy 17-ch1056nf: NVIDIA GeForce MX450, 17.30", 2.5 kg
Autres tests » HP Envy 17-ch1056nf
HP 14s-dq4001ns: Intel Iris Xe Graphics G7 96EUs, 14.00", 1.5 kg
Autres tests » HP 14s-dq4001ns
MSI Modern 14 B11SBU: Intel Iris Xe Graphics G7 96EUs, 14.00", 1.3 kg
Autres tests » MSI Modern 14 B11SBU
MSI Modern 14 B11MO-879XES: Intel Iris Xe Graphics G7 96EUs, 14.00", 1.3 kg
Autres tests » MSI Modern 14 B11MO-879XES
HP 15s-fq4086ns: Intel Iris Xe Graphics G7 96EUs, 15.60", 1.7 kg
Autres tests » HP 15s-fq4086ns
HP Pavilion x360 14-dy1034ns: Intel Iris Xe Graphics G7 96EUs, 14.00", 1.5 kg
Autres tests » HP Pavilion x360 14-dy1034ns
Asus ExpertBook B7 Flip B7402FEA: Intel Iris Xe Graphics G7 96EUs, 14.00", 1.4 kg
Autres tests » Asus ExpertBook B7 Flip B7402FEA
Acer TravelMate Vero TMV15-51-728C: Intel Iris Xe Graphics G7 96EUs, 15.60", 1.8 kg
Autres tests » Acer TravelMate Vero TMV15-51-728C
HP Pavilion x360 14-dy1004ns: Intel Iris Xe Graphics G7 96EUs, 14.00", 1.5 kg
Autres tests » HP Pavilion x360 14-dy1004ns
Huawei MateBook X Pro 2022: Intel Iris Xe Graphics G7 96EUs, 14.20", 1.4 kg
Autres tests » Huawei MateBook X Pro 2022
HP 15s-fq4005ns: Intel Iris Xe Graphics G7 96EUs, 15.60", 1.7 kg
Autres tests » HP 15s-fq4005ns
Lenovo Yoga 9 14ITL5-82BG009WUS: Intel Iris Xe Graphics G7 96EUs, 14.00", 1.4 kg
Autres tests » Lenovo Yoga 9 14ITL5-82BG009WUS
HP Spectre x360 14-ea1013TU: Intel Iris Xe Graphics G7 96EUs, 13.50", 1.3 kg
Autres tests » HP Spectre x360 14-ea1013TU
HP Envy x360 15m-es1023dx: Intel Iris Xe Graphics G7 96EUs, 15.60", 1.8 kg
Autres tests » HP Envy x360 15m-es1023dx
HP 15s-fq4006ns: Intel Iris Xe Graphics G7 96EUs, 15.60", 1.7 kg
Autres tests » HP 15s-fq4006ns
Gigabyte U4 UD: Intel Iris Xe Graphics G7 96EUs, 14.00", 1 kg
Autres tests » Gigabyte U4 UD
Asus ExpertBook B7 Flip B7402FEA-LA0413R: Intel Iris Xe Graphics G7 96EUs, 14.00", 1.5 kg
Autres tests » Asus ExpertBook B7 Flip B7402FEA-LA0413R
Acer Aspire Vero AV15-51-76PV: Intel Iris Xe Graphics G7 96EUs, 15.60", 1.8 kg
Autres tests » Acer Aspire Vero AV15-51-76PV
Acer Aspire Vero AV15-51-78SB: Intel Iris Xe Graphics G7 96EUs, 15.60", 1.8 kg
Autres tests » Acer Aspire Vero AV15-51-78SB
Acer Aspire Vero AV15-51-7555: Intel Iris Xe Graphics G7 96EUs, 15.60", 1.8 kg
Autres tests » Acer Aspire Vero AV15-51-7555
MSI Summit E16 Flip Evo A11UCT-028: NVIDIA GeForce RTX 3050 4GB Laptop GPU, 16.00", 2 kg
Autres tests » MSI Summit E16 Flip Evo A11UCT-028
VAIO SX14 VJS144X0111K: Intel Iris Xe Graphics G7 96EUs, 14.00", 1.1 kg
Autres tests » VAIO SX14 VJS144X0111K
Acer Aspire Vero AV15-51-78SE: Intel Iris Xe Graphics G7 96EUs, 15.60", 1.8 kg
Autres tests » Acer Aspire Vero AV15-51-78SE
MSI Prestige 14 Evo A11MO-043: Intel Iris Xe Graphics G7 96EUs, 14.00", 1.3 kg
Autres tests » MSI Prestige 14 Evo A11MO-043
GPD Pocket 3: Intel Iris Xe Graphics G7 96EUs, 8.00", 0.7 kg
» GPD dévoile les prix du Pocket 4 : L'ultraportable alimenté par AMD bientôt disponible
» Veillez à modifier le niveau de puissance de votre GPD Pocket 3 via le BIOS pour obtenir une augmentation significative des performances
VAIO SX14 VJS144X0111K: Intel Iris Xe Graphics G7 96EUs, 14.00", 1.1 kg
» Le Vaio SX14 2021 présente plus de changements par rapport au SX14 2019 que prévu initialement