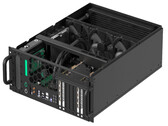
Notebookcheck Logo

AMD Ryzen Threadripper PRO 3975WX

AMD TR Pro 3975WX

Le AMD Ryzen Threadripper Pro 3975WX est un processeur de station de travail haut de gamme avec 32 cœurs (8 par chiplet) basé sur l'architecture Zen 2. Le processeur offre une vitesse d'horloge de base de 2,5 GHz et peut être boosté jusqu'à 4,2 GHz. Il utilise le nouveau socket sWRX8 et ne peut donc pas être utilisé pour mettre à niveau les anciens systèmes Threadripper. Le contrôleur de mémoire intégré utilise 8 canaux et prend en charge DDR4-3200.

GammeAMD Threadripper
Nom de codeMatisse

Gamme: Threadripper Matisse

AMD Ryzen Threadripper PRO 3995WX2.7 - 4.2 GHz64 / 128 cores256 MB L3
AMD Ryzen Threadripper PRO 3975WX « 3.5 - 4.2 GHz32 / 64 cores128 MB L3
Fréquence3500 - 4200 MHz
Cache de Niveau 1 (L1)2 MB
Cache de Niveau 2 (L2)16 MB
Cache de Niveau 3 (L3)128 MB
Nombres de cœurs/threads simultanés supportés32 / 64
Consommation énergétique maximale (TDP)280 Watt(s)
Nombre de transistors3800 Million(s)
Lithographie (procédé de fabrication)7 nm
Taille du Die74 mm2
Température maximale95 °C
SocketsWRX8 / sTRX4
FonctionnalitésMMX, SSE, SSE2, SSE3, SSSE3, SSE4A, SSE4.1, SSE4.2, AES, AVX, AVX2, BMI1, BMI2, SHA, F16C, FMA3, AMD64, EVP, AMD-V, SMAP, SMEP, SMT, Precision Boost 2, XFR 2
64 BitPrend en charge les instructions 64 Bit
Architecturex86
Date de présentation07/14/2020

Benchmarks

Performance Rating - CB R15 + R20 + 7-Zip + X265 + Blender + 3DM11 CPU
49.2 pt (68%)
Cinebench R23 - Cinebench R23 Multi Core
42744 Points (40%)
202 -100%
...
30428 -29%
30745 -28%
32782 -23%
33960 -21%
35794 -16%
35892 -16%
36291 -15%
37310 -13%
41193 -4%
AMD Ryzen Threadripper PRO 3975WX
42744
61102 43%
107681 152%
0%
100%
Cinebench R23 - Cinebench R23 Single Core
1286 Points (55%)
Cinebench R20 - Cinebench R20 CPU (Single Core)
500 Points (56%)
Cinebench R20 - Cinebench R20 CPU (Multi Core)
16464 Points (40%)
Cinebench R15 - Cinebench R15 CPU Multi 64 Bit
7053 Points (45%)
036072010801440180021602520288032403600396043204680504054005760612064806840Tooltip
Cinebench R15 - Cinebench R15 CPU Single 64 Bit
201 Points (61%)
19 -91%
...
195.9 -3%
196 -2%
196.7 -2%
AMD Ryzen 9 3900
197 -2%
197.5 -2%
198.8 -1%
199 -1%
199.8 -1%
200 0%
AMD Ryzen Threadripper PRO 3975WX
201
202 0%
202.3 1%
202.5 1%
203 1%
203.6 1%
AMD Ryzen 7 3700X
204 1%
205 2%
205 2%
205.1 2%
...
332 65%
0%
100%
Cinebench R11.5 - Cinebench R11.5 CPU Single 64 Bit
2.2 Points (54%)
Cinebench R10 - Cinebench R10 Rend. Single (32bit)
5884 points (36%)
Cinebench R10 - Cinebench R10 Rend. Multi (32bit)
53924 points (39%)
Cinebench R10 - Cinebench R10 Rend. Multi (64bit)
88079 Points (61%)
Cinebench R10 - Cinebench R10 Rend. Single (64bit)
10178 Points (12%)
wPrime 2.10 - wPrime 2.0 1024m *
24.3 s (0%)
wPrime 2.10 - wPrime 2.0 32m *
3.6 s (1%)
WinRAR - WinRAR 4.0
6530 points (10%)
7-Zip 18.03 - 7-Zip 18.03 Multli Thread 4 runs
141386 MIPS (81%)
7-Zip 18.03 - 7-Zip 18.03 Single Thread 4 runs
5140 MIPS (61%)
X264 HD Benchmark 4.0 - x264 Pass 2
193 fps (67%)
X264 HD Benchmark 4.0 - x264 Pass 1
268 fps (62%)
HWBOT x265 Benchmark v2.2 - HWBOT x265 4k Preset
43 fps (76%)
0510152025303540Tooltip
Blender - Blender 2.79 BMW27 CPU *
69.4 Seconds (0%)
R Benchmark 2.5 - R Benchmark 2.5 *
0.5 sec (12%)
3DMark 06 - CPU - 3DMark 06 - CPU
16923 Points (36%)
Super Pi mod 1.5 XS 1M - Super Pi mod 1.5 XS 1M *
9.5 s (2%)
Super Pi mod 1.5 XS 2M - Super Pi mod 1.5 XS 2M *
22.6 s (1%)
Super Pi Mod 1.5 XS 32M - Super Pi mod 1.5 XS 32M *
714 s (3%)
3DMark Vantage - 3DM Vant. Perf. CPU no Physx
min: 66795     moyenne: 66997     médian: 66996.5 (59%)     maximum: 67198 Points
3DMark 11 - 3DM11 Performance Physics
min: 17245     moyenne: 17290     médian: 17290 (47%)     maximum: 17335 Points
3DMark - 3DMark Ice Storm Physics
min: 42508     moyenne: 42712     médian: 42711.5 (35%)     maximum: 42915 Points
3DMark - 3DMark Ice Storm Extreme Physics
min: 43100     moyenne: 43256     médian: 43256 (35%)     maximum: 43412 Points
3DMark - 3DMark Ice Storm Unlimited Physics
min: 41865     moyenne: 42701     médian: 42701 (36%)     maximum: 43537 Points
3DMark - 3DMark Cloud Gate Physics
min: 14439     moyenne: 14617     médian: 14617 (37%)     maximum: 14795 Points
3DMark - 3DMark Fire Strike Standard Physics
min: 23884     moyenne: 24525     médian: 24525 (44%)     maximum: 25166 Points
3DMark - 3DMark Time Spy CPU
min: 11061     moyenne: 11108     médian: 11107.5 (47%)     maximum: 11154 Points
Geekbench 5.5 - Geekbench 5.1 - 5.4 64 Bit Single-Core
1285 points (54%)
58 -95%
...
AMD Ryzen 9 3900X
1250 -3%
1260 -2%
1263 -2%
Intel Core i5-1038NG7
1265 -2%
1267 -1%
Intel Core i7-7740X
1268 -1%
1273 -1%
Intel Core i7-1065G7
1274 -1%
1280 0%
AMD Ryzen Threadripper PRO 3975WX
1285
1286 0%
1296 1%
1296 1%
1296 1%
1299 1%
1300 1%
1300 1%
1303 1%
1303 1%
...
2331 81%
0%
100%
Geekbench 5.5 - Geekbench 5.1 - 5.4 64 Bit Multi-Core
28798 points (52%)
Geekbench 5.0 - Geekbench 5.0 64 Bit Single-Core
1306 points (6%)
Geekbench 5.0 - Geekbench 5.0 64 Bit Multi-Core
29094 points (92%)
Geekbench 4.4 - Geekbench 4.1 - 4.4 64 Bit Single-Core
5764 points (58%)
Geekbench 4.4 - Geekbench 4.1 - 4.4 64 Bit Multi-Core
81029 points (90%)
Mozilla Kraken 1.1 - Kraken 1.1 Total Score *
736 ms (1%)
WebXPRT 3 - WebXPRT 3 Score
198 Points (41%)
Power Consumption - Prime95 Power Consumption - external Monitor *
580 Watt (100%)
03570105140175210245280315350385420455490525560595Tooltip
- Amplitude des valeurs obtenues dans le benchmark avec cette carte graphique
- Valeur moyenne obtenue dans le benchmark avec cette carte graphique
* Plus les chiffres sont petits, plus les performances sont élevées

v1.26
log 24. 16:09:50

#0 no ids found in url (should be separated by "_") +0s ... 0s

#1 not redirecting to Ajax server +0s ... 0s

#2 did not recreate cache, as it is less than 5 days old! Created at Tue, 23 Apr 2024 05:40:15 +0200 +0.001s ... 0.001s

#3 no comparison url found in template nbc.compare_page_2 needed +0.007s ... 0.008s

#4 composed specs +0s ... 0.008s

#5 did output specs +0s ... 0.008s

#6 getting avg benchmarks for device 14011 +0.017s ... 0.026s

#7 got single benchmarks 14011 +0.013s ... 0.038s

#8 got avg benchmarks for devices +0s ... 0.038s

#9 min, max, avg, median took s +1.024s ... 1.062s

#10 no comparison url found in template nbc.compare_page_2 needed +0s ... 1.062s

#11 return log +0s ... 1.062s

Please share our article, every link counts!

» Comparaison des processeurs pour ordinateur portable
Comparaison de tout les processeurs mobiles


» Processeurs mobiles - liste des benchmarks
Liste des benchmarks de l'intégralité des processeurs pour portables


Les autres processeurs de la gamme Threadripper

» AMD Ryzen Threadripper PRO 7995WX
   96x 2.5 GHz - 5.1 GHz
» AMD Ryzen Threadripper PRO 3995WX
   64x 2.7 GHz - 4.2 GHz
» AMD Ryzen Threadripper PRO 3975WX
   32x 3.5 GHz - 4.2 GHz

Processeurs similaires

+ Intel Core i9-13900K
   24x 3 GHz - 5.8 GHz
+ AMD Ryzen 9 7950X3D
   16x 4.2 GHz - 5.7 GHz
+ Intel Core i7-14700K
   20x 2.5 GHz - 5.6 GHz
+ AMD Ryzen 9 7900X
   12x 4.7 GHz - 5.6 GHz
+ Intel Core i7-13700K
   16x 3.4 GHz - 5.4 GHz
» AMD Ryzen Threadripper PRO 3975WX
   32x 3.5 GHz - 4.2 GHz
- AMD Ryzen 9 7900
   12x 3.7 GHz - 5.4 GHz
- Intel Core i9-12900K
   16x 3.2 GHz - 5.2 GHz
- Intel Core i5-14600K
   14x 3.5 GHz - 5.3 GHz
- AMD Ryzen 7 7700X
   8x 4.5 GHz - 5.4 GHz
- AMD Ryzen 7 7700
   8x 3.8 GHz - 5.3 GHz
> Revues et rapports de ordinateurs portatifs et smartphones, ordiphones > FAQ > Processeurs mobiles - indice de référence > AMD Threadripper TR Pro 3975WX Notebook Processor
Klaus Hinum (Update: 2022-04- 3)