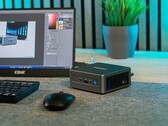


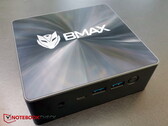
Test du BMAX B7 Power : un mini-PC frugal avec Intel Core i7 pour 400 $US
Intel ne fabriquant plus de mini-PC, d'autres fabricants ont rapidement comblé cette lacune. BMAX est un fabricant chinois qui propose des prix bas. Son modèle haut de gamme, le B7 Power, est équipé d'un Intel Core i7-11390H, de ventilateurs silencieux et convient parfaitement au travail de bureau. Dans cet article, nous avons examiné de plus près les performances de ce mini-PC au quotidien et les résultats obtenus lors de nos tests.
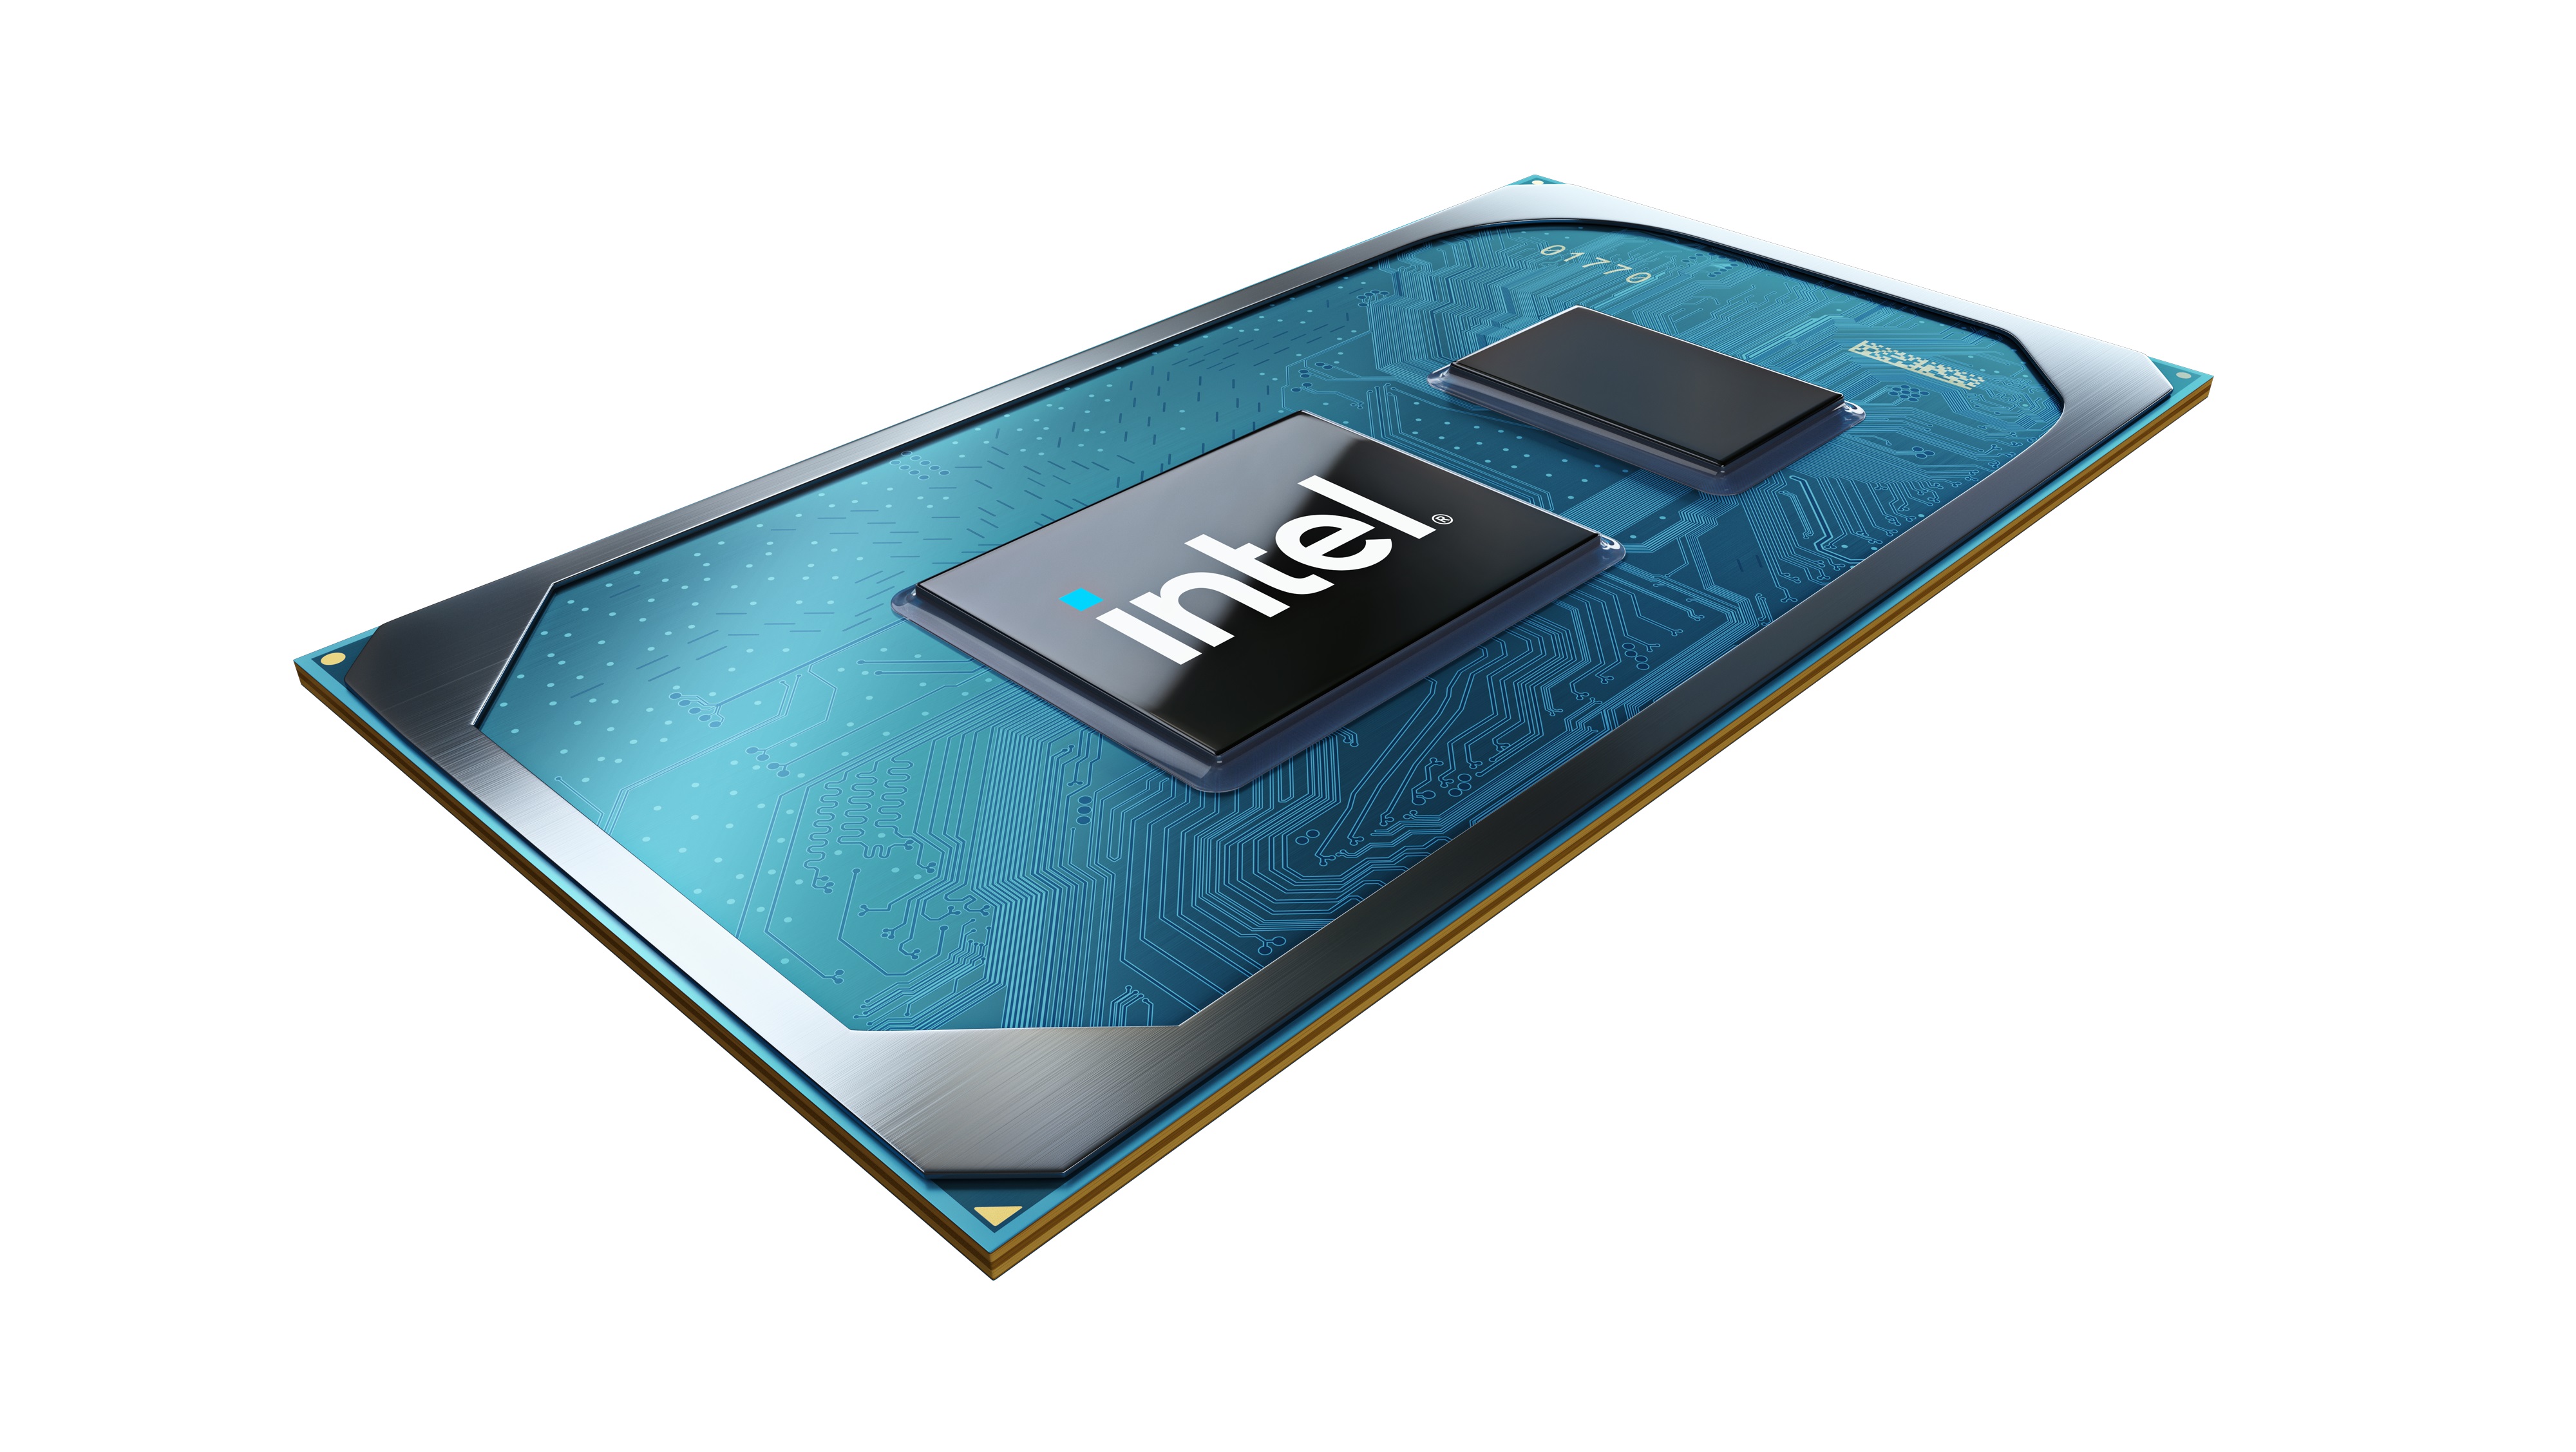
Intel Core i7-11390H, Iris Xe G7 96EUs, 363 g