AMD A10-5750M
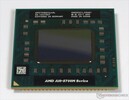
Le AMD A10-5750M est un processeur quad-core mobile basé sur l'architecture Richland. Succédant au A10-4600M, le A10-5750M possèdes des performances CPU et graphiques plus élevées et représente le nouveau modèle haut de gamme de la série A (Mars 2013).
Comparé à Trinity, Richland a été légèrement modifié. Donc, aucun changement de fonctionnalités au du rapport de performances/Mhz. La conception de la puce reste basé sur l'architecture Bulldozer, qui consiste en plusieurs modules. Chacun des deux modules intègre 2 unités intègres, mais seulement un FPU. Tout comme Trinity, Richland supporte presque toute les techniques actuelles telles que le AVX (avec FMA), AES et Turbo Core.
Les premiers benchmarks de PCMark 7 montrent une augmentation des performances de près de 10% sur le A10-4600M (5750M: 2175 points, 4600M: 1965 points). Donc, le A10-5750M se place à peu près au niveau du Core i3-2330M (Sandy Bridge).
La partie graphique du nom de Radeon HD 8650G possède 384 unités de shaders (VLIW4) et cadencée à 533 - 720 MHz (un peu au dessus de la HD 7660G). Avec une puissante mémoire dual-channel, les performances devraient dépasser la HD 7670M.
La consommation de l'APU en entier est notée à 35 watts, qui est comparable à un modèle de milieu de gamme conventionnel. Donc, le APU est adapté aux portables de 14 pouces ou plus.
Gamme AMD A-Series Nom de code Richland Gamme: A-Series Richland Fréquence 2500 - 3500 MHz Cache de Niveau 2 (L2) 4 MB Nombres de cœurs/threads simultanés supportés 4 / 4 Consommation énergétique maximale (TDP) 35 Watt(s) Lithographie (procédé de fabrication) 32 nm Socket FS1r2 Fonctionnalités SSE (1, 2, 3, 3S, 4.1, 4.2, 4A), x86-64, AES, AVX, FMA, DDR3-1866 Controller Carte graphique AMD Radeon HD 8650G (533 - 720 MHz)64 Bit Prend en charge les instructions 64 Bit Architecture x86 Date de présentation 03/12/2013
Benchmarks Performance Rating - CB R15 + R20 + 7-Zip + X265 + Blender + 3DM11 CPU
17.6 pt (29%)
...
...
max:
Cinebench R20 - Cinebench R20 CPU (Single Core)
min: 154 moyenne: 162.5 médian: 162.5 (18%) maximum: 171 Points
...
...
max:
Cinebench R20 - Cinebench R20 CPU (Multi Core)
min: 428 moyenne: 434.5 médian: 434.5 (1%) maximum: 441 Points
...
...
max:
Cinebench R15 - Cinebench R15 CPU Multi 64 Bit
min: 198 moyenne: 207.2 médian: 209 (1%) maximum: 212 Points
...
AMD PRO A8-9600B
...
max:
0 15 30 45 60 75 90 105 120 135 150 165 180 195 210 Tooltip Pumori Test Platform (A10-5750M): Ø208 (206.6-212.11)
Cinebench R15 - Cinebench R15 CPU Single 64 Bit
min: 72 moyenne: 75.5 médian: 76 (22%) maximum: 78.6 Points
...
AMD A12-9720P
...
max:
Cinebench R11.5 - Cinebench R11.5 CPU Multi 64 Bit
min: 2.19 moyenne: 2.3 médian: 2.3 (3%) maximum: 2.32 Points
...
...
max:
Cinebench R11.5 - Cinebench R11.5 CPU Single 64 Bit
min: 0.81 moyenne: 0.8 médian: 0.9 (21%) maximum: 0.88 Points
...
AMD PRO A8-9600B
...
max:
Cinebench R10 - Cinebench R10 Rend. Single (32bit)
min: 2451 moyenne: 2549 médian: 2579 (16%) maximum: 2672 points
...
Intel Core 2 Duo T7700
...
max:
Cinebench R10 - Cinebench R10 Rend. Multi (32bit)
min: 6114 moyenne: 6418 médian: 6451 (5%) maximum: 6633 points
...
...
max:
Cinebench R10 - Cinebench R10 Rend. Multi (64bit)
min: 8603 moyenne: 8977 médian: 9015 (6%) maximum: 9342 Points
...
Intel Core i5-2415M
...
max:
Cinebench R10 - Cinebench R10 Rend. Single (64bit)
min: 3203 moyenne: 3447 médian: 3483 (4%) maximum: 3617 Points
...
Intel Core i3-380M
...
max:
wPrime 2.10 - wPrime 2.0 1024m *
min: 780 moyenne: 784 médian: 784 (9%) maximum: 788 s
...
AMD A8-3500M
Intel Atom x7-Z8750
...
VIA C3-M C3-M-1200
wPrime 2.10 - wPrime 2.0 32m *
min: 22.1 moyenne: 22.5 médian: 22.5 (5%) maximum: 22.9 s
...
AMD A6-3410MX
AMD A8-3520M
...
min: 1992 moyenne: 2035 médian: 2035 (3%) maximum: 2078 points
...
...
max:
7-Zip 18.03 - 7-Zip 18.03 Multli Thread 4 runs
min: 7475 moyenne: 7608 médian: 7608 (4%) maximum: 7741 MIPS
...
AMD Ryzen Embedded R1505G
...
max:
7-Zip 18.03 - 7-Zip 18.03 Single Thread 4 runs
min: 2948 moyenne: 2956 médian: 2955.5 (35%) maximum: 2963 MIPS
...
...
max:
X264 HD Benchmark 4.0 - x264 Pass 2
min: 15 moyenne: 15.1 médian: 15 (5%) maximum: 15.37 fps
...
...
max:
X264 HD Benchmark 4.0 - x264 Pass 1
min: 75.5 moyenne: 77.6 médian: 76 (18%) maximum: 81.2 fps
...
AMD A10-9620P
...
max:
HWBOT x265 Benchmark v2.2 - HWBOT x265 4k Preset
min: 1.26 moyenne: 1.7 médian: 1.7 (3%) maximum: 2.08 fps
...
Intel Core i5-8260U
...
max:
0 0.1 0.3 0.4 0.6 0.7 0.8 1 1.1 1.3 1.4 1.6 1.7 1.8 2 2.1 2.3 2.4 2.5 2.7 Tooltip Pumori Test Platform (A10-5750M): Ø1.486 (0.28-2.78)
Pumori Test Platform (A10-5750M): Ø1.679 (0.3-2.82)
TrueCrypt - TrueCrypt Serpent
min: 0.164 moyenne: 0.2 médian: 0.2 (5%) maximum: 0.171 GB/s
...
AMD A6-7310
...
max:
TrueCrypt - TrueCrypt Twofish
min: 0.297 moyenne: 0.3 médian: 0.3 (5%) maximum: 0.306 GB/s
...
AMD PRO A8-9600B
...
max:
TrueCrypt - TrueCrypt AES
1.5 GB/s (4%)
...
Intel Core i7-2640M
...
max:
Blender - Blender 2.79 BMW27 CPU *
2754 Seconds (19%)
...
...
R Benchmark 2.5 - R Benchmark 2.5 *
1.5 sec (33%)
...
...
3DMark 06 - CPU - 3DMark 06 - CPU
min: 2464 moyenne: 3070 médian: 3238 (7%) maximum: 3273 Points
...
AMD Phenom II X4 N970
...
max:
Super Pi mod 1.5 XS 1M - Super Pi mod 1.5 XS 1M *
min: 27.97 moyenne: 28.5 médian: 28.1 (6%) maximum: 29.67 s
...
AMD A6-7310
Intel Core Duo T2600
Intel Core 2 Duo T7250
...
VIA C3-M C3-M-1200
Super Pi mod 1.5 XS 2M - Super Pi mod 1.5 XS 2M *
min: 63.6 moyenne: 65 médian: 63.9 (3%) maximum: 68.8 s
...
Intel Core 2 Duo T7200
AMD A6-7310
Intel Core 2 Duo T5850
...
Super Pi Mod 1.5 XS 32M - Super Pi mod 1.5 XS 32M *
min: 1651 moyenne: 1693 médian: 1666.5 (7%) maximum: 1788 s
...
Intel Core 2 Duo T7100
Intel Core Duo T2600
AMD Turion II N530
Intel Atom x7-Z8750
Intel Core Duo T2500
AMD A4-3310MX
...
VIA C3-M C3-M-1200
SiSoft Sandra Dhrystone (MIPS) - SiSoft Sandra Dhrystone (MIPS)
min: 32320 moyenne: 33980 médian: 33980 (16%) maximum: 35640 MIPS
...
AMD Phenom II X4 N970
Intel Core i3-370M
...
SiSoft Sandra Whetstone (MFLOPS) - SiSoft Sandra Whetstone (MFLOPS)
min: 24800 moyenne: 24955 médian: 24955 (19%) maximum: 25110 MFLOPS
...
AMD Phenom II X4 N950
AMD Phenom II X4 N970
Intel Core i3-370M
Intel Core i3-380M
...
max:
Intel Core i7-3960X
3DMark Vantage - 3DM Vant. Perf. CPU no Physx
min: 5544 moyenne: 7097 médian: 7250 (6%) maximum: 7803 Points
...
Intel Core 2 Quad Q9100
Intel Core i3-370M
Intel Core i3-380M
AMD Phenom II X4 N970
...
max:
3DMark 11 - 3DM11 Performance Physics
min: 1445 moyenne: 2482 médian: 2658 (7%) maximum: 2790 Points
...
AMD A6-3410MX
AMD A10-9620P
...
max:
3DMark - 3DMark Ice Storm Physics
min: 13311 moyenne: 23944 médian: 25232 (21%) maximum: 28306 Points
...
AMD A10-9620P
...
max:
3DMark - 3DMark Ice Storm Extreme Physics
24996 Points (20%)
...
AMD A10-9620P
AMD A12-9720P
...
max:
3DMark - 3DMark Ice Storm Unlimited Physics
29277 Points (25%)
...
Intel Core i5-1038NG7
...
max:
3DMark - 3DMark Cloud Gate Physics
min: 1008 moyenne: 1952 médian: 2070 (5%) maximum: 2326 Points
...
AMD A4-7210
...
max:
3DMark - 3DMark Fire Strike Standard Physics
min: 1488 moyenne: 2785 médian: 2946 (5%) maximum: 3230 Points
...
...
max:
Geekbench 5.5 - Geekbench 5.1 - 5.5 64 Bit Single-Core
493 points (20%)
...
...
max:
Geekbench 5.5 - Geekbench 5.1 - 5.5 64 Bit Multi-Core
1326 points (2%)
...
AMD Ryzen Embedded R1505G
...
max:
Geekbench 5.0 - Geekbench 5.0 64 Bit Single-Core
495 points (2%)
...
Intel Core i5-8260U
AMD Ryzen Embedded R1505G
...
max:
Geekbench 5.0 - Geekbench 5.0 64 Bit Multi-Core
1320 points (4%)
...
AMD Ryzen Embedded R1505G
Intel Core i5-8260U
...
max:
Geekbench 4.4 - Geekbench 4.1 - 4.4 64 Bit Single-Core
2260 points (23%)
...
AMD PRO A8-9600B
AMD Ryzen Embedded R1505G
...
max:
Geekbench 4.4 - Geekbench 4.1 - 4.4 64 Bit Multi-Core
5292 points (6%)
...
AMD Ryzen Embedded R1505G
Intel Core i3-7100U
...
max:
Geekbench 4.0 - Geekbench 4.0 64 Bit Single-Core
2175 points (30%)
...
AMD PRO A8-9600B
Intel Core i3-7100U
...
Geekbench 4.0 - Geekbench 4.0 64 Bit Multi-Core
4963 points (12%)
...
AMD PRO A8-9600B
Intel Core i3-7100U
...
max:
AMD Ryzen 9 3900
Geekbench 3 - Geekbench 3 32 Bit Multi-Core
min: 4776 moyenne: 4787 médian: 4787 (8%) maximum: 4798 points
...
AMD PRO A8-9600B
...
max:
Geekbench 3 - Geekbench 3 32 Bit Single-Core
min: 1800 moyenne: 1816 médian: 1816 (35%) maximum: 1832 points
...
AMD PRO A8-9600B
...
Intel Core i5-1230U
Geekbench 2 - 32 Bit - Geekbench Stream
min: 3865 moyenne: 4282 médian: 4281.5 (35%) maximum: 4698 Points
...
AMD PRO A8-9600B
...
max:
Intel Core i7-7740X
Geekbench 2 - 32 Bit - Geekbench Memory
min: 3251 moyenne: 3354 médian: 3354 (30%) maximum: 3457 Points
...
AMD PRO A8-9600B
...
max:
Intel Core i7-7740X
Geekbench 2 - 32 Bit - Geekbench Floating Point
min: 4907 moyenne: 4926 médian: 4925.5 (10%) maximum: 4944 Points
...
AMD E2-7110
...
max:
Geekbench 2 - 32 Bit - Geekbench Integer
min: 5469 moyenne: 5484 médian: 5483.5 (11%) maximum: 5498 Points
...
AMD PRO A8-9600B
...
max:
Geekbench 2 - 32 Bit - Geekbench Total Score
min: 4691 moyenne: 4742 médian: 4741.5 (12%) maximum: 4792 Points
...
AMD PRO A8-9600B
...
max:
Mozilla Kraken 1.1 - Kraken 1.1 Total Score *
2402 ms (3%)
...
AMD A12-9720P
...
max:
WebXPRT 3 - WebXPRT 3 Score
80.1 Points (17%)
...
...
- Amplitude des valeurs obtenues dans le benchmark avec cette carte graphique
- Valeur moyenne obtenue dans le benchmark avec cette carte graphique
* Plus les chiffres sont petits, plus les performances sont élevées
v1.28
log 10. 12:02:47
#0 ran 0s before starting gpusingle class +0s ... 0s
#1 no ids found in url (should be separated by "_") +0s ... 0s
#2 not redirecting to Ajax server +0s ... 0s
#3 did not recreate cache, as it is less than 5 days old! Created at Tue, 10 Sep 2024 05:31:59 +0200 +0.001s ... 0.001s
#4 no comparison url found in template nbc.compare_page_2 needed +0.006s ... 0.007s
#5 no comparison url found in template nbc.compare_page_2 needed +0s ... 0.007s
#6 no comparison url found in template nbc.compare_page_2 needed +0s ... 0.007s
#7 no comparison url found in template nbc.compare_page_2 needed +0s ... 0.008s
#8 no comparison url found in template nbc.compare_page_2 needed +0s ... 0.008s
#9 no comparison url found in template nbc.compare_page_2 needed +0s ... 0.008s
#10 no comparison url found in template nbc.compare_page_2 needed +0s ... 0.008s
#11 no comparison url found in template nbc.compare_page_2 needed +0s ... 0.009s
#12 no comparison url found in template nbc.compare_page_2 needed +0s ... 0.009s
#13 no comparison url found in template nbc.compare_page_2 needed +0s ... 0.009s
#14 composed specs +0s ... 0.009s
#15 did output specs +0s ... 0.009s
#16 getting avg benchmarks for device 4154 +0.019s ... 0.029s
#17 got single benchmarks 4154 +0.025s ... 0.054s
#18 got avg benchmarks for devices +0s ... 0.054s
#19 min, max, avg, median took s +1.015s ... 1.069s
#20 no comparison url found in template nbc.compare_page_2 needed +0s ... 1.069s
#21 return log +0s ... 1.069s
Critiques du AMD A10-5750M processeur
Courte critique du PC portable HP Pavilion 17-e054sg Un quatre cœurs abordable. Un ordinateur plutôt bien équipé pour moins de 600 euros : voilà la promesse du Pavilion 17. Un processeur quad-core, et un double sy...
AMD A10-5750M | AMD Radeon HD 8650G + HD 8670M Dual Graphics | 17.30" | 2.9 kg
Mise à jour de la courte critique du PC portable Lenovo G505s-20255 Un potentiel énorme gâché. Un ordinateur portable multimédia abordable comprenant un APU quad-core, 16 Go de mémoire vive RAM et un système double carte graphiq...
AMD A10-5750M | AMD Radeon HD 8650G + HD 8570M Dual Graphics | 15.60" | 2.5 kg
Courte Critique du MSI GX70H-A108972811B Le problème du CPU. est-ce qu'une carte graphique haut-de-gamme peut souffrir d'un processeur trop lent? De nombreux joueurs devront se poser cette question en ...
AMD A10-5750M | AMD Radeon HD 8970M | 17.30" | 3.7 kg
MSI GX70 3CC-222XPL : AMD Radeon R9 M290X, 17.30", 3.9 kg
Autres tests » MSI GX70 3CC-222XPL
MSI GX60-3CC87FD : AMD Radeon R9 M290X, 15.60", 3.5 kg
Autres tests » MSI GX60-3CC87FD
HP Envy 15z : AMD Radeon HD 8650G, 15.60", 2.5 kg
Autres tests » HP Envy 15z
HP Pavilion 17-e054sg : AMD Radeon HD 8650G + HD 8670M Dual Graphics, 17.30", 2.9 kg
Autres tests » HP Pavilion 17-e054sg
Lenovo G505s-20255 : AMD Radeon HD 8650G + HD 8570M Dual Graphics, 15.60", 2.5 kg
Autres tests » Lenovo G505s-20255
HP Envy 15-J012LA : AMD Radeon HD 8730M, 15.60", 2.1 kg
Autres tests » HP Envy 15-J012LA
MSI GX60-3AE-216US : AMD Radeon HD 7970M, 15.60", 3.5 kg
Autres tests » MSI GX60-3AE-216US
MSI GX70H-A108972811B : AMD Radeon HD 8970M, 17.30", 3.7 kg
Autres tests » MSI GX70H-A108972811B
MSI GX70-3BE-007US : AMD Radeon HD 8970M, 17.30", 3.9 kg
Autres tests » MSI GX70-3BE-007US
Please share our article, every link counts!
Les autres processeurs de la gamme A-Series » AMD A8-7410 4x 2.2 GHz - 2.5 GHz
» AMD A8-3550MX 4x 2 GHz - 2.7 GHz
» AMD A6-7310 4x 2 GHz - 2.4 GHz
» AMD A8-3530MX 4x 1.9 GHz - 2.6 GHz
» AMD A8-3510MX 4x 1.8 GHz - 2.5 GHz
» AMD A4-7210 4x 1.8 GHz - 2.2 GHz
» AMD A6-3430MX 4x 1.7 GHz - 2.4 GHz
» AMD A8-3520M 4x 1.6 GHz - 2.5 GHz
» AMD A6-3410MX 4x 1.6 GHz - 2.3 GHz
» AMD A8-3500M 4x 1.5 GHz - 2.4 GHz
» AMD A6-3420M 4x 1.5 GHz - 2.4 GHz
» AMD A6-3400M 4x 1.4 GHz - 2.3 GHz
» AMD A4-3330MX 2x 2.2 GHz - 2.6 GHz
» AMD A4-5050 4x 1.55 GHz
» AMD A4-3310MX 2x 2.1 GHz - 2.5 GHz
» AMD A4-3320M 2x 2 GHz - 2.6 GHz
Processeurs similaires - AMD Phenom II X2 X640 BE 2x 3.2 GHz
Klaus Hinum (Update: 2013-06-17)