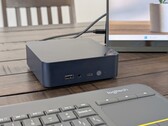
Notebookcheck Logo

Intel Processor N150

Intel Processor N150

Le processeur Intel N150 est le processeur mobile le plus lent de la famille Twin Lake. Twin Lake est en grande partie identique à Alder Lake-N, une architecture qui aura 4 ans au second semestre 2025. Le N150 est destiné aux ordinateurs portables d'entrée de gamme, aux tablettes et aux mini-PC sans ventilateur ; il offre 4 cœurs Efficient (Gracemont) qui tournent jusqu'à 3,6 GHz, mais pas de cœurs Performance. Par rapport au N250, le N150 dispose d'un iGPU nettement plus lent et d'une vitesse d'horloge du CPU légèrement inférieure.

Les cœurs Gracemont E ne supportent pas l'Hyper-Threading. Pas de threads supplémentaires ici.

Performances

Ses performances multithread devraient être à peu près aussi bonnes que celles des anciens processeurs double cœur comme le Core i3-10110U. Les chiffres exacts dépendent de la solution de refroidissement et du TDP du système. Quoi qu'il en soit, il s'agit d'une puce assez lente qui est tout juste assez rapide pour les tâches de base.

Graphique

Le SoC est équipé d'une unité graphique Unité graphique à architecture Xe avec 24 unités d'exécution (EU) fonctionnant à une fréquence maximale de 1,0 GHz. L'iGPU peut piloter jusqu'à 3 moniteurs UHD 2160p et décode matériellement AV1 parmi d'autres codecs vidéo populaires. En raison du faible nombre de cœurs Xe et de la limitation de la mémoire vive à un seul canal, les performances de jeu ne sont suffisantes que pour les jeux très anciens et les faibles résolutions telles que XGA 1024 x 768.

Architecture et caractéristiques

Le contrôleur de mémoire intégré prend en charge la RAM DDR4-3200, DDR5-4800 et LPDDR5-4800 à canal unique. Les vitesses des disques SSD PCIe NVMe sont plafonnées à 3,9 Go/s, ce qui correspond à la spécification PCIe 3. Il n'y a pas de support Thunderbolt / USB 4 ici, cependant, les derniers modules de réseau sans fil Intel CNVi Wi-Fi 7 sont pris en charge.

Son cache L3 est relativement petit (6 Mo) et il n'a pas de véritable NPU (et donc pas de marque Copilot+).

Consommation électrique

Le N150 est censé consommer 6 watts lorsqu'il est soumis à une charge importante. C'est le PL1 recommandé par Intel pour la puce. Aucune donnée sur le PL2 n'a été fournie, mais des valeurs supérieures à 15 W sont peu probables.

Le SoC est fabriqué à l'aide du processus 10 nm de deuxième génération commercialisé sous le nom d'Intel 7, ce qui signifie que l'efficacité énergétique n'est pas très bonne comparée au dernier silicium 3 nm des entreprises telles que Apple.

Nom de codeTwin Lake
GammeIntel Alder Lake-N

Gamme: Alder Lake-N Twin Lake

Intel Core 3 N3553 - 3.9 GHz8 / 8 cores6 MB L3
Intel Core 3 N350 - 3.9 GHz8 / 8 cores6 MB L3
Intel Processor N250 - 3.8 GHz4 / 4 cores6 MB L3
Intel Processor N150 « - 3.6 GHz4 / 4 cores6 MB L3
Fréquence <=3600 MHz
Cache de Niveau 3 (L3)6 MB
Nombres de cœurs/threads simultanés supportés4 / 4
4 x 3.6 GHz Intel Gracemont E-Core
Consommation énergétique maximale (TDP)6 Watt(s)
Lithographie (procédé de fabrication)10 nm
SocketBGA1264
FonctionnalitésDDR4-3200/DDR5-4800/LPDDR5-4800 RAM (sin. chan.), PCIe 3, GNA, MMX, SSE, SSE2, SSE3, SSSE3, SSE4.1, SSE4.2, AVX, AVX2, BMI2, ABM, FMA, ADX, VMX, SMEP, SMAP, EIST, TM1, TM2, Turbo, SST, AES-NI, RDRAND, RDSEED, SHA
Carte graphiqueIntel UHD Graphics 24EUs (Alder Lake-N) ( - 1000 MHz)
64 BitPrend en charge les instructions 64 Bit
Architecturex86
Date de présentation01/06/2025
Lien redirigeant vers une page externe du produitwww.intel.com

Benchmarks

Performance Rating - CB R15 + R20 + 7-Zip + X265 + Blender + 3DM11 CPU
25 pt (42%)
2.31 -91%
...
24.3 -3%
24.4 -2%
24.4 -2%
24.5 -2%
24.6 -2%
24.7 -1%
24.8 -1%
24.8 -1%
24.8 -1%
Intel Processor N150
25
25.1 0%
25.4 2%
25.7 3%
25.7 3%
25.8 3%
25.9 4%
26 4%
Intel Core i5-8265U
26.4 6%
Intel Core i7-7700HQ
26.5 6%
...
AMD Ryzen 9 9955HX
50 100%
max:
60.1 140%
0%
100%
Restrict / Search: Model: Max. age: years
Cinebench 2024 - Cinebench 2024 CPU Single Core
min: 53     moyenne: 58.2     médian: 60.4 (34%)     maximum: 61.3 Points
Cinebench 2024 - Cinebench 2024 CPU Multi Core
min: 130     moyenne: 154.8     médian: 155.5 (3%)     maximum: 178.9 Points
Cinebench R23 - Cinebench R23 Multi Core
min: 2016     moyenne: 2399     médian: 2428 (2%)     maximum: 2753 Points
Restrict / Search: Model: Max. age: years
Cinebench R23 - Cinebench R23 Single Core
min: 828     moyenne: 907     médian: 943 (40%)     maximum: 949 Points
74.4 -92%
...
863 -5%
874 -4%
875 -4%
877 -3%
885 -2%
886 -2%
886 -2%
AMD Ryzen Embedded R1606G
888 -2%
906 0%
Intel Processor N150
907
971 7%
973 7%
974 7%
976 8%
977 8%
983 8%
988 9%
1003 11%
Intel Core i5-8265U
1008 11%
...
2270 150%
max:
Intel Core Ultra 9 285K
2348 159%
0%
100%
Restrict / Search: Model: Max. age: years
Cinebench R20 - Cinebench R20 CPU (Single Core)
min: 313     moyenne: 344.7     médian: 359 (40%)     maximum: 362 Points
Cinebench R20 - Cinebench R20 CPU (Multi Core)
min: 768     moyenne: 917     médian: 933 (2%)     maximum: 1051 Points
Cinebench R15 - Cinebench R15 CPU Multi 64 Bit
min: 313     moyenne: 390     médian: 402 (3%)     maximum: 455 Points
Restrict / Search: Model: Max. age: years
0255075100125150175200225250275300325350375400425450Tooltip
Cinebench R15 - Cinebench R15 CPU Single 64 Bit
min: 134     moyenne: 148.2     médian: 154.3 (43%)     maximum: 156.4 Points
19 -87%
...
143.6 -3%
143.8 -3%
143.9 -3%
145 -2%
146.8 -1%
147.1 -1%
Intel Core i3-8145U
147.5 0%
147.6 0%
147.8 0%
Intel Processor N150
148.2
149 1%
150 1%
152 3%
152 3%
152.9 3%
153 3%
153.5 4%
153.9 4%
Intel Core i5-8265U
155 5%
...
AMD Ryzen 9 9955HX
336.5 127%
max:
Intel Core Ultra 9 285K
355.5 140%
0%
100%
Restrict / Search: Model: Max. age: years
Cinebench R11.5 - Cinebench R11.5 CPU Multi 64 Bit
4.3 Points (6%)
Cinebench R11.5 - Cinebench R11.5 CPU Single 64 Bit
1.7 Points (40%)
Cinebench R10 - Cinebench R10 Rend. Single (32bit)
4743 points (29%)
Cinebench R10 - Cinebench R10 Rend. Multi (32bit)
11375 points (8%)
Cinebench R10 - Cinebench R10 Rend. Multi (64bit)
17063 Points (11%)
Cinebench R10 - Cinebench R10 Rend. Single (64bit)
7251 Points (9%)
wPrime 2.10 - wPrime 2.0 1024m *
1022 s (12%)
wPrime 2.10 - wPrime 2.0 32m *
30.7 s (6%)
WinRAR - WinRAR 4.0
1901 points (3%)
7-Zip 18.03 - 7-Zip 18.03 Multi Thread 4 runs
min: 9639     moyenne: 11044     médian: 11171 (6%)     maximum: 12321 MIPS
7-Zip 18.03 - 7-Zip 18.03 Single Thread 4 runs
min: 3590     moyenne: 3785     médian: 3859 (45%)     maximum: 3906 MIPS
X264 HD Benchmark 4.0 - x264 Pass 2
24.4 fps (8%)
X264 HD Benchmark 4.0 - x264 Pass 1
119.8 fps (28%)
HWBOT x265 Benchmark v2.2 - HWBOT x265 4k Preset
min: 2.43     moyenne: 2.8     médian: 2.8 (5%)     maximum: 3.21 fps
012345Tooltip
TrueCrypt - TrueCrypt Serpent
0.2 GB/s (6%)
TrueCrypt - TrueCrypt Twofish
0.4 GB/s (7%)
TrueCrypt - TrueCrypt AES
2 GB/s (5%)
Blender - Blender 3.3 Classroom CPU *
min: 2125     moyenne: 2420     médian: 2429 (31%)     maximum: 2707 Seconds
Blender - Blender 2.79 BMW27 CPU *
min: 1094     moyenne: 1234     médian: 1233 (9%)     maximum: 1374 Seconds
R Benchmark 2.5 - R Benchmark 2.5 *
min: 0.846     moyenne: 0.9     médian: 0.9 (19%)     maximum: 0.957 sec
Super Pi mod 1.5 XS 1M - Super Pi mod 1.5 XS 1M *
19.3 s (4%)
Super Pi mod 1.5 XS 2M - Super Pi mod 1.5 XS 2M *
40.8 s (2%)
3DMark 11 - 3DM11 Performance Physics
min: 4416     moyenne: 5083     médian: 5024 (13%)     maximum: 5810 Points
3DMark - 3DMark Ice Storm Physics
37351 Points (30%)
3DMark - 3DMark Ice Storm Extreme Physics
36745 Points (30%)
3DMark - 3DMark Ice Storm Unlimited Physics
43172 Points (36%)
3DMark - 3DMark Cloud Gate Physics
min: 3612     moyenne: 3888     médian: 3956 (10%)     maximum: 4097 Points
3DMark - 3DMark Fire Strike Standard Physics
min: 5201     moyenne: 5660     médian: 5776 (10%)     maximum: 6003 Points
3DMark - 3DMark Time Spy CPU
min: 1704     moyenne: 1886     médian: 1887 (8%)     maximum: 2068 Points
Geekbench 6.4 - Geekbench 6.4 Single-Core
min: 1129     moyenne: 1211     médian: 1249 (31%)     maximum: 1255 points
Geekbench 6.4 - Geekbench 6.4 Multi-Core
min: 2369     moyenne: 2814     médian: 2980 (12%)     maximum: 3093 points
533 -81%
...
Intel Celeron 7305
1598 -43%
1660 -41%
2024 -28%
2095 -26%
Qualcomm Snapdragon 7c+ Gen 3
2244 -20%
2291 -19%
2565 -9%
2786 -1%
2803 0%
Intel Processor N150
2814
2900 3%
2937 4%
2958 5%
3165 12%
3181 13%
3324 18%
4090 45%
4369 55%
4587 63%
...
25760 815%
0%
100%
Restrict / Search: Model: Max. age: years
Geekbench 6.0 - Geekbench 6.0 Single-Core
3105 points (99%)
Geekbench 6.0 - Geekbench 6.0 Multi-Core
21003 points (86%)
Geekbench 5.5 - Geekbench 5.1 - 5.5 64 Bit Single-Core
min: 924     moyenne: 978     médian: 991 (39%)     maximum: 1020 points
Geekbench 5.5 - Geekbench 5.1 - 5.5 64 Bit Multi-Core
min: 2072     moyenne: 2439     médian: 2579 (5%)     maximum: 2667 points
Geekbench 5.0 - Geekbench 5.0 64 Bit Single-Core
907 points (4%)
Geekbench 5.0 - Geekbench 5.0 64 Bit Multi-Core
2079 points (7%)
Geekbench 4.4 - Geekbench 4.1 - 4.4 64 Bit Single-Core
4527 points (45%)
Geekbench 4.4 - Geekbench 4.1 - 4.4 64 Bit Multi-Core
8942 points (9%)
Mozilla Kraken 1.1 - Kraken 1.1 Total Score *
min: 1044     moyenne: 1092     médian: 1047 (1%)     maximum: 1186 ms
WebXPRT 4 - WebXPRT 4 Score
min: 118.3     moyenne: 126.8     médian: 126.8 (35%)     maximum: 135.3 Points
WebXPRT 3 - WebXPRT 3 Score
min: 145.3     moyenne: 164     médian: 172.3 (31%)     maximum: 174.3 Points
CrossMark - CrossMark Overall
min: 710     moyenne: 727     médian: 715 (27%)     maximum: 756 Points
Power Consumption - Prime95 Power Consumption - external Monitor *
min: 21.6     moyenne: 23.4     médian: 23.4 (4%)     maximum: 25.2 Watt
051015202530Tooltip
Power Consumption - Cinebench R15 Multi Power Consumption - external Monitor *
min: 20.1     moyenne: 22.5     médian: 23.4 (4%)     maximum: 24.1 Watt
0510152025Tooltip
Power Consumption - Idle Power Consumption - external Monitor *
min: 7.51     moyenne: 10.2     médian: 8.9 (6%)     maximum: 14.3 Watt
0123456789101112131415161718Tooltip
Power Consumption - Power Efficiency - Cinebench R15 Multi external Monitor
min: 13     moyenne: 16.5     médian: 16.5 (12%)     maximum: 20 Points per Watt
- Amplitude des valeurs obtenues dans le benchmark avec cette carte graphique
red legend - Valeur moyenne obtenue dans le benchmark avec cette carte graphique
* Plus les chiffres sont petits, plus les performances sont élevées

v1.33
log 28. 18:25:34

#0 ran 0s before starting gpusingle class +0s ... 0s

#1 no ids found in url (should be separated by "_") +0s ... 0s

#2 not redirecting to Ajax server +0s ... 0s

#3 did not recreate cache, as it is less than 5 days old! Created at Mon, 28 Apr 2025 05:29:55 +0200 +0.001s ... 0.001s

#4 no comparison url found in template nbc.compare_page_2 needed +0.007s ... 0.008s

#5 no comparison url found in template nbc.compare_page_2 needed +0s ... 0.008s

#6 no comparison url found in template nbc.compare_page_2 needed +0s ... 0.008s

#7 composed specs +0s ... 0.009s

#8 did output specs +0s ... 0.009s

#9 getting avg benchmarks for device 18713 +0.014s ... 0.023s

#10 got single benchmarks 18713 +0.011s ... 0.034s

#11 got avg benchmarks for devices +0s ... 0.034s

#12 min, max, avg, median took s +0.861s ... 0.894s

#13 no comparison url found in template nbc.compare_page_2 needed +0s ... 0.895s

#14 return log +0s ... 0.895s

Please share our article, every link counts!
Mail Logo

» Comparaison des processeurs pour ordinateur portable
Comparaison de tout les processeurs mobiles


» Processeurs mobiles - liste des benchmarks
Liste des benchmarks de l'intégralité des processeurs pour portables


Les autres processeurs de la gamme Alder Lake-N

» Intel Core 3 N355
   8x 3 GHz - 3.9 GHz
» Intel Core 3 N350
   8x - 3.9 GHz
» Intel Core i3-N305
   8x 1.8 GHz - 3.8 GHz
» Intel Core i3-N300
   8x - 3.8 GHz
» Intel Processor N250
   4x - 3.8 GHz
» Intel Processor N200
   4x 1 GHz - 3.7 GHz
» Intel Processor N97
   4x - 3.6 GHz
» Intel Processor N150
   4x - 3.6 GHz
» Intel Processor N95
   4x - 3.4 GHz
» Intel Processor N100
   4x 1 GHz - 3.4 GHz
» Intel Processor N50
   2x 1 GHz - 3.4 GHz

Processeurs similaires

+ AMD Ryzen 3 3300U
   4x 2.1 GHz - 3.5 GHz
+ AMD Ryzen 3 PRO 3300U
   4x 2.1 GHz - 3.5 GHz
+ AMD Ryzen 3 2300U
   4x 2 GHz - 3.4 GHz
+ AMD Ryzen 3 PRO 2300U
   4x 2 GHz - 3.4 GHz
+ Intel Processor N97
   4x - 3.6 GHz
» Intel Processor N150
   4x - 3.6 GHz
- Intel Processor N95
   4x - 3.4 GHz
- Intel Processor N100
   4x 1 GHz - 3.4 GHz
- Intel Core i7-7500U
   2x 2.7 GHz - 3.5 GHz
- Intel Core i5-5350H
   2x 3 GHz - 3.5 GHz
- Intel Core i5-7300U
   2x 2.6 GHz - 3.5 GHz
Klaus Hinum (Update: 2025-01-23)