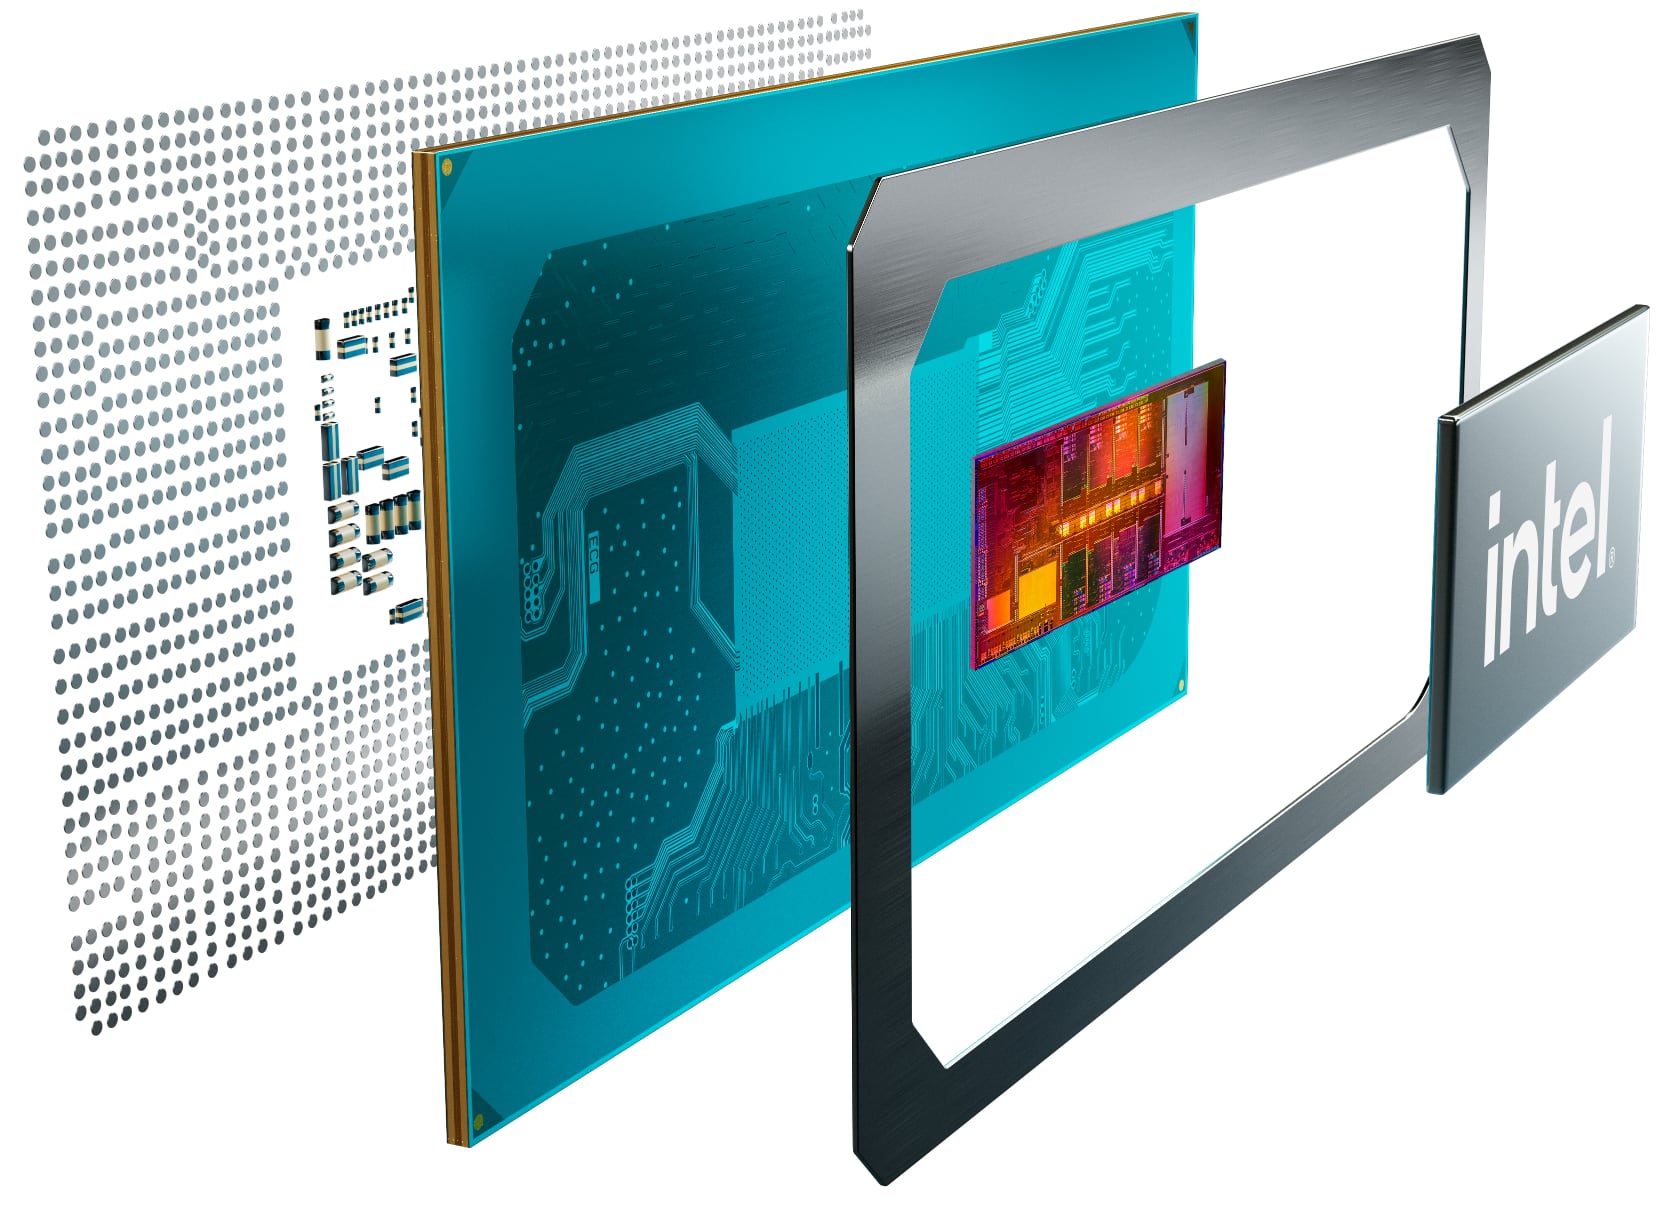
Critiques du Intel Core i9-11900H processeur
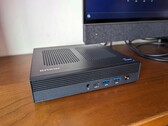
Test du GMK NucBox M4 : mini PC avec un Core i9 de 11e génération à moins de 500 €
Les utilisateurs à la recherche d'un mini PC Core i9 trouveront dans la NucBox M4 une option compétente. Cependant, à près de trois ans, le processeur de 11e gé...
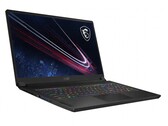
Intel Core i9-11900H | Intel UHD Graphics Xe 32EUs (Tiger Lake-H) | | 951 gTest de l'ordinateur portable de jeu MSI GS76 Stealth 11UH : La minceur sacrifie les performances du GPU
Le MSI GS76 Stealth est l'un des ordinateurs portables de jeu les plus minces du marché. Malgré sa finesse, MSI a placé une RTX 3080 GeForce sous le capot du mo...
Intel Core i9-11900H | NVIDIA GeForce RTX 3080 Laptop GPU | 17.30" | 2.4 kgTest de l'Asus ROG Zephyrus S17 : le PC de jeu qui s'ouvre pour plus d'air frais, gadget ou bonne idée ?
Les ordinateurs portables disposent de peu d'espace pour refroidir de manière adéquate les matériels puissants. Asus s'est probablement demandé "pourquoi ne pas...
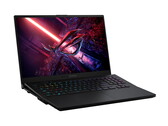
Intel Core i9-11900H | NVIDIA GeForce RTX 3080 Laptop GPU | 17.30" | 2.8 kgTest de l'Asus ROG Zephyrus M16 : le jeu en 16:10
L'Asus ROG Zephyrus M16 n'est pas un simple ordinateur portable de jeu haut de gamme. L'écran WQXGA 16:10 et les très bons haut-parleurs distinguent le portable...
Intel Core i9-11900H | NVIDIA GeForce RTX 3070 Laptop GPU | 16.00" | 2 kgTest de l'Asus TUF Gaming F17 : bon appareil de jeu RTX 3060, mais écran moyen malgré les 144 Hz
Avec le TUF A17, la série a été révisée l'année dernière, et le nouveau boîtier embarque désormais un Intel Core i9 et une RTX 3060 au lieu d'un CPU AMD et d'un...
Intel Core i9-11900H | NVIDIA GeForce RTX 3060 Laptop GPU | 17.30" | 2.7 kgAsus Vivobook Pro 15 K6502, i9-11900H RTX 3050: NVIDIA GeForce RTX 3050 4GB Laptop GPU, 15.60", 1.8 kg
Autres tests » Asus Vivobook Pro 15 K6502, i9-11900H RTX 3050
Asus Vivobook Pro 16 K6602HC, i9-11900H RTX 3050: NVIDIA GeForce RTX 3050 4GB Laptop GPU, 16.00", 1.9 kg
Autres tests » Asus Vivobook Pro 16 K6602HC, i9-11900H RTX 3050
HP Omen 17-ck0196ng: NVIDIA GeForce RTX 3080 Laptop GPU, 17.30", 2.8 kg
Autres tests » HP Omen 17-ck0196ng
Alienware x15 R1, i9-11900H RTX 3070: NVIDIA GeForce RTX 3070 Laptop GPU, 15.60", 2.4 kg
Autres tests » Alienware x15 R1, i9-11900H RTX 3070
Acer Predator Helios 300 PH315-54-94U7: NVIDIA GeForce RTX 3070 Laptop GPU, 15.60", 2.3 kg
Autres tests » Acer Predator Helios 300 PH315-54-94U7
Acer Predator Helios 300 PH315-54-NH.QC1SN.003: NVIDIA GeForce RTX 3070 Laptop GPU, 15.60", 2.2 kg
Autres tests » Acer Predator Helios 300 PH315-54-NH.QC1SN.003
Asus ROG Zephyrus S17 GX703HS-KF004R: NVIDIA GeForce RTX 3080 Laptop GPU, 17.30", 2.6 kg
Autres tests » Asus ROG Zephyrus S17 GX703HS-KF004R
Alienware m15 R6 9GYW5: NVIDIA GeForce RTX 3070 Laptop GPU, 15.60", 2.7 kg
Autres tests » Alienware m15 R6 9GYW5
MSI WS66 11UMT-220US: NVIDIA RTX A5000 Laptop GPU, 15.60", 2.1 kg
Autres tests » MSI WS66 11UMT-220US
MSI GS76 Stealth 11UG-232: NVIDIA GeForce RTX 3070 Laptop GPU, 17.30", 2.5 kg
Autres tests » MSI GS76 Stealth 11UG-232
Razer Blade 17 RZ09-0406CG63-R3G1: NVIDIA GeForce RTX 3080 Laptop GPU, 17.30", 2.8 kg
Autres tests » Razer Blade 17 RZ09-0406CG63-R3G1
MSI GS66 Stealth 11UH-045: NVIDIA GeForce RTX 3080 Laptop GPU, 15.60", 2.1 kg
Autres tests » MSI GS66 Stealth 11UH-045
Dell XPS 15 9510, 11900H RTX 3050 Ti OLED: NVIDIA GeForce RTX 3050 Ti Laptop GPU, 15.60", 2 kg
Autres tests » Dell XPS 15 9510, 11900H RTX 3050 Ti OLED
Razer Blade 15 Advanced RZ09-0409CG53-R3G1: NVIDIA GeForce RTX 3080 Laptop GPU, 15.60", 2 kg
Autres tests » Razer Blade 15 Advanced RZ09-0409CG53-R3G1
Dell XPS 17 9710, i9-11900H RTX 3060 4K: NVIDIA GeForce RTX 3060 Laptop GPU, 17.30", 2.5 kg
Autres tests » Dell XPS 17 9710, i9-11900H RTX 3060 4K
Asus TUF Gaming F17 FX706HM: NVIDIA GeForce RTX 3060 Laptop GPU, 17.30", 2.7 kg
Autres tests » Asus TUF Gaming F17 FX706HM
MSI GS76 Stealth 11UH: NVIDIA GeForce RTX 3080 Laptop GPU, 17.30", 2.4 kg
Autres tests » MSI GS76 Stealth 11UH
MSI Creator Z16 A11UET-076NEU: NVIDIA GeForce RTX 3060 Laptop GPU, 15.60", 2.2 kg
Autres tests » MSI Creator Z16 A11UET-076NEU
Asus TUF Gaming F15 FX566HM-HN097TS: NVIDIA GeForce RTX 3060 Laptop GPU, 15.60", 2.3 kg
Autres tests » Asus TUF Gaming F15 FX566HM-HN097TS
Asus ROG Zephyrus M16 GU603HM-211.ZM16: NVIDIA GeForce RTX 3060 Laptop GPU, 16.00", 1.9 kg
Autres tests » Asus ROG Zephyrus M16 GU603HM-211.ZM16
Acer Predator Triton 500 PT516-51s-9914: NVIDIA GeForce RTX 3080 Laptop GPU, 16.10", 2.5 kg
Autres tests » Acer Predator Triton 500 PT516-51s-9914
Alienware x15 R1, i9-11900H RTX 3080 FHD: NVIDIA GeForce RTX 3080, 15.60", 2.3 kg
Autres tests » Alienware x15 R1, i9-11900H RTX 3080 FHD
Asus ROG Zephyrus S17 GX703HSD: NVIDIA GeForce RTX 3080 Laptop GPU, 17.30", 2.8 kg
Autres tests » Asus ROG Zephyrus S17 GX703HSD
Asus ROG Zephyrus M16 GU603H: NVIDIA GeForce RTX 3070 Laptop GPU, 16.00", 2 kg
Autres tests » Asus ROG Zephyrus M16 GU603H
 Deutsch
 English
 Español
 Français
 Italiano
 Nederlands
 Polski
 Português
 Русский
 Türkçe
 Svenska
 Chinese
 Magyar