Critiques du Intel Core i5-11300H processeur
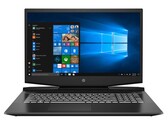
Test du HP Pavilion Gaming 17 : PC portable de jeu avec un bon écran et abordable
Alors que la plupart des ordinateurs portables de jeu dont le prix est inférieur à 1 000 euros (~$1 002) présentent des faiblesses significatives en matière de qualité d'image (mot-clé : espace colorimétrique), HP affirme que le Pavilion Gaming 17-cd2146ng offre une couverture sRGB de 100 %. Nous avons mis le 17 pouces à l'épreuve.
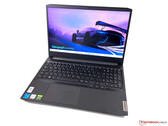
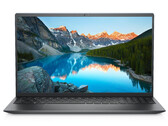
Intel Core i5-11300H, NVIDIA GeForce RTX 3050 Ti Laptop GPU, 17.3", 2.8 kgTest du Lenovo IdeaPad Gaming 3i 15 G6 : PC portable de jeu à petit prix et écran médiocre
L'IdeaPad Gaming 3i 15 de Lenovo est un ordinateur portable de jeu abordable de sixième génération. Notre unité d'examen, dont le prix avoisine les 900 dollars, associe un processeur Intel Tiger Lake H35 à une RTX 3050 Ti 90 W GeForce - une combinaison idéale pour les jeux FHD.
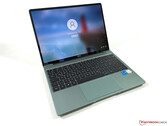
Intel Core i5-11300H, NVIDIA GeForce RTX 3050 Ti Laptop GPU, 15.6", 2 kgTest du Huawei MateBook 13s : un excellent PC portable avec écran 90 Hz
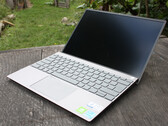
Le MateBook 13s de Huawei est un subnotebook très compact doté d'un écran haute résolution de 13 pouces et d'un processeur moderne Tiger Lake-H35 d'Intel. Combiné avec des périphériques d'entrée décents et de bons haut-parleurs, le MateBook 13s s'avère être un ensemble très intéressant.
Intel Core i5-11300H, Iris Xe G7 80EUs, 13.4", 1.3 kgTest du Dell Inspiron 15 5518 : un processeur bridé
L'Inspiron 15 5518 offre un processeur Core i5-11300H, un GPU GeForce-MX450 et 8 Go de mémoire de travail. Cette dernière fonctionne en mode monocanal. Positif : L'ordinateur portable offre une très bonne autonomie de batterie et propose un espace pour deux disques SSD NVMe.
Intel Core i5-11300H, NVIDIA GeForce MX450, 15.6", 1.8 kgTest du Dell Inspiron 13 5310 : plus de graphismes, plus d'autonomie
L'Inspiron 13 5310 de 13 pouces de Dell combine tout ce que votre cœur désire : Un puissant processeur Intel-H de 35 watts, une carte graphique dédiée, un écran mat sRGB en résolution Full HD et deux ports Thunderbolt 4, sans oublier une grande batterie de 56 Wh. Qu'est-ce qui pourrait bien ne pas aller avec ça ?
Intel Core i5-11300H, NVIDIA GeForce MX450, 13.3", 1.3 kgLenovo IdeaPad 5 Pro 16IHU6: NVIDIA GeForce MX450, 16.00", 1.9 kg
Critique » Test du Lenovo IdeaPad 5 Pro 16IHU6 : PC portable polyvalent de 16 pouces avec une bonne autonomie
Acer Nitro 5 AN517-53-54DQ: NVIDIA GeForce RTX 3050 4GB Laptop GPU, 17.30", 2.6 kg
Critique » Test de l'Acer Nitro 5 AN517-53 : un PC portable de jeu abordable avec RTX 3050
Dell Inspiron 14 5410, i5-11300H: Intel Iris Xe Graphics G7 80EUs, 14.00", 1.4 kg
Autres tests » Dell Inspiron 14 5410, i5-11300H
Asus Vivobook 15 F1605PA: Intel Iris Xe Graphics G7 80EUs, 16.00", 1.9 kg
Autres tests » Asus Vivobook 15 F1605PA
Asus Vivobook Pro 15 K3500PC-L1293: NVIDIA GeForce RTX 3050 4GB Laptop GPU, 15.60", 1.7 kg
Autres tests » Asus Vivobook Pro 15 K3500PC-L1293
Lenovo Yoga Slim 7 Pro 14IHU5-82NH0048GE: Intel Iris Xe Graphics G7 80EUs, 14.00", 1.4 kg
Autres tests » Lenovo Yoga Slim 7 Pro 14IHU5-82NH0048GE
Acer Swift 3 SF316-51-57D7: Intel Iris Xe Graphics G7 80EUs, 16.10", 1.8 kg
Autres tests » Acer Swift 3 SF316-51-57D7
Microsoft Surface Laptop Studio i5-11300H: Intel Iris Xe Graphics G7 80EUs, 14.40", 1.7 kg
Autres tests » Microsoft Surface Laptop Studio i5-11300H
Xiaomi Mi Notebook Ultra 2021 i5: Intel Iris Xe Graphics G7 80EUs, 15.60", 1.7 kg
Autres tests » Xiaomi Mi Notebook Ultra 2021 i5
Acer Nitro 5 AN515-56-54DF: NVIDIA GeForce GTX 1650 Mobile, 15.60", 2.3 kg
Autres tests » Acer Nitro 5 AN515-56-54DF
Acer Nitro 5 AN515-56-51V8: NVIDIA GeForce GTX 1650 Mobile, 15.60", 2.3 kg
Autres tests » Acer Nitro 5 AN515-56-51V8
Lenovo IdeaPad Gaming 3 15IHU6-82K100QHGE: NVIDIA GeForce RTX 3050 4GB Laptop GPU, 15.60", 2.3 kg
Autres tests » Lenovo IdeaPad Gaming 3 15IHU6-82K100QHGE
Asus Vivobook Pro 14 K3400PA-WH51: Intel Iris Xe Graphics G7 80EUs, 14.00", 1.4 kg
Autres tests » Asus Vivobook Pro 14 K3400PA-WH51
Asus Vivobook Pro 16X N7600PC-L2012R: NVIDIA GeForce RTX 3050 4GB Laptop GPU, 16.10", 2 kg
Autres tests » Asus Vivobook Pro 16X N7600PC-L2012R
Asus Vivobook Pro 14 K3400, i5-11300H GTX 1650: NVIDIA GeForce GTX 1650 Mobile, 14.00", 1.4 kg
Autres tests » Asus Vivobook Pro 14 K3400, i5-11300H GTX 1650
HP Pavilion Gaming 15-dk2002TX: NVIDIA GeForce RTX 3050 4GB Laptop GPU, 15.60", 2.2 kg
Autres tests » HP Pavilion Gaming 15-dk2002TX
Asus VivoBook Pro 14X N7400, i5-11300H RTX 3050: NVIDIA GeForce RTX 3050 4GB Laptop GPU, 14.00", 1.5 kg
Autres tests » Asus VivoBook Pro 14X N7400, i5-11300H RTX 3050
Asus VivoBook Pro 15 K3500PC-L1009T: NVIDIA GeForce RTX 3050 4GB Laptop GPU, 15.60", 1.7 kg
Autres tests » Asus VivoBook Pro 15 K3500PC-L1009T
Lenovo IdeaPad Gaming 3 15IHU6-82K1002QGE: NVIDIA GeForce RTX 3050 4GB Laptop GPU, 15.60", 2.3 kg
Autres tests » Lenovo IdeaPad Gaming 3 15IHU6-82K1002QGE
Huawei MateBook 14s i5: Intel Iris Xe Graphics G7 80EUs, 14.20", 1.4 kg
Autres tests » Huawei MateBook 14s i5
Xiaomi RedmiBook Pro 15, i5-11300H iGPU: Intel Iris Xe Graphics G7 80EUs, 15.60", 1.7 kg
Autres tests » Xiaomi RedmiBook Pro 15, i5-11300H iGPU
Acer Swift 3 SF316-51-51BS: Intel Iris Xe Graphics G7 80EUs, 16.10", 1.8 kg
Autres tests » Acer Swift 3 SF316-51-51BS
Acer Nitro 5 AN515-56-58CQ: NVIDIA GeForce GTX 1650 Mobile, 15.60", 2.3 kg
Autres tests » Acer Nitro 5 AN515-56-58CQ
Xiaomi Mi Notebook Pro 15, i5-11300H MX450: NVIDIA GeForce MX450, 15.60", 1.8 kg
Autres tests » Xiaomi Mi Notebook Pro 15, i5-11300H MX450
Xiaomi RedmiBook Pro 15, i5-11300H MX450: NVIDIA GeForce MX450, 15.60", 1.7 kg
Autres tests » Xiaomi RedmiBook Pro 15, i5-11300H MX450
Acer Aspire Nitro 5 AN517-53-51FQ: NVIDIA GeForce GTX 1650 Mobile, 17.30", 2.7 kg
Autres tests » Acer Aspire Nitro 5 AN517-53-51FQ
Acer Predator Triton 300SE PT314-51s-57YJ: NVIDIA GeForce RTX 3060 Laptop GPU, 14.00", 1.7 kg
Autres tests » Acer Predator Triton 300SE PT314-51s-57YJ