
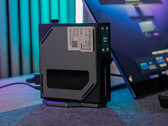
Test de l'Acemagic S1 : mini PC de bureau économe avec Intel N95, 1 To de stockage et un écran
Avec le S1, Acemagic dispose d'un PC compact dans son portefeuille qui convient à une utilisation bureautique simple et quotidienne, l'Intel N95 constituant une bonne base. Les idées imaginatives d'Acemagic lui permettent souvent de se démarquer en termes de design et de fonctionnalité. Il en va de même pour le S1, dont l'écran est intégré à l'avant. Lisez la suite pour découvrir comment l'appareil tient la route dans notre test.
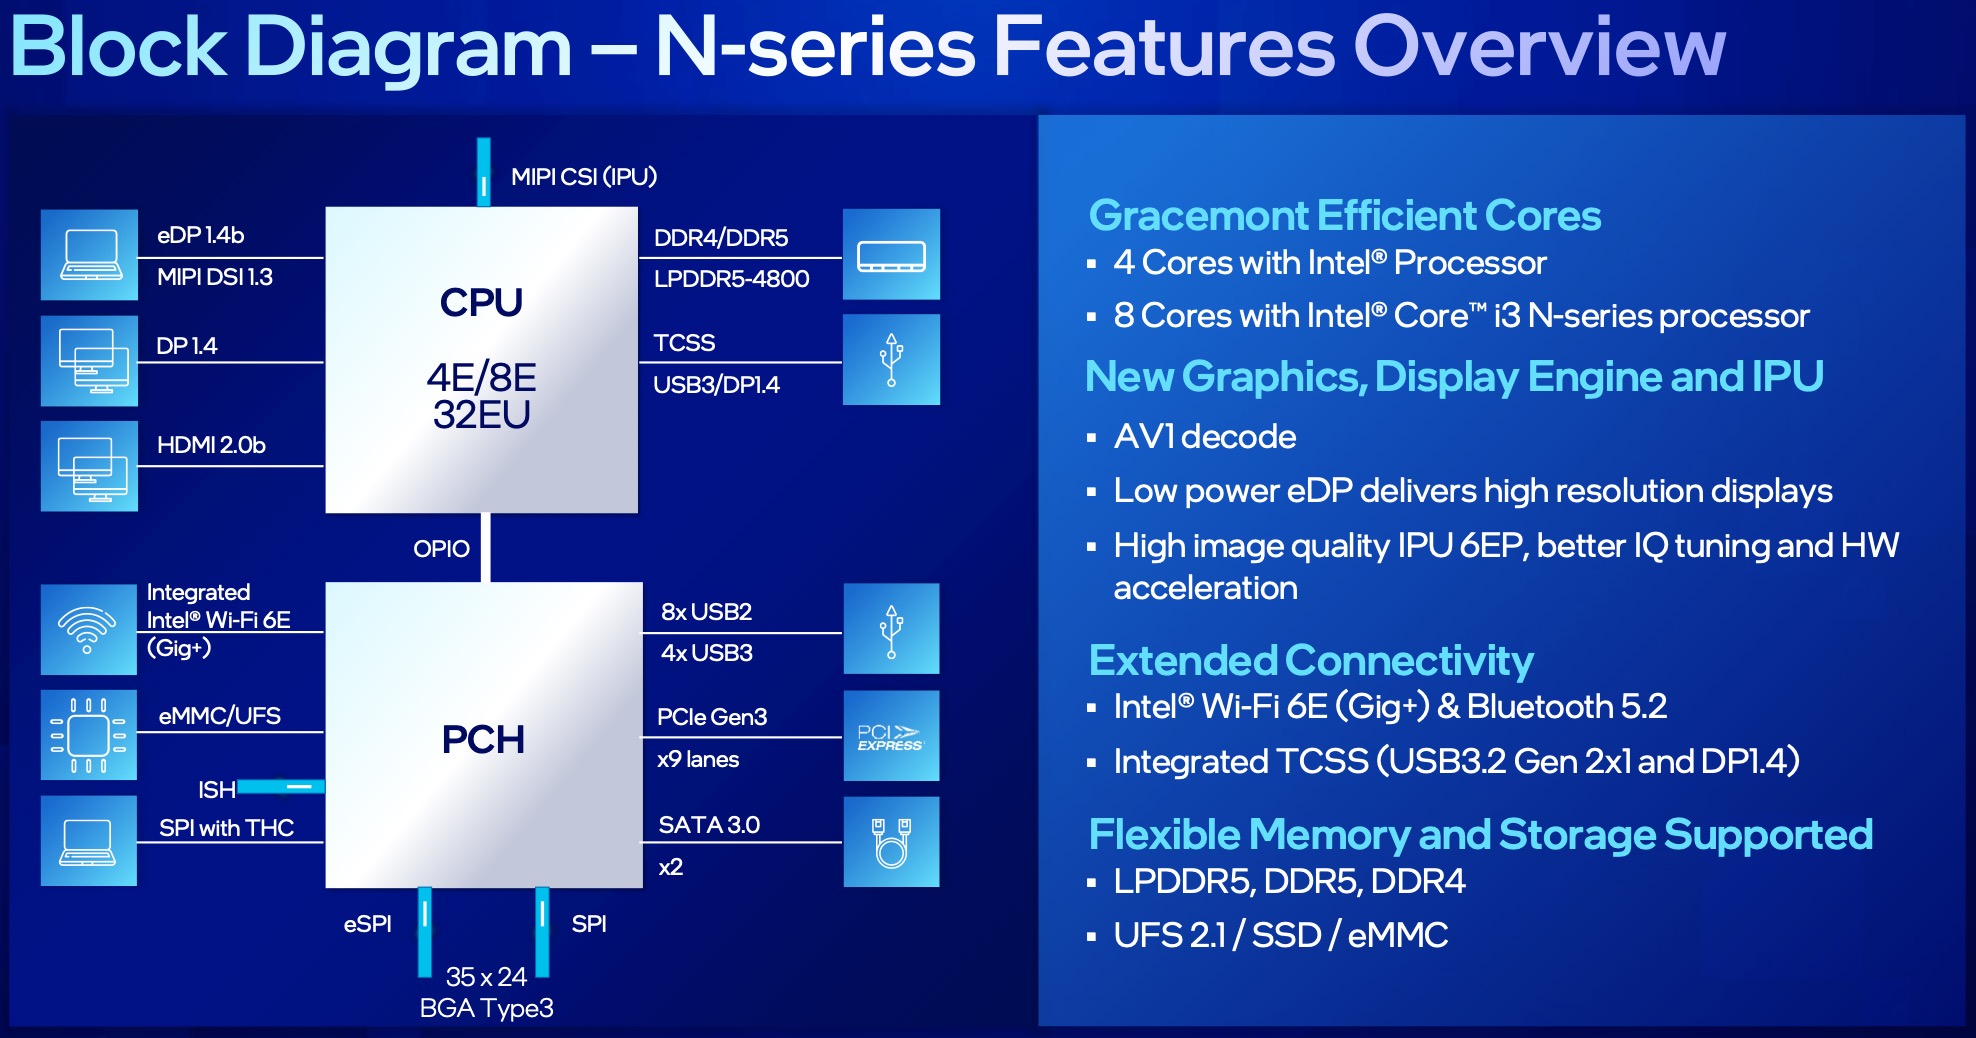
Intel Processor N95, UHD Graphics 24EUs (Alder Lake-N), 440 g