Notebookcheck Logo

Intel Processor N100
Intel N100

Le processeur Intel N100 est un processeur pour ordinateur portable de la série Alder Lake-N. Il a été mis sur le marché en janvier 2023 et propose 4 des 8 processeurs d'efficacité (E-Kerne) avec une fréquence de 1 GHz à 3,4 GHz. Il a été mis sur le marché en janvier 2023 et offre 4 des 8 processeurs d'efficacité (E-Kerne, Gracemont Architektur) à 1 GHz jusqu'à 3,4 GHz. Les processeurs E ne sont pas dotés de la technologie HyperThreading et offrent des performances comparables à celles des processeurs Skylake (par exemple, les processeurs i7-6300HQ). i7-6300HQ).

Performances

Les performances du N100 sont, en raison de l'amplification de la puissance, beaucoup plus faibles que celles du i3-N305 et encore plus faibles que celles du N200 (en raison de la puissance plus élevée). Les performances de l'appareil sont toutefois plus faibles que celles de l'appareil P-Kerne d'Alder Lake-N, qui est défectueux.

Grafikeinheit

Alder Lake-N intègre une capacité d'exécution basée sur le Xe, avec jusqu'à 32 unités d'exécution. Dans le N100, il n'y en a que 24 qui sont activées et qui prennent entre 450 et 750 MHz de manière relativement faible. En raison du nombre restreint d'unités d'exécution, du nombre de prises et de l'utilisation d'une mémoire RAM à canal unique, le fonctionnement de l'appareil est toutefois très limité.

Caractéristiques

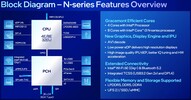
Le petit circuit Alder-Lake-N-Chip intègre à la fois le Wi-Fi 6E et le Bluetooth 5.2 (dans le PCH). Le contrôleur de vitesse intégré supporte les DDR4-3200, DDR5-4800 et LPDDR5-4800 à canal unique. Le moteur de synchronisation rapide Media Engine peut maintenant aussi dékodier AV1 (comme dans le cas d'Alder Lake). Le PCH PCIe Gen3 x9 est utilisé pour la connexion externe des périphériques.

Durée de vie

Le N100 n'a qu'un TDP de 6 watts (PL1) et convient donc également aux systèmes plus légers. Le processeur est équipé d'un processeur Intel 7 (10 nm SuperFin).

GammeIntel Alder Lake-N
Nom de codeAlder Lake-N

Gamme: Alder Lake-N Alder Lake-N

Intel Core i3-N3051.8 - 3.8 GHz8 / 8 cores6 MB L3
Intel Core i3-N300 - 3.8 GHz8 / 8 cores6 MB L3
Intel Processor N2001 - 3.7 GHz4 / 4 cores6 MB L3
Intel Processor N97 - 3.6 GHz4 / 4 cores6 MB L3
Intel Processor N95 - 3.4 GHz4 / 4 cores6 MB L3
Intel Processor N100 « 1 - 3.4 GHz4 / 4 cores6 MB L3
Intel Processor N501 - 3.4 GHz2 / 2 cores6 MB L3
Fréquence1000 - 3400 MHz
Cache de Niveau 3 (L3)6 MB
Nombres de cœurs/threads simultanés supportés4 / 4
4 x 3.4 GHz Intel Crestmont E-Core
Consommation énergétique maximale (TDP)6 Watt(s)
Lithographie (procédé de fabrication)10 nm
Température maximale105 °C
SocketBGA1264
FonctionnalitésDDR4-3200/DDR5-4800/LPDDR5-4800 RAM (sin. chan.), PCIe 3, GNA, MMX, SSE, SSE2, SSE3, SSSE3, SSE4.1, SSE4.2, AVX, AVX2, BMI2, ABM, FMA, ADX, VMX, SMEP, SMAP, EIST, TM1, TM2, Turbo, SST, AES-NI, RDRAND, RDSEED, SHA
Carte graphiqueIntel UHD Graphics 24EUs (Alder Lake-N) ( - 750 MHz)
64 BitPrend en charge les instructions 64 Bit
Architecturex86
Prix de départ$128 U.S.
Date de présentation01/03/2023
Lien redirigeant vers une page externe du produitark.intel.com

Benchmarks

Performance Rating - CB R15 + R20 + 7-Zip + X265 + Blender + 3DM11 CPU
26.3 pt (36%)
Cinebench 2024 - CB24 CPU Single Core
min: 60     moyenne: 60.5     médian: 60.5 (42%)     maximum: 61 Points
Cinebench 2024 - CB24 CPU Multi Core
min: 194     moyenne: 195     médian: 195 (4%)     maximum: 196 Points
Cinebench R23 - Cinebench R23 Multi Core
min: 2038     moyenne: 2730     médian: 2949.5 (3%)     maximum: 2983 Points
202 -93%
...
2174 -20%
2175 -20%
2303 -16%
2546 -7%
2600 -5%
2611 -4%
Intel Core i7-2860QM
2699 -1%
2711 -1%
2729 0%
Intel Processor N100
2730
2739 0%
2913 7%
2914 7%
2927 7%
Intel Core i5-8260U
3028 11%
3038 11%
3094 13%
3108 14%
AMD Ryzen Embedded V1605B
3160 16%
...
32782 1101%
max:
107681 3844%
0%
100%
Cinebench R23 - Cinebench R23 Single Core
min: 868     moyenne: 918     médian: 930 (40%)     maximum: 942 Points
74.4 -92%
...
AMD Ryzen Embedded V1605B
841 -8%
863 -6%
874 -5%
875 -5%
877 -4%
886 -3%
886 -3%
AMD Ryzen Embedded R1606G
888 -3%
906 -1%
Intel Processor N100
918
971 6%
973 6%
974 6%
976 6%
983 7%
988 8%
1003 9%
Intel Core i5-8265U
1008 10%
Intel Core i5-1035G1
1016 11%
...
2178 137%
max:
2351 156%
0%
100%
Cinebench R20 - Cinebench R20 CPU (Single Core)
min: 331     moyenne: 349.8     médian: 355 (39%)     maximum: 358 Points
Cinebench R20 - Cinebench R20 CPU (Multi Core)
min: 776     moyenne: 1042     médian: 1126.5 (3%)     maximum: 1139 Points
Cinebench R15 - Cinebench R15 CPU Multi 64 Bit
min: 296     moyenne: 429.8     médian: 472 (3%)     maximum: 479 Points
0255075100125150175200225250275300325350375400425450Tooltip
Cinebench R15 - Cinebench R15 CPU Single 64 Bit
min: 137     moyenne: 149.5     médian: 153 (46%)     maximum: 155 Points
Cinebench R11.5 - Cinebench R11.5 CPU Multi 64 Bit
min: 3.91     moyenne: 5     médian: 5.2 (7%)     maximum: 5.99 Points
Cinebench R11.5 - Cinebench R11.5 CPU Single 64 Bit
min: 1.55     moyenne: 1.8     médian: 1.8 (46%)     maximum: 1.87 Points
Cinebench R10 - Cinebench R10 Rend. Single (32bit)
min: 4604     moyenne: 4884     médian: 4869 (29%)     maximum: 5179 points
Cinebench R10 - Cinebench R10 Rend. Multi (32bit)
min: 9608     moyenne: 13384     médian: 15207 (11%)     maximum: 15336 points
Cinebench R10 - Cinebench R10 Rend. Multi (64bit)
min: 14514     moyenne: 20884     médian: 23912 (17%)     maximum: 24225 Points
Cinebench R10 - Cinebench R10 Rend. Single (64bit)
min: 7171     moyenne: 7832     médian: 8098 (10%)     maximum: 8227 Points
wPrime 2.10 - wPrime 2.0 1024m *
min: 481.652     moyenne: 536     médian: 496.8 (6%)     maximum: 630.2 s
wPrime 2.10 - wPrime 2.0 32m *
min: 15.795     moyenne: 16.5     médian: 15.9 (3%)     maximum: 17.7 s
WinRAR - WinRAR 4.0
min: 2187     moyenne: 2330     médian: 2372 (4%)     maximum: 2431 points
7-Zip 18.03 - 7-Zip 18.03 Multli Thread 4 runs
min: 9272     moyenne: 12249     médian: 13216 (8%)     maximum: 13291 MIPS
7-Zip 18.03 - 7-Zip 18.03 Single Thread 4 runs
min: 3449     moyenne: 3738     médian: 3771.5 (45%)     maximum: 3958 MIPS
X264 HD Benchmark 4.0 - x264 Pass 2
min: 21.8     moyenne: 30.1     médian: 33.9 (12%)     maximum: 34.7 fps
X264 HD Benchmark 4.0 - x264 Pass 1
min: 105.35     moyenne: 150.3     médian: 172.6 (40%)     maximum: 173 fps
HWBOT x265 Benchmark v2.2 - HWBOT x265 4k Preset
min: 1.99     moyenne: 3.1     médian: 3.4 (6%)     maximum: 3.49 fps
0123456Tooltip
TrueCrypt - TrueCrypt Serpent
min: 0.257     moyenne: 0.3     médian: 0.3 (0%)     maximum: 0.262 GB/s
TrueCrypt - TrueCrypt Twofish
min: 0.531     moyenne: 0.5     médian: 0.5 (9%)     maximum: 0.538 GB/s
TrueCrypt - TrueCrypt AES
min: 2.8     moyenne: 2.9     médian: 2.9 (8%)     maximum: 2.9 GB/s
Blender - Blender 3.3 Classroom CPU *
min: 1992     moyenne: 2024     médian: 2028 (26%)     maximum: 2052 Seconds
Blender - Blender 2.79 BMW27 CPU *
min: 1017     moyenne: 1174     médian: 1043 (7%)     maximum: 1594 Seconds
R Benchmark 2.5 - R Benchmark 2.5 *
min: 0.822     moyenne: 0.9     médian: 0.8 (18%)     maximum: 1.039 sec
3DMark 06 - CPU - 3DMark 06 - CPU
min: 4091     moyenne: 5656     médian: 6435 (14%)     maximum: 6441 Points
Super Pi mod 1.5 XS 1M - Super Pi mod 1.5 XS 1M *
min: 19.264     moyenne: 19.4     médian: 19.4 (4%)     maximum: 19.531 s
Super Pi mod 1.5 XS 2M - Super Pi mod 1.5 XS 2M *
min: 40.352     moyenne: 40.5     médian: 40.4 (2%)     maximum: 40.601 s
Super Pi Mod 1.5 XS 32M - Super Pi mod 1.5 XS 32M *
min: 818.372     moyenne: 833     médian: 818.8 (4%)     maximum: 862.019 s
3DMark Vantage - 3DM Vant. Perf. CPU no Physx
min: 9434     moyenne: 13518     médian: 15496 (14%)     maximum: 15625 Points
3DMark 11 - 3DM11 Performance Physics
min: 3814     moyenne: 5623     médian: 6095.5 (16%)     maximum: 6486 Points
3DMark - 3DMark Ice Storm Physics
min: 34828     moyenne: 45164     médian: 49600 (40%)     maximum: 51063 Points
3DMark - 3DMark Ice Storm Extreme Physics
min: 34083     moyenne: 44999     médian: 49495 (40%)     maximum: 51420 Points
3DMark - 3DMark Ice Storm Unlimited Physics
min: 50867     moyenne: 52113     médian: 52098 (44%)     maximum: 53373 Points
3DMark - 3DMark Cloud Gate Physics
min: 3203     moyenne: 4282     médian: 4615 (12%)     maximum: 4693 Points
3DMark - 3DMark Fire Strike Standard Physics
min: 4589     moyenne: 6060     médian: 6523.5 (12%)     maximum: 6602 Points
3DMark - 3DMark Time Spy CPU
min: 1407     moyenne: 2230     médian: 2499 (11%)     maximum: 2516 Points
Geekbench 6.2 - Geekbench 6.2 Single-Core
min: 1070     moyenne: 1194     médian: 1229.5 (37%)     maximum: 1245 points
Geekbench 6.2 - Geekbench 6.2 Multi-Core
min: 2347     moyenne: 3012     médian: 3208.5 (13%)     maximum: 3282 points
Geekbench 5.5 - Geekbench 5.1 - 5.4 64 Bit Single-Core
min: 946     moyenne: 992     médian: 998 (42%)     maximum: 1018 points
Geekbench 5.5 - Geekbench 5.1 - 5.4 64 Bit Multi-Core
min: 2038     moyenne: 2692     médian: 2864 (5%)     maximum: 2896 points
Geekbench 5.0 - Geekbench 5.0 64 Bit Single-Core
min: 982     moyenne: 994     médian: 993 (4%)     maximum: 1008 points
Geekbench 5.0 - Geekbench 5.0 64 Bit Multi-Core
min: 2424     moyenne: 2680     médian: 2753 (9%)     maximum: 2862 points
Geekbench 4.4 - Geekbench 4.1 - 4.4 64 Bit Single-Core
min: 4390     moyenne: 4458     médian: 4467 (45%)     maximum: 4518 points
Geekbench 4.4 - Geekbench 4.1 - 4.4 64 Bit Multi-Core
min: 10938     moyenne: 11133     médian: 11197 (12%)     maximum: 11264 points
Mozilla Kraken 1.1 - Kraken 1.1 Total Score *
min: 1004     moyenne: 1035     médian: 1021.5 (1%)     maximum: 1093 ms
WebXPRT 4 - WebXPRT 4 Score
136.2 Points (39%)
WebXPRT 3 - WebXPRT 3 Score
min: 157.3     moyenne: 175.6     médian: 178.9 (37%)     maximum: 187.4 Points
CrossMark - CrossMark Overall
min: 735     moyenne: 786     médian: 785 (30%)     maximum: 839 Points
Power Consumption - Prime95 Power Consumption - external Monitor *
min: 12.2     moyenne: 24     médian: 27.3 (5%)     maximum: 29.1 Watt
051015202530Tooltip
Power Consumption - Cinebench R15 Multi Power Consumption - external Monitor *
min: 12.4     moyenne: 21.8     médian: 24.3 (4%)     maximum: 26.1 Watt
0510152025Tooltip
Power Consumption - Idle Power Consumption - external Monitor *
min: 5.33     moyenne: 8.1     médian: 8.6 (6%)     maximum: 9.98 Watt
012345678910111213Tooltip
Power Consumption - Cinebench R15 Multi Power Efficiency - external Monitor
min: 18.3     moyenne: 18.7     médian: 18.7 (14%)     maximum: 19.1 Points per Watt
- Amplitude des valeurs obtenues dans le benchmark avec cette carte graphique
- Valeur moyenne obtenue dans le benchmark avec cette carte graphique
* Plus les chiffres sont petits, plus les performances sont élevées

v1.26
log 25. 01:38:33

#0 no ids found in url (should be separated by "_") +0s ... 0s

#1 not redirecting to Ajax server +0s ... 0s

#2 did not recreate cache, as it is less than 5 days old! Created at Tue, 23 Apr 2024 05:40:15 +0200 +0.001s ... 0.001s

#3 no comparison url found in template nbc.compare_page_2 needed +0.01s ... 0.012s

#4 no comparison url found in template nbc.compare_page_2 needed +0s ... 0.012s

#5 no comparison url found in template nbc.compare_page_2 needed +0s ... 0.013s

#6 no comparison url found in template nbc.compare_page_2 needed +0s ... 0.013s

#7 no comparison url found in template nbc.compare_page_2 needed +0s ... 0.013s

#8 no comparison url found in template nbc.compare_page_2 needed +0s ... 0.014s

#9 composed specs +0.001s ... 0.014s

#10 did output specs +0s ... 0.014s

#11 getting avg benchmarks for device 14932 +0.021s ... 0.036s

#12 got single benchmarks 14932 +0.025s ... 0.061s

#13 got avg benchmarks for devices +0s ... 0.061s

#14 min, max, avg, median took s +1.417s ... 1.478s

#15 no comparison url found in template nbc.compare_page_2 needed +0s ... 1.478s

#16 return log +0s ... 1.478s

Critiques du Intel Processor N100 processeur

Minisforum Série Venus UN100L

Test du Minisforum UN100L : mini-PC pour tâches de bureau (Intel N100, RAM DDR5) à moins de 200 $

Le Venus Series UN100L est un PC particulièrement bon marché et compact vendu par Minisforum. Le fabricant a installé un Intel N100 avec quatre unités de calcul...
Intel Processor N100 | Intel UHD Graphics 24EUs (Alder Lake-N) | | 365 g
Test du Geekom MiniAir 12 : mini PC abordable avec Intel N100 et RAM DDR5 dans un Intel NUC connu

Test du Geekom MiniAir 12 : mini PC abordable avec Intel N100 et RAM DDR5 dans un Intel NUC connu

L'année dernière, Geekom a sorti une nouvelle édition spéciale de son MiniAir 11. Ce faisant, le fabricant ne l'a pas doté d'un nouveau SoC, ce qui n'est pas le...
Intel Processor N100 | Intel UHD Graphics 24EUs (Alder Lake-N) | | 453 g
Trigkey G4

Test du Trigkey G4 : mini PC avec Intel N100, 16 Go de RAM, SSD 500 Go pour moins de 200 $

Pour répondre à ces exigences, les clients de streaming ou les appareils de bureau compacts n'ont pas besoin d'être très puissants. Le Trigkey est un mini PC re...
Intel Processor N100 | Intel UHD Graphics 24EUs (Alder Lake-N) | | 272 g

Lenovo IdeaPad Duet 3 11IAN8, Intel N100: Intel UHD Graphics 24EUs (Alder Lake-N), 11.50", 0.7 kg
  Autres tests » Lenovo IdeaPad Duet 3 11IAN8, Intel N100

Chuwi GemiBook Plus: Intel UHD Graphics 24EUs (Alder Lake-N), 15.60", 1.8 kg
  Autres tests » Chuwi GemiBook Plus

Chuwi Minibook X 2023: Intel UHD Graphics 24EUs (Alder Lake-N), 10.50", 0.9 kg
  Autres tests » Chuwi Minibook X 2023

Lenovo IdeaPad Flex 3 Chrome 12IAN8, Intel N100: Intel UHD Graphics 24EUs (Alder Lake-N), 12.20", 1.3 kg
  Autres tests » Lenovo IdeaPad Flex 3 Chrome 12IAN8, Intel N100

Chuwi Gemibook XPro: Intel UHD Graphics 24EUs (Alder Lake-N), 14.10", 1.5 kg
  Autres tests » Chuwi Gemibook XPro

Please share our article, every link counts!

» Comparaison des processeurs pour ordinateur portable
Comparaison de tout les processeurs mobiles


» Processeurs mobiles - liste des benchmarks
Liste des benchmarks de l'intégralité des processeurs pour portables


Les autres processeurs de la gamme Alder Lake-N

» Intel Core i3-N305
   8x 1.8 GHz - 3.8 GHz
» Intel Core i3-N300
   8x - 3.8 GHz
» Intel Processor N200
   4x 1 GHz - 3.7 GHz
» Intel Processor N97
   4x - 3.6 GHz
» Intel Processor N95
   4x - 3.4 GHz
» Intel Processor N100
   4x 1 GHz - 3.4 GHz
» Intel Processor N50
   2x 1 GHz - 3.4 GHz

Processeurs similaires

+ AMD Ryzen 3 PRO 3300U
   4x 2.1 GHz - 3.5 GHz
+ AMD Ryzen 3 2300U
   4x 2 GHz - 3.4 GHz
+ AMD Ryzen 3 PRO 2300U
   4x 2 GHz - 3.4 GHz
+ Intel Processor N97
   4x - 3.6 GHz
+ Intel Processor N95
   4x - 3.4 GHz
» Intel Processor N100
   4x 1 GHz - 3.4 GHz
- Intel Core i7-7500U
   2x 2.7 GHz - 3.5 GHz
- Intel Core i5-5350H
   2x 3 GHz - 3.5 GHz
- Intel Core i5-7300U
   2x 2.6 GHz - 3.5 GHz
- Intel Core i3-8130U
   2x 2.2 GHz - 3.4 GHz
- Intel Core i5-7260U
   2x 2.2 GHz - 3.4 GHz
> Revues et rapports de ordinateurs portatifs et smartphones, ordiphones > FAQ > Processeurs mobiles - indice de référence > Intel Alder Lake-N N100 Notebook Processor
Klaus Hinum (Update: 2023-11-24)