Intel Core i7-2600K
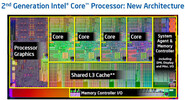
Le Intel Core i7-2600K est un processeur quad-core haut de gamme pour ordinateur fixe de la génération Sandy Bridge. Annoncé début 2011 c'était le CPU le plus puissant de la série à cette époque. Cependant il n'offre pas toutes les fonctions de Sandy Bridge, comme vPro, VT-d et les fonctionnalités de Trusted-Execution qui sont désactivées. Avec l'Hyperthreading, les quatre cœurs peut s'occuper de 8 tâches en parallèle avec une fréquence de base de 3.4 GHz. En utilisation intense, les cœurs peuvent être overclockés automatiquement jusqu'à 3.8 GHz avec un système de refroidissement suffisant: 3.8 GHz - 1 cœur utilisé 3.7 GHz - 2 cœur utilisés 3.6 GHz - 3 cœur utilisés 3.5 GHz - 4 cœur utilisés En tant que membre de la "Famille K", le i7-2600K est facile à overclocker avec le multiplicateur débloqué. La puce inclue aussi une carte graphique appelée Intel HD Graphics 3000 cadencée entre 850 et 1350 MHz (aussi grâce à Turbo Boost). De plus, le contrôleur mémoire dual channel supporte jusqu'à 32 Go de DDR3-1333.
Gamme Intel Core i7 (Desktop) Nom de code Sandy Bridge Gamme: Core i7 (Desktop) Sandy Bridge Intel Core i7-2700K 3.5 - 3.9 GHz 4 / 8 8 MB » Intel Core i7-2600K 3.4 - 3.8 GHz 4 / 8 8 MB
Fréquence 3400 - 3800 MHz Cache de Niveau 2 (L2) 1 MB Cache de Niveau 3 (L3) 8 MB Nombres de cœurs/threads simultanés supportés 4 / 8 Consommation énergétique maximale (TDP) 95 Watt(s) Nombre de transistors 995 Million(s) Lithographie (procédé de fabrication) 32 nm Taille du Die 216 mm2 Température maximale 72.6 °C Socket LGA1155 Fonctionnalités SSE4.1, SSE4.2, AVX, Turbo Boost (3.80GHz), Hyper-Threading, VT-x, AES-NI, Intel 64, Idle States, EIST, Thermal Monitoring Technologies, Intel Fast Memory Access, Intel Flex Memory Access, XD bit, open Multiplicator Carte graphique Intel HD Graphics 3000 (850 - 1350 MHz)64 Bit Prend en charge les instructions 64 Bit Architecture x86 Prix de départ $317 U.S. Date de présentation 01/03/2011 Lien redirigeant vers une page externe du produit Intel Core i7 (Desktop) 2600K
Benchmarks Cinebench R15 - Cinebench R15 CPU Multi 64 Bit
min: 613 moyenne: 614 médian: 613.5 (14%) maximum: 614 Points
...
Intel Core i5-1035G1 0%
Intel Core i5-6600K 0%
...
AMD Ryzen Threadripper 2970WX 613%
Cinebench R15 - Cinebench R15 CPU Single 64 Bit
129 Points (47%)
Modèle Processeur Carte graphique RAM Valeur Desktop GTX 680 2600K GeForce GTX 680 1059 / 1502 MHz 2 GB 8 GB 129
...
Intel Core i5-7200U -2%
Intel Core i5-4430 -2%
...
Cinebench R11.5 - Cinebench R11.5 CPU Multi 64 Bit
6.8 Points (14%)
...
...
Cinebench R11.5 - Cinebench R11.5 CPU Single 64 Bit
1.5 Points (48%)
...
Intel Core i5-6400 0%
Intel Core i7-3960X 0%
Intel Core i5-4460 1%
AMD Ryzen 5 1400 1%
...
Cinebench R10 - Cinebench R10 Rend. Single (32bit)
4809 points (43%)
...
AMD Ryzen 5 2600 -2%
AMD Ryzen Threadripper 1950X -1%
Intel Core i5-2500K -1%
Intel Core i5-4460 0%
...
Intel Core i9-11900K 119%
Cinebench R10 - Cinebench R10 Rend. Multi (32bit)
18608 points (30%)
...
Intel Core i5-6400 -2%
Intel Core i7-8650U 1%
Intel Core i5-8265U 2%
Intel Xeon E3-1226 v3 2%
Intel Core i5-4590 2%
...
Intel Core i9-11900K 233%
Cinebench R10 - Cinebench R10 Rend. Multi (64bit)
22897 Points (22%)
...
...
Cinebench R10 - Cinebench R10 Rend. Single (64bit)
6001 Points (42%)
...
Intel Core i5-2500K -1%
Intel Core i7-3960X 2%
...
Intel Core i9-11900K 136%
wPrime 2.10 - wPrime 2.0 1024m *
328 s (4%)
AMD Ryzen Threadripper 2970WX -88%
...
Intel Core i5-6400 0%
Intel Core i3-9100F 5%
...
VIA C3-M C3-M-1200 2479%
wPrime 2.10 - wPrime 2.0 32m *
10.5 s (2%)
Intel Core i9-10850K -75%
...
Intel Core i7-1160G7 -4%
Intel Core i5-1035G1 3%
Intel Core i5-8265U 5%
...
wPrime 1.55 - wPrime 1.55 1024m *
234 s (1%)
Intel Core i7-3960X -39%
Intel Core i7-7700HQ -9%
Intel Core i7-2700K -8%
AMD Ryzen 7 5800H 13%
AMD Ryzen 5 5600H 17%
Intel Core i7-8650U 77%
Intel Core i5-7200U 99%
...
Intel Celeron M 373 10871%
wPrime 1.55 - wPrime 1.55 32m *
7.1 s (4%)
Intel Core i7-3960X -32%
Intel Core i7-2700K 2%
Intel Core i7-7700HQ 6%
AMD Ryzen 7 5800H 15%
AMD Ryzen 5 5600H 20%
Intel Core i7-8650U 44%
...
Intel Pentium M 713 2561%
3486 points (22%)
...
Intel Core i5-4460 -3%
Intel Core i7-2700K 1%
AMD Ryzen 5 1600 2%
Intel Core i5-6600K 5%
...
X264 HD Benchmark 4.0 - x264 Pass 2
36.5 fps (17%)
Intel Pentium 4 2.4 GHz -95%
...
Intel Core i5-1035G4 -2%
Intel Core i5-8265U 2%
Intel Core i7-2700K 3%
Intel Core i5-1035G7 4%
...
X264 HD Benchmark 4.0 - x264 Pass 1
145 fps (43%)
...
AMD Ryzen 5 1400 1%
Intel Core i7-2700K 1%
Intel Core i5-6400 3%
...
TrueCrypt - TrueCrypt Serpent
0.3 GB/s (13%)
...
Intel Core i7-2860QM -5%
Intel Xeon E3-1226 v3 -5%
Intel Core i5-6600K -2%
Intel Core i3-9100F 2%
Intel Core i7-2700K 3%
...
TrueCrypt - TrueCrypt Twofish
0.6 GB/s (15%)
...
Intel Core i7-2860QM -6%
Intel Xeon E5-2680 -5%
Intel Core i7-2700K 3%
...
AMD Ryzen 9 3950X 542%
TrueCrypt - TrueCrypt AES
3.3 GB/s (12%)
...
Intel Core i5-6600K -3%
Intel Core i7-2700K 6%
...
3DMark 06 - CPU - 3DMark 06 - CPU
min: 6358 moyenne: 6649 médian: 6669 (37%) maximum: 6791 Points
...
Intel Core i7-10810U -2%
Intel Core i7-8650U 1%
Intel Core i7-2700K 3%
...
Super Pi mod 1.5 XS 1M - Super Pi mod 1.5 XS 1M *
10.2 s (2%)
Intel Core i9-11900K -39%
...
AMD Ryzen Threadripper 2920X 0%
AMD Ryzen Threadripper 2970WX 0%
AMD Ryzen Threadripper 2950X 1%
Intel Core i7-7700HQ 1%
Intel Core i7-2860QM 1%
Intel Core i7-5960X 2%
...
VIA C3-M C3-M-1200 4439%
Super Pi mod 1.5 XS 2M - Super Pi mod 1.5 XS 2M *
22.4 s (1%)
Intel Core i9-11900K -39%
...
AMD Ryzen Threadripper 2920X 0%
AMD Ryzen Threadripper 2970WX 0%
...
Super Pi Mod 1.5 XS 32M - Super Pi mod 1.5 XS 32M *
560 s (2%)
Intel Core i9-11900K -41%
...
Intel Xeon E3-1226 v3 -2%
Intel Core i7-3960X -1%
Intel Core i7-2700K -1%
Intel Core i5-4460 0%
Intel Core i5-8265U 0%
Qualcomm Snapdragon 8cx 1%
Intel Core i7-7700HQ 1%
...
VIA C3-M C3-M-1200 3920%
SiSoft Sandra Dhrystone (MIPS) - SiSoft Sandra Dhrystone (MIPS)
118000 MIPS (56%)
...
Intel Core i7-2860QM -2%
...
SiSoft Sandra Whetstone (MFLOPS) - SiSoft Sandra Whetstone (MFLOPS)
82400 MFLOPS (63%)
...
Intel Core i7-2700K 5%
...
Intel Core i7-3960X 57%
Windows 7 Experience Index - Win7 CPU
7.6 Points (97%)
...
Intel Core i7-2860QM 0%
Intel Core i7-2700K 0%
Intel Xeon X5670 1%
...
Intel Core i7-3960X 3%
3DMark Vantage - 3DM Vant. Perf. CPU no Physx
min: 22530 moyenne: 23608 médian: 23731 (27%) maximum: 24019 Points
...
Intel Core i5-1035G7 3%
Intel Core i7-2700K 4%
...
3DMark 11 - 3DM11 Performance Physics
min: 7865 moyenne: 8579 médian: 8527 (31%) maximum: 9487 Points
...
Intel Core i7-4790T -3%
Intel Xeon X5670 -3%
Intel Core i7-7700HQ -2%
Intel Core i7-2700K 0%
Intel Core i7-4790S 1%
Intel Core i3-9100F 2%
...
3DMark - 3DMark Ice Storm Physics
min: 40698 moyenne: 43628 médian: 44325 (29%) maximum: 44752 Points
Samsung Hummingbird S5PC110 / Exynos 3110 -99%
...
Intel Core i7-8650U -3%
Intel Xeon E5-2680 v4 -1%
Intel Xeon E-2176M 2%
AMD Ryzen Threadripper 2970WX 3%
...
3DMark - 3DMark Ice Storm Extreme Physics
min: 42348 moyenne: 44674 médian: 44674 (47%) maximum: 47000 Points
Modèle Processeur Carte graphique RAM Valeur Sapphire Tri-X R9 290X Desktop 2600K Radeon R9 290X 1040 / 1300 MHz 4 GB 8 GB 42348 Desktop GTX 680, Intel Core i7-2600K 2600K GeForce GTX 680 1059 / 1502 MHz 2 GB 8 GB 47000
...
Intel Xeon E5-2680 v4 -3%
Intel Xeon E-2176M -3%
AMD Ryzen Threadripper 2970WX 2%
Intel Core i7-7700HQ 4%
Intel Core i7-1065G7 5%
Intel Xeon E5-2697 v2 5%
...
3DMark - 3DMark Ice Storm Unlimited Physics
min: 44250 moyenne: 44554 médian: 44553.5 (46%) maximum: 44857 Points
Modèle Processeur Carte graphique RAM Valeur Desktop GTX 680, Intel Core i7-2600K 2600K GeForce GTX 680 1059 / 1502 MHz 2 GB 8 GB 44250 Sapphire Tri-X R9 290X Desktop 2600K Radeon R9 290X 1040 / 1300 MHz 4 GB 8 GB 44857
Qualcomm Snapdragon S4 Play MSM8625Q -93%
...
Intel Xeon E5-2680 v4 -5%
...
3DMark - 3DMark Cloud Gate Physics
min: 6298 moyenne: 6359 médian: 6360.5 (16%) maximum: 6434 Points
...
Intel Core i5-1038NG7 -4%
Intel Core i3-9100F -1%
Intel Core i5-1035G4 1%
...
3DMark - 3DMark Fire Strike Standard Physics
min: 8740 moyenne: 8789 médian: 8798 (22%) maximum: 8832 Points
...
Intel Core i7-8650U 1%
Intel Core i3-9100F 2%
Intel Core i5-1038NG7 4%
...
Geekbench 2 - 32 Bit - Geekbench Stream
2537 Points (20%)
...
AMD Phenom II X4 905e -6%
...
Intel Core i7-7740X 389%
Geekbench 2 - 32 Bit - Geekbench Memory
5074 Points (46%)
...
HiSilicon Kirin 980 2%
...
Intel Core i7-7740X 117%
Geekbench 2 - 32 Bit - Geekbench Floating Point
9088 Points (18%)
...
Intel Core i3-8145U -12%
Qualcomm Snapdragon 460 2%
...
Geekbench 2 - 32 Bit - Geekbench Integer
9443 Points (19%)
...
Intel Core i3-8145U -13%
Intel Xeon E3-1226 v3 6%
Samsung Exynos 2100 5G 7%
...
Geekbench 2 - 32 Bit - Geekbench Total Score
7754 Points (20%)
...
Intel Core i3-8145U -4%
...
Geekbench 3 - Geekbench 3 32 Bit Multi-Core
min: 11506 moyenne: 11547 médian: 11546.5 (20%) maximum: 11587 points
Samsung Hummingbird S5PC110 / Exynos 3110 -98%
...
Intel Core i5-4460 -12%
Intel Xeon E3-1226 v3 -9%
Intel Core i5-6600K 6%
...
Geekbench 3 - Geekbench 3 32 Bit Single-Core
min: 2975 moyenne: 3015 médian: 3015 (62%) maximum: 3055 points
Samsung Hummingbird S5PC110 / Exynos 3110 -92%
...
Intel Core i5-7200U -1%
...
Geekbench 3 - Geekbench 3 64 Bit Multi-Core
12009 points (19%)
...
Intel Core i5-4460 -10%
Samsung Exynos 2100 5G -5%
Intel Core i5-6600K 4%
Intel Core i5-8265U 8%
...
Geekbench 3 - Geekbench 3 64 Bit Single-Core
3189 points (65%)
...
Intel Core i3-7130U -7%
HiSilicon Kirin 980 -6%
Apple A9X -2%
Intel Core i5-7200U -1%
...
Mozilla Kraken 1.1 - Kraken 1.1 Total Score *
1297 ms (2%)
Modèle Processeur Carte graphique RAM Valeur Desktop GTX 680 2600K GeForce GTX 680 1059 / 1502 MHz 2 GB Chrome 298 GB 1296.9
...
Intel Core i3-8145U -1%
Intel Core i7-2860QM 4%
...
Qualcomm Snapdragon S1 MSM7227A 4485%
Sunspider - Sunspider 1.0 Total Score *
min: 150.6 moyenne: 157 médian: 157.3 (2%) maximum: 164 ms
Modèle Processeur Carte graphique RAM Valeur Desktop GTX 680 2600K GeForce GTX 680 1059 / 1502 MHz 2 GB Chrome 298 GB 150.6 Desktop GTX 680, Intel Core i7-2600K 2600K GeForce GTX 680 1059 / 1502 MHz 2 GB Chrome 338 GB 164
...
AMD A9-9420 -6%
Apple A11 Bionic -5%
AMD A6-9220 3%
...
Octane V2 - Octane V2 Total Score
min: 7883 moyenne: 15417 médian: 15416.5 (23%) maximum: 22950 Points
Modèle Processeur Carte graphique RAM Valeur Desktop GTX 680, Intel Core i7-2600K 2600K GeForce GTX 680 1059 / 1502 MHz 2 GB IE 108 GB 7883 Desktop GTX 680, Intel Core i7-2600K 2600K GeForce GTX 680 1059 / 1502 MHz 2 GB Chrome 338 GB 22950
...
AMD PRO A8-9600B -2%
...
AMD Ryzen 9 5980HS 334%
- Amplitude des valeurs obtenues dans le benchmark avec cette carte graphique
- Valeur moyenne obtenue dans le benchmark avec cette carte graphique
* Smaller numbers mean a higher performance
v1.16
log 11. 13:30:23
#0 no ids found in url (should be separated by "_") +0s ... 0s
#1 not redirecting to Ajax server +0s ... 0s
#2 did not recreate cache, as it is less than 5 days old! Created at Sat, 10 Apr 2021 10:58:17 +0200 +0.001s ... 0.001s
#3 no comparison url found in template nbc.compare_page_2 needed +0.004s ... 0.005s
#4 composed specs +0s ... 0.005s
#5 did output specs +0s ... 0.005s
#6 getting avg benchmarks for device 1574 +0.001s ... 0.005s
#7 got single benchmarks 1574 +0.045s ... 0.05s
#8 got avg benchmarks for devices +0s ... 0.05s
#9 min, max, avg, median took s +0.417s ... 0.467s
#10 no comparison url found in template nbc.compare_page_2 needed +0s ... 0.467s
#11 return log +0s ... 0.467s
:: Aucune critique trouvée pour ce processeur (pour le moment).
Les autres processeurs de la gamme Core i7 (Desktop) » Intel Core i7-6950X 10x 3 GHz - 3.5 GHz
» Intel Core i7-5960X 8x 3 GHz - 3.5 GHz
» Intel Core i7-6700K 4x 4 GHz - 4.2 GHz
» Intel Core i7-3960X 6x 3.3 GHz - 3.9 GHz
» Intel Core i7-4790K 4x 4 GHz - 4.4 GHz
» Intel Core i7-4790 4x 3.6 GHz - 4 GHz
» Intel Core i7-4790S 4x 3.2 GHz - 4 GHz
» Intel Core i7-990X EE 6x 3.47 GHz - 3.73 GHz
» Intel Core i7-980X EE 6x 3.33 GHz - 3.6 GHz
» Intel Core i7-4790T 4x 2.7 GHz - 3.9 GHz
» Intel Core i7-2700K 4x 3.5 GHz - 3.9 GHz
» Intel Core i7-975 4x 3.33 GHz - 3.6 GHz
» Intel Core i7-960 4x 3.2 GHz - 3.47 GHz
» Intel Core i7-950 4x 3.06 GHz - 3.33 GHz
» Intel Core i7-940 4x 2.93 GHz - 3.2 GHz
» Intel Core i7-920 4x 2.66 GHz - 2.93 GHz
Processeurs similaires + Intel Core i7-4790T 4x 2.7 GHz - 3.9 GHz
+ AMD Ryzen 5 1400 4x 3.2 GHz - 3.4 GHz
+ Intel Core i7-2700K 4x 3.5 GHz - 3.9 GHz
- Intel Xeon X5670 6x 2.93 GHz - 3.33 GHz
- Intel Xeon E3-1226 v3 4x 3.3 GHz - 3.7 GHz
- Intel Core i5-4590 4x 3.3 GHz - 3.7 GHz
Please share our article, every link counts!
Klaus Hinum (Update: 2013-04-15)