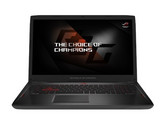
AMD Ryzen 7 1700
L'AMD Ryzen 7 1700 est un processeur de bureau rapide avec huit cœurs et la technologies SMT (seize cœurs logiques) lancé début 2017. Il est basé sur la nouvelle architecture Zen, et il s'agit du modèle le plus lent au moment de son annonce. Avec 65 W d'enveloppe thermique, il consomme moins que le Ryzen 1700X.
Les cœurs physiques sont cadencés entre 3 et 3,75 GHz (XFR). Le Turbo deux cœurs est annoncé à 3,7 GHz, le turbo huit cœurs à 3,2 GHz. La fréquence et l'enveloppe thermique sont les deux seules différences avec les modèles Ryzen 7 plus rapides.
Les performances dans les logiciels qui peuvent utiliser les 8 cœurs sont très compétitives face aux processeurs Intel, avec un très bon prix. Malheureusement les logiciels non optimisés, comme de nombreux jeux, ne peuvent tirer pleinement partie de cette nouvelle architecture.
Gamme AMD Ryzen 7 Nom de code Zen Gamme: Ryzen 7 Zen Fréquence 3000 - 3700 MHz Cache de Niveau 2 (L2) 4 MB Cache de Niveau 3 (L3) 16 MB Nombres de cœurs/threads simultanés supportés 8 / 16 Consommation énergétique maximale (TDP) 65 Watt(s) Nombre de transistors 4800 Million(s) Lithographie (procédé de fabrication) 14 nm Socket AM4 Fonctionnalités XFR, FMA3, SSE 4.2, AVX2, SMT 64 Bit Prend en charge les instructions 64 Bit Architecture x86 Prix de départ $329 U.S. Date de présentation 03/02/2017
Benchmarks Cinebench R15 - Cinebench R15 CPU Multi 64 Bit
min: 1408 moyenne: 1415 médian: 1413.8 (31%) maximum: 1424 Points
...
Intel Core i9-10885H -11%
Intel Core i7-10750H -9%
Intel Core i7-5960X -2%
Intel Xeon E5-2697 v2 10%
...
AMD Ryzen Threadripper 2970WX 209%
0 10 20 30 40 50 60 70 80 90 100 110 120 130 140 150 160 170 180 190 200 210 220 230 240 250 260 270 280 290 300 310 320 330 340 350 360 370 380 390 400 410 420 430 440 450 460 470 480 490 500 510 520 530 540 550 560 570 580 590 600 610 620 630 640 650 660 670 680 690 700 710 720 730 740 750 760 770 780 790 800 810 820 830 840 850 860 870 880 890 900 910 920 930 940 950 960 970 980 990 1000 1010 1020 1030 1040 1050 1060 1070 1080 1090 1100 1110 1120 1130 1140 1150 1160 1170 1180 1190 1200 1210 1220 1230 1240 1250 1260 1270 1280 1290 1300 1310 1320 1330 1340 1350 1360 1370 1380 1390 1400 1410 1420 1430 Tooltip Nvidia GeForce GTX 1080 Ti FE Asus Prime B350-PLUS : Ø1419 (1413.38-1425.16)
Cinebench R15 - Cinebench R15 CPU Single 64 Bit
min: 144 moyenne: 146 médian: 147 (54%) maximum: 147.65 Points
...
Intel Xeon E3-1226 v3 -1%
AMD Ryzen 5 1600 -1%
Intel Xeon E3-1230 v3 -1%
Intel Core i3-8145U 1%
AMD Ryzen 5 1500X 3%
Intel Core i7-4790S 3%
Intel Xeon E3-1231 v3 4%
...
Cinebench R11.5 - Cinebench R11.5 CPU Multi 64 Bit
min: 15.56 moyenne: 15.7 médian: 15.7 (32%) maximum: 15.76 Points
...
AMD Ryzen 5 2600 -13%
Intel Core i7-10750H -11%
Intel Core i7-5960X -4%
Intel Xeon E5-2697 v2 12%
AMD Ryzen Threadripper 2920X 12%
...
Cinebench R11.5 - Cinebench R11.5 CPU Single 64 Bit
min: 1.63 moyenne: 1.7 médian: 1.7 (53%) maximum: 1.67 Points
...
Intel Xeon E3-1230 v3 0%
...
Cinebench R10 - Cinebench R10 Rend. Single (32bit)
min: 4286 moyenne: 4449 médian: 4419 (39%) maximum: 4643 points
...
Intel Core i5-2400 -1%
AMD Ryzen 5 1600 2%
...
Cinebench R10 - Cinebench R10 Rend. Multi (32bit)
min: 28947 moyenne: 29222 médian: 29330 (49%) maximum: 29388 points
...
AMD Ryzen 5 1600 -10%
Intel Xeon E5-2680 -8%
Intel Core i7-3960X -7%
AMD Ryzen 5 2600 -4%
Intel Core i7-7740X 1%
Intel Core i5-8400 5%
Intel Xeon E5-2680 v4 6%
Intel Core i9-9900T 7%
Intel Core i5-9400F 8%
...
wPrime 2.10 - wPrime 2.0 1024m *
120 s (1%)
AMD Ryzen Threadripper 2970WX -68%
...
Intel Core i7-5960X -2%
Intel Xeon E5-2680 8%
Intel Core i9-10885H 9%
AMD Ryzen 5 2600 18%
...
VIA C3-M C3-M-1200 6950%
wPrime 2.10 - wPrime 2.0 32m *
6 s (1%)
...
Intel Core i7-7740X -9%
AMD Ryzen 5 2600 -8%
Intel Core i7-10750H -7%
Intel Core i9-9900T -2%
Intel Core i7-4790K -1%
Intel Core i5-8400 3%
Intel Core i7-4790 7%
...
min: 3364 moyenne: 3447 médian: 3447 (22%) maximum: 3530 points
...
Intel Core i5-4460 -2%
Intel Core i7-2700K 3%
AMD Ryzen 5 1600 3%
Intel Core i5-6600K 6%
...
X264 HD Benchmark 4.0 - x264 Pass 2
min: 67 moyenne: 74.4 médian: 74.4 (34%) maximum: 81.8 fps
Intel Pentium 4 2.4 GHz -97%
...
Intel Core i5-9400F -14%
AMD Ryzen 5 1600 -7%
Intel Core i7-9750H -6%
Intel Core i9-9900T -6%
AMD Ryzen 5 2600 1%
Intel Core i7-10750H 5%
Intel Xeon E5-2680 v4 6%
Intel Core i9-10885H 8%
...
X264 HD Benchmark 4.0 - x264 Pass 1
min: 147 moyenne: 154 médian: 153.9 (45%) maximum: 160.7 fps
...
AMD Ryzen 5 1400 -5%
Intel Core i5-6400 -3%
Intel Core i5-8265U 3%
Intel Core i7-4790T 4%
...
TrueCrypt - TrueCrypt Serpent
min: 0.823 moyenne: 0.8 médian: 0.8 (34%) maximum: 0.83 GB/s
...
Intel Core i7-10750H -6%
Intel Xeon E5-2680 v4 4%
Intel Xeon E5-2697 v2 11%
...
TrueCrypt - TrueCrypt Twofish
1.3 GB/s (35%)
...
Intel Core i7-9750H -4%
Intel Core i7-10750H 0%
Intel Core i7-5960X 0%
Intel Xeon E5-2680 v4 8%
...
AMD Ryzen 9 3950X 177%
TrueCrypt - TrueCrypt AES
min: 6 moyenne: 7.2 médian: 7.2 (27%) maximum: 8.4 GB/s
...
Intel Core i7-7740X -22%
AMD Ryzen 5 1600 -12%
Intel Xeon E-2176M -5%
Intel Core i7-9750H 2%
AMD Ryzen 5 2600 4%
Intel Core i7-10750H 6%
...
3DMark 06 - CPU - 3DMark 06 - CPU
min: 7730 moyenne: 8335 médian: 8335 (46%) maximum: 8940 Points
...
AMD Ryzen 5 1600 -1%
Intel Core i7-7700T -1%
Intel Xeon E5-2680 v4 -1%
Intel Core i7-3960X 0%
Intel Xeon E3-1280 v5 2%
Intel Core i5-1035G7 5%
...
Super Pi mod 1.5 XS 1M - Super Pi mod 1.5 XS 1M *
min: 11.4 moyenne: 11.8 médian: 11.8 (3%) maximum: 12.1 s
...
Intel Core i7-1065G7 -1%
Intel Core i7-980X EE 0%
AMD Ryzen 5 1600 1%
...
VIA C3-M C3-M-1200 3824%
Super Pi mod 1.5 XS 2M - Super Pi mod 1.5 XS 2M *
min: 24.9 moyenne: 25.7 médian: 25.7 (1%) maximum: 26.4 s
...
Intel Core i5-2400 0%
Intel Core i7-2640M 1%
...
Super Pi Mod 1.5 XS 32M - Super Pi mod 1.5 XS 32M *
min: 594 moyenne: 636 médian: 635.6 (3%) maximum: 677.2 s
...
Intel Core i7-2640M -2%
AMD Ryzen Threadripper 1950X 0%
Intel Core i3-8145U 0%
AMD Ryzen 5 1500X 1%
Intel Core i7-980X EE 1%
...
VIA C3-M C3-M-1200 3440%
3DMark 11 - 3DM11 Performance Physics
min: 10162 moyenne: 12003 médian: 12723 (52%) maximum: 13124 Points
...
Intel Core i7-6700K -7%
Intel Core i5-9400F -7%
Intel Xeon E-2176M -3%
Intel Core i7-3960X 0%
AMD Ryzen Threadripper 2970WX 2%
Intel Core i7-7740X 3%
AMD Ryzen 5 2600 3%
Intel Core i7-9750H 6%
...
3DMark - 3DMark Ice Storm Physics
60924 Points (39%)
Samsung Hummingbird S5PC110 / Exynos 3110 -99%
...
Intel Xeon E3-1226 v3 -5%
AMD Ryzen Threadripper 2950X -1%
Intel Core i5-6600K 0%
Intel Core i7-6700K 0%
Intel Core i7-10750H 1%
...
3DMark - 3DMark Cloud Gate Physics
12048 Points (30%)
...
Intel Xeon E5-2697 v2 -10%
Intel Core i7-10750H -9%
AMD Ryzen 5 2600 -7%
AMD Ryzen Threadripper 2970WX 6%
...
3DMark - 3DMark Fire Strike Standard Physics
min: 16715 moyenne: 16759 médian: 16732 (42%) maximum: 16830 Points
...
AMD Ryzen 5 1600 -7%
Intel Xeon E5-2680 v4 -3%
Intel Core i7-9750H -3%
Intel Xeon E5-2697 v2 -1%
Intel Core i7-5960X 1%
AMD Ryzen 5 2600 2%
Intel Core i7-10750H 4%
...
3DMark - 3DMark Time Spy CPU
min: 6411 moyenne: 6981 médian: 7116 (50%) maximum: 7415 Points
...
AMD Ryzen 5 2600 -10%
Intel Core i7-9750H -9%
Intel Core i7-10750H -3%
AMD Ryzen Threadripper 2970WX 10%
Intel Core i7-5960X 13%
...
Geekbench 2 - 32 Bit - Geekbench Total Score
18461 Points (48%)
...
AMD Ryzen 5 1500X -29%
Intel Core i7-4790K -25%
Intel Core i7-7740X -16%
AMD Ryzen 5 1600 -12%
Intel Core i7-6950X 20%
Intel Core i9-7900X 42%
Geekbench 3 - Geekbench 3 32 Bit Multi-Core
23920 points (42%)
Samsung Hummingbird S5PC110 / Exynos 3110 -99%
...
AMD Ryzen 5 1600 -19%
Intel Core i7-9750H -6%
Intel Xeon E5-2680 v4 13%
Intel Core i7-6950X 30%
Geekbench 3 - Geekbench 3 32 Bit Single-Core
3343 points (69%)
Samsung Hummingbird S5PC110 / Exynos 3110 -93%
...
Intel Core i5-4460 -2%
Intel Core i7-6950X 1%
Intel Core i3-8145U 1%
...
Geekbench 3 - Geekbench 3 64 Bit Multi-Core
min: 25002 moyenne: 25451 médian: 25451 (40%) maximum: 25900 points
...
Intel Core i7-3960X -24%
Intel Core i5-8400 -24%
AMD Ryzen 5 1600 -16%
Intel Xeon E5-2680 v4 15%
Intel Core i7-6950X 27%
Intel Core i9-7900X 48%
Geekbench 3 - Geekbench 3 64 Bit Single-Core
min: 3609 moyenne: 3805 médian: 3804.5 (77%) maximum: 4000 points
...
Intel Xeon E3-1230 v3 -3%
Intel Core i7-7700HQ -2%
AMD Ryzen 5 1600 -2%
...
Geekbench 4.0 - Geekbench 4.0 64 Bit Single-Core
min: 4110 moyenne: 4145 médian: 4144.5 (64%) maximum: 4179 points
...
Intel Core i7-5960X -4%
Intel Core i3-8145U -3%
Intel Core i7-6950X -2%
AMD Ryzen 5 1500X 0%
...
Geekbench 4.0 - Geekbench 4.0 64 Bit Multi-Core
min: 18800 moyenne: 19292 médian: 19292 (47%) maximum: 19784 points
...
Intel Core i5-1035G4 -19%
AMD Ryzen 5 1600 -17%
Intel Core i7-4790K -14%
Intel Core i7-7740X -5%
Intel Core i7-1065G7 -3%
Intel Core i5-8400 1%
Intel Xeon E5-2680 v4 10%
...
AMD Ryzen 9 3900 113%
Geekbench 4.1 - 4.4 - Geekbench 4.1 - 4.4 64 Bit Single-Core
3884 points (53%)
...
Intel Core i5-7200U -2%
AMD Ryzen 5 1600 2%
...
Geekbench 4.1 - 4.4 - Geekbench 4.1 - 4.4 64 Bit Multi-Core
18457 points (29%)
...
Intel Core i5-1035G4 -7%
Intel Core i7-4790K -5%
Intel Core i7-1065G7 -4%
Apple A12X Bionic -3%
AMD Ryzen 5 1600 1%
Intel Core i7-7740X 6%
Intel Core i5-8400 11%
...
Mozilla Kraken 1.1 - Kraken 1.1 Total Score *
1054 ms (2%)
...
Intel Core i7-9750H -1%
...
Qualcomm Snapdragon S1 MSM7227A 5542%
Sunspider - Sunspider 1.0 Total Score *
84.6 ms (1%)
...
Intel Core i5-6400 -2%
Intel Core i7-9750H 0%
Apple A14 Bionic 2%
Apple M1 2%
...
Octane V2 - Octane V2 Total Score
32176 Points (51%)
...
Intel Core i5-8265U -3%
Intel Core i7-8650U -3%
Intel Core i7-4790K 2%
...
Apple M1 93%
Power Consumption - Prime95 Power Consumption - external Monitor *
141 Watt (38%)
Nvidia GeForce GTX 1080 Ti Founders Edition Asus Crosshair VI Hero GeForce GTX 1080 Ti 16384 Mo 1683 / MHz 8192Mo 141
...
Intel Core i5-8400 -18%
Intel Core i5-9400F -6%
Intel Core i3-9100F -1%
Intel Core i9-10980HK -1%
AMD Ryzen 5 1500X 4%
Intel Atom x7-Z8750 6%
Intel Core i7-7740X 8%
...
AMD Ryzen Threadripper 2970WX 165%
Power Consumption - Cinebench R15 Multi Power Consumption - external Monitor *
133 Watt (35%)
Nvidia GeForce GTX 1080 Ti Founders Edition Asus Crosshair VI Hero GeForce GTX 1080 Ti 16384 Mo 1683 / MHz 8192Mo 133
...
Intel Core i5-9400F -8%
Intel Core i9-10885H -6%
Intel Core i7-7740X -2%
AMD Ryzen 5 1500X -1%
Intel Atom x7-Z8750 7%
Intel Core i9-10980HK 11%
AMD Ryzen 5 2600 13%
...
AMD Ryzen Threadripper 2970WX 184%
- Amplitude des valeurs obtenues dans le benchmark avec cette carte graphique
- Valeur moyenne obtenue dans le benchmark avec cette carte graphique
* Smaller numbers mean a higher performance
v1.16
log 16. 17:25:42
#0 no ids found in url (should be separated by "_") +0s ... 0s
#1 not redirecting to Ajax server +0s ... 0s
#2 did not recreate cache, as it is less than 5 days old! Created at Tue, 12 Jan 2021 12:44:09 +0100 +0.001s ... 0.001s
#3 no comparison url found in template nbc.compare_page_2 needed +0.004s ... 0.004s
#4 no comparison url found in template nbc.compare_page_2 needed +0s ... 0.004s
#5 composed specs +0s ... 0.004s
#6 did output specs +0s ... 0.005s
#7 getting avg benchmarks for device 8516 +0.001s ... 0.005s
#8 got single benchmarks 8516 +0.01s ... 0.016s
#9 got avg benchmarks for devices +0s ... 0.016s
#10 min, max, avg, median took s +0.328s ... 0.344s
#11 no comparison url found in template nbc.compare_page_2 needed +0s ... 0.344s
#12 return log +0s ... 0.344s
Les autres processeurs de la gamme Ryzen 7 Processeurs similaires + Intel Core i5-8400 6x 2.8 GHz - 4 GHz
+ Intel Core i7-5960X 8x 3 GHz - 3.5 GHz
- AMD Ryzen 5 2600 6x 3.4 GHz - 3.9 GHz
Please share our article, every link counts!
Klaus Hinum (Update: 2018-10-29)