Notebookcheck Logo

Intel Core i7-10710U
Intel i7-10710U

L'Intel Core i7-10710U est un SoC quadricœur basse consommation pour portables basé sur Comet Lake (CML-U) et annoncé en août 2019. Par rapport aux processeurs Whiskey Lake similaires (par exemple le Core i7-8665U), les seules différences sont la prise en charge de mémoire vive plus rapide (DDR4-2666 contre 2400), et deux cœurs supplémentaires dans le modèle le plus puissant. Les cœurs processeur sont cadencés entre 1,1 et 4,7 GHz (3,9 GHz maximum avec les 6 cœurs). Grâce à l'Hyperthreading, 12 threads peuvent être utilisés. Plus d'informations et d'articles sur Comet Lake et les modèles de la série sont disponibles sur notre site.

Grâce à ses deux cœurs supplémentaires et à sa fréquence élevée, les performances de l'i7-10710U sont très bonnes pour sa classe. Il devrait surclasser les meilleurs processeurs Whiskey Lake et Ice Lake si le refroidissement et l'enveloppe thermique ne le limitent pas.

La carte graphique intégrée est cependant toujours la même que sur les générations précédentes. Elle devrait toujours être appelée HD Graphics 620, et monte entre 300 et 1150 MHz dans cet i7. Le SoC intègre également un encodeur / décodeur VP9 et H.265, et un contrôleur mémoire double canal intégré DDR4-2666 / LPDDR4x 2933 / LPDDR3-2133.

La puce est toujours gravée grâce à un procédé en 14 nm++, comme les Whiskey Lake. L'enveloppe thermique (PL1) indiquée est de 15 W, mais le fabricant peut la faire varier entre 12,5 et 25 W (cTDP up / down), ce qui donne des différences de performances (surtout concernant la durée du Turbo). Pour fournir le plus de performances possible, Intel propose un court pic de 90 W (PL4) pour l'i7, soit 8 W de plus que pour les processeurs CML-U quadicœurs, et un énorme 19 W de plus que les Whiskey Lake. De ce fait, certains portables fins avec des CPU CML-U de 15 W ne proposeront pas l'i7, ne pouvant l'alimenter et le refroidir suffisamment pour tirer profit des 6 cœur.

GammeIntel Comet Lake
Nom de codeComet Lake-U

Gamme: Comet Lake Comet Lake-U

Intel Core i7-10810U1.1 - 4.9 GHz6 / 12 cores12 MB L3
Intel Core i7-10710U « 1.1 - 4.7 GHz6 / 12 cores12 MB L3
Intel Core i7-10610U1.8 - 4.9 GHz4 / 8 cores8 MB L3
Intel Core i7-10510U1.8 - 4.9 GHz4 / 8 cores8 MB L3
Intel Core i5-10310U1.7 - 4.4 GHz4 / 8 cores6 MB L3
Intel Core i5-10210U1.6 - 4.2 GHz4 / 8 cores6 MB L3
Intel Core i3-10110U2.1 - 4.1 GHz2 / 4 cores4 MB L3
Intel Pentium Gold 6405U2.4 GHz2 / 4 cores2 MB L3
Intel Celeron 5205U1.9 GHz2 / 2 cores
Fréquence1100 - 4700 MHz
Cache de Niveau 1 (L1)256 KB
Cache de Niveau 2 (L2)1 MB
Cache de Niveau 3 (L3)12 MB
Nombres de cœurs/threads simultanés supportés6 / 12
Consommation énergétique maximale (TDP)15 Watt(s)
Lithographie (procédé de fabrication)14 nm
Température maximale100 °C
SocketBGA1528
FonctionnalitésLPDDR3-2133/DDR4-2666/LPDDR4-2933 RAM, PCIe 3, 4 GT/s bus, MMX, SSE, SSE2, SSE3, SSSE3, SSE4.1, SSE4.2, AVX, AVX2, BMI2, ABM, FMA, ADX, VMX, SMEP, SMAP, MPX, EIST, TM1, TM2, HT, Turbo, SST, AES-NI, RDRAND, RDSEED, SGX
Carte graphiqueIntel UHD Graphics 620 (300 - 1150 MHz)
64 BitPrend en charge les instructions 64 Bit
Architecturex86
Date de présentation09/01/2019
Lien redirigeant vers une page externe du produitark.intel.com

Benchmarks

Performance Rating - CB R15 + R20 + 7-Zip + X265 + Blender + 3DM11 CPU
29.5 pt (49%)
Cinebench R23 - Cinebench R23 Multi Core
4079 Points (4%)
202 -95%
...
3792 -7%
Intel Core i5-1035G4
3800 -7%
3866 -5%
3897 -4%
3930 -4%
3984 -2%
Intel Core i5-1035G1
4027 -1%
4033 -1%
4049 -1%
Intel Core i7-10710U
4079
4112 1%
4311 6%
4657 14%
4724 16%
4880 20%
Intel Core i5-1230U
4911 20%
5022 23%
5049 24%
5110 25%
...
32782 704%
max:
107681 2540%
0%
100%
Cinebench R23 - Cinebench R23 Single Core
863 Points (37%)
74.4 -91%
...
679 -21%
690 -20%
Intel Core i7-2860QM
692 -20%
710 -18%
721 -16%
785 -9%
788 -9%
820 -5%
AMD Ryzen Embedded V1605B
841 -3%
Intel Core i7-10710U
863
874 1%
875 1%
877 2%
881 2%
886 3%
886 3%
AMD Ryzen Embedded R1606G
888 3%
906 5%
971 13%
...
2017 134%
max:
2351 172%
0%
100%
Cinebench R20 - Cinebench R20 CPU (Single Core)
min: 429     moyenne: 457.3     médian: 460 (51%)     maximum: 480 Points
Cinebench R20 - Cinebench R20 CPU (Multi Core)
min: 1181     moyenne: 2012     médian: 2303 (6%)     maximum: 2598 Points
Cinebench R15 - Cinebench R15 CPU Multi 64 Bit
min: 513     moyenne: 957     médian: 1059 (7%)     maximum: 1113 Points
31 -97%
...
865 -10%
884 -8%
892 -7%
895 -6%
896 -6%
922 -4%
923 -4%
929 -3%
946 -1%
Intel Core i7-10710U
957
unknown
1038 8%
Apple M1
1063 11%
Intel Xeon E-2176M
1067 11%
1089 14%
1091 14%
1098 15%
1113 16%
1117 17%
1122 17%
...
5600 485%
max:
15842 1555%
0%
100%
06012018024030036042048054060066072078084090096010201080Tooltip
Cinebench R15 - Cinebench R15 CPU Single 64 Bit
min: 138     moyenne: 174.9     médian: 176 (51%)     maximum: 194 Points
19 -89%
...
172 -2%
172 -2%
172.5 -1%
172.6 -1%
172.8 -1%
173.4 -1%
174 -1%
174 -1%
Intel Core i7-1065G7
174.2 0%
Intel Core i7-10710U
174.9
175.3 0%
175.5 0%
175.5 0%
175.6 0%
175.8 1%
Intel Core i5-1230U
176 1%
176 1%
176.5 1%
177 1%
...
311 78%
max:
346 98%
0%
100%
Cinebench R11.5 - Cinebench R11.5 CPU Multi 64 Bit
min: 10.89     moyenne: 11.7     médian: 11.8 (15%)     maximum: 12.28 Points
Cinebench R11.5 - Cinebench R11.5 CPU Single 64 Bit
min: 2.07     moyenne: 2.1     médian: 2.2 (54%)     maximum: 2.19 Points
Cinebench R10 - Cinebench R10 Rend. Single (32bit)
min: 6599     moyenne: 6972     médian: 6972 (42%)     maximum: 7345 points
Cinebench R10 - Cinebench R10 Rend. Multi (32bit)
min: 31463     moyenne: 31644     médian: 31643.5 (23%)     maximum: 31824 points
wPrime 2.10 - wPrime 2.0 1024m *
min: 171.1     moyenne: 174.3     médian: 174.3 (2%)     maximum: 177.4 s
wPrime 2.10 - wPrime 2.0 32m *
min: 5.103     moyenne: 5.2     médian: 5.2 (1%)     maximum: 5.375 s
WinRAR - WinRAR 4.0
min: 4496     moyenne: 4657     médian: 4656.5 (7%)     maximum: 4817 points
7-Zip 18.03 - 7-Zip 18.03 Multli Thread 4 runs
min: 16713     moyenne: 23912     médian: 24493 (14%)     maximum: 29948 MIPS
7-Zip 18.03 - 7-Zip 18.03 Single Thread 4 runs
min: 4425     moyenne: 4609     médian: 4642 (55%)     maximum: 4727 MIPS
X264 HD Benchmark 4.0 - x264 Pass 2
min: 58.9     moyenne: 60.8     médian: 60.5 (21%)     maximum: 63 fps
X264 HD Benchmark 4.0 - x264 Pass 1
min: 196     moyenne: 202     médian: 204 (47%)     maximum: 206 fps
HWBOT x265 Benchmark v2.2 - HWBOT x265 4k Preset
min: 4.2     moyenne: 5.9     médian: 5.8 (10%)     maximum: 7.95 fps
012345678910111213141516Tooltip
TrueCrypt - TrueCrypt Serpent
min: 0.57     moyenne: 0.7     médian: 0.7 (0%)     maximum: 0.731 GB/s
TrueCrypt - TrueCrypt Twofish
min: 1     moyenne: 1.1     médian: 1.2 (21%)     maximum: 1.2 GB/s
Blender - Blender 2.79 BMW27 CPU *
min: 468.3     moyenne: 649     médian: 618 (4%)     maximum: 892 Seconds
R Benchmark 2.5 - R Benchmark 2.5 *
min: 0.649     moyenne: 0.7     médian: 0.7 (14%)     maximum: 0.674 sec
3DMark 06 - CPU - 3DMark 06 - CPU
10451 Points (22%)
Super Pi mod 1.5 XS 1M - Super Pi mod 1.5 XS 1M *
min: 8     moyenne: 8.4     médian: 8.2 (2%)     maximum: 9.071 s
Super Pi mod 1.5 XS 2M - Super Pi mod 1.5 XS 2M *
min: 17.69     moyenne: 18.7     médian: 18 (1%)     maximum: 20.34 s
Super Pi Mod 1.5 XS 32M - Super Pi mod 1.5 XS 32M *
min: 466     moyenne: 498.7     médian: 507 (2%)     maximum: 523 s
3DMark 11 - 3DM11 Performance Physics
min: 7765     moyenne: 10676     médian: 10696 (29%)     maximum: 13081 Points
3DMark - 3DMark Ice Storm Physics
min: 57889     moyenne: 58101     médian: 58101 (47%)     maximum: 58313 Points
3DMark - 3DMark Ice Storm Extreme Physics
min: 58108     moyenne: 58126     médian: 58126 (47%)     maximum: 58144 Points
3DMark - 3DMark Ice Storm Unlimited Physics
min: 59999     moyenne: 60053     médian: 60052.5 (51%)     maximum: 60106 Points
3DMark - 3DMark Cloud Gate Physics
min: 6463     moyenne: 8852     médian: 9476 (24%)     maximum: 10583 Points
3DMark - 3DMark Fire Strike Standard Physics
min: 9496     moyenne: 13862     médian: 14519 (26%)     maximum: 15892 Points
3DMark - 3DMark Time Spy CPU
min: 3579     moyenne: 4774     médian: 4629.5 (20%)     maximum: 6256 Points
Geekbench 5.5 - Geekbench 5.1 - 5.5 64 Bit Single-Core
min: 1225     moyenne: 1227     médian: 1227 (49%)     maximum: 1229 points
125 -90%
...
1188 -3%
Intel Core i7-9750H
1190 -3%
1191 -3%
1192 -3%
Intel Core i5-1035G1
1195 -3%
1197 -2%
1198 -2%
1202 -2%
1218 -1%
Intel Core i7-10710U
1227
1228 0%
1232 0%
1240 1%
1245 1%
1248 2%
1263 3%
Intel Core i5-1038NG7
1265 3%
1273 4%
Intel Core i7-1065G7
1274 4%
...
2331 90%
max:
2523 106%
0%
100%
Geekbench 5.5 - Geekbench 5.1 - 5.5 64 Bit Multi-Core
min: 4575     moyenne: 5207     médian: 5207 (9%)     maximum: 5839 points
Geekbench 5.0 - Geekbench 5.0 64 Bit Single-Core
min: 1024     moyenne: 1043     médian: 1043 (5%)     maximum: 1062 points
Geekbench 5.0 - Geekbench 5.0 64 Bit Multi-Core
min: 3039     moyenne: 4258     médian: 4258 (13%)     maximum: 5477 points
Geekbench 4.4 - Geekbench 4.1 - 4.4 64 Bit Single-Core
min: 3959     moyenne: 4615     médian: 4615 (46%)     maximum: 5271 points
Geekbench 4.4 - Geekbench 4.1 - 4.4 64 Bit Multi-Core
min: 11871     moyenne: 17420     médian: 17420 (19%)     maximum: 22969 points
Geekbench 4.0 - Geekbench 4.0 64 Bit Single-Core
5366 points (73%)
Geekbench 4.0 - Geekbench 4.0 64 Bit Multi-Core
22182 points (54%)
Geekbench 3 - Geekbench 3 64 Bit Multi-Core
22477 points (35%)
Geekbench 3 - Geekbench 3 64 Bit Single-Core
4309 points (65%)
Mozilla Kraken 1.1 - Kraken 1.1 Total Score *
min: 942     moyenne: 1017     médian: 1041 (1%)     maximum: 1069 ms
Octane V2 - Octane V2 Total Score
min: 35243     moyenne: 37344     médian: 37343.5 (33%)     maximum: 39444 Points
WebXPRT 3 - WebXPRT 3 Score
219 Points (46%)
Power Consumption - Prime95 Power Consumption - external Monitor *
min: 35.6     moyenne: 47.6     médian: 47.2 (8%)     maximum: 60 Watt
051015202530354045505560657075Tooltip
Power Consumption - Cinebench R15 Multi Power Consumption - external Monitor *
min: 35.1     moyenne: 41.1     médian: 41.1 (8%)     maximum: 47.1 Watt
05101520253035404550556065707580Tooltip
Power Consumption - Cinebench R15 Multi Power Efficiency - external Monitor
min: 18.9     moyenne: 20.6     médian: 20.6 (15%)     maximum: 22.3 Points per Watt
- Amplitude des valeurs obtenues dans le benchmark avec cette carte graphique
- Valeur moyenne obtenue dans le benchmark avec cette carte graphique
* Plus les chiffres sont petits, plus les performances sont élevées

v1.28
log 08. 01:33:44

#0 ran 0s before starting gpusingle class +0s ... 0s

#1 no ids found in url (should be separated by "_") +0s ... 0s

#2 not redirecting to Ajax server +0s ... 0s

#3 did not recreate cache, as it is less than 5 days old! Created at Sat, 07 Sep 2024 05:32:05 +0200 +0.001s ... 0.001s

#4 no comparison url found in template nbc.compare_page_2 needed +0.007s ... 0.008s

#5 no comparison url found in template nbc.compare_page_2 needed +0s ... 0.008s

#6 no comparison url found in template nbc.compare_page_2 needed +0s ... 0.008s

#7 no comparison url found in template nbc.compare_page_2 needed +0s ... 0.009s

#8 no comparison url found in template nbc.compare_page_2 needed +0s ... 0.009s

#9 no comparison url found in template nbc.compare_page_2 needed +0s ... 0.009s

#10 no comparison url found in template nbc.compare_page_2 needed +0s ... 0.009s

#11 no comparison url found in template nbc.compare_page_2 needed +0s ... 0.01s

#12 composed specs +0s ... 0.01s

#13 did output specs +0s ... 0.01s

#14 getting avg benchmarks for device 11461 +0.017s ... 0.027s

#15 got single benchmarks 11461 +0.03s ... 0.057s

#16 got avg benchmarks for devices +0s ... 0.057s

#17 min, max, avg, median took s +1.036s ... 1.093s

#18 no comparison url found in template nbc.compare_page_2 needed +0s ... 1.094s

#19 return log +0s ... 1.094s

Critiques du Intel Core i7-10710U processeur

Test de l'ordinateur portable robuste Getac B360 : Écran tactile brillant de 1400 lumens

Test de l'ordinateur portable robuste Getac B360 : Écran tactile brillant de 1400 lumens

Le B360 est l'un des rares ordinateurs portables robustes de 13,3 pouces sur le marché, mais il ne lésine pas sur les fonctionnalités accessibles ou la qualité ...
Intel Core i7-10710U | Intel UHD Graphics 620 | 13.30" | 2.4 kg
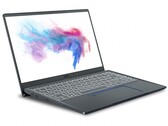
MSI Prestige 14 A10SC-009

Test du MSI Prestige 14 A10SC-009 : Comet Lake pour les créatifs
Le MSI Prestige 14 est un appareil puissant et compact, qui convainc grâce à son allure et ses composants. Nous apprécions également son clavier, avec ses touch...
Intel Core i7-10710U | NVIDIA GeForce GTX 1650 Max-Q | 14.00" | 1.3 kg
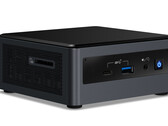
Test de l'Intel Frost Canyon (i7-10710U, UHD 620) : NUC avec 6 coeurs et 12 threads
Test de l'Intel Frost Canyon (i7-10710U, UHD 620) : NUC avec 6 coeurs et 12 threads

Le nouveau NUC10i7FNHAA performant d’Intel possède deux emplacements de stockage, 16 Go de mémoire vivi, et un SoC récent hexacœur, le tout dans un châssis comp...
Intel Core i7-10710U | Intel UHD Graphics 620 | 0.00" | 697 g
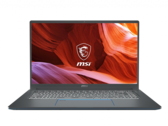
Test du MSI Prestige 15 A10SC (i7-10710U, GTX 1650 Max-Q, 4K UHD) : une des meilleures alternatives au Dell XPS 15
Test du MSI Prestige 15 A10SC (i7-10710U, GTX 1650 Max-Q, 4K UHD) : une des meilleures alternatives au Dell XPS 15

Intel basse consommation et Nvidia basse consommation font un bon duo pour ceux qui recherchent un portable ultrafin performant. Si MSI arrive à gérer les probl...
Intel Core i7-10710U | NVIDIA GeForce GTX 1650 Max-Q | 15.60" | 1.7 kg
Test du Dell XPS 13 7390 (i7-10710U, UHD 620, 4K UHD) : plus puissant que le XPS 15 Core i5

Test du Dell XPS 13 7390 (i7-10710U, UHD 620, 4K UHD) : plus puissant que le XPS 15 Core i5

Après un spectacle impressionnant avec le XPS 13 7390 2-en-1, le XPS 13 clamshell original a besoin qu’on s’intéresse à lui. Et Dell parvient à remettre le XPS ...
Intel Core i7-10710U | Intel UHD Graphics 620 | 13.30" | 1.2 kg

MSI Prestige 14 i7-10710U: NVIDIA GeForce GTX 1650 Max-Q, 14.00", 1.3 kg
  Critique » Test du MSI Prestige 14 (i7-10710U, GTX 1650 Max-Q, 4K UHD) : plus puissant que jamais, et toujours adapté aux créatifs

HP EliteBook x360 1040 G7 1Q6B4ES: Intel UHD Graphics 620, 14.00", 1.4 kg
  Autres tests » HP EliteBook x360 1040 G7 1Q6B4ES

MSI Prestige 15 A10SC-014: NVIDIA GeForce GTX 1650 Max-Q, 15.60", 1.7 kg
  Autres tests » MSI Prestige 15 A10SC-014

HP EliteBook 840 G7-1J6E9EA: Intel UHD Graphics 620, 14.00", 1.5 kg
  Autres tests » HP EliteBook 840 G7-1J6E9EA

MSI Prestige 14 A10SC-067XES: NVIDIA GeForce GTX 1650 Mobile, 14.00", 1.3 kg
  Autres tests » MSI Prestige 14 A10SC-067XES

MSI Prestige 14 A10RB: NVIDIA GeForce MX250, 14.00", 1.3 kg
  Autres tests » MSI Prestige 14 A10RB

Dynabook Satellite Pro L50-G-151: Intel UHD Graphics 620, 15.60", 1.7 kg
  Autres tests » Dynabook Satellite Pro L50-G-151

MSI Prestige 14 A10SC-009: NVIDIA GeForce GTX 1650 Max-Q, 14.00", 1.3 kg
  Autres tests » MSI Prestige 14 A10SC-009

MSI Prestige 14 A10SC-096NE: NVIDIA GeForce GTX 1650 Mobile, 14.00", 1.3 kg
  Autres tests » MSI Prestige 14 A10SC-096NE

MSI Modern 14 A10RB: NVIDIA GeForce MX250, 14.00", 1.2 kg
  Autres tests » MSI Modern 14 A10RB

MSI Prestige 15 A10SC-007ES: NVIDIA GeForce GTX 1650 Mobile, 15.60", 1.7 kg
  Autres tests » MSI Prestige 15 A10SC-007ES

MSI Prestige 14 A10SC-012ES: NVIDIA GeForce GTX 1650 Mobile, 14.00", 1.3 kg
  Autres tests » MSI Prestige 14 A10SC-012ES

MSI Prestige 15 A10SC-008ES: Intel UHD Graphics 620, 15.60", 1.7 kg
  Autres tests » MSI Prestige 15 A10SC-008ES

MSI Prestige 15 A10SC-029NL: NVIDIA GeForce GTX 1650 Max-Q, 15.60", 1.6 kg
  Autres tests » MSI Prestige 15 A10SC-029NL

MSI Prestige 15 A10SC-044XES: NVIDIA GeForce GTX 1650 Max-Q, 15.60", 1.7 kg
  Autres tests » MSI Prestige 15 A10SC-044XES

MSI Prestige 14 A10SC-004NL: NVIDIA GeForce GTX 1650 Max-Q, 14.00", 1.3 kg
  Autres tests » MSI Prestige 14 A10SC-004NL

MSI Prestige 15 A10SC-060XES: NVIDIA GeForce GTX 1650 Max-Q, 15.60", 1.7 kg
  Autres tests » MSI Prestige 15 A10SC-060XES

Dell XPS 13 7390 Core i7-10710U: Intel UHD Graphics 620, 13.30", 1.2 kg
  Autres tests » Dell XPS 13 7390 Core i7-10710U

MSI Prestige 15 A10SC: NVIDIA GeForce GTX 1650 Max-Q, 15.60", 1.7 kg
  Autres tests » MSI Prestige 15 A10SC

MSI Prestige 15 A10SC-011: NVIDIA GeForce GTX 1650 Max-Q, 15.60", 1.6 kg
  Autres tests » MSI Prestige 15 A10SC-011

MSI Prestige 14 i7-10710U: NVIDIA GeForce GTX 1650 Max-Q, 14.00", 1.3 kg
  Autres tests » MSI Prestige 14 i7-10710U

Please share our article, every link counts!

» Comparaison des processeurs pour ordinateur portable
Comparaison de tout les processeurs mobiles


» Processeurs mobiles - liste des benchmarks
Liste des benchmarks de l'intégralité des processeurs pour portables


Les autres processeurs de la gamme Comet Lake

» Intel Core i9-10900K
   10x 3.7 GHz - 5.3 GHz
» Intel Core i9-10850K
   10x 3.6 GHz - 5.2 GHz
» Intel Core i9-10910
   10x 3.6 GHz - 5 GHz
» Intel Core i7-10700K
   8x 3.8 GHz - 5.1 GHz
» Intel Core i7-10700
   8x 2.9 GHz - 4.8 GHz
» Intel Core i9-10980HK
   8x 2.4 GHz - 5.3 GHz
» Intel Xeon W-10885M
   8x 2.4 GHz - 5.3 GHz
» Intel Core i9-10885H
   8x 2.4 GHz - 5.3 GHz
» Intel Core i9-10880H
   8x 2.3 GHz - 5.1 GHz
» Intel Core i7-10875H
   8x 2.3 GHz - 5.1 GHz
» Intel Core i7-10870H
   8x 2.2 GHz - 5 GHz
» Intel Core i5-10600K
   6x 4.1 GHz - 4.8 GHz
» Intel Core i5-10400F
   6x 2.9 GHz - 4.3 GHz
» Intel Core i7-10850H
   6x 2.7 GHz - 5.1 GHz
» Intel Xeon W-10855M
   6x 2.8 GHz - 5.1 GHz
» Intel Core i7-10750H
   6x 2.6 GHz - 5 GHz
» Intel Core i5-10500H
   6x 2.5 GHz - 4.5 GHz
» Intel Core i7-10810U
   6x 1.1 GHz - 4.9 GHz
» Intel Core i7-10710U
   6x 1.1 GHz - 4.7 GHz
» Intel Core i5-10400H
   4x 2.6 GHz - 4.6 GHz
» Intel Core i3-10320
   4x 3.8 GHz - 4.6 GHz
» Intel Core i5-10300H
   4x 2.5 GHz - 4.5 GHz
» Intel Core i5-10200H
   4x 2.4 GHz - 4.1 GHz
» Intel Core i3-10100
   4x 3.6 GHz - 4.3 GHz
» Intel Core i3-10100F
   4x 3.6 GHz - 4.3 GHz
» Intel Core i7-10610U
   4x 1.8 GHz - 4.9 GHz
» Intel Core i7-10510U
   4x 1.8 GHz - 4.9 GHz
» Intel Core i5-10310U
   4x 1.7 GHz - 4.4 GHz
» Intel Core i5-10210U
   4x 1.6 GHz - 4.2 GHz
» Intel Core i3-10110U
   2x 2.1 GHz - 4.1 GHz
» Intel Core i7-10510Y
   4x 1.2 GHz - 4.5 GHz
» Intel Pentium Gold 6405U
   2x 2.4 GHz
» Intel Celeron 5205U
   2x 1.9 GHz

Processeurs similaires

+ AMD Ryzen 5 PRO 7530U
   6x 2 GHz - 4.5 GHz
+ AMD Ryzen 7 4700U
   8x 2 GHz - 4.1 GHz
+ Intel Core i7-1165G7
   4x 2.8 GHz - 4.7 GHz
+ Intel Core i5-1155G7
   4x 2.5 GHz - 4.5 GHz
+ Intel Core i7-10810U
   6x 1.1 GHz - 4.9 GHz
» Intel Core i7-10710U
   6x 1.1 GHz - 4.7 GHz
- Intel Core i5-1235U
   10x 0.9 GHz - 4.4 GHz
- AMD Ryzen 5 5625U
   6x 2.3 GHz - 4.3 GHz
- AMD Ryzen 5 5625C
   6x 2.3 GHz - 4.3 GHz
- AMD Ryzen 5 5600U
   6x 2.3 GHz - 4.2 GHz
- AMD Ryzen 5 PRO 5675U
   6x 2.3 GHz - 4.3 GHz
> Revues et rapports de ordinateurs portatifs et smartphones, ordiphones > FAQ > Processeurs mobiles - indice de référence > Intel Comet Lake i7-10710U Notebook Processor
Klaus Hinum (Update: 2020-03-31)