AMD Ryzen 5 7600X
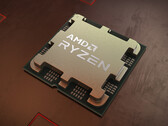
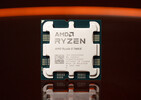
L'AMD Ryzen 5 7600X est un processeur de bureau rapide de milieu de gamme de la série Raphael. Il offre 6 cœurs basés sur l'architecture Zen 4 qui supporte l'hyperthreading (12 threads). Les cœurs tournent à des fréquences allant de 4,7 (base) à 5,7 GHz (boost single core). Lorsque les 6 cœurs sont pleinement sollicités, la vitesse d'horloge maximale est de 5,3 GHz.
Les performances du R5 7600X sont nettement supérieures à celles de l'ancien Ryzen 5 5600X grâce à l'architecture améliorée et au processus moderne de 5 nm. Les performances en single core sont très bonnes grâce à la vitesse d'horloge turbo élevée (-400 MHz par rapport aux CPU haut de gamme comme le Ryzen 9 7950X). La performance multithread n'est bien sûr pas très compétitive en raison des 6 cœurs.
La série Raphael utilise toujours un design en chiplet avec deux clusters CCD (chacun avec 8 cœurs possibles) en 5nm et un IO-die (incluant le contrôleur mémoire et le Radeon Graphics iGPU) en 6nm.
Le R5 7600X a un TDP de 105 watts et Raphael est plutôt gourmand en énergie par rapport à la série 5000.
Gamme AMD Raphael (Zen 4, Ryzen 7000) Nom de code Raphael (Zen4) Gamme: Raphael (Zen 4, Ryzen 7000) Raphael (Zen4) Fréquence 4700 - 5300 MHz Cache de Niveau 1 (L1) 384 KB Cache de Niveau 2 (L2) 6 MB Cache de Niveau 3 (L3) 32 MB Nombres de cœurs/threads simultanés supportés 6 / 12 Consommation énergétique maximale (TDP) 105 Watt(s) Nombre de transistors CCD: 6,5 Mrd + IOD: 3,4 Mrd Million(s) Fonctionnalités 5 nm, 0.650 - 1.475V Taille du Die 1x 70 (CCD) mm2 + 122 (I/O) mm2 Température maximale 95 °C Socket AM5 (LGA 1718) Fonctionnalités MMX(+), SSE, SSE2, SSE3, SSSE3, SSE4.1, SSE4.2, SSE4A, x86-64, AMD-V, AES, AVX, AVX2, AVX512F, FMA3, SHA, Precision Boost 2 Carte graphique AMD Radeon Graphics (Ryzen 7000) (400 - 2200 MHz)64 Bit Prend en charge les instructions 64 Bit Architecture x86 Date de présentation 09/26/2022 Lien redirigeant vers une page externe du produit www.amd.com
Benchmarks Performance Rating - CB R15 + R20 + 7-Zip + X265 + Blender + 3DM11 CPU
44.6 pt (74%)
...
...
Cinebench R23 - Cinebench R23 Multi Core
min: 15006 moyenne: 15252 médian: 15236 (14%) maximum: 15510 Points
...
Intel Core i5-14500
...
Cinebench R23 - Cinebench R23 Single Core
min: 1953 moyenne: 1964 médian: 1965 (84%) maximum: 1967 Points
...
Intel Core i5-14500
...
Intel Core i9-14900
Cinebench R20 - Cinebench R20 CPU (Single Core)
min: 759 moyenne: 761 médian: 761 (85%) maximum: 764 Points
...
Intel Core i5-14500
...
Cinebench R20 - Cinebench R20 CPU (Multi Core)
min: 5882 moyenne: 5973 médian: 5966 (15%) maximum: 6076 Points
...
Intel Core i5-14500
AMD Ryzen Threadripper 2920X
...
Cinebench R15 - Cinebench R15 CPU Multi 64 Bit
min: 2434 moyenne: 2504 médian: 2517 (16%) maximum: 2536 Points
...
Intel Core i5-14500
AMD Ryzen Threadripper 2920X
...
0 130 260 390 520 650 780 910 1040 1170 1300 1430 1560 1690 1820 1950 2080 2210 2340 2470 Tooltip AMD Ryzen 5 7600X (Noctua NH-U9S): Ø2420 (2386.78-2443.49)
AMD Ryzen 5 7600X (Noctua NH-D9L): Ø2434 (2389.34-2468.07)
AMD Ryzen 5 7600X (Noctua NH-L9a-AM5): Ø2364 (2292.79-2470.81)
AMD Ryzen 5 7600X: Ø2468 (2440.21-2487.56)
AMD Ryzen 5 7600X (360er-AiO): Ø2495 (2480.62-2512.09)
AMD Ryzen 5 7600X (Noctua NH-D15): Ø2519 (2509.25-2530.84)
AMD Ryzen 5 7600X (Wakü + MO-RA3 420 Pro): Ø2535 (2528.6-2542.1)
Cinebench R15 - Cinebench R15 CPU Single 64 Bit
min: 311 moyenne: 313.7 médian: 314 (91%) maximum: 315 Points
...
Intel Core i9-14900
...
Cinebench R11.5 - Cinebench R11.5 CPU Multi 64 Bit
min: 27.79 moyenne: 28.3 médian: 28.3 (37%) maximum: 28.69 Points
...
AMD Ryzen Threadripper 2950X
Intel Core i5-13500
Intel Core i5-14500
...
Cinebench R11.5 - Cinebench R11.5 CPU Single 64 Bit
min: 3.68 moyenne: 3.7 médian: 3.7 (91%) maximum: 3.72 Points
...
Intel Core i9-14900
...
Cinebench R10 - Cinebench R10 Rend. Single (32bit)
min: 8212 moyenne: 8455 médian: 8480 (51%) maximum: 8631 points
...
Intel Core i5-1245U
Intel Core i5-12400F
Intel Core i7-1265U
...
Cinebench R10 - Cinebench R10 Rend. Multi (32bit)
min: 48381 moyenne: 49427 médian: 49430 (36%) maximum: 49837 points
...
Intel Core i5-13500
Intel Core i9-7900X
...
Cinebench R10 - Cinebench R10 Rend. Multi (64bit)
min: 88546 moyenne: 90010 médian: 90309 (63%) maximum: 91222 Points
...
...
Cinebench R10 - Cinebench R10 Rend. Single (64bit)
min: 15797 moyenne: 15925 médian: 15948 (19%) maximum: 16010 Points
...
Intel Core i7-12700
Intel Core i5-14500
...
wPrime 2.10 - wPrime 2.0 1024m *
min: 74.491 moyenne: 78.5 médian: 78.8 (1%) maximum: 82.19 s
...
Intel Core i9-7900X
Intel Core i9-14900
...
VIA C3-M C3-M-1200
wPrime 2.10 - wPrime 2.0 32m *
min: 2.709 moyenne: 2.8 médian: 2.8 (1%) maximum: 2.933 s
...
AMD Ryzen 9 3900X
Intel Core i7-12700
Intel Core i9-7900X
AMD Ryzen Threadripper 2920X
...
16178 points (26%)
...
7-Zip 18.03 - 7-Zip 18.03 Multli Thread 4 runs
min: 65569 moyenne: 68816 médian: 69291 (40%) maximum: 70615 MIPS
...
...
7-Zip 18.03 - 7-Zip 18.03 Single Thread 4 runs
min: 7661 moyenne: 7993 médian: 8058 (96%) maximum: 8101 MIPS
...
X264 HD Benchmark 4.0 - x264 Pass 2
147.8 fps (52%)
...
AMD Ryzen Threadripper 2950X
AMD Ryzen 9 3900X
...
X264 HD Benchmark 4.0 - x264 Pass 1
367 fps (85%)
...
Intel Core i9-14900
...
HWBOT x265 Benchmark v2.2 - HWBOT x265 4k Preset
min: 20.2 moyenne: 20.9 médian: 21 (37%) maximum: 21.4 fps
...
AMD Ryzen 9 3900X
...
0 5 10 15 20 25 30 Tooltip AMD Ryzen 5 7600X (Noctua NH-U9S): Ø20.6 (1.45-31.4)
AMD Ryzen 5 7600X (Noctua NH-L9a-AM5): Ø21.1 (1.59-34)
AMD Ryzen 5 7600X (Noctua NH-D9L): Ø21.4 (1.55-33.9)
AMD Ryzen 5 7600X (Noctua NH-D12L): Ø21.5 (1.52-33.2)
AMD Ryzen 5 7600X (360er-AiO): Ø21.5 (1.47-33.1)
AMD Ryzen 5 7600X: Ø21.6 (1.52-33.4)
AMD Ryzen 5 7600X (Noctua NH-U12A): Ø21.7 (1.56-33.9)
AMD Ryzen 5 7600X (Noctua NH-D15): Ø21.7 (1.54-33.9)
AMD Ryzen 5 7600X (Wakü + MO-RA3 420 Pro): Ø21.9 (1.49-33.9)
TrueCrypt - TrueCrypt Serpent
1.1 GB/s (33%)
...
AMD Ryzen 7 3700X
AMD Ryzen 7 7735H
...
TrueCrypt - TrueCrypt Twofish
1.8 GB/s (31%)
...
Intel Core i5-13500T
...
TrueCrypt - TrueCrypt AES
13.2 GB/s (34%)
...
Intel Core i5-14500
...
Blender - Blender 3.3 Classroom CPU *
min: 322 moyenne: 329.6 médian: 328 (4%) maximum: 344 Seconds
...
...
Blender - Blender 2.79 BMW27 CPU *
min: 202 moyenne: 206.1 médian: 205 (1%) maximum: 214 Seconds
...
...
R Benchmark 2.5 - R Benchmark 2.5 *
min: 0.3726 moyenne: 0.4 médian: 0.4 (8%) maximum: 0.395 sec
Intel Core i9-14900
...
3DMark 06 - CPU - 3DMark 06 - CPU
min: 16979 moyenne: 17291 médian: 17290.5 (37%) maximum: 17602 Points
...
...
Super Pi mod 1.5 XS 1M - Super Pi mod 1.5 XS 1M *
7.4 s (2%)
...
Intel Core i5-14500
Intel Core i7-12700
AMD Ryzen 7 7735H
...
VIA C3-M C3-M-1200
Super Pi mod 1.5 XS 2M - Super Pi mod 1.5 XS 2M *
16 s (1%)
...
Intel Core i5-11500B
...
Super Pi Mod 1.5 XS 32M - Super Pi mod 1.5 XS 32M *
367.1 s (2%)
...
Intel Core i5-1230U
Intel Core i5-11500B
...
VIA C3-M C3-M-1200
3DMark Vantage - 3DM Vant. Perf. CPU no Physx
min: 82479 moyenne: 83000 médian: 82999.5 (73%) maximum: 83520 Points
...
Intel Core i9-14900
...
3DMark 11 - 3DM11 Performance Physics
min: 25396 moyenne: 25731 médian: 25731 (70%) maximum: 26066 Points
...
Intel Core i7-12700
Intel Core i9-14900
...
3DMark - 3DMark Ice Storm Physics
min: 92244 moyenne: 98319 médian: 98318.5 (80%) maximum: 104393 Points
Samsung Hummingbird S5PC110 / Exynos 3110
...
...
3DMark - 3DMark Ice Storm Extreme Physics
min: 92907 moyenne: 98466 médian: 98466 (80%) maximum: 104025 Points
...
...
3DMark - 3DMark Ice Storm Unlimited Physics
min: 94868 moyenne: 99772 médian: 99772 (84%) maximum: 104676 Points
Qualcomm Snapdragon S4 Play MSM8625Q
...
Intel Core i7-12700
Intel Core i5-14500
3DMark - 3DMark Cloud Gate Physics
min: 19327 moyenne: 19377 médian: 19377 (49%) maximum: 19427 Points
...
...
3DMark - 3DMark Fire Strike Standard Physics
min: 30671 moyenne: 30681 médian: 30681 (55%) maximum: 30691 Points
...
...
3DMark - 3DMark Time Spy CPU
min: 10458 moyenne: 10645 médian: 10645 (45%) maximum: 10832 Points
...
Intel Core i9-7900X
AMD Ryzen Threadripper 2920X
AMD Ryzen 9 3900
...
Intel Core i9-14900
Geekbench 5.5 - Geekbench 5.1 - 5.5 64 Bit Single-Core
min: 2159 moyenne: 2212 médian: 2217 (88%) maximum: 2230 points
...
Intel Core i9-14900
Apple A18
...
Geekbench 5.5 - Geekbench 5.1 - 5.5 64 Bit Multi-Core
min: 11093 moyenne: 11914 médian: 12003 (22%) maximum: 12185 points
...
AMD Ryzen Threadripper 1950X
...
Geekbench 5.0 - Geekbench 5.0 64 Bit Single-Core
min: 2070 moyenne: 2120 médian: 2126 (9%) maximum: 2137 points
...
Intel Core i9-14900
...
Geekbench 5.0 - Geekbench 5.0 64 Bit Multi-Core
min: 11123 moyenne: 11886 médian: 11982 (38%) maximum: 12112 points
...
AMD Ryzen 9 3900X
...
Geekbench 4.4 - Geekbench 4.1 - 4.4 64 Bit Single-Core
min: 8596 moyenne: 8967 médian: 9021 (90%) maximum: 9048 points
...
Intel Core i9-14900
...
Geekbench 4.4 - Geekbench 4.1 - 4.4 64 Bit Multi-Core
min: 45422 moyenne: 47461 médian: 47694 (52%) maximum: 48205 points
...
...
Mozilla Kraken 1.1 - Kraken 1.1 Total Score *
min: 441 moyenne: 447.8 médian: 448 (1%) maximum: 451 ms
...
Apple M2
Apple A15 Bionic
...
WebXPRT 4 - WebXPRT 4 Score
min: 295 moyenne: 298.3 médian: 298 (86%) maximum: 302 Points
...
...
WebXPRT 3 - WebXPRT 3 Score
min: 356 moyenne: 373.3 médian: 370.5 (77%) maximum: 395 Points
...
Apple M2
...
CrossMark - CrossMark Overall
min: 2104 moyenne: 2186 médian: 2193 (84%) maximum: 2256 Points
...
Intel Core i9-14900
...
Power Consumption - Prime95 Power Consumption - external Monitor *
227 Watt (39%)
...
Intel Core i7-4790K
Intel Core i7-6950X
Intel Core i9-7900X
Intel Core i5-12400F
...
0 15 30 45 60 75 90 105 120 135 150 165 180 195 210 225 240 Tooltip AMD Ryzen 5 7600X: Ø227 (218-245)
Power Consumption - Cinebench R15 Multi Power Consumption - external Monitor *
215 Watt (39%)
...
AMD Ryzen 9 3900X
...
0 15 30 45 60 75 90 105 120 135 150 165 180 195 210 225 240 255 Tooltip AMD Ryzen 5 7600X: Ø215 (134.8-259)
Power Consumption - Idle Power Consumption - external Monitor *
91.5 Watt (61%)
...
Intel Core i7-12700
Intel Core i5-12400F
...
0 5 10 15 20 25 30 35 40 45 50 55 60 65 70 75 80 85 90 95 Tooltip AMD Ryzen 5 7600X: Ø91.5 (90-97.4)
Power Consumption - Cinebench R15 Multi Power Efficiency - external Monitor
11.7 Points per Watt (9%)
...
Intel Core i5-11400T
Intel Core i7-7700HQ
AMD Ryzen Threadripper 2970WX
AMD Ryzen Threadripper 2950X
AMD Ryzen 7 3700X
...
- Amplitude des valeurs obtenues dans le benchmark avec cette carte graphique
- Valeur moyenne obtenue dans le benchmark avec cette carte graphique
* Plus les chiffres sont petits, plus les performances sont élevées
v1.28
log 03. 01:28:01
#0 ran 0s before starting gpusingle class +0s ... 0s
#1 no ids found in url (should be separated by "_") +0s ... 0s
#2 not redirecting to Ajax server +0s ... 0s
#3 did not recreate cache, as it is less than 5 days old! Created at Tue, 01 Oct 2024 05:31:39 +0200 +0.001s ... 0.001s
#4 no comparison url found in template nbc.compare_page_2 needed +0.006s ... 0.007s
#5 no comparison url found in template nbc.compare_page_2 needed +0s ... 0.007s
#6 no comparison url found in template nbc.compare_page_2 needed +0s ... 0.007s
#7 no comparison url found in template nbc.compare_page_2 needed +0s ... 0.008s
#8 no comparison url found in template nbc.compare_page_2 needed +0s ... 0.008s
#9 no comparison url found in template nbc.compare_page_2 needed +0s ... 0.008s
#10 no comparison url found in template nbc.compare_page_2 needed +0s ... 0.008s
#11 composed specs +0s ... 0.009s
#12 did output specs +0s ... 0.009s
#13 getting avg benchmarks for device 14615 +0.018s ... 0.026s
#14 got single benchmarks 14615 +0.019s ... 0.045s
#15 got avg benchmarks for devices +0s ... 0.045s