AMD Radeon RX 6600M
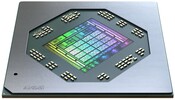
L'AMD Radeon RX 6600M est une carte graphique mobile de milieu de gamme basée sur la puce Navi 23 (architecture RDNA 2) fabriquée selon le processus moderne de 7 nm. Elle est dotée de 1 792 cœurs (28 CUs - compute units) et de 8 Go de mémoire graphique rapide GDDR6 connectés à un bus mémoire de 128 bits. La puce comprend également un cache Infinity de 32 Mo. La vitesse d'horloge des cœurs dépendra de l'ordinateur portable, selon AMD. La consommation d'énergie (paramètres TDP) varie de 50 à 100 Watt avec différentes vitesses d'horloge (similaire à Nvidia).
À 100 watts, l'horloge du jeu atteint 2177 MHz et les performances devraient être similaires à celles d'une RTX 3060 pour les ordinateurs portables. Lorsque les effets de Raytracing sont activés, il se retrouve derrière les GPU GeForce.
La puce Navi 21 est fabriquée par TSMC selon le procédé moderne de 7 nm.
Radeon RX 6000M Gamme
| ||||||||||||||||||||||||||||||||||||||||||||||
| Nom de code | R21M-E65-70 | |||||||||||||||||||||||||||||||||||||||||||||
| Architecture | RDNA 2 | |||||||||||||||||||||||||||||||||||||||||||||
| Pipelines | 1792 - unifiés | |||||||||||||||||||||||||||||||||||||||||||||
| TMUs | 112 | |||||||||||||||||||||||||||||||||||||||||||||
| ROPs | 64 | |||||||||||||||||||||||||||||||||||||||||||||
| Raytracing Cores | 28 | |||||||||||||||||||||||||||||||||||||||||||||
| Fréquence du noyau interne | 2068 - 2177 (Boost) MHz | |||||||||||||||||||||||||||||||||||||||||||||
| Theoretical Performance | 17.32 TFLOPS FP16, 8.66 TFLOPS FP32, 0.54 TFLOPS FP64 | |||||||||||||||||||||||||||||||||||||||||||||
| Cache | L2: 2 Mo, L3: 32 Mo | |||||||||||||||||||||||||||||||||||||||||||||
| Fréquence de la mémoire | 14000 effective = 1750 MHz | |||||||||||||||||||||||||||||||||||||||||||||
| Largeur du bus mémoire | 128 Bit | |||||||||||||||||||||||||||||||||||||||||||||
| Type de mémoire | GDDR6 | |||||||||||||||||||||||||||||||||||||||||||||
| Quantité maximale possible de mémoire embarquée | 8 GB | |||||||||||||||||||||||||||||||||||||||||||||
| Mémoire partagée | non | |||||||||||||||||||||||||||||||||||||||||||||
| Memory Bandwidth | 224 GB/s | |||||||||||||||||||||||||||||||||||||||||||||
| API | DirectX 12, Shader 6.4, OpenGL 4.6, OpenCL 2.1, Vulkan 1.3 | |||||||||||||||||||||||||||||||||||||||||||||
| Consommation d'énergie | 100 Watt(s) (50 - 100 Watt(s) TGP) | |||||||||||||||||||||||||||||||||||||||||||||
| Nombre de transistors | 11.1 Billion | |||||||||||||||||||||||||||||||||||||||||||||
| Taille de la matrice | 237 mm² | |||||||||||||||||||||||||||||||||||||||||||||
| technologie | 7 nm | |||||||||||||||||||||||||||||||||||||||||||||
| PCIe | 4.0 | |||||||||||||||||||||||||||||||||||||||||||||
| Displays | HDMI 2.0b, DisplayPort 1.4 | |||||||||||||||||||||||||||||||||||||||||||||
| Caractéristiques | DisplayPort 1.4 w/DFSC, HDMI 2.0b, Radeon Media Engine (H.264 4K150 decode, 4K90 encode / H.265 4K90 decode, 4K60 encode / VP9 4K90 decode), Resizable BAR, Ray Tracing | |||||||||||||||||||||||||||||||||||||||||||||
| Dimension de l'ordinateur portable | de taille moyenne | |||||||||||||||||||||||||||||||||||||||||||||
| Date de présentation | 01.09.2020 | |||||||||||||||||||||||||||||||||||||||||||||
| Lien redirigeant vers la page du fabricant | www.amd.com | |||||||||||||||||||||||||||||||||||||||||||||
| Predecessor | Radeon RX 5600M | |||||||||||||||||||||||||||||||||||||||||||||
Benchmarks
3DM Vant. Perf. total +
specvp12 sw-03 +
Cinebench R15 OpenGL 64 Bit +
* Plus les chiffres sont petits, plus les performances sont élevées
Benchmarks de jeux
Les benchmarks qui suivent sont tirés de tests effectués dans nos critiques des ordinateurs portables. Les performances dépendent du type et de la quantité de mémoire graphique embaquée, mais aussi de sa fréquence, du processeur, des paramètres système, des pilotes et du système d'exploitation. Les résultats ne sont donc pas représentatifs de tous les appareils intégrant cette carte graphique. Pour plus de détails sur les résultats, cliquez sur le nombre d'images par seconde.

Alan Wake 2
2023
Lords of the Fallen
2023
Total War Pharaoh
2023
Cyberpunk 2077
2023
Baldur's Gate 3
2023
Lies of P
2023
Starfield
2023
Armored Core 6
2023
Immortals of Aveum
2023
Atlas Fallen
2023
F1 23
2023
Diablo 4
2023
Dead Island 2
2023
The Last of Us
2023
Company of Heroes 3
2023
Sons of the Forest
2023
Atomic Heart
2023
Returnal
2023
Hogwarts Legacy
2023
Dead Space Remake
2023
The Witcher 3 v4
2023
High On Life
2023
FIFA 23
2022
The Quarry
2022
F1 22
2022
Vampire Bloodhunt
2022
Ghostwire Tokyo
2022
Cyberpunk 2077 1.6
2022
Elex 2
2022
GRID Legends
2022
Elden Ring
2022
Dying Light 2
2022
God of War
2022
Halo Infinite
2021
Farming Simulator 22
2021
Forza Horizon 5
2021
Riders Republic
2021
Back 4 Blood
2021
Far Cry 6
2021
Alan Wake Remastered
2021
New World
2021
Deathloop
2021
F1 2021
2021
Days Gone
2021
Outriders
2021
Hitman 3
2021
Cyberpunk 2077 1.0
2020
Dirt 5
2020
Watch Dogs Legion
2020
Horizon Zero Dawn
2020
Death Stranding
2020
F1 2020
2020
Doom Eternal
2020
Borderlands 3
2019
Control
2019
Anno 1800
2019
Far Cry New Dawn
2019
Metro Exodus
2019
Forza Horizon 4
2018
Far Cry 5
2018
X-Plane 11.11
2018
Dota 2 Reborn
2015
The Witcher 3
2015
GTA V
2015
BioShock Infinite
2013| Bas | Moyen | Élevé | Ultra | QHD | 4K | |
|---|---|---|---|---|---|---|
| Alan Wake 2 | 52.4 | 44.1 | 40.6 | 25.2 | 12.6 | |
| Lords of the Fallen | 66.4 | 56 | 38.7 | 26.5 | 17 | 7.64 |
| Total War Pharaoh | 286.2 | 186.4 | 112.6 | 91.4 | 59.2 | 27.4 |
| Assassin's Creed Mirage | 103 | 91 | 84 | 64 | 48 | 25 |
| Cyberpunk 2077 | 105.6 | 80.7 | 66.1 | 60.8 | 36.2 | 16 |
| Baldur's Gate 3 | 114.4 | 91.8 | 74.8 | 72.9 | 48.6 | 23.7 |
| Lies of P | 134.2 | 126 | 106.3 | 95.5 | 59.6 | 28.7 |
| Starfield | 58 | 50 | 40 | 36 | 28 | 17 |
| Armored Core 6 | 74.9 | 72.6 | 69 | 68.9 | 52.3 | 31.2 |
| Immortals of Aveum | 61.1 | 49.8 | 36.6 | 23.8 | 11.5 | |
| Atlas Fallen | 104.4 | 102.5 | 93.2 | 69.1 | 48.6 | 23.1 |
| Ratchet & Clank Rift Apart | 62.8 | 59 | 47 | 39.4 | 34.9 | 30 |
| F1 23 | 264 | 240 | 168.7 | 31.3 | 19.1 | 8.43 |
| Diablo 4 | 206 | 179.2 | 159.4 | 120.6 | 75 | 39 |
| Star Wars Jedi Survivor | 66 | 58 | 54 | 51 | 30 | 15 |
| Dead Island 2 | 196 | 171 | 129 | 107 | 70 | 34 |
| The Last of Us | 80 | 66 | 57 | 44 | 27 | 11 |
| Resident Evil 4 Remake | 114 | 90 | 79 | 51 | 38 | 17 |
| Company of Heroes 3 | 127 | 113 | 85 | 84 | 60 | 34 |
| Sons of the Forest | 78 | 74 | 71 | 69 | 50 | 27 |
| Atomic Heart | 161 | 113 | 67 | 52 | 39 | 23 |
| Returnal | 88 | 85 | 76 | 62 | 44 | 23 |
| Hogwarts Legacy | 100.3 | 86 | 68 | 52 | 36 | 19 |
| Dead Space Remake | 66 | 62 | 52 | 50 | 31 | 11 |
| The Witcher 3 v4 | 149.3 | 115 | 101 | 83 | 55 | 29 |
| High On Life | 181 | 136 | 104 | 82 | 47 | 20 |
| The Callisto Protocol | 129 | 92 | 69 | 57 | 41 | 24 |
| Need for Speed Unbound | 127 | 103 | 82 | 72 | 50 | 28 |
| Spider-Man Miles Morales | 94 | 81 | 77 | 68 | 48 | 26 |
| Call of Duty Modern Warfare 2 2022 | 113 | 115 | 84 | 77 | 54 | 29 |
| Uncharted Legacy of Thieves Collection | 79 | 74 | 68 | 65 | 41 | 18 |
| A Plague Tale Requiem | 88 | 62 | 49 | 40 | 29 | 17 |
| FIFA 23 | 170.4 | 137 | 134 | 133 | 107 | 57 |
| The Quarry | 118 | 92 | 74 | 52 | 34 | 13 |
| F1 22 | 243 | 225 | 177 | 41 | 25 | 12 |
| Vampire Bloodhunt | 169.1 | 158.7 | 157.7 | |||
| Ghostwire Tokyo | 115.1 | 113.2 | 112 | |||
| Tiny Tina's Wonderlands | 186 | 143 | 91 | 70 | 49 | 21 |
| Cyberpunk 2077 1.6 | 98 | 82 | 67 | 59 | 39 | 19 |
| Elex 2 | 71 | 71 | 67 | 64 | 58 | |
| GRID Legends | 190 | 171 | 141 | 116 | 94 | 56 |
| Elden Ring | 60 | 60 | 60 | |||
| Dying Light 2 | 105 | 78 | 62 | |||
| Rainbow Six Extraction | 141 | 126 | 120 | 94 | ||
| God of War | 90 | 84 | 74 | 55 | 44 | 26 |
| Halo Infinite | 60.7 | 55.6 | 53.9 | |||
| Farming Simulator 22 | 182 | 134 | 118 | 112 | 110.9 | 65.4 |
| Forza Horizon 5 | 181 | 126 | 117 | 70 | 54 | 33 |
| Riders Republic | 89 | 83 | 77 | 76 | ||
| Guardians of the Galaxy | 104 | 102 | 101 | 101 | 100 | 58 |
| Back 4 Blood | 189 | 172 | 124 | |||
| Far Cry 6 | 115 | 97 | 88 | 76 | 65 | 9 |
| Alan Wake Remastered | 124 | 121 | ||||
| New World | 113.7 | 85 | 78 | 70 | 52.4 | 31.3 |
| Deathloop | 98 | 80.9 | 58.8 | |||
| F1 2021 | 318 | 243 | 198 | 92 | 65 | 33 |
| Days Gone | 103.1 | 97.9 | 76.7 | |||
| Resident Evil Village | 170.7 | 168.7 | 146 | |||
| Outriders | 92.9 | 90.2 | 88.7 | |||
| Hitman 3 | 154 | 147 | 140 | |||
| Cyberpunk 2077 1.0 | 125 | 68.6 | 56.1 | 46.4 | ||
| Assassin´s Creed Valhalla | 155 | 95 | 79 | 69 | 52 | 27 |
| Dirt 5 | 160 | 101 | 77 | 63 | 55 | 40 |
| Watch Dogs Legion | 120.6 | 119.7 | 107.4 | 59 | 41.6 | 21.4 |
| Mafia Definitive Edition | 107 | 88 | 81 | 57.7 | 27.3 | |
| Horizon Zero Dawn | 171 | 124 | 106 | 89 | 66 | 34 |
| Death Stranding | 134 | 122 | 115 | 111 | ||
| F1 2020 | 304 | 229 | 194 | 133 | 98 | 54 |
| Doom Eternal | 309 | 160 | 148 | 144 | ||
| Borderlands 3 | 116 | 101 | 85 | 65 | 45 | 24 |
| Control | 215 | 99 | 70 | 45 | 22 | |
| Anno 1800 | 109.6 | 96.7 | 79.6 | 47 | 37.3 | 20.3 |
| Far Cry New Dawn | 104 | 92 | 88 | 84 | 84 | 48 |
| Metro Exodus | 192 | 103 | 76 | 60 | 47 | 28 |
| Assassin´s Creed Odyssey | 120 | 108 | 106 | 79 | 51 | 29 |
| Forza Horizon 4 | 227 | 202 | 199 | 168 | 128 | 74 |
| Shadow of the Tomb Raider | 152 | 126 | 119 | 105 | 68 | 32 |
| Strange Brigade | 373 | 208 | 173 | 152 | 100 | 52 |
| Far Cry 5 | 128 | 112 | 107 | 100 | 88 | 44 |
| X-Plane 11.11 | 70 | 55 | 46 | 29 | ||
| Final Fantasy XV Benchmark | 180 | 107 | 79 | 56 | 30 | |
| Assassin´s Creed Origins | 109 | 107 | 107 | 85 | 68 | 37 |
| Rise of the Tomb Raider | 236 | 179 | 120 | 97 | 42 | |
| Dota 2 Reborn | 146 | 125 | 118 | 101 | 81 | |
| The Witcher 3 | 322 | 238 | 141 | 84 | 61.6 | 44 |
| GTA V | 172 | 161 | 144 | 79 | 59 | 58 |
| BioShock Infinite | 379.8 | 316.8 | 291 | 162.9 | ||
| Bas | Moyen | Élevé | Ultra | QHD | 4K | < 30 fps < 60 fps < 120 fps ≥ 120 fps | 2 34 40 | 6 49 30 | 12 54 21 | 1 21 47 11 | 8 40 17 2 | 42 23 3 |
Pour plus de jeux susceptibles d'être fluides avec cette carte graphique et obtenir une liste exhaustive de tous les jeux et cartes graphiques testés, consultez notre liste des jeux.
Testés dans les ordinateurs portables : AMD Radeon RX 6600M carte graphique

Test du Minisforum Neptune HX99G : PC de jeu compact avec AMD Ryzen 9 6900HX et Radeon RX 6600M, USB4 et Thunderbolt
Test du Minisforum HX90G : PC de jeu compact avec AMD Ryzen 9 5900HX et Radeon RX 6600M
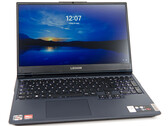
Test du Lenovo Legion 5 15 : la nouvelle Radeon RX 6600M d'AMD rencontre le Ryzen 5 5600H
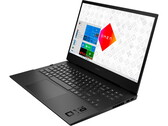
Test du HP Omen 16 : pour ce PC portable de jeu, "less is more"
MSI Alpha 15 B5EEK-008: AMD Ryzen 7 5800H, 15.60", 2.4 kg
Critique » Test du MSI Alpha 15 : Ryzen 7 5800H et Radeon RX 6600M pour les jeux 1080p grand public
MSI Alpha 15 B5EEK: AMD Ryzen 5 5600H, 15.60", 2.4 kg
Autres tests » MSI Alpha 15 B5EEK
HP Omen 16-c0026ns: AMD Ryzen 7 5800H, 16.10", 2.3 kg
Autres tests » HP Omen 16-c0026ns
HP Omen 16-c0075ng: AMD Ryzen 7 5800H, 16.10", 2.3 kg
Autres tests » HP Omen 16-c0075ng
MSI Alpha 15 B5EEK-008: AMD Ryzen 7 5800H, 15.60", 2.4 kg
Autres tests » MSI Alpha 15 B5EEK-008
Lenovo Legion 5 15ACH6A-82NW0037GE: AMD Ryzen 7 5800H, 15.60", 2.4 kg
Autres tests » Lenovo Legion 5 15ACH6A-82NW0037GE
HP Omen 16-c0007ns: AMD Ryzen 9 5900HX, 16.10", 2.3 kg
Autres tests » HP Omen 16-c0007ns
HP Omen 16-c0099AX: AMD Ryzen 9 5900HX, 16.10", 2.3 kg
Autres tests » HP Omen 16-c0099AX
MSI Alpha 15 B5EEK-008: AMD Ryzen 7 5800H, 15.60", 2.4 kg
Autres tests » MSI Alpha 15 B5EEK-008
HP Omen 16-c0077ng: AMD Ryzen 7 5800H, 16.10", 2.3 kg
» AMD Ryzen déchaîné : l'ordinateur portable de jeu HP Omen 16 en revue


