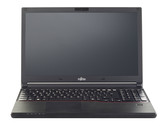
Courte critique du PC portable Fujitsu Lifebook E544
Intel Core i5-4210M | Intel HD Graphics 4600 | 14.00" | 2.1 kg

Le Intel HD Graphics 4600 (GT2) est un GPU qui se retrouve sur certains processeurs Haswell de 2013. la fréquence de base peut être overclockée avec la technologie Turbo Boost. Selon le modèle du processeur, la fréquence de base et la fréquence turbo varient énormément ce qui détermine en grande partie les performances du coté graphique.
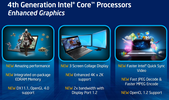
Comparé à la HD 4000, la partie graphique a été considérablement modifiée. Le GPU supporte maintenant DirectX 11.1, OpenCL 1.2 et OpenGL 4.0. Il possède aussi un décodeur amélioré pour les vidéos 4K et le puissant encodeur Quick Sync.
Selon les benchmarks de chez Intel dans 3DMark 11, la HD Graphics 4600 sera 60 % plus rapide que la génération précédente de HD 4000. Dans nos benchmarks de jeux, l'amélioration se mesure autour de 30%. Ce boost de performances est accomplit par des améliorations architecturales avec un nombre plus élevé d'unités d'exécution: La version GT2 intègre 20 EU, comparé aux 16 EUs pour la old HD 4000. Donc, la HD 4600 dépasse certains GPU dédiées comme les GeForce GT 620M/630M, et se met au coude à coude avec des GPU assez puissants comme la Radeon HD 8650G.
Avec son procédé de fabrication en 22nm de type 3D Tri-Gate la consommation devrait être relativement basse. La HD Graphics 4600 peut se trouver sur les processeurs dual et quad-core de la génération Haswell dans une fourchette entre 37 et 57 Watts de TDP.
HD Graphics Gamme
| ||||||||||||||||||||||||||||||||||||||||||||||||||||||||||||||||||||||
| Nom de code | Haswell GT2 | |||||||||||||||||||||||||||||||||||||||||||||||||||||||||||||||||||||
| Architecture | Gen. 7.5 Haswell | |||||||||||||||||||||||||||||||||||||||||||||||||||||||||||||||||||||
| Pipelines | 20 - unifiés | |||||||||||||||||||||||||||||||||||||||||||||||||||||||||||||||||||||
| Fréquence du noyau interne | 200 - 1350 (Boost) MHz | |||||||||||||||||||||||||||||||||||||||||||||||||||||||||||||||||||||
| Largeur du bus mémoire | 64/128 Bit | |||||||||||||||||||||||||||||||||||||||||||||||||||||||||||||||||||||
| Mémoire partagée | oui | |||||||||||||||||||||||||||||||||||||||||||||||||||||||||||||||||||||
| API | DirectX 11.1, Shader 5.0, OpenGL 4.0 | |||||||||||||||||||||||||||||||||||||||||||||||||||||||||||||||||||||
| technologie | 22 nm | |||||||||||||||||||||||||||||||||||||||||||||||||||||||||||||||||||||
| Caractéristiques | QuickSync | |||||||||||||||||||||||||||||||||||||||||||||||||||||||||||||||||||||
| Date de présentation | 01.06.2013 | |||||||||||||||||||||||||||||||||||||||||||||||||||||||||||||||||||||
| ||||||||||||||||||||||||
Les benchmarks qui suivent sont tirés de tests effectués dans nos critiques des ordinateurs portables. Les performances dépendent du type et de la quantité de mémoire graphique embaquée, mais aussi de sa fréquence, du processeur, des paramètres système, des pilotes et du système d'exploitation. Les résultats ne sont donc pas représentatifs de tous les appareils intégrant cette carte graphique. Pour plus de détails sur les résultats, cliquez sur le nombre d'images par seconde.


Pour plus de jeux susceptibles d'être fluides avec cette carte graphique et obtenir une liste exhaustive de tous les jeux et cartes graphiques testés, consultez notre liste des jeux.


Fujitsu LifeBook E744: Intel Core i7-4702MQ, 14.00", 1.7 kg
Critique » Mise à jour de la courte critique du PC portable Fujitsu LifeBook E744 (E7440MXP11DE)
Fujitsu Lifebook E734: Intel Core i5-4200M, 13.30", 1.7 kg
Critique » Mise à jour de la courte critique du PC portable Fujitsu Lifebook E734 (E7340MXEA1DE)
Lenovo G510-59416358: Intel Core i5-4200M, 15.60", 2.5 kg
Critique » Courte critique du PC portable Lenovo G510
Lenovo ThinkPad L540 20AV002YGE: Intel Core i5-4200M, 15.60", 2.3 kg
Critique » Courte critique du PC portable Lenovo ThinkPad L540 20AV002YGE
HP ProBook 640 G1 H5G66ET: Intel Core i5-4200M, 14.00", 2.1 kg
Critique » Courte critique du PC portable HP ProBook 640 G1 H5G66ET
Fujitsu LifeBook A544: Intel Core i5-4200M, 15.60", 2.2 kg
Critique » Courte critique du PC portable Fujitsu LifeBook A544
Lenovo ThinkPad Edge E540 20C60041: Intel Core i3-4000M, 15.60", 2.5 kg
Critique » Courte critique du PC portable Lenovo ThinkPad Edge E540 20C60041
HP ProBook 650 G1 H5G74E: Intel Core i3-4000M, 15.60", 2.3 kg
Critique » Courte critique du PC portable HP ProBook 650 G1 H5G74E
Lenovo Thinkpad L440: Intel Core i5-4330M, 14.00", 2.3 kg
Critique » Courte critique du PC portable Lenovo ThinkPad L440
Nexoc B509II Ultra: Intel Core i7-4702MQ, 15.60", 2.2 kg
Critique » Courte critique du PC portable Nexoc B509II Ultra (Clevo W550SU)
Toshiba Satellite P75-A7200: Intel Core i7-4700MQ, 17.30", 2.9 kg
Critique » Courte critique du PC portable Toshiba Satellite P75-A7200
Fujitsu LifeBook E744: Intel Core i5-4200M, 14.00", 1.8 kg
Autres tests » Fujitsu LifeBook E744
Toshiba Portege R30-A-17H: Intel Core i3-4100M, 13.30", 1.5 kg
Autres tests » Toshiba Portege R30-A-17H
Asus ASUSPRO Advanced B451JA-WO076G: Intel Core i5-4210M, 14.00", 2.2 kg
Autres tests » Asus ASUSPRO Advanced B451JA-WO076G
Toshiba Portege R30-A-17R: Intel Core i5-4210M, 13.30", 1.5 kg
Autres tests » Toshiba Portege R30-A-17R
Fujitsu LifeBook T734: Intel Core i5-4200M, 12.50", 2 kg
Autres tests » Fujitsu LifeBook T734
MSI CR70 2M: Intel Core i3-4100M, 17.30", 2.7 kg
Autres tests » MSI CR70 2M
Medion Akoya E6241-MD98562: Intel Core i3-4100M, 15.60", 2.4 kg
Autres tests » Medion Akoya E6241-MD98562
Lenovo ThinkPad L540-20AU002QGE: Intel Core i5-4330M, 15.60", 2.5 kg
Autres tests » Lenovo ThinkPad L540-20AU002QGE
Fujitsu Lifebook E544: Intel Core i5-4210M, 14.00", 2.1 kg
Autres tests » Fujitsu Lifebook E544
Fujitsu LifeBook A544: Intel Core i5-4200M, 15.60", 2.2 kg
Autres tests » Fujitsu LifeBook A544
Fujitsu LifeBook E554: Intel Core i5-4210M, 15.60", 2.3 kg
Autres tests » Fujitsu LifeBook E554
Asus K750JA: Intel Core i7-4700HQ, 17.30", 3.1 kg
Autres tests » Asus K750JA
HP ProBook 640-F1Q08ES: Intel Core i7-4702MQ, 14.00", 2 kg
Autres tests » HP ProBook 640-F1Q08ES
Toshiba Portege R30-A-15C: Intel Core i7-4600M, 13.30", 1.4 kg
Autres tests » Toshiba Portege R30-A-15C
Samsung 940X5J-K01US: Intel Core i5-4200U, 15.60", 1.8 kg
Autres tests » Samsung 940X5J-K01US
Toshiba Portege R30-A-13C: Intel Core i5-4200M, 13.30", 1.5 kg
Autres tests » Toshiba Portege R30-A-13C
Lenovo G510-59416358: Intel Core i5-4200M, 15.60", 2.5 kg
Autres tests » Lenovo G510
Lenovo G410-59410763: Intel Core i3-4000M, 14.00", 2.2 kg
Autres tests » Lenovo G410-59410763
Toshiba Satellite Pro C50-A-1KV: Intel Core i5-4200M, 15.60", 2.3 kg
Autres tests » Toshiba Satellite Pro C50-A-1KV
Toshiba Portege R30-A1302: Intel Core i7-4600M, 13.30", 1.5 kg
Autres tests » Toshiba Portege R30-A1302
Toshiba Satellite P50-A-13C: Intel Core i7-4700MQ, 15.60", 1.7 kg
Autres tests » Toshiba Satellite P50-A-13C
Toshiba Portege R30-A-14K: Intel Core i3-4000M, 13.30", 1.5 kg
Autres tests » Toshiba Portege R30-A-14K
Lenovo ThinkPad Edge E540 20C60041: Intel Core i3-4000M, 15.60", 2.5 kg
Autres tests » Lenovo ThinkPad Edge E540 20C60041
HP ProBook 450 G1: Intel Core i5-4200M, 15.60", 2.3 kg
Autres tests » HP ProBook 450 G1
MSI CR61-i5U45FHDW7: Intel Core i5-4200M, 15.60", 2.5 kg
Autres tests » MSI CR61-i5U45FHDW7
HP Spectre 13t-3000: Intel Core i5-4200U, 13.30", 1.4 kg
Autres tests » HP Spectre 13t-3000
Toshiba Satellite C75-A-13P: Intel Core i5-4200M, 17.30", 2.7 kg
Autres tests » Toshiba Satellite C75-A-13P
HP Split 13-m115sg x2: Intel Core i5-4200U, 13.30", 2.3 kg
Autres tests » HP Split 13-m115sg x2
Toshiba Satellite P75-A7200: Intel Core i7-4700MQ, 17.30", 2.9 kg
Autres tests » Toshiba Satellite P75-A7200
MSI CX61-20D-011UK: Intel Core i7-4702MQ, 15.60", 2.4 kg
Autres tests » MSI CX61-20D-011UK
Lenovo ThinkPad L540 20AV005GGE: Intel Core i5-4300M, 15.60", 2.5 kg
» La prise en charge de Windows 10 s'achève en 2025 : Essayez des systèmes d'exploitation alternatifs sans les installer
* Position approximative de la carte graphique
Top 10
» Le Top 10 des PC portables multimédia
» Le Top 10 des PC portables de jeu
» Le Top 10 des PC portables de jeu légers
» Le Top 10 des ordinateurs portables bureautiques
» Le Top 10 des PC portables bureautiques premium/professionnels
» Le Top 10 des Stations de travail mobiles
» Le Top 10 des Ultraportables
» Le Top 10 des Ultrabooks
» Le Top 10 des Convertibles
» Le Top 10 des Tablettes
» Le Top 10 des Tablettes Windows
» Le Top 10 des Smartphones
» Le Top 10 des PC Portables á moins de 300 euros
» Le Top 10 des PC Portables á moins de 500 euros
» Le Top 25 des meilleurs écrans d'ordinateurs