AMD Radeon R7 512 Cores (Kaveri Desktop)

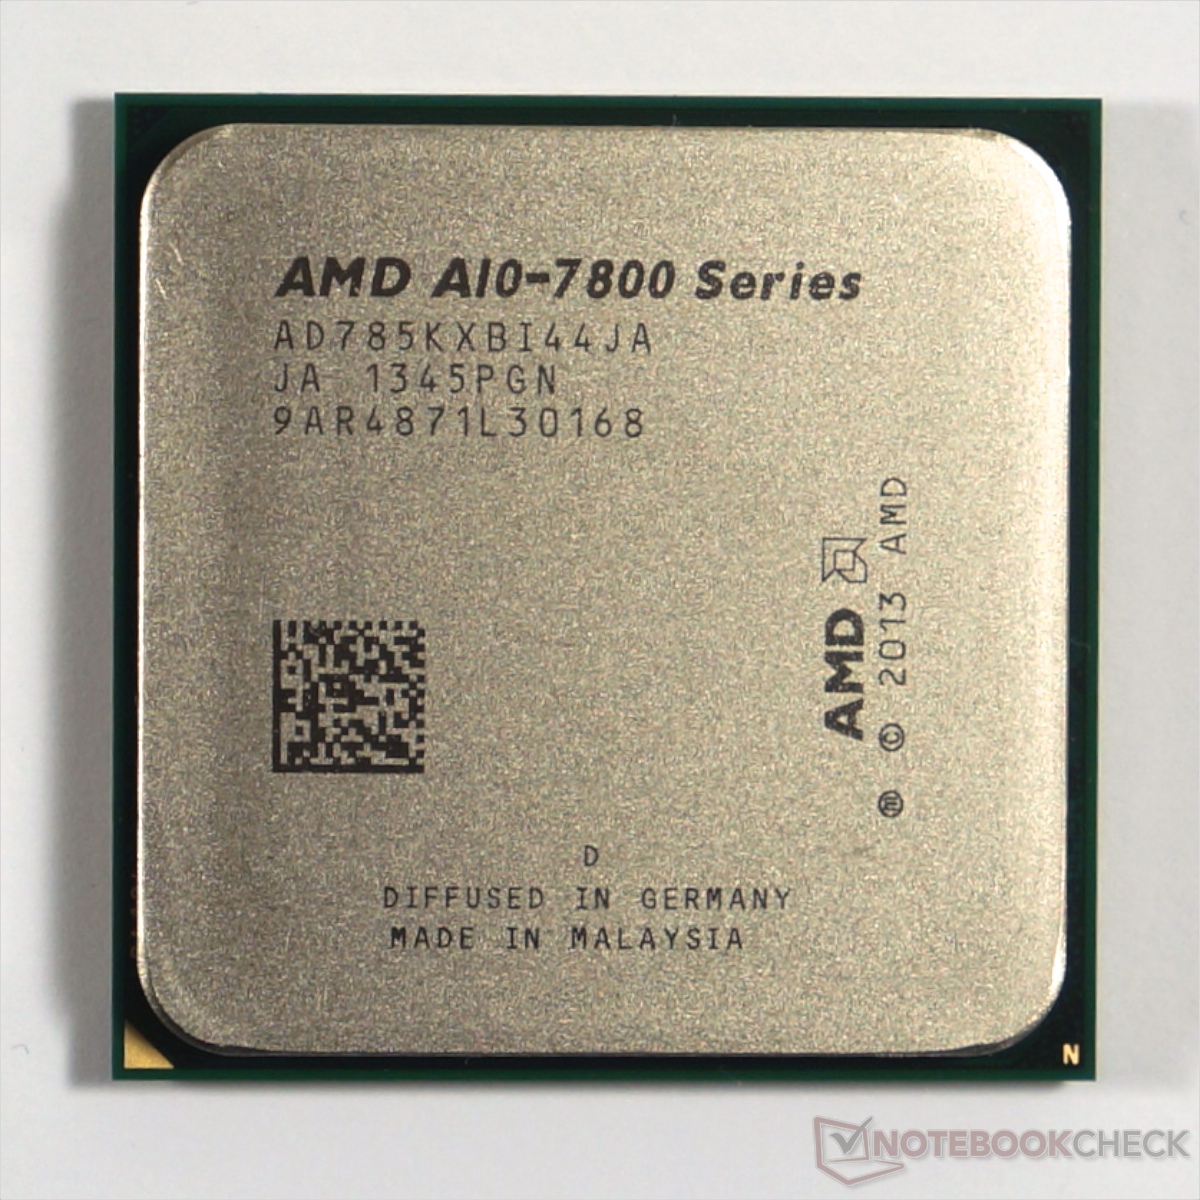
L'AMD Radeon R7 Graphics est le nom donné à la partie graphique de l'APU AMD A10-7850K Kaveri, il s'agit d'une carte graphique intégrée dépourvue de mémoire vidéo dédiée basée sur l'architecture GCN 1.1 (ou 2.0) Hawaii des cartes pour ordinateurs de bureau (R9 290 par exemple). La puce a été modifiée afin d'être intégrée à la conception HSA (Architecture Système Hétérogène) de l'APU.
Sur l'AMD A10-7850K, la partie graphique offres 512 unités de calcul shader (8 compute cores) ayant une fréquence de fonctionnement maximale portée à 720 MHz. Elle est compatible matériellement avec DirectX 11.2 ce qui lui confère un bel avantage par rapport aux puces graphiques concurrentes (Intel Haswell s'arrête 11.1, Nvidia Kepler et Maxwell à la version 11.0).
Les performances en jeux dans nos tests montrent une légère avance sur l'Intel Iris Pro Graphics 5200 (voir le test du Schenker S413). En fonction du jeu, la tête est prise alternativement par l'une ou par l'autre puce graphique, mais la R7 est au final plus véloce en surpassant la solution Intel dans deux jeux de plus (Mars 2014).
Système de test : carte mère Asus A88XM-PLUS, 16 Go DDR3-2133 de mémoire vive RAM AMD Gamer Memory.
Fabricant | AMD |
Radeon R (Kaveri) Gamme | |
Nom de code | Kaveri Spectre |
Architecture | GCN |
Pipelines | 512 - unifiés |
Fréquence du noyau interne | 720 MHz |
Mémoire partagée | oui |
DirectX | DirectX 12 (FL 12_0), Shader 5.2 |
technologie | 28 nm |
Caractéristiques | HSA, OpenCL 2.0, DirectCompute 5.0 |
Date de présentation | 14.01.2014 |
CPU | GPU Base Speed | GPU Boost / Turbo |
---|
AMD A10-7850K | 4 x 3700 MHz, 95 W | 720 MHz | ? MHz |
Benchmarks
3DMark - Time Spy Score 2560x1440

567 Points (4%)
A10-7850K Asus A88-XM-PLUS | A10-7850K | 16384 Mo | | >=14.2 | 567 |
...

Intel UHD Graphics 630 -19%


NVIDIA GeForce 920MX -17%


Intel Iris Plus Graphics 640 -12%


AMD Radeon R7 M445 -7%

NVIDIA GeForce 930MX -1%

AMD Radeon R7 512 Cores (Kaveri Desktop)


Intel Iris Plus Graphics 650 10%


Intel Iris Plus Graphics G4 (Ice Lake 48 EU) 23%


AMD Radeon RX Vega 8 29%

...
NVIDIA Titan RTX 2197%

3DMark - Time Spy Graphics 2560x1440

508 Points (3%)
A10-7850K Asus A88-XM-PLUS | A10-7850K | 16384 Mo | | >=14.2 | 508 |
...
Intel UHD Graphics 630 -22%


NVIDIA GeForce 920MX -18%


Intel Iris Plus Graphics 640 -13%


AMD Radeon R7 M445 -7%

NVIDIA GeForce 930MX -3%

AMD Radeon R7 512 Cores (Kaveri Desktop)


Intel Iris Plus Graphics 650 9%


Intel Iris Plus Graphics G4 (Ice Lake 48 EU) 22%


...
NVIDIA Titan RTX 2698%

3DMark - Ice Storm Unlimited Graphics Score 1280x720 offscreen
91999 Points (17%)
A10-7850K Asus A88-XM-PLUS | A10-7850K | 16384 Mo | | >=14.2 | 91999 |
...


AMD Radeon R7 512 Cores (Kaveri Desktop)


Intel HD Graphics 630 3%


Intel UHD Graphics G1 (Ice Lake 32 EU) 5%


AMD Radeon RX Vega 10 10%

AMD Radeon R7 M460 14%

Intel UHD Graphics 630 15%

AMD Radeon Pro WX 3200 15%

...
NVIDIA GeForce RTX 2080 Ti (Desktop) 466%

3DMark - Ice Storm Extreme Graphics 1920x1080
58792 Points (8%)
A10-7850K Asus A88-XM-PLUS | A10-7850K | 16384 Mo | | >=14.2 | 58792 |


AMD Radeon RX 560X (Laptop) -4%


Intel HD Graphics 630 -3%

NVIDIA GeForce 920MX -2%


AMD Radeon R7 512 Cores (Kaveri Desktop)

NVIDIA GeForce 930MX 0%


NVIDIA Quadro P520 5%

AMD Radeon Pro WX 3200 6%

Intel Iris Plus Graphics G7 (Ice Lake 64 EU) 6%


AMD Radeon RX Vega 8 13%


...

3DMark - Cloud Gate Standard Score 1280x720
6770 Points (11%)
A10-7850K Asus A88-XM-PLUS | A10-7850K | 16384 Mo | | >=14.2 | 6770 |
...


NVIDIA GeForce 920MX -3%


AMD Radeon R7 512 Cores (Kaveri Desktop)

AMD Radeon R7 M445 5%

NVIDIA GeForce 930MX 7%


...
NVIDIA GeForce RTX 2080 (Desktop) 690%

3DMark - Cloud Gate Standard Graphics 1280x720
10341 Points (6%)
A10-7850K Asus A88-XM-PLUS | A10-7850K | 16384 Mo | | >=14.2 | 10341 |
...

NVIDIA GeForce 920MX -12%


Intel HD Graphics 630 -10%

AMD Radeon R7 M445 -7%


Intel UHD Graphics 630 -2%

AMD Radeon R7 512 Cores (Kaveri Desktop)


Intel UHD Graphics G1 (Ice Lake 32 EU) 6%


Intel Iris Plus Graphics 640 8%

AMD FirePro W4190M 8%


...

3DMark - Fire Strike Score 1920x1080
1477 Points (6%)
A10-7850K Asus A88-XM-PLUS | A10-7850K | 16384 Mo | | >=14.2 | 1477 |
...


NVIDIA GeForce 930MX -4%

Intel UHD Graphics G1 (Ice Lake 32 EU) -2%

AMD Radeon R7 M445 -1%

NVIDIA GeForce GTS 450 -1%

AMD Radeon R7 512 Cores (Kaveri Desktop)


AMD FirePro W4190M 10%

...
NVIDIA GeForce RTX 2080 Ti (Desktop) 1619%

3DMark - Fire Strike Graphics 1920x1080
1616 Points (4%)
A10-7850K Asus A88-XM-PLUS | A10-7850K | 16384 Mo | | >=14.2 | 1616 |
...
AMD Radeon R6 M340DX -9%


Intel UHD Graphics G1 (Ice Lake 32 EU) -6%


NVIDIA GeForce GTS 450 -4%


AMD Radeon R7 M445 -2%

NVIDIA GeForce 930MX -1%


AMD Radeon R7 512 Cores (Kaveri Desktop)


Intel Iris Plus Graphics 650 5%


AMD FirePro W4190M 6%

...

3DMark - Ice Storm Standard Graphics 1280x720
85679 Points (11%)
A10-7850K Asus A88-XM-PLUS | A10-7850K | 16384 Mo | | >=14.2 | 85679 |

Intel Iris Plus Graphics G7 (Ice Lake 64 EU) -4%

NVIDIA GeForce 920MX -2%


AMD Radeon R7 512 Cores (Kaveri Desktop)

NVIDIA Quadro T1000 (Laptop) 0%


NVIDIA GeForce MX250 3%

NVIDIA GeForce MX230 3%

NVIDIA GeForce GTX 1650 Max-Q 4%


AMD Radeon RX Vega 8 6%

...

3DMark 11 - Performance 1280x720
2444 points (7%)
A10-7850K Asus A88-XM-PLUS | A10-7850K | 16384 Mo | | >=14.2 | 2444 |
...


AMD Radeon R7 M445 -1%

AMD Radeon R7 M340 -1%


Intel Iris Plus Graphics 640 0%

AMD Radeon R7 512 Cores (Kaveri Desktop)

AMD FirePro W4190M 0%

NVIDIA GeForce GTX 550 Ti 1%


...
NVIDIA GeForce RTX 2080 Ti (Desktop) 1296%

3DMark 11 - Performance GPU 1280x720
2302 points (5%)
A10-7850K Asus A88-XM-PLUS | A10-7850K | 16384 Mo | | >=14.2 | 2302 |
...

AMD Radeon R7 M445 -4%


NVIDIA GeForce 930MX -4%

AMD FirePro W4190M -4%


NVIDIA GeForce GTX 550 Ti -1%

Intel Iris Plus Graphics 640 -1%


AMD Radeon R7 512 Cores (Kaveri Desktop)

AMD FirePro W4170M 1%


...
NVIDIA GeForce RTX 2080 Ti (Desktop) 1949%
3DMark Vantage
P GPU no PhysX 1280x1024 +3DMark Vantage - P GPU no PhysX 1280x1024
7550 Points (8%)
A10-7850K Asus A88-XM-PLUS | A10-7850K | 16384 Mo | | >=14.2 | 7550 |
...

NVIDIA GeForce 930MX -5%


ATI Radeon HD 4850 -2%


AMD Radeon R7 512 Cores (Kaveri Desktop)


...
NVIDIA GeForce RTX 2080 Ti (Desktop) 1089%

3DMark 03 - Standard 1024x768
29153 Points (15%)
A10-7850K Asus A88-XM-PLUS | A10-7850K | 16384 Mo | | >=14.2 | 29153 |
VIA S3 Graphics ProSavage8 -100%
...


AMD Radeon R7 512 Cores (Kaveri Desktop)


NVIDIA GeForce 920MX 5%

...

3DMark 05 - Standard 1024x768
14908 Points (28%)
A10-7850K Asus A88-XM-PLUS | A10-7850K | 16384 Mo | | >=14.2 | 14908 |
...


AMD Radeon R7 512 Cores (Kaveri Desktop)


AMD Radeon HD 6750M 1%


...
NVIDIA GeForce GTX 1660 (Desktop) 256%
3DMark 06 Standard 1280x1024 +9878 Points (21%)
Standard 1280x1024 |
A10-7850K Asus A88-XM-PLUS | A10-7850K | 16384 Mo | | >=14.2 | 9878 |
...


AMD Radeon R7 512 Cores (Kaveri Desktop)


NVIDIA GeForce GT 240 GDDR5 3%

...
NVIDIA GeForce RTX 2070 (Desktop) 372%

Unigine Valley 1.0 - Extreme HD DirectX 1920x1080

6.9 fps (4%)
A10-7850K Asus A88-XM-PLUS | A10-7850K | 16384 Mo | | >=14.2 | 6.9 |
Intel HD Graphics (Cherry Trail) -83%

...

Intel HD Graphics 630 -23%

Intel UHD Graphics 630 -12%


Intel Iris Plus Graphics 640 -6%

AMD Radeon R7 M445 -4%


AMD Radeon R7 512 Cores (Kaveri Desktop)

AMD Radeon RX Vega 10 1%

AMD FirePro W4190M 5%

AMD Radeon RX Vega 8 12%

NVIDIA GeForce 920MX 26%


NVIDIA Quadro P500 72%

...
NVIDIA GeForce RTX 2080 Ti (Desktop) 2244%

Unigine Heaven 3.0 - DX 11, Normal Tessellation, High Shaders 1920x1080

19.7 fps (7%)
A10-7850K Asus A88-XM-PLUS | A10-7850K | 16384 Mo | | >=14.2 | 19.7 |
...


AMD Radeon R6 M340DX -7%

Intel HD Graphics 630 -5%

Intel UHD Graphics 630 -4%

AMD Radeon R7 512 Cores (Kaveri Desktop)


NVIDIA GeForce 920MX 8%


...
NVIDIA GeForce GTX 1080 (Desktop) 1265%

Unigine Heaven 3.0 - OpenGL, Normal Tessellation, High Shaders 1920x1080

17.6 fps (10%)
A10-7850K Asus A88-XM-PLUS | A10-7850K | 16384 Mo | | >=14.2 | 17.6 |

...


AMD Radeon R7 512 Cores (Kaveri Desktop)


AMD FirePro W4170M 0%


AMD Radeon RX Vega 8 6%


AMD Radeon RX Vega 10 14%

NVIDIA GeForce 920MX 15%

...

Unigine Heaven 2.1 - high, Tesselation (normal), DirectX11 1280x1024

26.8 fps (12%)
A10-7850K Asus A88-XM-PLUS | A10-7850K | 16384 Mo | | >=14.2 | 26.8 |
...


AMD Radeon RX Vega 8 -7%


Intel HD Graphics 630 -1%

AMD Radeon R7 512 Cores (Kaveri Desktop)


NVIDIA GeForce 920MX 4%


...
SPECviewperf 12
Solidworks (sw-03) 1900x1060 +SPECviewperf 12 - Solidworks (sw-03) 1900x1060
28.9 fps (14%)
A10-7850K Asus A88-XM-PLUS | A10-7850K | 16384 Mo | | >=14.2 | 28.9 |
...


Intel HD Graphics 620 -13%


Intel UHD Graphics 630 -1%


AMD Radeon R7 512 Cores (Kaveri Desktop)


AMD FirePro W4190M 6%


...
Siemens NX (snx-02) 1900x1060 +SPECviewperf 12 - Siemens NX (snx-02) 1900x1060
5.9 fps (2%)
A10-7850K Asus A88-XM-PLUS | A10-7850K | 16384 Mo | | >=14.2 | 5.9 |
...


NVIDIA GeForce GTX 1050 Ti (Laptop) -15%


NVIDIA GeForce GTX 1060 (Desktop) 0%

AMD Radeon R7 512 Cores (Kaveri Desktop)


NVIDIA GeForce GTX 1070 SLI (Desktop) 8%

NVIDIA GeForce GTX 1660 (Desktop) 10%

NVIDIA GeForce GTX 1650 (Desktop) 10%


NVIDIA GeForce GTX 1070 (Laptop) 29%


...
NVIDIA Titan RTX 4245%
Showcase (showcase-01) 1900x1060 +SPECviewperf 12 - Showcase (showcase-01) 1900x1060

9.2 fps (5%)
A10-7850K Asus A88-XM-PLUS | A10-7850K | 16384 Mo | | >=14.2 | 9.2 |

...


AMD FirePro W4190M -17%

Intel UHD Graphics 630 -13%


AMD Radeon R7 512 Cores (Kaveri Desktop)


AMD Radeon RX Vega 10 23%


NVIDIA Quadro P500 34%

AMD FirePro W4170M 39%


NVIDIA Quadro P520 44%

...
NVIDIA Titan RTX 1983%
Medical (medical-01) 1900x1060 +SPECviewperf 12 - Medical (medical-01) 1900x1060

4.9 fps (6%)
A10-7850K Asus A88-XM-PLUS | A10-7850K | 16384 Mo | | >=14.2 | 4.9 |
...


Intel HD Graphics 620 -19%


AMD Radeon R7 512 Cores (Kaveri Desktop)


AMD FirePro W4190M 8%


NVIDIA GeForce 930MX 17%

AMD FirePro W4170M 19%


...
NVIDIA Titan RTX 1676%
Maya (maya-04) 1900x1060 +SPECviewperf 12 - Maya (maya-04) 1900x1060

14.6 fps (8%)
A10-7850K Asus A88-XM-PLUS | A10-7850K | 16384 Mo | | >=14.2 | 14.6 |
...
NVIDIA GeForce 930MX -22%


Intel HD Graphics 620 -21%


NVIDIA Quadro P500 -3%

AMD Radeon R7 512 Cores (Kaveri Desktop)

Intel UHD Graphics 630 0%


AMD FirePro W4190M 13%


...
NVIDIA GeForce RTX 2080 Ti (Desktop) 1163%
Energy (energy-01) 1900x1060 +SPECviewperf 12 - Energy (energy-01) 1900x1060
0.3 fps (1%)
A10-7850K Asus A88-XM-PLUS | A10-7850K | 16384 Mo | | >=14.2 | 0.27 |
...


AMD Radeon Pro 455 -30%


Intel HD Graphics 620 -19%


AMD Radeon R7 512 Cores (Kaveri Desktop)


NVIDIA GeForce 930MX 11%

AMD Radeon Pro 555 19%

Intel UHD Graphics 630 19%


...
NVIDIA Titan RTX 10315%
Creo (creo-01) 1900x1060 +SPECviewperf 12 - Creo (creo-01) 1900x1060
14.8 fps (9%)
A10-7850K Asus A88-XM-PLUS | A10-7850K | 16384 Mo | | >=14.2 | 14.8 |
...


Intel UHD Graphics 630 -8%


AMD Radeon R7 512 Cores (Kaveri Desktop)


AMD Radeon RX Vega 10 10%


AMD FirePro W4190M 14%


...
Catia (catia-04) 1900x1060 +SPECviewperf 12 - Catia (catia-04) 1900x1060

16.9 fps (9%)
A10-7850K Asus A88-XM-PLUS | A10-7850K | 16384 Mo | | >=14.2 | 16.9 |

...

Intel UHD Graphics 630 -9%


AMD Radeon R7 512 Cores (Kaveri Desktop)


AMD FirePro W4190M 9%


AMD FirePro W4170M 14%


...
Cinebench R10 Shading 32Bit +Cinebench R10 - Shading 32Bit
7410 Points (37%)
A10-7850K Asus A88-XM-PLUS | A10-7850K | 16384 Mo | | >=14.2 | 7410 |
...

AMD Radeon HD 6730M -2%


AMD Radeon R7 512 Cores (Kaveri Desktop)

AMD Radeon R5 M430 0%


...
Cinebench R11.5 OpenGL 64Bit +Cinebench R11.5 - OpenGL 64Bit

41 Points (24%)
A10-7850K Asus A88-XM-PLUS | A10-7850K | 16384 Mo | | >=14.2 | 40.96 |


AMD Radeon R7 512 Cores (Kaveri Desktop)


AMD Radeon RX Vega 8 0%


AMD Radeon R7 M445 2%


...
Cinebench R15
OpenGL 64Bit +Cinebench R15 - OpenGL 64Bit
43.5 Points (17%)
A10-7850K Asus A88-XM-PLUS | A10-7850K | 16384 Mo | | >=14.2 | 43.5 |


Intel HD Graphics 620 -4%


AMD Radeon RX Vega 10 0%

AMD Radeon R7 512 Cores (Kaveri Desktop)

AMD Radeon RX Vega 8 3%


AMD Radeon R7 M445 6%


Intel UHD Graphics G1 (Ice Lake 32 EU) 8%


NVIDIA GeForce 920MX 8%

...
NVIDIA Quadro RTX 4000 Max-Q 429%
Ref. Match 64Bit +Cinebench R15 - Ref. Match 64Bit

98 Points (98%)
A10-7850K Asus A88-XM-PLUS | A10-7850K | 16384 Mo | | >=14.2 | 98 |

...


Intel Iris Plus Graphics G7 (Ice Lake 64 EU) 0%

Intel UHD Graphics 630 0%

Intel Iris Pro Graphics 580 0%


AMD Radeon R7 512 Cores (Kaveri Desktop)

AMD Radeon RX 550X (Laptop) 0%


Intel HD Graphics (Cherry Trail) 0%


Intel Iris Plus Graphics 640 0%


...
NVIDIA Quadro RTX 3000 (Laptop) 2%
GFXBench (DX / GLBenchmark) 2.7
T-Rex HD Offscreen C24Z16 1920x1080 +GFXBench (DX / GLBenchmark) 2.7 - T-Rex HD Offscreen C24Z16 1920x1080
128 fps (1%)
A10-7850K Asus A88-XM-PLUS | A10-7850K | 16384 Mo | | >=14.2 | 128 |
...


NVIDIA GeForce 920MX -10%


NVIDIA GeForce 930MX -3%


AMD Radeon R7 512 Cores (Kaveri Desktop)


Intel HD Graphics 630 9%

Apple A9X / PowerVR Series 7XT 9%


AMD Radeon RX Vega 8 12%

...

GFXBench 3.0 - Manhattan Offscreen OGL off screen
33.5 fps (6%)
A10-7850K Asus A88-XM-PLUS | A10-7850K | 16384 Mo | | >=14.2 | 33.5 |

Intel Iris Plus Graphics 640 -7%


Qualcomm Adreno 616 -6%


ARM Mali-G71 MP8 -1%

AMD Radeon R7 512 Cores (Kaveri Desktop)


AMD Radeon RX Vega 8 1%


Intel UHD Graphics 615 10%


ARM Mali-T880 MP12 16%


...

LuxMark v2.0 64Bit - Room GPUs-only
266 Samples/s (5%)
A10-7850K Asus A88-XM-PLUS | A10-7850K | 16384 Mo | | >=14.2 | 266 |
...


AMD Radeon RX Vega 9 -10%


AMD FirePro W4170M -4%


AMD Radeon R7 512 Cores (Kaveri Desktop)

Intel HD Graphics 630 1%


AMD Radeon R6 M340DX 7%

...

LuxMark v2.0 64Bit - Sala GPUs-only
470 Samples/s (4%)
A10-7850K Asus A88-XM-PLUS | A10-7850K | 16384 Mo | | >=14.2 | 470 |
...


NVIDIA GeForce 920MX -9%


AMD FirePro W4170M -2%


AMD Radeon R7 512 Cores (Kaveri Desktop)

Intel UHD Graphics 615 1%


AMD Radeon RX Vega 10 9%

...
NVIDIA Titan RTX 2198%

ComputeMark v2.1 - Normal, Score 1024x600
1495 Points (5%)
A10-7850K Asus A88-XM-PLUS | A10-7850K | 16384 Mo | | >=14.2 | 1495 |
...


AMD Radeon R7 M340 -3%


AMD Radeon R7 512 Cores (Kaveri Desktop)


AMD Radeon R6 M340DX 3%


...
NVIDIA Titan RTX 1767%

Power Consumption - FurMark 1.19 GPU Stress Test - Power Consumption (external Monitor) 1280x720 *

93.7 Watt (22%)
A10-7850K Asus A88-XM-PLUS | A10-7850K | 16384 Mo | | >=14.2 | 93.7 |
...

NVIDIA Quadro P2000 Max-Q -23%

NVIDIA GeForce GTX 1050 Ti Max-Q -22%

AMD Radeon RX Vega 8 -20%


NVIDIA GeForce GTX 1660 Ti Max-Q -17%


AMD Radeon R7 512 Cores (Kaveri Desktop)


NVIDIA GeForce GTX 1050 Ti (Laptop) 8%


AMD Radeon RX 5500M 45%


...
AMD Radeon VII 346%

Power Consumption - The Witcher 3 Power Consumption (external Monitor) ultra 1920x1080 *

76.6 Watt (17%)
A10-7850K Asus A88-XM-PLUS | A10-7850K | 16384 Mo | | >=14.2 | 76.6 |
...


Intel Iris Plus Graphics 650 -33%

AMD Radeon Pro 555 -32%


NVIDIA GeForce GTX 1050 Ti Max-Q -1%

AMD Radeon R7 512 Cores (Kaveri Desktop)


AMD Radeon RX 560X (Laptop) 13%

NVIDIA GeForce GTX 1050 Ti (Laptop) 13%


...
NVIDIA Titan RTX 471%

- Amplitude des valeurs obtenues dans le benchmark avec cette carte graphique

- Valeur moyenne obtenue dans le benchmark avec cette carte graphique
* Smaller numbers mean a higher performance
Benchmarks de jeux
Les benchmarks qui suivent sont tirés de tests effectués dans nos critiques des ordinateurs portables. Les performances dépendent du type et de la quantité de mémoire graphique embaquée, mais aussi de sa fréquence, du processeur, des paramètres système, des pilotes et du système d'exploitation. Les résultats ne sont donc pas représentatifs de tous les appareils intégrant cette carte graphique. Pour plus de détails sur les résultats, cliquez sur le nombre d'images par seconde.
...


NVIDIA Quadro P520 -26%


Intel HD Graphics 630 -14%

Intel UHD Graphics 630 -14%

Intel Iris Plus Graphics G7 (Ice Lake 64 EU) -14%

AMD Radeon R7 512 Cores (Kaveri Desktop)


AMD Radeon RX Vega 10 26%

AMD Radeon RX Vega 9 26%


AMD Radeon RX Vega 8 32%

AMD Radeon Pro WX 3200 46%

NVIDIA GeForce MX230 53%

...
NVIDIA GeForce GTX 1660 (Desktop) 544%
...

Intel UHD Graphics 630 -22%

Intel HD Graphics 630 -19%

NVIDIA Quadro P520 -4%

AMD Radeon R7 512 Cores (Kaveri Desktop)


AMD Radeon RX Vega 10 27%

AMD Radeon RX Vega 9 27%


Intel Iris Plus Graphics G7 (Ice Lake 64 EU) 36%

AMD Radeon RX Vega 8 46%

NVIDIA GeForce MX230 51%

NVIDIA GeForce MX250 84%

...
NVIDIA GeForce RTX 2080 (Laptop) 1352%

» Jouable avec tous les ordinateurs portables testés avec les détails paramétrés sur Bas.

Intel UHD Graphics 615 -46%


AMD Radeon R7 512 Cores (Kaveri Desktop)


AMD Radeon RX Vega 8 28%


Intel HD Graphics 630 36%

Intel UHD Graphics 630 54%

NVIDIA Quadro P520 80%

AMD Radeon RX Vega 10 97%

AMD Radeon Pro WX 3200 98%

...

» Les benchmarks indiquent que le jeu est injouable avec les paramètres testés.
...
Intel UHD Graphics 630 -24%


Intel Iris Plus Graphics 640 -21%


Intel Iris Plus Graphics 650 -2%

AMD Radeon R7 512 Cores (Kaveri Desktop)


NVIDIA GeForce 930MX 7%


AMD Radeon RX Vega 10 10%

NVIDIA GeForce 920MX 15%


AMD Radeon RX Vega 8 25%


...
NVIDIA GeForce RTX 2080 Ti (Desktop) 807%
...


Intel UHD Graphics 630 -22%


Intel Iris Plus Graphics 640 -18%

NVIDIA GeForce 930MX -5%


AMD Radeon R7 512 Cores (Kaveri Desktop)

Intel Iris Plus Graphics 650 2%

AMD Radeon RX Vega 10 5%


NVIDIA GeForce 920MX 9%


AMD Radeon RX Vega 8 15%


...
NVIDIA GeForce RTX 2080 Ti (Desktop) 1702%

» Jouable avec tous les ordinateurs portables testés avec les détails paramétrés sur Bas.
Additional Benchmarks
Medium Preset 4xAF TAA 1366x768
25.7 [X] A10-7850K Asus A88-XM-PLUSAMD A10-7850K 3.7GHz
Radeon R7 512 Cores (Kaveri Desktop)
min:
21 fps, max:
32 fps


AMD Radeon R5 M430 -28%

Intel Iris Plus Graphics 650 -21%

Intel HD Graphics 630 -15%


AMD Radeon R7 512 Cores (Kaveri Desktop)


AMD Radeon RX Vega 10 11%

AMD Radeon R7 M445 23%

NVIDIA GeForce 930MX 24%


AMD Radeon RX Vega 8 31%

AMD Radeon Pro 450 54%


...
NVIDIA GeForce GTX 1080 (Desktop) 534%

» Les benchmarks indiquent que le jeu est injouable avec les paramètres testés.
Intel HD Graphics 630 -26%


AMD Radeon R7 M445 -17%


NVIDIA GeForce 930MX -13%

AMD Radeon R7 M460 -10%


AMD Radeon R7 512 Cores (Kaveri Desktop)

Intel Iris Plus Graphics 650 0%


AMD Radeon Pro 450 81%


...
NVIDIA Titan X Pascal 286%

» Les benchmarks indiquent que le jeu est injouable avec les paramètres testés.
...

Intel Iris Plus Graphics 640 -27%

Intel HD Graphics 630 -27%

NVIDIA GeForce 920MX -23%


Intel Iris Plus Graphics 650 -10%


AMD Radeon R7 M445 -5%

AMD Radeon R7 512 Cores (Kaveri Desktop)

NVIDIA GeForce 930MX 2%


AMD Radeon RX Vega 8 8%


...
NVIDIA Titan X Pascal 139%
...
NVIDIA GeForce 920MX -26%


Intel HD Graphics 630 -25%

Intel Iris Plus Graphics 650 -16%


AMD Radeon R7 M445 -9%


AMD Radeon R7 512 Cores (Kaveri Desktop)


AMD Radeon RX Vega 8 4%


NVIDIA GeForce 930MX 11%


...
NVIDIA Titan X Pascal 219%
...


Intel HD Graphics 630 -27%

AMD Radeon R7 M460 -25%


NVIDIA GeForce 920MX -17%


AMD Radeon R7 512 Cores (Kaveri Desktop)

AMD Radeon R7 M445 2%

AMD Radeon RX Vega 8 5%


Intel Iris Plus Graphics 640 38%

NVIDIA GeForce 930MX 68%

...
NVIDIA Titan X Pascal 767%

» Jouable avec tous les ordinateurs portables testés avec les détails paramétrés sur Moyen.
Intel HD Graphics 400 (Braswell) -92%

...


AMD Radeon R7 M460 -11%

Intel HD Graphics 630 -7%

Intel UHD Graphics 630 -6%

AMD Radeon R7 512 Cores (Kaveri Desktop)


AMD Radeon RX Vega 8 15%

NVIDIA GeForce 930MX 22%

NVIDIA GeForce 920MX 25%

Intel Iris Plus Graphics 640 30%

...
...


Intel HD Graphics 630 -14%

AMD Radeon R7 M460 -12%


Intel UHD Graphics 630 -3%

AMD Radeon R7 512 Cores (Kaveri Desktop)


Intel Iris Plus Graphics 640 16%


NVIDIA GeForce 930MX 27%


NVIDIA GeForce 920MX 34%

Intel Iris Plus Graphics 650 35%

...
NVIDIA GeForce GTX 1060 (Desktop) 808%

» Jouable avec tous les ordinateurs portables testés avec les détails paramétrés sur Moyen.
Intel HD Graphics 400 (Braswell) -80%

...


Intel UHD Graphics 630 -20%

Intel HD Graphics 630 -16%
