Notebookcheck Logo

Intel HD Graphics 510

Intel HD Graphics 510

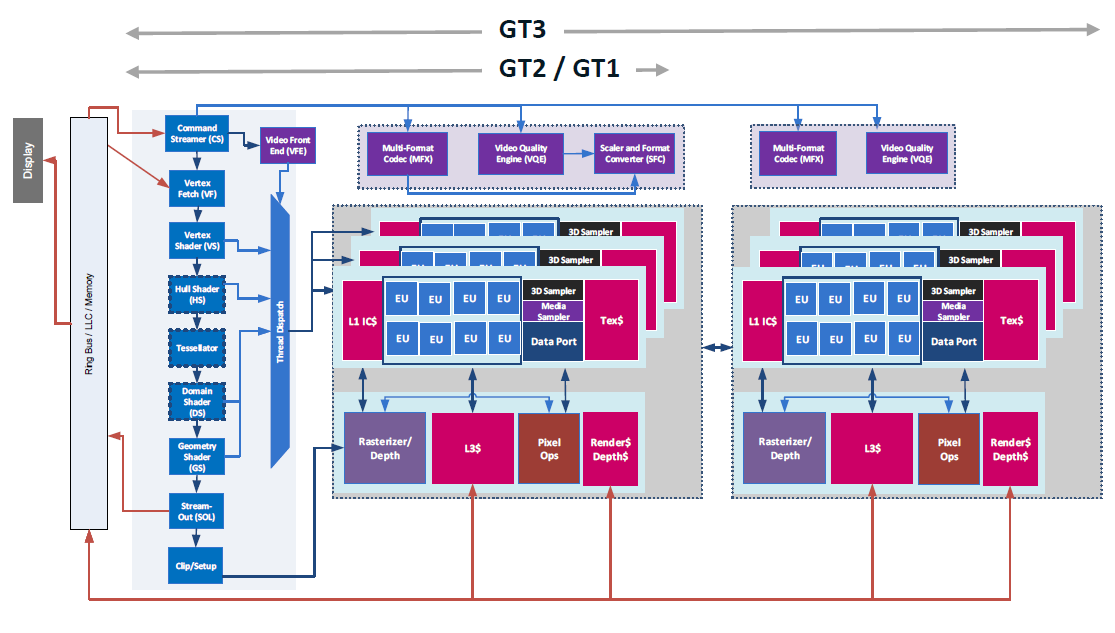
L'Intel HD Graphics 510 (GT2) est une carte graphique intégrée dans certains processeurs ULV Ultra Basse Tension de génération Skylake d'entrée de gamme. Le GT1 embarque 12 unités d'exécution cadencées jusqu'à 950 MHz (en fonction des processeurs). En l'absence de cache eDRAM, la HD 510 doit puiser dans la mémoire centrale (2x 64bit DDR3L-1600/DDR4-2133).

Performances

Les performances exactes de la HD Graphics 510 dépendent de nombreux facteurs tels que la taille du cache de niveau 3 L3, de la mémoire centrale (DDR3/DDR4) et de la fréquence du processeur. La puce doit être légèrement moins rapide qu'une HD Graphics 4400, faisant tourner la plupart des jeux modernes avec la qualité d'image la plus faible possible.

Fonctionnalités

Le moteur vidéo a été revu et permet maintenant de décoder matériellement du H.265/HEVC, ce qui améliore considérablement les performances. Les moniteurs peuvent maintenant bénéficier d'une liaison via un port DP 1.2/EDP 1.3 (max. 3840 x 2160 @ 60 Hz), mais le HDMI est cantonnée à l'ancienne norme 1.4a (max. 3840 x 2160 @ 30 Hz). Il est possible d'obtenir une sortie HDMI 2.0 via un convertisseur DisplayPort. Trois écrans peuvent être connectées simultanément.

Consommation énergétique

La HD Graphics 510 est intégrée dans certains processeurs mobiles donnés avec un TDP de 15 Watts, conçus pour les ordinateurs portables compacts et les Ultrabooks.

Gen. 9 Gamme

Iris Pro Graphics P580 72 @ 0.35 - 1.1 GHzeDRAM + 64/128 Bit
Iris Pro Graphics 580 72 @ 0.35 - 1.05 GHzeDRAM + 64/128 Bit
Iris Graphics 550 48 @ 0.3 - 1.1 GHzeDRAM + 64/128 Bit
Iris Graphics 540 48 @ 0.3 - 1.05 GHzeDRAM + 64/128 Bit
HD Graphics 530 24 @ 0.35 - 1.15 GHz64/128 Bit
HD Graphics 520 24 @ 0.3 - 1.05 GHz64/128 Bit
HD Graphics 515 24 @ 0.3 - 1 GHz64/128 Bit
UHD Graphics 610 12 @ 0.3 - 0.95 GHz64/128 Bit
HD Graphics 610 12 @ 0.3 - 0.95 GHz64/128 Bit
HD Graphics 510 12 @ 0.3 - 0.95 GHz64/128 Bit
UHD Graphics 605 18 @ 0.3 - 0.75 GHz64/128 Bit
HD Graphics 505 18 @ 0.3 - 0.75 GHz64/128 Bit
UHD Graphics 600 12 @ 0.3 - 0.7 GHz64/128 Bit
HD Graphics 500 12 @ 0.3 - 0.7 GHz64/128 Bit
Nom de codeSkylake GT1
ArchitectureGen. 9 Skylake
Pipelines12 - unifiés
Fréquence du noyau interne300 - 950 (Boost) MHz
Largeur du bus mémoire64/128 Bit
Type de mémoireDDR3/DDR4
Mémoire partagéeoui
APIDirectX 12_1, OpenGL 4.4
technologie14 nm
CaractéristiquesQuickSync
Date de présentation01.09.2015
CPU in HD Graphics 510GPU Base SpeedGPU Boost / Turbo
Intel Core i5-6198DU2 x 2300 MHz, 15 W300 MHz1000 MHz
Intel Pentium 4405U2 x 2100 MHz, 15 W300 MHz950 MHz
min. - max.300 MHz950 - 1000 MHz

Benchmarks

Performance Rating - 3DMark 11 + Fire Strike + Time Spy
0.3 pt (1%)
0.06259 -77%
...
Intel UHD Graphics (Elkhart Lake 16 EU)
0.2258 -16%
0.2327 -13%
0.2456 -8%
0.2456 -8%
0.2456 -8%
0.2469 -8%
AMD Radeon R4 (Stoney Ridge)
0.2516 -6%
0.2611 -3%
0.2622 -2%
Intel HD Graphics 510
0.2681
0.2689 0%
0.2743 2%
0.2784 4%
0.2862 7%
0.2862 7%
0.2864 7%
0.2985 11%
0.3039 13%
0.3088 15%
...
NVIDIA GeForce RTX 4090 Laptop GPU
20 7360%
0%
100%
3DMark - 3DMark Ice Storm Unlimited Graphics
43274 Points (5%)
3DMark - 3DMark Ice Storm Extreme Graphics
26846 Points (4%)
3DMark - 3DMark Cloud Gate Score
4721 Points (5%)
3DMark - 3DMark Fire Strike Standard Graphics
621 Points (1%)
3DMark - 3DMark Ice Storm Graphics
62653 Points (8%)
3DMark 11 - 3DM11 Performance Score
985 Points (1%)
3DMark 11 - 3DM11 Performance GPU
847 Points (1%)
3DMark Vantage
3DM Vant. Perf. total +
3DMark Vantage - 3DM Vant. Perf. total
3798 Points (1%)
3DM Vant. Perf. GPU no PhysX +
3DMark Vantage - 3DM Vant. Perf. GPU no PhysX
3125 Points (2%)
3DMark 06 3DMark 06 - Standard 1280x1024 +
3DMark 06
7253 Points (10%)
Unigine Heaven 3.0 - Unigine Heaven 3.0 DX 11
9.3 fps (3%)
Unigine Heaven 2.1 - Heaven 2.1 high
13.5 fps (3%)
Cinebench R10 Cinebench R10 Shading (32bit) +
Cinebench R10 - Cinebench R10 Shading (32bit)
7348 points (5%)
Cinebench R11.5 Cinebench R11.5 OpenGL 64 Bit +
Cinebench R11.5 - Cinebench R11.5 OpenGL 64 Bit
17.2 fps (6%)
Cinebench R15
Cinebench R15 OpenGL 64 Bit +
Cinebench R15 - Cinebench R15 OpenGL 64 Bit
28 fps (7%)
GFXBench (DX / GLBenchmark) 2.7
GFXBench 2.7 T-Rex HD Onscreen C24Z16 +
GFXBench T-Rex HD Offscreen C24Z16 +
GFXBench (DX / GLBenchmark) 2.7 - GFXBench T-Rex HD Offscreen C24Z16
121.9 fps (1%)
GFXBench 3.0 - GFXBench 3.0 Manhattan
59.9 fps (16%)
GFXBench 3.0 - GFXBench 3.0 Manhattan Offscreen
64.6 fps (4%)
GFXBench - GFXBench Car Chase Onscreen
55.7 fps (21%)
GFXBench - GFXBench Car Chase Offscreen
35.9 fps (4%)
LuxMark v2.0 64Bit - LuxMark v2.0 Room GPU
167 Samples/s (1%)
LuxMark v2.0 64Bit - LuxMark v2.0 Sala GPU
302 Samples/s (1%)
ComputeMark v2.1 - ComputeMark v2.1 Result
500 points (1%)
- Amplitude des valeurs obtenues dans le benchmark avec cette carte graphique
- Valeur moyenne obtenue dans le benchmark avec cette carte graphique
* Plus les chiffres sont petits, plus les performances sont élevées

Benchmarks de jeux

Les benchmarks qui suivent sont tirés de tests effectués dans nos critiques des ordinateurs portables. Les performances dépendent du type et de la quantité de mémoire graphique embaquée, mais aussi de sa fréquence, du processeur, des paramètres système, des pilotes et du système d'exploitation. Les résultats ne sont donc pas représentatifs de tous les appareils intégrant cette carte graphique. Pour plus de détails sur les résultats, cliquez sur le nombre d'images par seconde.

Bas 1280x720
18.3  fps    + Comparer
» Les benchmarks indiquent que le jeu est injouable avec les paramètres testés.
Additional Benchmarks
Medium / Off FXAA 1366x768
14.4
Bas 1280x720
19.9  fps    + Comparer
Moyen 1366x768
15.4  fps    + Comparer
» Les benchmarks indiquent que le jeu est injouable avec les paramètres testés.
Bas 1280x720
70.6  fps    + Comparer
Moyen 1366x768
41.3  fps    + Comparer
» Jouable avec tous les ordinateurs portables testés avec les détails paramétrés sur Moyen.
Bas 1024x768
24.5  fps    + Comparer
Moyen 1366x768
9.4  fps    + Comparer
» Les benchmarks indiquent que le jeu est injouable avec les paramètres testés.
Bas 1280x720
13.4  fps    + Comparer
Moyen 1366x768
7.7  fps    + Comparer
» Les benchmarks indiquent que le jeu est injouable avec les paramètres testés.
Bas 1024x768
11.1  fps    + Comparer
Moyen 1366x768
7  fps    + Comparer
» Les benchmarks indiquent que le jeu est injouable avec les paramètres testés.
Bas 1024x768
25  fps    + Comparer
Moyen 1366x768
15.9  fps    + Comparer
» Les benchmarks indiquent que le jeu est injouable avec les paramètres testés.
Anno 2205

Anno 2205

2015
Bas 1024x768
19.9  fps    + Comparer
Moyen 1366x768
11  fps    + Comparer
» Les benchmarks indiquent que le jeu est injouable avec les paramètres testés.
Bas 1366x768
48.7  fps    + Comparer
Moyen 1366x768
29.2  fps    + Comparer
» Jouable avec tous les ordinateurs portables testés avec les détails paramétrés sur Bas.
Bas 1024x768
38.9  fps    + Comparer
Moyen 1366x768
25.2  fps    + Comparer
» Jouable avec tous les ordinateurs portables testés avec les détails paramétrés sur Bas.
Bas 1280x720
66.2  fps    + Comparer
Moyen 1366x768
41.8  fps    + Comparer
» Jouable avec tous les ordinateurs portables testés avec les détails paramétrés sur Moyen.
Bas 1024x768
110.4  fps    + Comparer
Moyen 1366x768
19.3  fps    + Comparer
» Jouable avec tous les ordinateurs portables testés avec les détails paramétrés sur Bas.
GTA V

GTA V

2015
Bas 1024x768
30.9  fps    + Comparer
Moyen 1366x768
26.8  fps    + Comparer
» Les benchmarks indiquent que le jeu est injouable avec les paramètres testés.
Bas 1024x768
31.5  fps    + Comparer
Moyen 1366x768
22.2  fps    + Comparer
» Les benchmarks indiquent que le jeu est injouable avec les paramètres testés.
F1 2014

F1 2014

2014
Bas 1024x768
72  fps    + Comparer
Moyen 1366x768
47  fps    + Comparer
» Jouable avec tous les ordinateurs portables testés avec les détails paramétrés sur Moyen.
Sims 4

Sims 4

2014
Bas 1024x768
173.7  fps    + Comparer
Moyen 1366x768
32.2  fps    + Comparer
» Jouable avec tous les ordinateurs portables testés avec les détails paramétrés sur Bas.
Bas 1024x768
135.5  fps    + Comparer
Moyen 1366x768
32.8  fps    + Comparer
» Jouable avec tous les ordinateurs portables testés avec les détails paramétrés sur Bas.
Bas 1024x768
33.4  fps    + Comparer
Moyen 1366x768
22.5  fps    + Comparer
Élevé 1366x768
15.9  fps    + Comparer
» Les benchmarks indiquent que le jeu est injouable avec les paramètres testés.
Bas 1280x720
39  fps    + Comparer
Moyen 1366x768
20.1  fps    + Comparer
Élevé 1366x768
17.7  fps    + Comparer
» Jouable avec tous les ordinateurs portables testés avec les détails paramétrés sur Bas.
Bas 1024x768
52.7  fps    + Comparer
Moyen 1366x768
23.9  fps    + Comparer
Élevé 1366x768
16.2  fps    + Comparer
» Jouable avec tous les ordinateurs portables testés avec les détails paramétrés sur Bas.

Pour plus de jeux susceptibles d'être fluides avec cette carte graphique et obtenir une liste exhaustive de tous les jeux et cartes graphiques testés, consultez notre liste des jeux.

v1.25
log 28. 20:45:10

#0 no ids found in url (should be separated by "_") +0s ... 0s

#1 not redirecting to Ajax server +0s ... 0s

#2 did not recreate cache, as it is less than 5 days old! Created at Mon, 28 Aug 2023 15:32:04 +0200 +0.001s ... 0.001s

#3 no comparison url found in template nbc.compare_page_1 needed +0.035s ... 0.036s

#4 no comparison url found in template nbc.compare_page_1 needed +0s ... 0.036s

#5 no comparison url found in template nbc.compare_page_1 needed +0s ... 0.036s

#6 no comparison url found in template nbc.compare_page_1 needed +0s ... 0.036s

#7 no comparison url found in template nbc.compare_page_1 needed +0s ... 0.037s

#8 no comparison url found in template nbc.compare_page_1 needed +0s ... 0.037s

#9 no comparison url found in template nbc.compare_page_1 needed +0s ... 0.038s

#10 no comparison url found in template nbc.compare_page_1 needed +0s ... 0.038s

#11 no comparison url found in template nbc.compare_page_1 needed +0s ... 0.038s

#12 no comparison url found in template nbc.compare_page_1 needed +0s ... 0.039s

#13 no comparison url found in template nbc.compare_page_1 needed +0s ... 0.039s

#14 no comparison url found in template nbc.compare_page_1 needed +0s ... 0.039s

#15 no comparison url found in template nbc.compare_page_1 needed +0s ... 0.039s

#16 composed specs +0s ... 0.039s

#17 did output specs +0s ... 0.039s

#18 start showIntegratedCPUs +0s ... 0.039s

#19 getting avg benchmarks for device 6475 +0.031s ... 0.07s

#20 got single benchmarks 6475 +0.015s ... 0.085s

#21 got avg benchmarks for devices +0s ... 0.085s

#22 min, max, avg, median took s +0.434s ... 0.518s

#23 before gaming benchmark output +0s ... 0.518s

#24 Got 42 rows for game benchmarks. +0.003s ... 0.521s

#25 composed SQL query for gamebenchmarks +0s ... 0.521s

#26 got data and put it in $dataArray +0.013s ... 0.534s

#27 benchmarks composed for output. +0.334s ... 0.869s

#28 no comparison url found in template nbc.compare_page_1 needed +0.003s ... 0.871s

#29 return log +0s ... 0.871s

Testés dans les ordinateurs portables : Intel HD Graphics 510 carte graphique

Toshiba Satellite Pro R50-C-1E8: unknown, 15.60", 2.1 kg
  Autres tests » Toshiba Satellite Pro R50-C-1E8

Acer Chromebook 14 CP5-471-C0EX: unknown, 14.00", 1.5 kg
  Autres tests » Acer Chromebook 14 CP5-471-C0EX

Toshiba Satellite Pro R40-C-13V: unknown, 14.00", 1.8 kg
  Autres tests » Toshiba Satellite Pro R40-C-13V

Medion Akoya E7419-MD60511: Intel Pentium 4405U, 17.30", 2.8 kg
  Autres tests » Medion Akoya E7419-MD60511

Acer TravelMate P2 TMP278-M-P5JU: Intel Pentium 4405U, 17.00", 3 kg
  Autres tests » Acer TravelMate P2 TMP278-M-P5JU

Lenovo E31-80-80MX00WHRK: Intel Pentium 4405U, 13.30", 1.6 kg
  Autres tests » Lenovo E31-80-80MX00WHRK

Lenovo Essential E31-80-80MX0170SP: unknown, 13.30", 1.6 kg
  Autres tests » Lenovo Essential E31-80-80MX0170SP

Medion Akoya E6421-30020549: Intel Pentium 4405U, 15.60", 2.3 kg
  Autres tests » Medion Akoya E6421-30020549

Acer TravelMate P258-M-P209: Intel Pentium 4405U, 15.60", 2.4 kg
  Autres tests » Acer TravelMate P258-M-P209

Medion Akoya E7419-MD60025: Intel Pentium 4405U, 17.30", 2.8 kg
  Autres tests » Medion Akoya E7419-MD60025

Dell Latitude 13 3000-N001L337913US: Intel Pentium 4405U, 13.30", 1.8 kg
  Autres tests » Dell Latitude 13 3000-N001L337913US

Lenovo Yoga 500-15ISK-80R60057GE: Intel Pentium 4405U, 15.60", 2.1 kg
  Autres tests » Lenovo Yoga 500-15ISK-80R60057GE

Please share our article, every link counts!

Rang 1

NVIDIA GeForce RTX 4090 Laptop GPU
NVIDIA RTX 5000 Ada Generation Laptop GPU
NVIDIA GeForce RTX 4080 Laptop GPU
NVIDIA RTX 4000 Ada Generation Laptop GPU
NVIDIA RTX 3500 Ada Generation Laptop GPU
NVIDIA GeForce RTX 4070 Laptop GPU
NVIDIA RTX 3000 Ada Generation Laptop GPU
NVIDIA GeForce RTX 4060 Laptop GPU
NVIDIA RTX 2000 Ada Generation Laptop GPU
GeForce RTX 2080 Super Mobile

Rang 2

Radeon RX 7600M XT *
Radeon RX 7700S *
M2 Max 38-Core GPU *
M1 Max 32-Core GPU *
M2 Max 30-Core GPU *
Radeon RX 7600M *
Radeon RX 7600S *
GeForce RTX 2070 Super Mobile
M1 Max 24-Core GPU *
M2 Pro 19-Core GPU *
Radeon RX 5700M *
M2 Pro 16-Core GPU *
M1 Pro 16-Core GPU *
Radeon PRO W6600M *
GeForce RTX 2070 Super Max-Q
M1 Pro 14-Core GPU *
GeForce GTX 1070 Mobile
NVIDIA GeForce RTX 4050 Laptop GPU
GeForce RTX 3050 6GB Laptop GPU
Radeon RX 6550M *
Radeon RX 6550S *
A370M *
Radeon RX 580X (Laptop) *
Radeon RX 580 (Laptop)
Radeon RX 6450M *
Radeon Pro 5300M
Radeon RX 5300M
Radeon RX 570X (Laptop) *
Radeon RX 570 (Laptop) *
Radeon RX 470 (Laptop) *

Rang 3

GeForce GTX 1050 Ti Mobile
Radeon 780M *
Radeon 680M
Quadro P2000 Max-Q
Radeon R9 M395X
GeForce GTX 1050 Ti Max-Q *
Radeon R9 M485X
GeForce GTX 1050 Max-Q *
Radeon 760M *
Radeon 660M
Radeon RX 560X (Laptop)
Radeon RX 560 (Laptop)
Radeon Pro 560X
Radeon Pro 560
Radeon Pro 460
Quadro P620 *
Radeon RX 550X (Laptop)
Radeon Pro 555X
Radeon Pro 555
Radeon Pro 455
Quadro P600
Radeon RX 540X *
Radeon Pro WX 2100 *
Radeon Pro 450
Radeon 630
Radeon 540X *
Quadro P520
Quadro P500 *
Iris Plus Graphics G7 (Ice Lake 64 EU) *
Vega 10 *
Iris Pro Graphics 580
Vega 9
UHD Graphics Xe G4 48EUs *
UHD Graphics Xe 32EUs (Tiger Lake-H) *
UHD Graphics 750
Radeon 740M *
Vega 7
Vega 8
Iris Plus Graphics G4 (Ice Lake 48 EU)
FirePro W4190M
Radeon R7 M445
UHD Graphics Xe 24EUs *
Radeon R7 M460 *
Radeon R7 M340
Radeon 610M *
UHD Graphics G1 (Ice Lake 32 EU)
UHD Graphics Xe 16EUs (Tiger Lake-H) *
Adreno 690 *
Adreno 685 *
Adreno 680 *

Rang 4

UHD Graphics 730
Radeon R5 M315 *
Radeon R5 M420 *
UHD Graphics 617
UHD Graphics 615
Radeon R4 (Stoney Ridge)
Radeon R2 (Stoney Ridge)

Rang 5

* Position approximative de la carte graphique

> Revues et rapports de ordinateurs portatifs et smartphones, ordiphones > FAQ > Comparaison de cartes graphiques mobiles > Intel > Intel HD Graphics 510
Klaus Hinum, 2016-01-22 (Update: 2016-01-22)