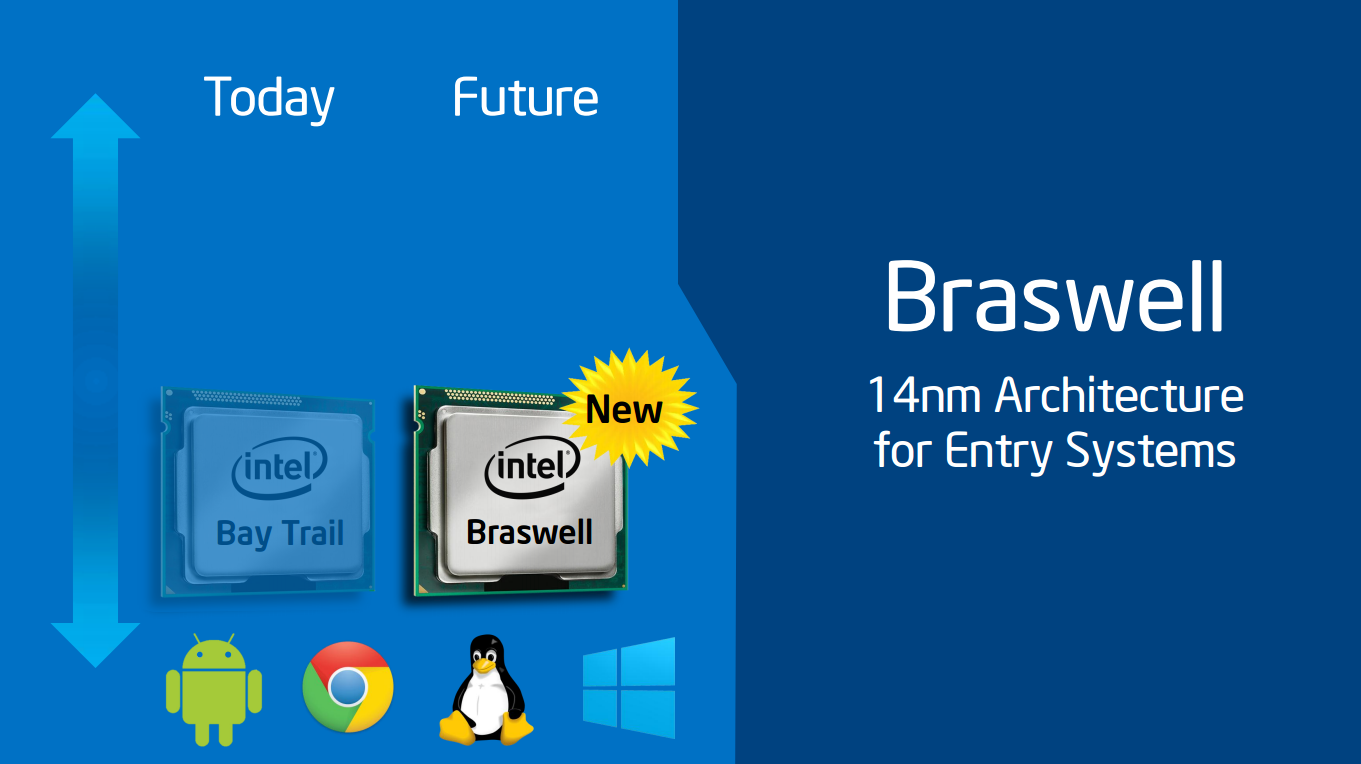
Testés dans les ordinateurs portables : Intel HD Graphics (Braswell) carte graphique
Courte critique du PC convertible HP Pavilion 11-k103ng x360
Adepte des canapés. Le dernier convertible de 11,6 pouces de HP offre une dalle IPS à hauts contrastes, un grand espace de stockage mais une autonomie un peu trop courte.
Intel Celeron N3050, HD Graphics (Braswell), 11.6", 1.5 kgCourte critique de l'Ultraportable HP Stream 11-r000ng
Le renouveau du Netbook ? Pour environ 200 euros, il est possible d'acquérir un mini-ordinateur portable Windows doté d'un petit espace de stockage et d'une dalle TN très moyenne. A ce prix, cela reste très intéressant pour un appareil tournant sous Windows 10 Home (64-bit).
Intel Celeron N3050, HD Graphics (Braswell), 11.6", 1.1 kgCourte critique de l'Ultraportable Dell Inspiron 11 3162
Endurant. Le dernier petit netbook de Dell ajoute un peu de couleur et offre une excellente autonomie. A 250 euros, nous sommes au niveaux des modèles rivaux.
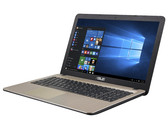
Intel Celeron N3050, HD Graphics (Braswell), 11.6", 1.2 kgCourte critique du PC portable Asus F540SA-XX087T
Satisfaisant. Simple PC portable de 15,6 pouces, basé sur un CPU Brasweel, le F540SA-XX087T peut être acheté pour tout juste moins de 280 €, incluant Windows et un disque dur de 500 GB. Asus a également installé un port USB de type C dans ce PC à bas prix.
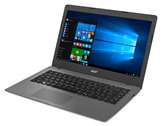
Intel Celeron N3050, HD Graphics (Braswell), 15.6", 1.9 kgCourte critique du PC portable Acer Aspire One Cloudbook 14 AO1-431-C6QM
Bureautique endurant. Cet Acer de 14 pouces ne propose qu'un processeur peu performant mais une très excellente autonomie. Son prix d'environ 280 Euros (~$310) et la licence Office 365 Personnel d'un an incluse peuvent en faire un PC intéressant pour certains utilisateurs.
Intel Celeron N3050, HD Graphics (Braswell), 14", 1.6 kgLenovo Yoga 300-11IBR: Intel Celeron N3050, 11.60", 1.4 kg
Critique » Courte critique du convertible Lenovo Yoga 300-11IBR
Lenovo IdeaPad 300S-11IBR: Intel Celeron N3050, 11.60", 1.3 kg
Critique » Courte critique du Netbook Lenovo IdeaPad 300S-11IBR
HP Stream 13-c102ng: Intel Celeron N3050, 13.30", 1.5 kg
Critique » Courte critique du PC portable HP Stream 13-c102ng
Acer Aspire ES1-731-P4A6: Intel Pentium N3700, 17.30", 3 kg
Critique » Courte critique du PC portable Acer Aspire ES1-731-P4A6
Acer Aspire One Cloudbook 11 AO1-131-C58K: Intel Celeron N3050, 11.60", 1.2 kg
Critique » Courte critique du Netbook Acer Aspire One Cloudbook 11
Toshiba Satellite Radius 11 L10W-C-108: Intel Pentium N3700, 11.60", 1.3 kg
Critique » Courte critique du PC portable Toshiba Satellite Radius 11 L10W-C-108
Acer Extensa 2519-C7DC: Intel Celeron N3050, 15.60", 2.4 kg
Critique » Courte critique du PC Portable Acer Extensa 2519-C7DC
Asus ASUS Transformer Book Flip TP200SA-DH04T: Intel Celeron N3050, 11.60", 1.2 kg
Critique » Courte critique du PC Convertible Asus Transformer Book Flip TP200SA
Acer Aspire ES1-331-C5KL: Intel Celeron N3150, 13.30", 1.6 kg
Critique » Courte critique du PC portable Acer Aspire ES1-331-C5KL
Acer Aspire R11 R3-131T-C122: Intel Celeron N3050, 11.60", 1.4 kg
Critique » Courte critique du PC Convertible Acer Aspire R11 R3-131T
Acer Aspire ES1-131: Intel Celeron N3050, 11.60", 1.1 kg
Critique » Courte critique du PC portable Acer Aspire ES1-131
Lenovo N23 Ruggedized 80YS0044NH: Intel Celeron N3160, 11.60", 1.3 kg
Autres tests » Lenovo N23 Ruggedized 80YS0044NH
Asus X540SA-XX106T: Intel Pentium N3700, 15.60", 2 kg
Autres tests » Asus X540SA-XX106T
Lenovo Ideapad 100S-14IBR-80R9003XMH: Intel Celeron N3150, 14.00", 1.5 kg
Autres tests » Lenovo Ideapad 100S-14IBR-80R9003XMH
Acer Extensa 2519-C7L5: Intel Celeron N3160, 15.60", 2 kg
Autres tests » Acer Extensa 2519-C7L5
Acer Chromebook R11 CB5-132T-C9KK: Intel Celeron N3160, 11.60", 1.3 kg
Autres tests » Acer Chromebook R11 CB5-132T-C9KK
Lenovo Ideapad 110-15IBR-80T700JXSP: Intel Celeron N3160, 15.60", 2.3 kg
Autres tests » Lenovo Ideapad 110-15IBR-80T700JXSP
Acer Chromebook 14 CB3-431-C8YS: Intel Celeron N3160, 14.00", 1.7 kg
Autres tests » Acer Chromebook 14 CB3-431-C8YS
Acer Chromebook 11 N7 C731-C28L: Intel Celeron N3160, 11.60", 1.3 kg
Autres tests » Acer Chromebook 11 N7 C731-C28L
Asus Transformer Book Flip TP200SA-FV0111R: Intel Celeron N3050, 11.60", 1.2 kg
Autres tests » Asus Transformer Book Flip TP200SA-FV0111R
Asus F553SA-XX305T: Intel Celeron N3050, 15.60", 2.7 kg
Autres tests » Asus F553SA-XX305T
Acer Aspire ES1-531-C5D9: Intel Celeron N3050, 15.60", 2.4 kg
Autres tests » Acer Aspire ES1-531-C5D9
Acer TravelMate B117-M-C661: Intel Celeron N3150, 11.60", 1.4 kg
Autres tests » Acer TravelMate B117-M-C661
Asus X541SA-XX038D: Intel Celeron N3060, 15.60", 2 kg
Autres tests » Asus X541SA-XX038D
Acer Aspire R11 R3-131T-C9QV: Intel Celeron N3050, 11.60", 1.6 kg
Autres tests » Acer Aspire R11 R3-131T-C9QV
Lenovo Ideapad 100S-14IBR-80R9003MSP: Intel Celeron N3050, 14.00", 2.5 kg
Autres tests » Lenovo Ideapad 100S-14IBR-80R9003MSP
Acer Aspire One Cloudbook 11 AO1-131-C7U3: Intel Celeron N3050, 11.60", 1.2 kg
Autres tests » Acer Aspire One Cloudbook 11 AO1-131-C7U3
Lenovo Ideapad 100S-11IBY-80R90043TX: Intel Celeron N3050, 11.60", 1 kg
Autres tests » Lenovo Ideapad 100S-11IBY-80R90043TX
HP Stream 13-c100ns: Intel Celeron N3050, 13.30", 1.6 kg
Autres tests » HP Stream 13-c100ns
Acer Aspire Z3-700: Intel Pentium N3700, 17.30", 2 kg
Autres tests » Acer Aspire Z3-700
HP Stream 11-r000ns: Intel Celeron N3050, 11.60", 1.8 kg
Autres tests » HP Stream 11-r000ns
HP 15-ac131ns: Intel Celeron N3050, 15.60", 2.2 kg
Autres tests » HP 15-ac131ns
HP 14-AC106NS: Intel Celeron N3050, 14.00", 2 kg
Autres tests » HP 14-AC106NS
Toshiba Satellite L12-C-104: Intel Celeron N3050, 11.60", 2 kg
Autres tests » Toshiba Satellite L12-C-104
Lenovo ThinkPad Yoga 11e 20GB000XMH: Intel Celeron N3150, 11.60", 1.5 kg
Autres tests » Lenovo ThinkPad Yoga 11e 20GB000XMH
Acer Aspire ES1-331-P4HL: Intel Pentium N3700, 13.30", 1.5 kg
Autres tests » Acer Aspire ES1-331-P4HL
Asus X540SA-XX004D: Intel Celeron N3050, 15.60", 1.9 kg
Autres tests » Asus X540SA-XX004D
Asus F540SA-XX110T: Intel Celeron N3050, 15.60", 2 kg
Autres tests » Asus F540SA-XX110T
Acer TravelMate B117-M-C2KX: Intel Celeron N3050, 11.60", 1.4 kg
Autres tests » Acer TravelMate B117-M-C2KX
Asus L202SA-FD0041T: Intel Celeron N3050, 11.60", 1.3 kg
Autres tests » Asus L202SA-FD0041T
Acer Chromebook 14 CB3-431-C5K7: Intel Celeron N3160, 14.00", 1.7 kg
Autres tests » Acer Chromebook 14 CB3-431-C5K7
Asus VivoBook R417SA-WX011T: Intel Celeron N3050, 14.00", 1.7 kg
Autres tests » Asus VivoBook R417SA-WX011T
Asus P2428SA-WO0084D: Intel Celeron N3050, 14.00", 2 kg
Autres tests » Asus P2428SA-WO0084D
Medion Akoya S6219-MD60027: Intel Pentium N3700, 15.60", 1.9 kg
Autres tests » Medion Akoya S6219-MD60027
HP Pavilion 17-g148ng: Intel Pentium N3700, 17.30", 2.8 kg
Autres tests » HP Pavilion 17-g148ng
HP Pavilion 15-ab213ng: Intel Pentium N3700, 15.60", 2.3 kg
Autres tests » HP Pavilion 15-ab213ng
Toshiba Satellite Radius 11 L10W-C-108: Intel Pentium N3700, 11.60", 1.3 kg
Autres tests » Toshiba Satellite Radius 11 L10W-C-108
HP 15-ac002ur: Intel Celeron N3050, 15.60", 2.2 kg
Autres tests » HP 15-ac002ur
Acer Aspire E5-532: Intel Celeron N3050, 15.60", 2.1 kg
Autres tests » Acer Aspire E5-532
Asus A553SA: Intel Pentium N3700, 15.60", 2 kg
Autres tests » Asus A553SA
Asus X553SA-XX207D: Intel Pentium N3700, 15.60", 2 kg
Autres tests » Asus X553SA-XX207D
Acer Aspire ES1-731-C5TV: Intel Celeron N3150, 17.30", 3 kg
Autres tests » Acer Aspire ES1-731-C5TV
HP Pavilion 17-g122ng: Intel Pentium N3700, 17.30", 2.8 kg
Autres tests » HP Pavilion 17-g122ng
Dell Inspiron 11 3162: Intel Celeron N3050, 11.60", 1.2 kg
Autres tests » Dell Inspiron 11 3162
Lenovo Yoga 300-11IBR: Intel Celeron N3050, 11.60", 1.4 kg
Autres tests » Lenovo Yoga 300-11IBR
HP Stream 11-r004nf : Intel Celeron N3050, 11.60", 1.9 kg
Autres tests » HP Stream 11-r004nf
Acer TravelMate B116-M-P6JK: Intel Pentium N3700, 11.60", 1.3 kg
Autres tests » Acer TravelMate B116-M-P6JK
Dell Inspiron 15-3552: Intel Pentium N3700, 15.60", 2.1 kg
Autres tests » Dell Inspiron 15-3552
Asus E402SA-DS01-BL: Intel Celeron N3050, 14.00", 1.5 kg
Autres tests » Asus E402SA-DS01-BL
Asus VivoBook E403SA-US21: Intel Pentium N3700, 14.00", 1.5 kg
Autres tests » Asus VivoBook E403SA-US21
Acer Chromebook 11 CB5-132T-C32M: Intel Celeron N3150, 11.60", 1.2 kg
Autres tests » Acer Chromebook 11 CB5-132T-C32M
Acer Chromebook 14 CB3-431-C5FM: unknown, 14.00", 1.5 kg
Autres tests » Acer Chromebook 14 CB3-431-C5FM
HP Stream 11-r010nr: Intel Celeron N3050, 11.60", 1.2 kg
Autres tests » HP Stream 11-r010nr
Asus Transformer Book Flip TP200SA-FV0110TS: Intel Celeron N3050, 11.60", 1.2 kg
Autres tests » Asus Transformer Book Flip TP200SA-FV0110TS
Acer Chromebook 11 CB5-132T-C8KL: Intel Celeron N3050, 11.60", 1.3 kg
Autres tests » Acer Chromebook 11 CB5-132T-C8KL
Toshiba Satellite Radius 11 L12W-C-10E: Intel Pentium N3700, 11.60", 1.4 kg
Autres tests » Toshiba Satellite Radius 11 L12W-C-10E
Acer Travelmate B116-M-C0YQ: Intel Celeron N3150, 11.60", 1.3 kg
Autres tests » Acer Travelmate B116-M-C0YQ
Asus X540SA-XX048T: Intel Celeron N3050, 15.60", 1.9 kg
Autres tests » Asus X540SA-XX048T
Asus Transformer Book Flip TP200SA-FV0048T: Intel Celeron N3050, 11.60", 1.2 kg
Autres tests » Asus Transformer Book Flip TP200SA-FV0048T
Dell Inspiron 14-3452: Intel Pentium N3700, 14.00", 1.7 kg
Autres tests » Dell Inspiron 14-3452
HP Stream 13-c110nr: Intel Celeron N3050, 13.30", 1.6 kg
Autres tests » HP Stream 13-c110nr
Dell Inspiron 15-3558, Celeron N3050: Intel Celeron N3050, 15.60", 2.3 kg
Autres tests » Dell Inspiron 15-3558, Celeron N3050
Acer Chromebook CB5-132T-C1LK: Intel Celeron N3150, 11.60", 1.3 kg
Autres tests » Acer Chromebook CB5-132T-C1LK
HP 15-ac100ur: Intel Celeron N3050, 15.60", 2.2 kg
Autres tests » HP 15-ac100ur
HP Stream 11-R000UR: Intel Celeron N3050, 11.60", 1.2 kg
Autres tests » HP Stream 11-R000UR
Asus EeeBook E202SA: Intel Celeron N3050, 11.60", 1.2 kg
Autres tests » Asus EeeBook E202SA
Acer Chromebook CB5-132T-C32M: Intel Celeron N3150, 11.60", 1.2 kg
Autres tests » Acer Chromebook CB5-132T-C32M
Acer Aspire ES1-531-P1N8: Intel Pentium N3700, 15.60", 2.4 kg
Autres tests » Acer Aspire ES1-531-P1N8
Acer Aspire ES1-331-C8XF: Intel Celeron N3150, 13.30", 1.5 kg
Autres tests » Acer Aspire ES1-331-C8XF
Asus Transformer Book Flip TP200SA-FV00TS: Intel Celeron N3050, 11.60", 1.2 kg
Autres tests » Asus Transformer Book Flip TP200SA-FV00TS
Acer Aspire One Cloudbook 11 AO1-131-C1G9: Intel Celeron N3050, 11.60", 1.1 kg
Autres tests » Acer Aspire One Cloudbook 11 AO1-131-C1G9
HP Pavilion 11-k000ng x360: Intel Pentium N3700, 11.60", 1.4 kg
Autres tests » HP Pavilion 11-k000ng x360
Acer Extensa 2519-C1Q2: Intel Celeron N3050, 15.60", 2.4 kg
Autres tests » Acer Extensa 2519-C1Q2
Acer Aspire One Cloudbook 14 AO1-431-C1FZ: Intel Celeron N3050, 14.00", 1.6 kg
Autres tests » Acer Aspire One Cloudbook 11 AO1-431-C1FZ
Asus ASUS Transformer Book Flip TP200SA-DH04T: Intel Celeron N3050, 11.60", 1.2 kg
Autres tests » Asus ASUS Transformer Book Flip TP200SA-DH04T
Toshiba Satellite C40-C-10K: Intel Celeron N3050, 14.00", 1.7 kg
Autres tests » Toshiba Satellite C40-C-10K
Acer Aspire R11 R3-131T-C122: Intel Celeron N3050, 11.60", 1.4 kg
Autres tests » Acer Aspire R11 R3-131T-C122
Acer Aspire R3-131-C72X: Intel Celeron N3050, 11.60", 1.6 kg
Autres tests » Acer Aspire R3-131-C72X
Acer Aspire R3-131T: Intel Pentium N3700, 11.60", 1.5 kg
Autres tests » Acer Aspire R3-131T