NVIDIA GeForce RTX 3050 Ti Laptop GPU
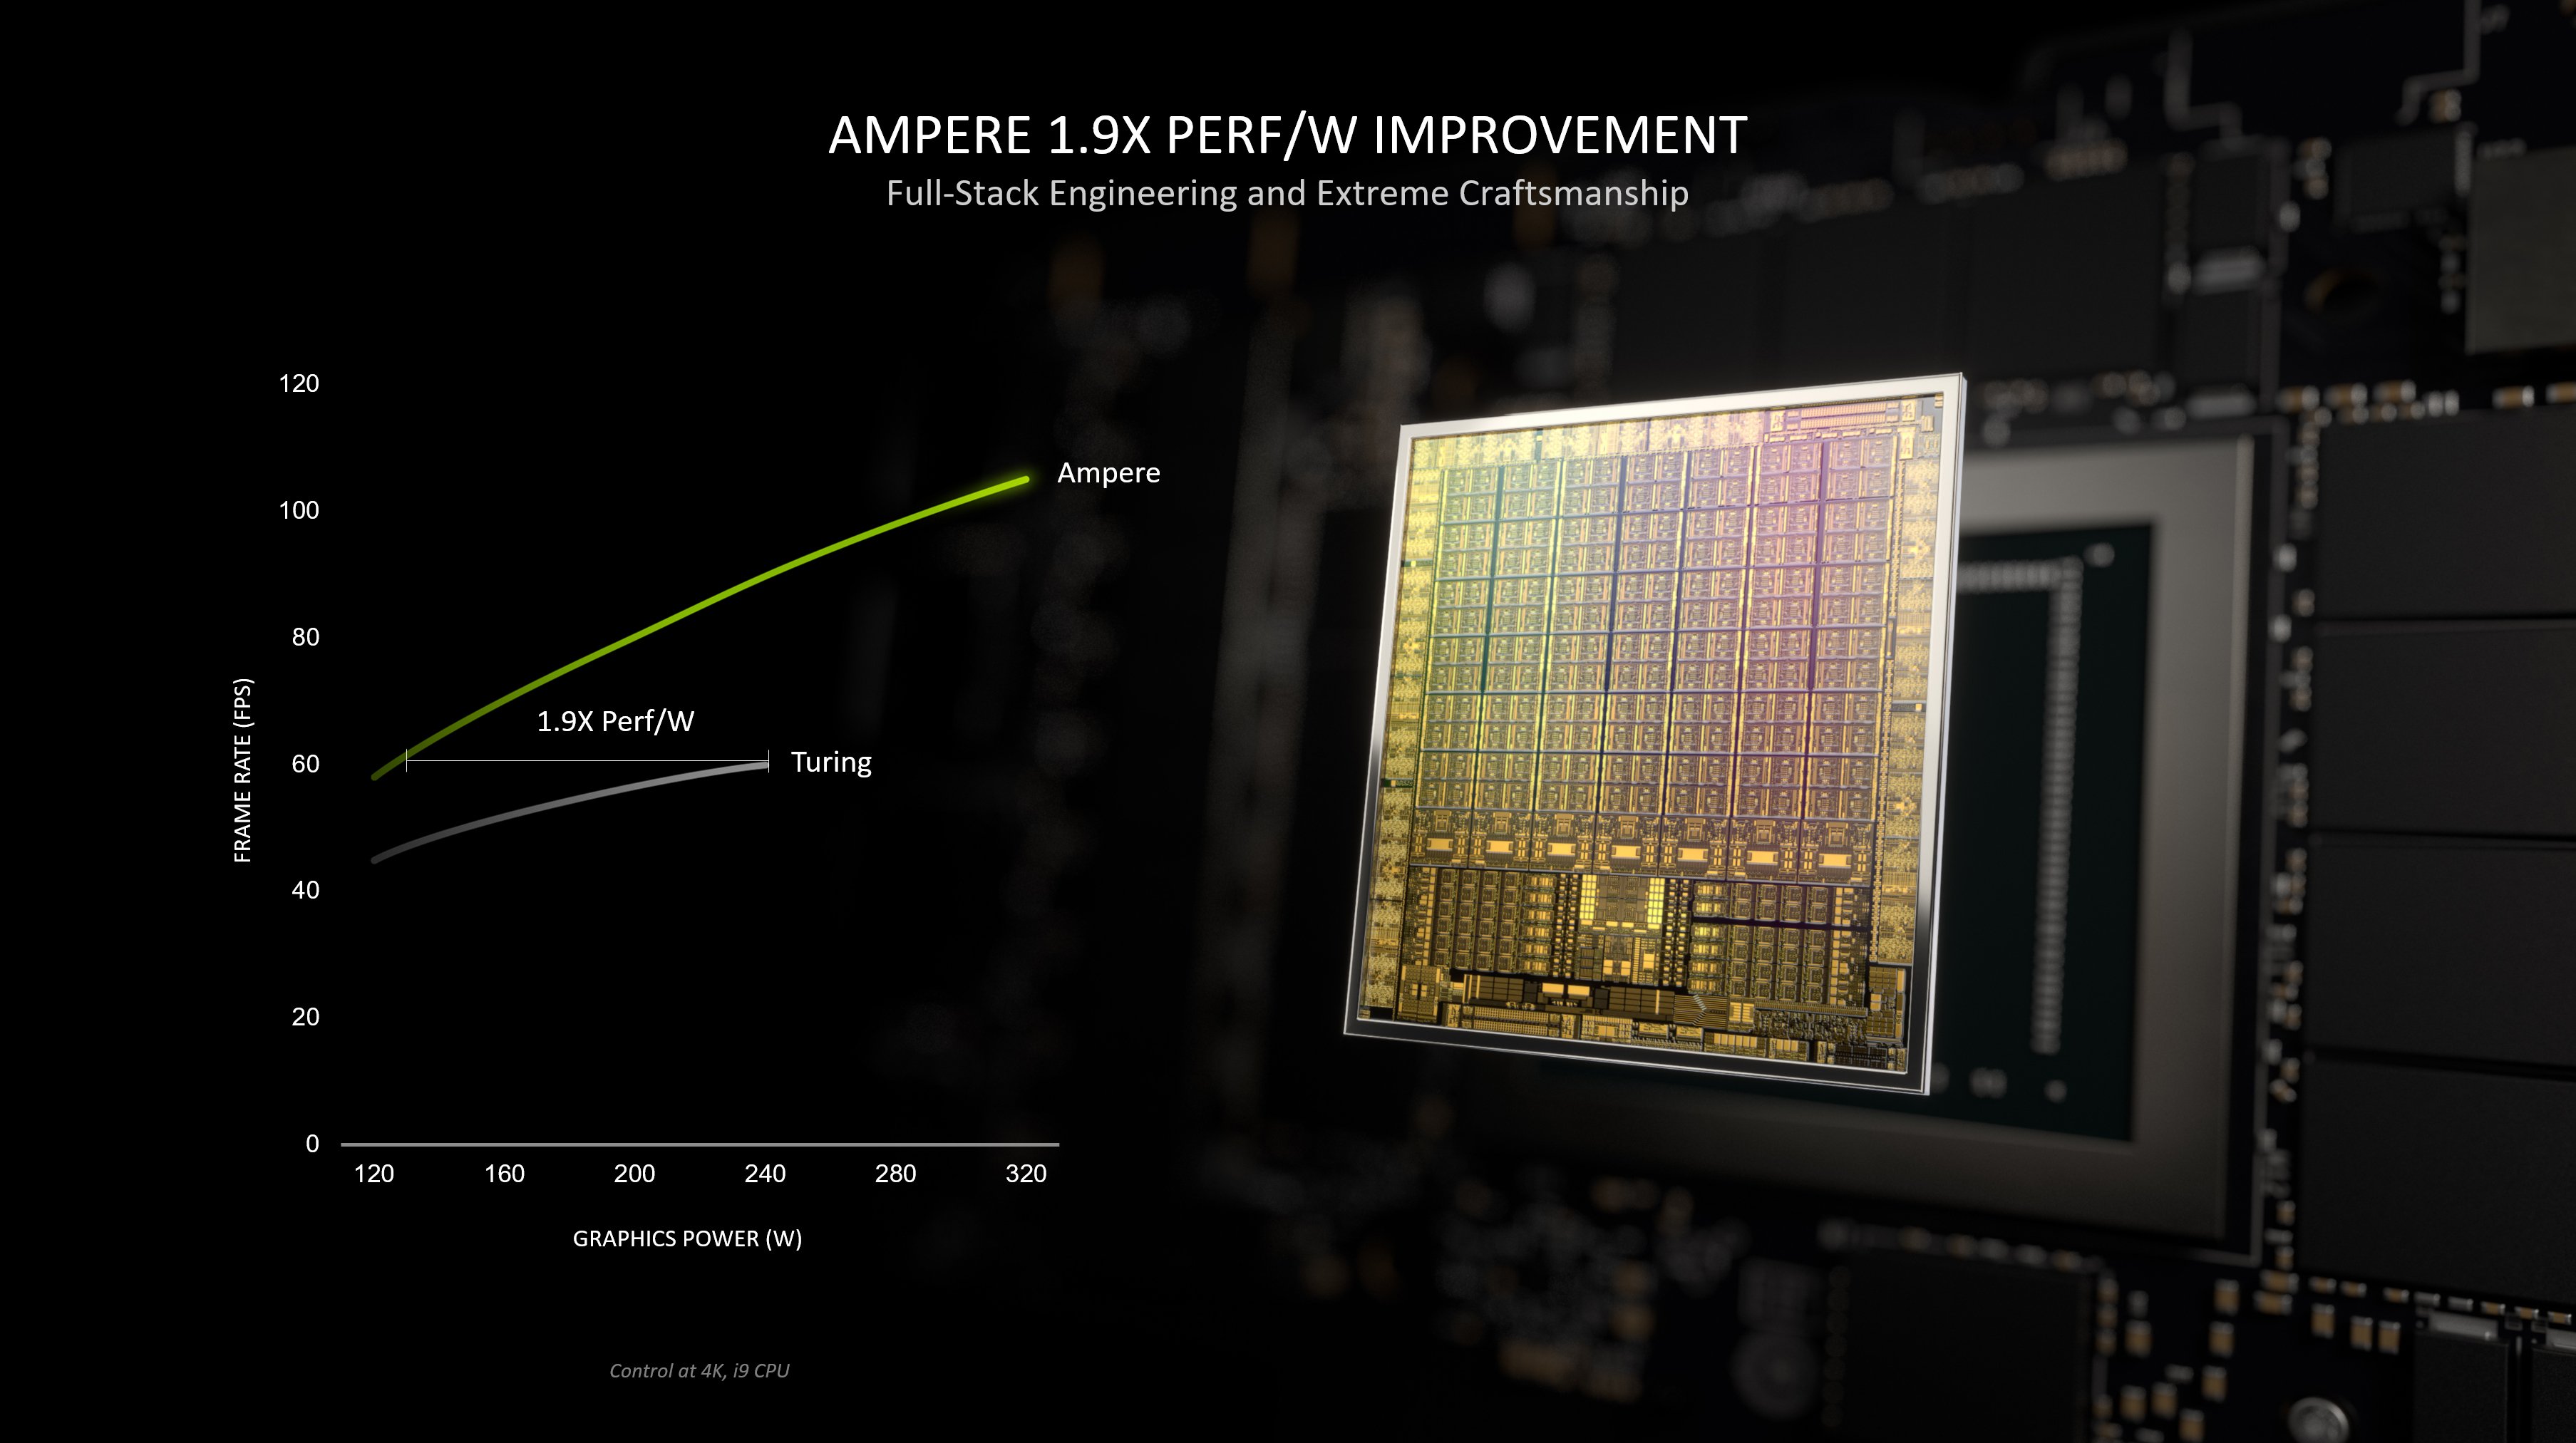
Le GPU Nvidia GeForce RTX 3050 Ti Laptop (pour ordinateurs portables, NVIDIA_DEV.2583, GN20-P1) est une variante plus rapide de la carte mobile RTX 3050 et basée sur la puce GA107 Ampere. La puce offre 2560 CUDA, 20 Ray Tracing et 80 cores Tensor. La fréquence d'horloge dépend de la version TGP utilisée (de 35 à 80 watts).
Vitesses d'horloge non vérifiées
TGP (consommation d'énergie) 35 W 40 W 45 W 50 W 60 W 70 W 80 W
Vitesse d'horloge de base (MHz) 735 915 1043 1140 1223 1350 1463
Vitesse d'horloge Boost (MHz) 1035 1185 1290 1410 1485 1598 1695
Les performances (des variantes TGP élevées) devraient être similaires à celles de l'ancienne RTX 2060 et donc plus adaptées aux jeux en 1080p avec des paramètres de détails élevés. Les performances ne sont pas suffisantes pour permettre le Raytracing dans la plupart des jeux, mais les cœurs Tensor peuvent être utilisés pour DLSS dans certains jeux (et obtenir une augmentation des performances avec une légère réduction de la qualité). Attention, les variantes à faible TGP offrent des performances nettement inférieures.
La puce GA107 offre 3 072 FP32 ALUs dont la moitié peut également exécuter des instructions INT32 (soit 1 536 INT32 ALUs). La RTX 3050 n'utilisera peut-être pas toutes les UAL de la puce. Avec Turing, tous les shaders pourraient encore exécuter des instructions FP32 ou INT32. Selon Nvidia, le raytracing et les cœurs tenseurs de la puce ont également été améliorés. Les puces Ampere comprennent également un encodeur vidéo amélioré de 5e génération (NVENC pour H.264 et H.265) et un décodeur de 7e génération (pour divers formats, dont AV1).
La puce GA107 est fabriquée par Samsung en 8 nm (8N), ce qui n'est pas tout à fait à la hauteur du nœud de 7 nm de TSMC (utilisé par exemple par AMD et aussi pour la puce professionnelle GA100 d'Ampere).
GeForce RTX 3000 Gamme Nom de code GN20-P1 Architecture Ampere Pipelines 2560 - unifiés TMUs 80 ROPs 32 Raytracing Cores 20 Tensor / AI Cores 80 Fréquence du noyau interne 1222 - 1485 (Boost) MHz Fréquence de la mémoire 12000 effective = 1500 MHz Largeur du bus mémoire 128 Bit Type de mémoire GDDR6 Quantité maximale possible de mémoire embarquée 4 GB Mémoire partagée non Memory Bandwidth 195 GB/s API DirectX 12_2, Shader 6.7, OpenGL 4.6 Consommation d'énergie 60 Watt(s) (35 - 80 Watt(s) TGP) technologie 8 nm PCIe 4.0 Displays HDMI 2.1, DisplayPort 1.4a Caractéristiques NVIDIA DLSS, NVIDIA Reflex, NVIDIA Broadcast, Resizable BAR, NVIDIA Ansel, NVIDIA FreeStyle, NVIDIA ShadowPlay®, NVIDIA G-SYNC® Dimension de l'ordinateur portable de grandes dimensions (en remplacement d'un ordinateur de bureau) Date de présentation 10.05.2021
Benchmarks Performance Rating - 3DMark 11 + Fire Strike + Time Spy
6.1 pt (18%)
...
NVIDIA GeForce RTX 3050 Ti Laptop GPU
...
max:
3DMark - 3DMark Time Spy Score
min: 4013 moyenne: 5436 médian: 5341 (15%) maximum: 6417 Points
GPU TDP 35 W TDP 40 W TDP 45 W TDP 50 W TDP 60 W TDP 65 W TDP 75 W TDP 80 W TDP 85 W TDP 90 W TDP 95 W 79% 73% 78% 81% 87% 84% 93% 83% 97% 90% 100%
...
NVIDIA GeForce GTX 1070 Mobile
NVIDIA GeForce RTX 3050 Ti Laptop GPU
...
max:
3DMark - 3DMark Time Spy Graphics
min: 3744 moyenne: 5177 médian: 5170 (14%) maximum: 6122 Points
GPU TDP 35 W TDP 40 W TDP 45 W TDP 50 W TDP 60 W TDP 65 W TDP 75 W TDP 80 W TDP 85 W TDP 90 W TDP 95 W 79% 70% 76% 80% 88% 81% 92% 94% 97% 93% 100%
...
NVIDIA GeForce RTX 3050 Ti Laptop GPU
NVIDIA GeForce GTX 1070 Mobile
...
max:
3DMark - 3DMark Ice Storm Unlimited Graphics
min: 411501 moyenne: 428028 médian: 422757 (48%) maximum: 449825 Points
GPU TDP 50 W TDP 60 W TDP 90 W 100% 91% 94%
...
NVIDIA GeForce RTX 3050 Ti Laptop GPU
NVIDIA GeForce RTX 2070 Super Max-Q
NVIDIA GeForce RTX 2070 Super Mobile
...
max:
NVIDIA GeForce RTX 3070 Ti
3DMark - 3DMark Ice Storm Extreme Graphics
min: 40206 moyenne: 80000 médian: 85995 (11%) maximum: 113799 Points
GPU TDP 50 W TDP 60 W TDP 90 W 35% 76% 100%
...
AMD Radeon RX Vega 10
NVIDIA GeForce RTX 3050 Ti Laptop GPU
...
max:
3DMark - 3DMark Cloud Gate Score
min: 21679 moyenne: 36252 médian: 39980 (43%) maximum: 50957 Points
GPU TDP 35 W TDP 40 W TDP 45 W TDP 50 W TDP 60 W TDP 65 W TDP 75 W TDP 80 W TDP 85 W TDP 90 W TDP 95 W 46% 66% 68% 68% 68% 88% 86% 46% 100% 72% 88%
...
NVIDIA GeForce RTX 3050 Ti Laptop GPU
...
max:
3DMark - 3DMark Cloud Gate Graphics
min: 30158 moyenne: 67913 médian: 72925 (19%) maximum: 102432 Points
GPU TDP 35 W TDP 40 W TDP 45 W TDP 50 W TDP 60 W TDP 65 W TDP 75 W TDP 80 W TDP 85 W TDP 90 W TDP 95 W 35% 51% 56% 53% 73% 73% 83% 48% 100% 67% 72%
...
NVIDIA GeForce RTX 3050 Ti Laptop GPU
AMD Radeon RX 580 (Laptop)
...
max:
3DMark - 3DMark Fire Strike Standard Score
min: 6670 moyenne: 11709 médian: 11894 (21%) maximum: 14086 Points
GPU TDP 35 W TDP 40 W TDP 45 W TDP 50 W TDP 60 W TDP 65 W TDP 75 W TDP 80 W TDP 85 W TDP 90 W TDP 95 W 77% 67% 78% 76% 88% 86% 94% 85% 100% 89% 97%
...
NVIDIA GeForce RTX 3050 Ti Laptop GPU
...
max:
3DMark - 3DMark Fire Strike Standard Graphics
min: 7917 moyenne: 13090 médian: 13359.5 (15%) maximum: 15611 Points
GPU TDP 35 W TDP 40 W TDP 45 W TDP 50 W TDP 60 W TDP 65 W TDP 75 W TDP 80 W TDP 85 W TDP 90 W TDP 95 W 77% 67% 78% 76% 89% 84% 94% 93% 100% 91% 95%
...
NVIDIA GeForce RTX 3050 Ti Laptop GPU
...
max:
3DMark - 3DMark Ice Storm Graphics
min: 40465 moyenne: 100758 médian: 107156 (13%) maximum: 145883 Points
GPU TDP 50 W TDP 60 W TDP 75 W TDP 80 W TDP 90 W 28% 73% 100% 40% 100%
...
AMD Radeon RX Vega 10
AMD Radeon RX Vega 9
NVIDIA GeForce RTX 3050 Ti Laptop GPU
Intel HD Graphics 630
...
max:
3DMark - 3DMark Wild Life Extreme Unlimited
min: 9340 moyenne: 9453 médian: 9452.5 (11%) maximum: 9565 Points
GPU TDP 45 W TDP 50 W 98% 100%
...
Apple M2 10-Core GPU
Apple M3 10-Core GPU
Apple M1 Pro 14-Core GPU
NVIDIA GeForce RTX 3050 Ti Laptop GPU
Apple M1 Pro 16-Core GPU
...
max:
3DMark 11 - 3DM11 Performance Score
min: 8322 moyenne: 16441 médian: 16439 (23%) maximum: 19254 Points
GPU TDP 35 W TDP 40 W TDP 45 W TDP 50 W TDP 60 W TDP 65 W TDP 75 W TDP 80 W TDP 85 W TDP 90 W TDP 95 W 84% 73% 77% 84% 87% 91% 97% 68% 100% 88% 97%
...
NVIDIA GeForce RTX 3050 Ti Laptop GPU
NVIDIA GeForce GTX 1070 Mobile
...
max:
3DMark 11 - 3DM11 Performance GPU
min: 7952 moyenne: 17562 médian: 18057 (16%) maximum: 20905 Points
GPU TDP 35 W TDP 40 W TDP 45 W TDP 50 W TDP 60 W TDP 65 W TDP 75 W TDP 80 W TDP 85 W TDP 90 W TDP 95 W 81% 66% 73% 81% 91% 84% 93% 96% 100% 94% 100%
...
AMD Radeon RX 580 (Laptop)
NVIDIA GeForce RTX 3050 Ti Laptop GPU
...
max:
3DMark 06 3DMark 06 - Standard 1280x1024 +
45370 Points (59%)
...
NVIDIA GeForce RTX 2070 Super Mobile
NVIDIA GeForce RTX 2070 Super Max-Q
NVIDIA GeForce RTX 3050 Ti Laptop GPU
...
max:
Blender - Blender 3.3 Classroom CUDA *
min: 83 moyenne: 90 médian: 91 (13%) maximum: 104 Seconds
GPU TDP 40 W TDP 45 W TDP 65 W TDP 75 W TDP 85 W 100% 101% 102% 103% 103%
...
NVIDIA GeForce RTX 3050 Ti Laptop GPU
...
Blender - Blender 3.3 Classroom OPTIX *
min: 48 moyenne: 52.3 médian: 53 (20%) maximum: 60 Seconds
GPU TDP 40 W TDP 45 W TDP 65 W TDP 75 W TDP 85 W 100% 102% 103% 104% 104%
...
NVIDIA GeForce RTX 3050 Ti Laptop GPU
SPECviewperf 12 + SPECviewperf 12 - specvp12 sw-03
52.6 fps (13%)
...
NVIDIA GeForce GTX 1070 Mobile
AMD Radeon Pro 555
NVIDIA GeForce RTX 3050 Ti Laptop GPU
AMD Radeon RX 580 (Laptop)
AMD Radeon RX Vega 7
...
max:
specvp12 snx-02 + SPECviewperf 12 - specvp12 snx-02
7.3 fps (1%)
...
NVIDIA GeForce GTX 1050 Ti Mobile
NVIDIA GeForce RTX 3050 Ti Laptop GPU
NVIDIA GeForce GTX 1070 Mobile
AMD Radeon RX Vega 10
...
max:
specvp12 showcase-01 + SPECviewperf 12 - specvp12 showcase-01
69 fps (15%)
...
NVIDIA GeForce RTX 3050 Ti Laptop GPU
...
max:
specvp12 mediacal-01 + SPECviewperf 12 - specvp12 mediacal-01
32.2 fps (8%)
...
AMD Radeon 680M
NVIDIA GeForce RTX 3050 Ti Laptop GPU
...
max:
specvp12 maya-04 + SPECviewperf 12 - specvp12 maya-04
88.6 fps (24%)
...
NVIDIA GeForce RTX 3050 Ti Laptop GPU
NVIDIA GeForce GTX 1070 Mobile
...
max:
specvp12 energy-01 + SPECviewperf 12 - specvp12 energy-01
6.6 fps (6%)
...
NVIDIA Quadro P2000 Max-Q
NVIDIA GeForce RTX 3050 Ti Laptop GPU
...
AMD Radeon 660M
max:
specvp12 creo-01 + SPECviewperf 12 - specvp12 creo-01
42.7 fps (17%)
...
AMD Radeon 660M
NVIDIA Quadro P600
AMD Radeon 680M
NVIDIA GeForce RTX 3050 Ti Laptop GPU
NVIDIA GeForce GTX 1070 Mobile
...
max:
specvp12 catia-04 + SPECviewperf 12 - specvp12 catia-04
58.8 fps (10%)
...
NVIDIA Quadro P620
NVIDIA GeForce RTX 3050 Ti Laptop GPU
NVIDIA Quadro P2000 Max-Q
AMD Radeon 680M
...
max:
specvp12 3dsmax-05 + SPECviewperf 12 - specvp12 3dsmax-05
133 fps (23%)
...
NVIDIA GeForce RTX 3050 Ti Laptop GPU
...
max:
SPECviewperf 13 specvp13 sw-04 + SPECviewperf 13 - specvp13 sw-04
79.5 fps (21%)
Intel Iris Plus Graphics G7 (Ice Lake 64 EU)
...
AMD Radeon 660M
AMD Radeon RX 5300M
NVIDIA Quadro P2000 Max-Q
NVIDIA GeForce RTX 3050 Ti Laptop GPU
NVIDIA Quadro P620
NVIDIA GeForce RTX 2070 Super Max-Q
NVIDIA GeForce RTX 2080 Super Mobile
AMD Radeon 680M
...
max:
specvp13 snx-03 + SPECviewperf 13 - specvp13 snx-03
13.3 fps (1%)
...
Intel UHD Graphics Xe 16EUs (Tiger Lake-H)
NVIDIA GeForce RTX 3050 Ti Laptop GPU
AMD Radeon RX Vega 10
NVIDIA GeForce RTX 2070 Super Max-Q
...
max:
specvp13 showcase-02 + SPECviewperf 13 - specvp13 showcase-02
68.9 fps (15%)
Intel UHD Graphics 24EUs (Alder Lake-N)
...
AMD Radeon RX 5300M
NVIDIA GeForce RTX 3050 Ti Laptop GPU
...
max:
specvp13 medical-02 + SPECviewperf 13 - specvp13 medical-02
42.2 fps (9%)
...
AMD Radeon RX 5300M
AMD Radeon 680M
NVIDIA GeForce RTX 3050 Ti Laptop GPU
NVIDIA GeForce RTX 2070 Super Max-Q
NVIDIA GeForce RTX 2070 Super Mobile
...
max:
specvp13 maya-05 + SPECviewperf 13 - specvp13 maya-05
157 fps (18%)
Intel UHD Graphics 24EUs (Alder Lake-N)
...
NVIDIA GeForce RTX 3050 Ti Laptop GPU
...
max:
specvp13 energy-02 + SPECviewperf 13 - specvp13 energy-02
12.8 fps (4%)
...
AMD Radeon 680M
NVIDIA GeForce RTX 3050 Ti Laptop GPU
...
Intel UHD Graphics 24EUs (Alder Lake-N)
specvp13 creo-02 + SPECviewperf 13 - specvp13 creo-02
120 fps (18%)
Intel Iris Plus Graphics G7 (Ice Lake 64 EU)
...
NVIDIA GeForce RTX 3050 Ti Laptop GPU
NVIDIA GeForce RTX 2070 Super Max-Q
...
max:
specvp13 catia-05 + SPECviewperf 13 - specvp13 catia-05
82.8 fps (9%)
Intel UHD Graphics 24EUs (Alder Lake-N)
...
NVIDIA Quadro P620
NVIDIA GeForce RTX 3050 Ti Laptop GPU
NVIDIA Quadro P2000 Max-Q
AMD Radeon RX 5300M
AMD Radeon 680M
...
max:
specvp13 3dsmax-06 + SPECviewperf 13 - specvp13 3dsmax-06
133 fps (23%)
Intel UHD Graphics 24EUs (Alder Lake-N)
...
NVIDIA GeForce RTX 3050 Ti Laptop GPU
...
max:
SPECviewperf 2020 specvp2020 solidworks-05 4k + SPECviewperf 2020 - specvp2020 solidworks-05 4k
113 fps (33%)
Intel UHD Graphics Xe 32EUs (Tiger Lake-H)
...
NVIDIA GeForce RTX 3050 Ti Laptop GPU
max:
specvp2020 snx-04 4k + SPECviewperf 2020 - specvp2020 snx-04 4k
13.2 fps (1%)
Intel UHD Graphics Xe 32EUs (Tiger Lake-H)
NVIDIA GeForce RTX 3050 Ti Laptop GPU
...
max:
specvp2020 medical-03 4k + SPECviewperf 2020 - specvp2020 medical-03 4k
20.2 fps (19%)
Intel UHD Graphics Xe 32EUs (Tiger Lake-H)
...
NVIDIA GeForce RTX 3050 Ti Laptop GPU
...
max:
specvp2020 maya-06 4k + SPECviewperf 2020 - specvp2020 maya-06 4k
180 fps (29%)
Intel UHD Graphics Xe 32EUs (Tiger Lake-H)
...
NVIDIA GeForce RTX 3050 Ti Laptop GPU
...
max:
specvp2020 energy-03 4k + SPECviewperf 2020 - specvp2020 energy-03 4k
12.8 fps (3%)
...
Intel UHD Graphics Xe 32EUs (Tiger Lake-H)
AMD Radeon 660M
AMD Radeon RX Vega 7
AMD Radeon 680M
NVIDIA GeForce RTX 3050 Ti Laptop GPU
...
max:
specvp2020 creo-03 4k + SPECviewperf 2020 - specvp2020 creo-03 4k
69.2 fps (33%)
Intel UHD Graphics Xe 32EUs (Tiger Lake-H)
...
AMD Radeon 680M
NVIDIA GeForce RTX 3050 Ti Laptop GPU
...
max:
specvp2020 catia-06 4k + SPECviewperf 2020 - specvp2020 catia-06 4k
37.6 fps (25%)
Intel UHD Graphics Xe 32EUs (Tiger Lake-H)
...
AMD Radeon 680M
NVIDIA GeForce RTX 3050 Ti Laptop GPU
...
max:
specvp2020 3dsmax-07 4k + SPECviewperf 2020 - specvp2020 3dsmax-07 4k
58.9 fps (25%)
Intel UHD Graphics Xe 32EUs (Tiger Lake-H)
...
NVIDIA GeForce RTX 3050 Ti Laptop GPU
...
max:
Cinebench R10 Cinebench R10 Shading (32bit) + Cinebench R10 - Cinebench R10 Shading (32bit)
min: 13319 moyenne: 13439 médian: 13438.5 (10%) maximum: 13558 points
GPU TDP 40 W TDP 60 W 100% 98%
...
AMD Radeon Pro 455
NVIDIA Quadro P600
AMD Radeon 660M
NVIDIA GeForce RTX 3050 Ti Laptop GPU
AMD Radeon Pro 460
AMD Radeon 610M
AMD Radeon 680M
...
Cinebench R11.5 Cinebench R11.5 OpenGL 64 Bit + Cinebench R11.5 - Cinebench R11.5 OpenGL 64 Bit
min: 95.6 moyenne: 132.5 médian: 132.5 (46%) maximum: 169.3 fps
GPU TDP 40 W TDP 60 W 100% 56%
...
NVIDIA Quadro P620
NVIDIA GeForce RTX 3050 Ti Laptop GPU
...
max:
Cinebench R15 + Cinebench R15 - Cinebench R15 OpenGL 64 Bit
min: 95.1 moyenne: 169.1 médian: 166 (10%) maximum: 221 fps
GPU TDP 35 W TDP 40 W TDP 45 W TDP 50 W TDP 60 W TDP 65 W TDP 75 W TDP 80 W TDP 85 W TDP 90 W TDP 95 W 82% 86% 95% 76% 68% 100% 87% 45% 78% 59% 75%
...
NVIDIA Quadro P620
NVIDIA GeForce RTX 3050 Ti Laptop GPU
NVIDIA GeForce RTX 2080 Super Mobile
...
Cinebench R15 OpenGL Ref. Match 64 Bit + Cinebench R15 - Cinebench R15 OpenGL Ref. Match 64 Bit
99.6 % (100%)
GPU TDP 35 W TDP 40 W TDP 45 W TDP 50 W TDP 60 W TDP 65 W TDP 75 W TDP 80 W TDP 85 W TDP 90 W TDP 95 W 100% 100% 100% 100% 100% 100% 100% 100% 100% 100% 100%
...
NVIDIA Quadro P2000 Max-Q
NVIDIA GeForce GTX 1050 Ti Max-Q
NVIDIA GeForce RTX 3050 Ti Laptop GPU
...
GFXBench - GFXBench 5.0 Aztec Ruins High Tier Offscreen
108 fps (20%)
...
Apple M2 8-Core GPU
Apple M2 10-Core GPU
NVIDIA GeForce RTX 3050 Ti Laptop GPU
Apple M3 10-Core GPU
Apple M1 Pro 14-Core GPU
Apple M1 Pro 16-Core GPU
...
GFXBench - GFXBench 5.0 Aztec Ruins Normal Tier Offscreen
255 fps (19%)
...
Apple M2 8-Core GPU
NVIDIA GeForce RTX 3050 Ti Laptop GPU
Apple M2 10-Core GPU
Qualcomm Snapdragon X Elite Adreno GPU
Apple M3 10-Core GPU
Apple M1 Pro 14-Core GPU
Apple M1 Pro 16-Core GPU
...
GFXBench - GFXBench Car Chase Offscreen
252 fps (28%)
...
Apple M2 8-Core GPU
Apple M2 10-Core GPU
NVIDIA GeForce RTX 3050 Ti Laptop GPU
Apple M3 10-Core GPU
...
GFXBench 3.1 - GFXBench Manhattan ES 3.1 Offscreen
336 fps (7%)
...
Apple M1 7-Core GPU
Apple M1 8-Core GPU
Apple M2 8-Core GPU
Apple M2 10-Core GPU
NVIDIA GeForce RTX 3050 Ti Laptop GPU
Apple M3 10-Core GPU
...
GFXBench 3.0 - GFXBench 3.0 Manhattan Offscreen
454 fps (27%)
...
Apple M1 7-Core GPU
NVIDIA GeForce RTX 3050 Ti Laptop GPU
Apple M2 8-Core GPU
Apple M2 10-Core GPU
Apple M3 10-Core GPU
...
GFXBench (DX / GLBenchmark) 2.7 + GFXBench (DX / GLBenchmark) 2.7 - GFXBench T-Rex HD Offscreen C24Z16
1053 fps (8%)
...
Apple M2 8-Core GPU
Apple M3 10-Core GPU
Apple M2 10-Core GPU
NVIDIA GeForce RTX 3050 Ti Laptop GPU
Apple M1 Pro 14-Core GPU
...
Power Consumption - Furmark Stress Test Power Consumption - external Monitor *
min: 50.2 moyenne: 92.3 médian: 90.3 (13%) maximum: 138 Watt
GPU TDP 35 W TDP 40 W TDP 45 W TDP 50 W TDP 60 W TDP 65 W TDP 75 W TDP 80 W TDP 85 W TDP 90 W TDP 95 W 108% 110% 110% 110% 106% 105% 104% 101% 101% 101% 100%
...
NVIDIA GeForce RTX 3050 Ti Laptop GPU
NVIDIA GeForce GTX 1050 Ti Mobile
...
max:
0 10 20 30 40 50 60 70 80 90 100 110 120 130 140 Tooltip MSI Prestige 15 A12UD-093: Ø50.2 (48.9-55)
Asus Vivobook Pro 16X-M7600QE: Ø58.9 (56.9-63.2)
Dell XPS 15 9510 11800H RTX 3050 Ti OLED: Ø64.3 (60.1-73.3)
Microsoft Surface Laptop Studio i7 RTX 3050 Ti: Ø68.3 (66.4-71.5)
Dell XPS 15 9520 RTX 3050 Ti: Ø71.5 (69.9-81.3)
Asus Zenbook Pro 15 OLED UM535Q: Ø72.3 (71.1-84)
SCHENKER Vision 14 2022 RTX 3050 Ti: Ø73.9 (70.3-77.6)
MSI Summit E16 Flip A12UDT-031: Ø75.6 (71.2-82.3)
Asus ROG Flow Z13 GZ301ZE: Ø78.5 (76.2-81.7)
SCHENKER Vision 14: Ø79 (76.9-81.6)
HP Pavilion Gaming 17-cd2146ng: Ø81.1 (78.7-95.7)
Lenovo ThinkBook 15p G2 ITH 21B1000YGE: Ø82.7 (80.3-87.5)
Lenovo ThinkPad X1 Extreme G4-20Y5CTO1WW (3050 Ti): Ø90.3 (88.2-103)
Dell Inspiron 16 Plus 7620: Ø97.4 (94.1-100.3)
HP Victus 15 fa0020nr: Ø97.8 (91.3-126.8)
Asus VivoBook Pro 16: Ø102.8 (99.7-114.3)
HP Victus 16-e0145ng: Ø104.2 (100.3-131.7)
Asus Zephyrus G14 GA401QEC: Ø106.6 (104-111)
Lenovo Ideapad Gaming 3 15IHU-82K1002RGE: Ø111 (109-113)
SCHENKER XMG Focus 17: Ø113.1 (111-126)
SCHENKER XMG Focus 15: Ø113.7 (112-124)
Lenovo IdeaPad Gaming 3 15IAH7: Ø123.8 (121.8-125.6)
Dell G15 5510-43NHT: Ø124.8 (122-130)
Asus ROG Strix G17 G713QE-RB74: Ø128 (124-144)
Dell G15 5515: Ø138.1 (135-141)
Power Consumption - The Witcher 3 Power Consumption - external Monitor *
min: 49.7 moyenne: 97.3 médian: 91.7 (13%) maximum: 141.4 Watt
GPU TDP 35 W TDP 40 W TDP 45 W TDP 50 W TDP 60 W TDP 65 W TDP 75 W TDP 80 W TDP 85 W TDP 90 W TDP 95 W 112% 112% 111% 111% 109% 105% 104% 104% 100% 104% 101%
...
NVIDIA GeForce RTX 3050 Ti Laptop GPU
...
max:
0 10 20 30 40 50 60 70 80 90 100 110 120 130 140 150 Tooltip MSI Prestige 15 A12UD-093: Ø49.7 (42.5-60.8)
SCHENKER Vision 14: Ø58.1 (53.8-64.4)
Asus Vivobook Pro 16X-M7600QE: Ø64.7 (62.9-69.1)
Dell XPS 15 9510 11800H RTX 3050 Ti OLED: Ø70.8 (63.2-83.5)
Microsoft Surface Laptop Studio i7 RTX 3050 Ti: Ø80.3 (78.7-83.8)
Asus Zenbook Pro 15 OLED UM535Q: Ø80.3 (79.2-96.4)
Dell XPS 15 9520 RTX 3050 Ti: Ø80.6 (78-93.1)
Asus ROG Flow Z13 GZ301ZE: Ø81.4 (79.7-86.9)
MSI Summit E16 Flip A12UDT-031: Ø83.9 (82.3-88.7)
HP Pavilion Gaming 17-cd2146ng: Ø89.5 (85.4-111.4)
SCHENKER Vision 14 2022 RTX 3050 Ti: Ø89.6 (86.5-92)
Lenovo ThinkBook 15p G2 ITH 21B1000YGE: Ø91.4 (89-106)
Lenovo ThinkPad X1 Extreme G4-20Y5CTO1WW (3050 Ti): Ø91.9 (87.7-128)
HP Victus 16-e0145ng: Ø110 (107.9-122.3)
HP Victus 15 fa0020nr: Ø110.9 (105.8-124.1)
Dell Inspiron 16 Plus 7620: Ø111 (109.4-118.4)
Asus VivoBook Pro 16: Ø113.6 (108.2-123.9)
Lenovo Ideapad Gaming 3 15IHU-82K1002RGE: Ø116.7 (114-121)
SCHENKER XMG Focus 17: Ø121.4 (119-129)
SCHENKER XMG Focus 15: Ø120.5 (118-128)
Dell G15 5510-43NHT: Ø121.4 (114-140)
Dell G15 5515: Ø123 (120-156)
Asus ROG Strix G17 G713QE-RB74: Ø134.2 (133-144)
Lenovo IdeaPad Gaming 3 15IAH7: Ø141.4 (129.6-150.4)
Power Consumption - Witcher 3 Power Consumption *
min: 45.7 moyenne: 102.3 médian: 103 (23%) maximum: 144.6 Watt
GPU TDP 35 W TDP 40 W TDP 45 W TDP 50 W TDP 60 W TDP 65 W TDP 75 W TDP 80 W TDP 85 W TDP 90 W TDP 95 W 116% 124% 120% 120% 115% 109% 106% 105% 100% 108% 103%
...
AMD Radeon RX 560X (Laptop)
NVIDIA GeForce GTX 1050 Ti Mobile
AMD Radeon RX 5300M
NVIDIA GeForce RTX 3050 Ti Laptop GPU
Apple M1 Max 32-Core GPU
...
0 10 20 30 40 50 60 70 80 90 100 110 120 130 140 150 Tooltip MSI Prestige 15 A12UD-093: Ø45.7 (42.7-61.6)
Asus Vivobook Pro 16X-M7600QE: Ø65.6 (63.4-68.7)
Dell XPS 15 9520 RTX 3050 Ti: Ø74.6 (64.7-83.8)
Dell XPS 15 9510 11800H RTX 3050 Ti OLED: Ø76.2 (68.3-82.9)
Asus ROG Flow Z13 GZ301ZE: Ø77.3 (75.3-87.5)
Asus Zenbook Pro 15 OLED UM535Q: Ø80.1 (79-82.6)
SCHENKER Vision 14: Ø83 (80.7-86.6)
Microsoft Surface Laptop Studio i7 RTX 3050 Ti: Ø83 (81.5-95.3)
MSI Summit E16 Flip A12UDT-031: Ø86.1 (84.7-89.3)
SCHENKER Vision 14 2022 RTX 3050 Ti: Ø92.7 (89.5-95.7)
HP Pavilion Gaming 17-cd2146ng: Ø98.2 (93-112.9)
Lenovo ThinkBook 15p G2 ITH 21B1000YGE: Ø100.4 (98.1-109)
Lenovo ThinkPad X1 Extreme G4-20Y5CTO1WW (3050 Ti): Ø105.9 (103-127)
Dell Inspiron 16 Plus 7620: Ø113.1 (110.7-124.3)
HP Victus 15 fa0020nr: Ø113.9 (106.4-129.9)
Asus VivoBook Pro 16: Ø117.6 (110.4-128.4)
Lenovo Ideapad Gaming 3 15IHU-82K1002RGE: Ø119.1 (116-124)
Dell G15 5515: Ø123.3 (118-139)
SCHENKER XMG Focus 15: Ø128 (125-133)
SCHENKER XMG Focus 17: Ø128.9 (126-149)
Dell G15 5510-43NHT: Ø129.1 (123-144)
HP Victus 16-e0145ng: Ø134.5 (132.1-140.3)
Asus ROG Strix G17 G713QE-RB74: Ø136.4 (133-143)
Lenovo IdeaPad Gaming 3 15IAH7: Ø144.6 (141.2-157.7)
Power Consumption - Witcher 3 ultra Power Efficiency
min: 0.3958 moyenne: 0.5 médian: 0.5 (48%) maximum: 0.732 fps per Watt
GPU TDP 35 W TDP 40 W TDP 45 W TDP 50 W TDP 60 W TDP 65 W TDP 75 W TDP 80 W TDP 85 W TDP 90 W TDP 95 W 83% 86% 85% 100% 88% 85% 72% 71% 68% 72% 72%
...
NVIDIA GeForce RTX 2070 Super Max-Q
NVIDIA GeForce RTX 3050 Ti Laptop GPU
...
Apple M2 10-Core GPU
Power Consumption - Witcher 3 ultra Power Efficiency - external Monitor
min: 0.4026 moyenne: 0.5 médian: 0.5 (41%) maximum: 0.742 fps per Watt
GPU TDP 35 W TDP 40 W TDP 45 W TDP 50 W TDP 60 W TDP 65 W TDP 75 W TDP 80 W TDP 85 W TDP 90 W TDP 95 W 100% 79% 80% 96% 90% 81% 75% 71% 65% 68% 69%
...
NVIDIA GeForce RTX 2070 Super Max-Q
NVIDIA GeForce RTX 3050 Ti Laptop GPU
...
Emissions Witcher 3 Fan Noise + Emissions - Witcher 3 Fan Noise
min: 0 moyenne: 43.7 médian: 44.6 (71%) maximum: 56 dB(A)
GPU TDP 35 W TDP 40 W TDP 45 W TDP 50 W TDP 60 W TDP 65 W TDP 75 W TDP 85 W TDP 90 W TDP 95 W 97% 82% 81% 90% 88% 98% 100% 91% 87% 99%
...
Intel UHD Graphics Xe G4 48EUs
NVIDIA GeForce RTX 3050 Ti Laptop GPU
NVIDIA GeForce GTX 1050 Ti Mobile
...
Clock Speed - GPU Clock Witcher 3 ultra
min: 1274 moyenne: 1618 médian: 1673 (66%) maximum: 1815 MHz
GPU TDP 35 W TDP 50 W TDP 60 W TDP 75 W TDP 90 W 72% 79% 92% 100% 94%
...
NVIDIA GeForce RTX 2070 Super Mobile
AMD Radeon RX Vega 7
NVIDIA Quadro P600
NVIDIA GeForce RTX 3050 Ti Laptop GPU
NVIDIA GeForce GTX 1070 Mobile
NVIDIA GeForce GTX 1050 Ti Mobile
...
Clock Speed - GPU Clock Speed Furmark
min: 1092 moyenne: 1281 médian: 1185 (47%) maximum: 1567 MHz
GPU TDP 35 W TDP 50 W TDP 90 W 70% 76% 100%
...
NVIDIA GeForce GTX 1070 Mobile
NVIDIA Quadro P500
NVIDIA GeForce RTX 3050 Ti Laptop GPU
NVIDIA Quadro P600
...
max:
AMD Radeon RX 6700 XT
- Amplitude des valeurs obtenues dans le benchmark avec cette carte graphique
- Valeur moyenne obtenue dans le benchmark avec cette carte graphique
* Plus les chiffres sont petits, plus les performances sont élevées
Benchmarks de jeux Les benchmarks qui suivent sont tirés de tests effectués dans nos critiques des ordinateurs portables. Les performances dépendent du type et de la quantité de mémoire graphique embaquée, mais aussi de sa fréquence, du processeur, des paramètres système, des pilotes et du système d'exploitation. Les résultats ne sont donc pas représentatifs de tous les appareils intégrant cette carte graphique. Pour plus de détails sur les résultats, cliquez sur le nombre d'images par seconde.
...
NVIDIA GeForce RTX 3050 Ti Laptop GPU
...
max:
...
NVIDIA GeForce RTX 3050 Ti Laptop GPU
...
max:
...
AMD Radeon 680M
NVIDIA GeForce RTX 3050 Ti Laptop GPU
...
max:
...
AMD Radeon 680M
NVIDIA GeForce RTX 3050 Ti Laptop GPU
...
max:
» Jouable avec tous les ordinateurs portables testés avec les détails paramétrés sur Ultra.
Additional Benchmarks
Low Preset 1280x720
179 [X] Asus ROG Flow Z13 GZ301ZE Intel Core i9-12900H 1.8GHz
GeForce RTX 3050 Ti Laptop GPU
min:
31.7 fps, P0.1:
45.1 fps, P1:
74 fps, max:
313 fps
0 100 200 Tooltip VivoBook Pro 16: Ø50.3 (28.02-275)
...
AMD Radeon RX 560X (Laptop)
NVIDIA GeForce RTX 3050 Ti Laptop GPU
AMD Radeon 680M
...
max:
0 Tooltip VivoBook Pro 16: Ø34.7 (27.02-88.9)
...
AMD Radeon 680M
NVIDIA GeForce RTX 3050 Ti Laptop GPU
...
max:
0 100 200 300 Tooltip VivoBook Pro 16: Ø43 (25.11-392)
AMD Radeon RX 560X (Laptop)
...
AMD Radeon 680M
NVIDIA GeForce RTX 3050 Ti Laptop GPU
...
max:
0 100 200 300 Tooltip VivoBook Pro 16: Ø41.7 (19.285-337)
AMD Radeon 680M
NVIDIA GeForce RTX 3050 Ti Laptop GPU
...
max:
0 Tooltip VivoBook Pro 16: Ø18.8 (13.359-52.4)
NVIDIA GeForce RTX 3050 Ti Laptop GPU
...
max:
» Jouable avec tous les ordinateurs portables testés avec les détails paramétrés sur Bas.
Additional Benchmarks
Low Preset 1280x720
56.3 [X] Asus VivoBook Pro 16 Intel Core i7-12700H 1.7GHz
GeForce RTX 3050 Ti Laptop GPU
min:
12.7 fps, P0.1:
24.3 fps, P1:
33.3 fps, max:
94.2 fps
Epic Preset + Ray Tracing 1920x1080
15 [X] Asus VivoBook Pro 16 Intel Core i7-12700H 1.7GHz
GeForce RTX 3050 Ti Laptop GPU
min:
8.65 fps, P0.1:
9.02 fps, P1:
10.3 fps, max:
26 fps
0 100 Tooltip VivoBook Pro 16: Ø97.2 (80.151-120.47)
...
AMD Radeon 660M
AMD Radeon RX 560X (Laptop)
AMD Radeon 680M
NVIDIA GeForce RTX 3050 Ti Laptop GPU
...
max:
0 100 200 Tooltip VivoBook Pro 16: Ø90 (65.062-264.1)
AMD Radeon RX Vega 8 (Ryzen 2000/3000)
...
AMD Radeon 660M
AMD Radeon RX 560X (Laptop)
AMD Radeon 680M
NVIDIA GeForce RTX 3050 Ti Laptop GPU
...
max:
0 Tooltip VivoBook Pro 16: Ø65.6 (47.163-86.691)
...
AMD Radeon RX 560X (Laptop)
AMD Radeon 680M
NVIDIA GeForce RTX 3050 Ti Laptop GPU
...
max:
0 100 200 300 400 500 600 Tooltip VivoBook Pro 16: Ø97.2 (49.652-697)
...
AMD Radeon 680M
NVIDIA GeForce RTX 3050 Ti Laptop GPU
...
max:
0 Tooltip VivoBook Pro 16: Ø47.2 (39.113-58.16)
NVIDIA GeForce RTX 3050 Ti Laptop GPU
...
max:
» Jouable avec tous les ordinateurs portables testés avec les détails paramétrés sur Ultra.
Additional Benchmarks
Low Preset Low TAA 1280x720
115 [X] Asus VivoBook Pro 16 Intel Core i7-12700H 1.7GHz
GeForce RTX 3050 Ti Laptop GPU
min:
8.75 fps, P0.1:
13.7 fps, P1:
41.7 fps, max:
185.1 fps
0 100 200 300 Tooltip VivoBook Pro 16: Ø60.3 (38.269-388)
...
AMD Radeon RX 560X (Laptop)
AMD Radeon 680M
NVIDIA GeForce RTX 3050 Ti Laptop GPU
...
max:
0 Tooltip VivoBook Pro 16: Ø35.5 (28.123-55.7)
...
AMD Radeon RX 560X (Laptop)
AMD Radeon 680M
NVIDIA GeForce RTX 3050 Ti Laptop GPU
...
max:
0 Tooltip VivoBook Pro 16: Ø28.6 (20.158-59)
AMD Radeon RX 560X (Laptop)
AMD Radeon 680M
NVIDIA GeForce RTX 3050 Ti Laptop GPU
...
max:
» Jouable avec tous les ordinateurs portables testés avec les détails paramétrés sur Bas.
Additional Benchmarks
Low Preset 1280x720
58.2 [X] Asus VivoBook Pro 16 Intel Core i7-12700H 1.7GHz
GeForce RTX 3050 Ti Laptop GPU
min:
6.3 fps, P0.1:
24.3 fps, P1:
36.7 fps, max:
96 fps
0 100 Tooltip VivoBook Pro 16: Ø80.6 (39.04-142.7)
...
NVIDIA GeForce RTX 3050 Ti Laptop GPU
...
max:
0 100 Tooltip VivoBook Pro 16: Ø56.9 (42.073-178.3)
...
AMD Radeon 680M
NVIDIA GeForce RTX 3050 Ti Laptop GPU
...
max:
0 Tooltip VivoBook Pro 16: Ø42.9 (35.411-72)
...
AMD Radeon RX 560X (Laptop)
AMD Radeon 680M
NVIDIA GeForce RTX 3050 Ti Laptop GPU
...
max:
0 100 200 300 400 500 600 700 800 900 1000 1100 1200 1300 1400 1500 1600 1700 1800 1900 2000 2100 2200 2300 2400 2500 2600 2700 2800 2900 3000 3100 3200 3300 3400 3500 3600 3700 3800 3900 4000 4100 4200 4300 4400 4500 4600 4700 4800 4900 5000 5100 5200 5300 5400 5500 5600 5700 5800 5900 6000 6100 6200 6300 6400 6500 6600 6700 6800 6900 7000 7100 7200 7300 7400 7500 7600 7700 7800 7900 8000 8100 8200 8300 8400 8500 8600 8700 8800 8900 9000 9100 9200 9300 9400 9500 9600 9700 9800 9900 Tooltip VivoBook Pro 16: Ø642 (6.926-26488)
NVIDIA GeForce RTX 3050 Ti Laptop GPU
AMD Radeon RX 560X (Laptop)
AMD Radeon 680M
...
max:
0 Tooltip VivoBook Pro 16: Ø11.1 (6.308-29.5)
NVIDIA GeForce RTX 3050 Ti Laptop GPU
...
max:
» Jouable avec tous les ordinateurs portables testés avec les détails paramétrés sur Élevé.
Additional Benchmarks
Prioritize Performance Preset 1280x720
86.2 [X] Asus VivoBook Pro 16 Intel Core i7-12700H 1.7GHz
GeForce RTX 3050 Ti Laptop GPU
min:
13.9 fps, P0.1:
38.5 fps, P1:
52.9 fps, max:
136.1 fps
...
NVIDIA GeForce RTX 3050 Ti Laptop GPU
...
max:
AMD Radeon RX Vega 8 (Ryzen 2000/3000)
...
NVIDIA GeForce RTX 3050 Ti Laptop GPU
...
max:
...
NVIDIA GeForce RTX 3050 Ti Laptop GPU
...
max:
...
NVIDIA GeForce RTX 3050 Ti Laptop GPU
...
max:
NVIDIA GeForce RTX 3050 Ti Laptop GPU
...
max:
» Jouable avec tous les ordinateurs portables testés avec les détails paramétrés sur Ultra.
Additional Benchmarks
Minimum Settings 1280x720
0 100 Tooltip VivoBook Pro 16: Ø61.9 (21.387-172.5)
...
AMD Radeon 680M
AMD Radeon RX 560X (Laptop)
NVIDIA GeForce RTX 3050 Ti Laptop GPU
...
max:
0 Tooltip VivoBook Pro 16: Ø43.1 (17.227-89.4)
...
AMD Radeon 680M
NVIDIA GeForce RTX 3050 Ti Laptop GPU
...
max:
0 100 Tooltip VivoBook Pro 16: Ø40.5 (19.726-185.9)
...
AMD Radeon RX 560X (Laptop)
AMD Radeon 680M
NVIDIA GeForce RTX 3050 Ti Laptop GPU
...
max:
0 100 Tooltip VivoBook Pro 16: Ø36.5 (18.235-103.4)
...
AMD Radeon RX 560X (Laptop)
AMD Radeon 680M
NVIDIA GeForce RTX 3050 Ti Laptop GPU
...
max:
0 Tooltip VivoBook Pro 16: Ø28.1 (17.388-45)
NVIDIA GeForce RTX 3050 Ti Laptop GPU
...
max:
» Jouable avec tous les ordinateurs portables testés avec les détails paramétrés sur Élevé.
Additional Benchmarks
Ultra Low Preset 1280x720
60.1 [X] Asus VivoBook Pro 16 Intel Core i7-12700H 1.7GHz
GeForce RTX 3050 Ti Laptop GPU
min:
4.95 fps, P0.1:
18.8 fps, P1:
22.5 fps, max:
114 fps
0 100 Tooltip VivoBook Pro 16: Ø96.1 (85.01-107.22)
Intel UHD Graphics Xe 16EUs (Tiger Lake-H)
...
NVIDIA GeForce RTX 3050 Ti Laptop GPU
...
max:
0 100 200 300 400 500 600 700 800 900 1000 Tooltip VivoBook Pro 16: Ø92.7 (64.08-1027)
...
NVIDIA GeForce RTX 3050 Ti Laptop GPU
...
max:
0 100 Tooltip VivoBook Pro 16: Ø46.3 (38.102-133.1)
...
NVIDIA GeForce RTX 3050 Ti Laptop GPU
...
max:
0 Tooltip VivoBook Pro 16: Ø35.5 (28.142-63.1)
...
NVIDIA GeForce RTX 3050 Ti Laptop GPU
...
max:
0 100 Tooltip VivoBook Pro 16: Ø29.6 (22.111-145.4)
NVIDIA GeForce RTX 3050 Ti Laptop GPU
...
max:
» Jouable avec tous les ordinateurs portables testés avec les détails paramétrés sur Élevé.
Additional Benchmarks
Low Preset 1280x720
134.4 [X] Asus VivoBook Pro 16 Intel Core i7-12700H 1.7GHz
GeForce RTX 3050 Ti Laptop GPU
min:
31.2 fps, P0.1:
91.7 fps, P1:
103.1 fps, max:
183.1 fps
...
NVIDIA GeForce RTX 3050 Ti Laptop GPU
...
max:
...
NVIDIA GeForce RTX 3050 Ti Laptop GPU
...
max:
...
NVIDIA GeForce RTX 3050 Ti Laptop GPU
...
max:
...
NVIDIA GeForce RTX 3050 Ti Laptop GPU
...
max:
NVIDIA GeForce RTX 3050 Ti Laptop GPU
...
max:
» Jouable avec tous les ordinateurs portables testés avec les détails paramétrés sur Élevé.
Additional Benchmarks
Low Preset 1280x720
Epic Preset + Epic Ray-Tracing 1920x1080
0 Tooltip VivoBook Pro 16: Ø66 (52.329-80.9)
Intel UHD Graphics G1 (Ice Lake 32 EU)
...
NVIDIA GeForce RTX 3050 Ti Laptop GPU
...
max:
0 Tooltip VivoBook Pro 16: Ø52.7 (43.209-71.4)
...
NVIDIA GeForce RTX 3050 Ti Laptop GPU
...
max:
0 Tooltip VivoBook Pro 16: Ø42.7 (35.64-56.4)
...
NVIDIA GeForce RTX 3050 Ti Laptop GPU
...
max:
0 Tooltip VivoBook Pro 16: Ø36.2 (25.526-98.1)
...
NVIDIA GeForce RTX 3050 Ti Laptop GPU
...
max:
0 Tooltip VivoBook Pro 16: Ø28.4 (21.718-53.3)
NVIDIA GeForce RTX 3050 Ti Laptop GPU
...
max:
» Jouable avec tous les ordinateurs portables testés avec les détails paramétrés sur Élevé.
Additional Benchmarks
Low Preset Low TAA 1280x720
81.2 [X] Asus VivoBook Pro 16 Intel Core i7-12700H 1.7GHz
GeForce RTX 3050 Ti Laptop GPU
min:
27.4 fps, P0.1:
32.8 fps, P1:
41.7 fps, max:
117.7 fps
Ultra Preset + Full Ray Tracing High TAA 1920x1080
21.6 [X] Asus VivoBook Pro 16 Intel Core i7-12700H 1.7GHz
GeForce RTX 3050 Ti Laptop GPU
min:
9.02 fps, P0.1:
9.03 fps, P1:
13.2 fps, max:
35.6 fps
0 Tooltip VivoBook Pro 16: Ø42 (31.214-99.5)
Intel UHD Graphics Xe 16EUs (Tiger Lake-H)
...
AMD Radeon RX 560X (Laptop)
NVIDIA GeForce RTX 3050 Ti Laptop GPU
...
max:
0 Tooltip VivoBook Pro 16: Ø36.4 (33.135-45.49)
...
NVIDIA GeForce RTX 3050 Ti Laptop GPU
...
max:
0 Tooltip VivoBook Pro 16: Ø30.6 (24.64-46.6)
AMD Radeon RX 560X (Laptop)
...
NVIDIA GeForce RTX 3050 Ti Laptop GPU
...
max:
0 Tooltip VivoBook Pro 16: Ø29.9 (14.91-60.7)
...
NVIDIA GeForce RTX 3050 Ti Laptop GPU
...
max:
0 Tooltip VivoBook Pro 16: Ø14.8 (8.04-37.6)
NVIDIA GeForce RTX 3050 Ti Laptop GPU
...
max:
» Jouable avec tous les ordinateurs portables testés avec les détails paramétrés sur Moyen.
Additional Benchmarks
Low Preset TAA 1280x720
64.5 [X] Asus VivoBook Pro 16 Intel Core i7-12700H 1.7GHz
GeForce RTX 3050 Ti Laptop GPU
min:
21.3 fps, P0.1:
29.1 fps, P1:
38.8 fps, max:
240 fps
0 100 Tooltip VivoBook Pro 16: Ø90.4 (79.19-109.2)
: Ø129.5 (112.981-152.5)
...
NVIDIA GeForce RTX 3050 Ti Laptop GPU
...
max:
0 100 200 300 Tooltip VivoBook Pro 16: Ø85.2 (65.07-323)
: Ø95.2 (81.057-130.5)
...
NVIDIA GeForce RTX 3050 Ti Laptop GPU
...
max:
0 100 200 300 400 500 600 700 800 900 1000 1100 1200 1300 1400 1500 1600 1700 1800 1900 2000 2100 2200 2300 2400 2500 2600 2700 Tooltip VivoBook Pro 16: Ø39.5 (33.005-70.7)
: Ø129.5 (63.151-2795)
...
AMD Radeon RX 560X (Laptop)
AMD Radeon 680M
NVIDIA GeForce RTX 3050 Ti Laptop GPU
...
max:
0 100 Tooltip VivoBook Pro 16: Ø39.8 (29.602-174.1)
: Ø64.3 (47.146-127.5)
...
AMD Radeon 680M
NVIDIA GeForce RTX 3050 Ti Laptop GPU
...
max:
0 Tooltip VivoBook Pro 16: Ø25.5 (17.204-92.1)
NVIDIA GeForce RTX 3050 Ti Laptop GPU
...
max:
» Jouable avec la plupart des ordinateurs portables testés avec les détails paramétrés sur Ultra.
Additional Benchmarks
Low Preset / Off 1280x720
175.7 [X] XMG Focus 17 @75 W TGP Intel Core i7-11800H 2.3GHz
GeForce RTX 3050 Ti Laptop GPU
min:
8.75 fps, P0.1:
27.8 fps, P1:
122 fps, max:
268 fps
127.5 [X] Asus VivoBook Pro 16 Intel Core i7-12700H 1.7GHz
GeForce RTX 3050 Ti Laptop GPU
min:
8.42 fps, P0.1:
60.4 fps, P1:
86.4 fps, max:
217 fps
RT Ultra Preset / On FXAA 1920x1080
14.5 [X] XMG Focus 17 @75 W TGP Intel Core i7-11800H 2.3GHz
GeForce RTX 3050 Ti Laptop GPU
min:
3.24 fps, P0.1:
4.64 fps, P1:
5.26 fps, max:
87.1 fps
12.2 [X] Asus VivoBook Pro 16 Intel Core i7-12700H 1.7GHz
GeForce RTX 3050 Ti Laptop GPU
min:
4.42 fps, P0.1:
6.14 fps, P1:
9.7 fps, max:
48.8 fps
0 100 200 300 400 500 600 Tooltip VivoBook Pro 16: Ø126.9 (83.379-602)
Intel UHD Graphics Xe 16EUs (Tiger Lake-H)
...
AMD Radeon 680M
NVIDIA GeForce RTX 3050 Ti Laptop GPU
...
max:
0 Tooltip VivoBook Pro 16: Ø79.7 (50.221-98.5)
...
AMD Radeon 680M
NVIDIA GeForce RTX 3050 Ti Laptop GPU
...
max:
0 100 Tooltip VivoBook Pro 16: Ø64.6 (45.397-107.4)
...
AMD Radeon 680M
NVIDIA GeForce RTX 3050 Ti Laptop GPU
...
max:
0 100 200 300 400 500 600 700 800 900 1000 1100 1200 Tooltip VivoBook Pro 16: Ø99.1 (32.677-1230)
...
AMD Radeon 680M
NVIDIA GeForce RTX 3050 Ti Laptop GPU
...
max:
0 Tooltip VivoBook Pro 16: Ø35.4 (28.041-76.9)
NVIDIA GeForce RTX 3050 Ti Laptop GPU
...
max:
» Jouable avec tous les ordinateurs portables testés avec les détails paramétrés sur Ultra.
Additional Benchmarks
Low Preset 1280x720
147 [X] Asus VivoBook Pro 16 Intel Core i7-12700H 1.7GHz
GeForce RTX 3050 Ti Laptop GPU
min:
48.1 fps, P0.1:
56.2 fps, P1:
79.2 fps, max:
261 fps
...
AMD Radeon RX 560X (Laptop)
NVIDIA GeForce RTX 3050 Ti Laptop GPU
...
max:
...
AMD Radeon 680M
AMD Radeon RX 560X (Laptop)
NVIDIA GeForce RTX 3050 Ti Laptop GPU
...
max:
...
AMD Radeon 680M
AMD Radeon 660M
AMD Radeon RX 560X (Laptop)
NVIDIA GeForce RTX 3050 Ti Laptop GPU
...
max:
...
AMD Radeon 660M
AMD Radeon 680M
AMD Radeon RX 560X (Laptop)
NVIDIA GeForce RTX 3050 Ti Laptop GPU
...
max:
NVIDIA GeForce RTX 3050 Ti Laptop GPU
...
max:
» Jouable avec tous les ordinateurs portables testés avec les détails paramétrés sur Élevé.
Additional Benchmarks
Low Preset (without FSR Upscaling) 1280x720
125 [X] XMG Focus 17 @75 W TGP Intel Core i7-11800H 2.3GHz
GeForce RTX 3050 Ti Laptop GPU
Ultra Preset (without FSR Upscaling) + Full Ray-Tracing 1920x1080
0 100 Tooltip VivoBook Pro 16: Ø79.6 (68.19-157)
: Ø99.8 (82.036-153)
...
AMD Radeon 680M
NVIDIA GeForce RTX 3050 Ti Laptop GPU
...
max:
0 100 Tooltip VivoBook Pro 16: Ø65.2 (54.087-127.9)
: Ø87.4 (77.644-113)
...
AMD Radeon 680M
NVIDIA GeForce RTX 3050 Ti Laptop GPU
...
max:
0 100 200 Tooltip VivoBook Pro 16: Ø37.5 (29.068-60.7)
: Ø69.5 (53.028-219.2)
...
AMD Radeon 680M
NVIDIA GeForce RTX 3050 Ti Laptop GPU
...
max:
0 Tooltip VivoBook Pro 16: Ø34.1 (2.786-94)
: Ø50.4 (37.45-72)
...
AMD Radeon 680M
NVIDIA GeForce RTX 3050 Ti Laptop GPU
...
max:
0 100 200 300 400 500 600 700 800 900 1000 1100 1200 1300 1400 1500 1600 1700 1800 1900 2000 2100 2200 2300 2400 2500 Tooltip VivoBook Pro 16: Ø70.3 (-0.12453-2570)
NVIDIA GeForce RTX 3050 Ti Laptop GPU
...
max:
» Jouable avec la plupart des ordinateurs portables testés avec les détails paramétrés sur Ultra.
Additional Benchmarks
Low Preset 1280x720
114.9 [X] XMG Focus 17 @75 W TGP Intel Core i7-11800H 2.3GHz
GeForce RTX 3050 Ti Laptop GPU
min:
21.1 fps, P0.1:
64.5 fps, P1:
86.8 fps, max:
158.4 fps
85.3 [X] Asus VivoBook Pro 16 Intel Core i7-12700H 1.7GHz
GeForce RTX 3050 Ti Laptop GPU
min:
17.5 fps, P0.1:
54.3 fps, P1:
63.7 fps, max:
118.4 fps
0 100 Tooltip VivoBook Pro 16: Ø75 (60.045-189.5)
: Ø72.3 (51.029-89.09)
Intel UHD Graphics Xe 16EUs (Tiger Lake-H)
...
AMD Radeon 680M
NVIDIA GeForce RTX 3050 Ti Laptop GPU
...
max:
0 100 Tooltip VivoBook Pro 16: Ø56.3 (44.198-103)
: Ø60.1 (45.734-94.6)
...
AMD Radeon 680M
NVIDIA GeForce RTX 3050 Ti Laptop GPU
...
max:
0 100 Tooltip VivoBook Pro 16: Ø46.9 (40.869-67.02)
: Ø54.6 (37.11-140.6)
...
AMD Radeon 680M
NVIDIA GeForce RTX 3050 Ti Laptop GPU
...
max:
0 Tooltip : Ø38.8 (29.12-96.6)
VivoBook Pro 16: Ø39 (31.121-62.1)
...
AMD Radeon RX 560X (Laptop)
AMD Radeon 680M
NVIDIA GeForce RTX 3050 Ti Laptop GPU
...
max:
0 Tooltip VivoBook Pro 16: Ø31.2 (24.216-63.3)
NVIDIA GeForce RTX 3050 Ti Laptop GPU
...
max:
» Jouable avec la plupart des ordinateurs portables testés avec les détails paramétrés sur Ultra.
Additional Benchmarks
Very Low Preset 1280x720
110.4 [X] XMG Focus 17 @75 W TGP Intel Core i7-11800H 2.3GHz
GeForce RTX 3050 Ti Laptop GPU
min:
47.1 fps, P0.1:
60.5 fps, P1:
79.2 fps, max:
134.4 fps
84.1 [X] Asus VivoBook Pro 16 Intel Core i7-12700H 1.7GHz
GeForce RTX 3050 Ti Laptop GPU
min:
38.8 fps, P0.1:
48.8 fps, P1:
56.4 fps, max:
139.7 fps
Very High Preset + Ray-Tracing TAA 1920x0180
20.4 [X] XMG Focus 17 @75 W TGP Intel Core i7-11800H 2.3GHz
GeForce RTX 3050 Ti Laptop GPU
min:
5.1 fps, P0.1:
5.47 fps, P1:
18 fps, max:
37.2 fps
...
AMD Radeon RX 560X (Laptop)
AMD Radeon 680M
NVIDIA GeForce RTX 3050 Ti Laptop GPU
...
max:
...
AMD Radeon RX 560X (Laptop)
AMD Radeon 680M
NVIDIA GeForce RTX 3050 Ti Laptop GPU
...
max:
AMD Radeon RX Vega 8 (Ryzen 2000/3000)
...
AMD Radeon RX 560X (Laptop)
AMD Radeon 680M
NVIDIA GeForce RTX 3050 Ti Laptop GPU
...
max:
...
AMD Radeon 660M
AMD Radeon RX 560X (Laptop)
AMD Radeon 680M
NVIDIA GeForce RTX 3050 Ti Laptop GPU
...
max:
» Jouable avec tous les ordinateurs portables testés avec les détails paramétrés sur Ultra.
Additional Benchmarks
Basic Quality Preset T2X SMAA 1280x720
144 [X] XMG Focus 17 @75 W TGP Intel Core i7-11800H 2.3GHz
GeForce RTX 3050 Ti Laptop GPU
min:
100 fps
0 100 200 Tooltip VivoBook Pro 16: Ø50 (44.64-55.59)
: Ø63.7 (53.268-210.3)
...
AMD Radeon RX 560X (Laptop)
AMD Radeon 680M
NVIDIA GeForce RTX 3050 Ti Laptop GPU
...
max:
0 Tooltip VivoBook Pro 16: Ø33.4 (19.094-45.5)
: Ø48.7 (42.05-78.7)
AMD Radeon RX Vega 8 (Ryzen 2000/3000)
...
AMD Radeon RX 560X (Laptop)
AMD Radeon 680M
NVIDIA GeForce RTX 3050 Ti Laptop GPU
...
max:
0 Tooltip VivoBook Pro 16: Ø23.2 (20.046-41.8)
: Ø36.4 (31.548-49.6)
...
AMD Radeon 660M
AMD Radeon RX Vega 7
AMD Radeon RX 560X (Laptop)
AMD Radeon 680M
NVIDIA GeForce RTX 3050 Ti Laptop GPU
...
max:
0 Tooltip VivoBook Pro 16: Ø23.8 (17.34-50.5)
: Ø35 (31.19-46.2)
...
AMD Radeon RX Vega 7
AMD Radeon RX 560X (Laptop)
AMD Radeon 680M
NVIDIA GeForce RTX 3050 Ti Laptop GPU
...
max:
0 Tooltip VivoBook Pro 16: Ø19.5 (12.173-48.3)
NVIDIA GeForce RTX 3050 Ti Laptop GPU
...
max:
» Jouable avec la plupart des ordinateurs portables testés avec les détails paramétrés sur Moyen.
Additional Benchmarks
Low Preset 1280x720
76 [X] XMG Focus 17 @75 W TGP Intel Core i7-11800H 2.3GHz
GeForce RTX 3050 Ti Laptop GPU
min:
18 fps, P0.1:
56.2 fps, P1:
63.7 fps, max:
97.4 fps
55.6 [X] Asus VivoBook Pro 16 Intel Core i7-12700H 1.7GHz
GeForce RTX 3050 Ti Laptop GPU
min:
42.2 fps, P0.1:
43.1 fps, P1:
47 fps, max:
65.7 fps
Intel UHD Graphics Xe 16EUs (Tiger Lake-H)
...
AMD Radeon RX 560X (Laptop)
NVIDIA GeForce RTX 3050 Ti Laptop GPU
...
max:
...
AMD Radeon RX 560X (Laptop)
NVIDIA GeForce RTX 3050 Ti Laptop GPU
...
max:
...
AMD Radeon RX 560X (Laptop)
NVIDIA GeForce RTX 3050 Ti Laptop GPU
...
max:
...
AMD Radeon RX 560X (Laptop)
AMD Radeon 680M
NVIDIA GeForce RTX 3050 Ti Laptop GPU
...
max:
» Jouable avec tous les ordinateurs portables testés avec les détails paramétrés sur Moyen.
Additional Benchmarks
Low Preset 1280x720
68.8 [X] XMG Focus 17 @75 W TGP Intel Core i7-11800H 2.3GHz
GeForce RTX 3050 Ti Laptop GPU
min:
34 fps, P0.1:
45.4 fps, P1:
52 fps, max:
122.6 fps
...
AMD Radeon 680M
NVIDIA GeForce RTX 3050 Ti Laptop GPU
max:
...
AMD Radeon 680M
NVIDIA GeForce RTX 3050 Ti Laptop GPU
max:
AMD Radeon 680M
NVIDIA GeForce RTX 3050 Ti Laptop GPU
max:
...
AMD Radeon 680M
AMD Radeon RX 560X (Laptop)
NVIDIA GeForce RTX 3050 Ti Laptop GPU
max:
0 100 Tooltip VivoBook Pro 16: Ø81.5 (74.048-138.6)
NVIDIA GeForce RTX 3050 Ti Laptop GPU
...
max:
» Jouable avec tous les ordinateurs portables testés avec les détails paramétrés sur Ultra.
Additional Benchmarks
Low Rendering Quality 1280x720
143.5 [X] XMG Focus 17 @75 W TGP Intel Core i7-11800H 2.3GHz
GeForce RTX 3050 Ti Laptop GPU
min:
3.18 fps, P0.1:
40.3 fps, P1:
92.4 fps, max:
220 fps
0 100 Tooltip : Ø70.4 (59.04-114.7)
IdeaPad Gaming 3 15IAH7: Ø72.7 (56.22-97.7)
Intel UHD Graphics Xe G4 48EUs
...
NVIDIA GeForce GTX 1050 Ti Mobile
NVIDIA GeForce RTX 3050 Ti Laptop GPU
...
max:
0 100 200 Tooltip : Ø62.3 (47.31-238.2)
IdeaPad Gaming 3 15IAH7: Ø63.4 (45.003-142.4)
...
NVIDIA GeForce GTX 1050 Ti Mobile
NVIDIA GeForce RTX 3050 Ti Laptop GPU
...
max:
0 Tooltip : Ø45.2 (37.824-79.3)
IdeaPad Gaming 3 15IAH7: Ø48.1 (40.017-74.1)
...
NVIDIA GeForce RTX 3050 Ti Laptop GPU
...
max:
NVIDIA GeForce RTX 3050 Ti Laptop GPU
...
max:
NVIDIA GeForce RTX 3050 Ti Laptop GPU
...
max:
» Jouable avec tous les ordinateurs portables testés avec les détails paramétrés sur Ultra.
Intel UHD Graphics Xe 16EUs (Tiger Lake-H)
...
AMD Radeon 680M
NVIDIA GeForce GTX 1050 Ti Mobile
NVIDIA GeForce RTX 3050 Ti Laptop GPU
...
max:
Intel UHD Graphics Xe 16EUs (Tiger Lake-H)
...
NVIDIA GeForce GTX 1050 Ti Mobile
NVIDIA GeForce RTX 3050 Ti Laptop GPU
...
max:
Intel UHD Graphics Xe 16EUs (Tiger Lake-H)
...
NVIDIA GeForce RTX 3050 Ti Laptop GPU
...
max:
...
AMD Radeon RX Vega 7
NVIDIA GeForce RTX 3050 Ti Laptop GPU
NVIDIA GeForce GTX 1050 Ti Mobile
...
max:
NVIDIA GeForce RTX 3050 Ti Laptop GPU
...
max:
NVIDIA GeForce RTX 3050 Ti Laptop GPU
...
max:
» Jouable avec tous les ordinateurs portables testés avec les détails paramétrés sur Élevé.
Additional Benchmarks
Ultra Low Preset 16xAF TAA 1280x720
245 [X] XMG Focus 17 @75 W TGP Intel Core i7-11800H 2.3GHz
GeForce RTX 3050 Ti Laptop GPU
min:
189 fps
...
NVIDIA GeForce RTX 3050 Ti Laptop GPU
max:
0 100 Tooltip IdeaPad Gaming 3 15IAH7: Ø114.2 (89.881-163.5)
Victus 16-e0145ng: Ø135.8 (115.458-199.2)
: Ø140.7 (120.565-167.72)
...
NVIDIA GeForce RTX 3050 Ti Laptop GPU
...
max:
0 100 Tooltip Victus 16-e0145ng: Ø92.7 (75.026-181.4)
IdeaPad Gaming 3 15IAH7: Ø115.9 (94.961-155.1)
: Ø127.8 (104.88-160.058)
...
NVIDIA GeForce RTX 3050 Ti Laptop GPU
...
max:
0 100 Tooltip Victus 16-e0145ng: Ø89.1 (70.07-126.8)
IdeaPad Gaming 3 15IAH7: Ø109 (93.591-154.7)
: Ø126.6 (105.52-185.4)
Intel UHD Graphics Xe G4 48EUs
...
NVIDIA GeForce RTX 3050 Ti Laptop GPU
...
max:
» Jouable avec tous les ordinateurs portables testés avec les détails paramétrés sur Ultra.
Additional Benchmarks
Low Preset 1280x720
320 [X] XMG Focus 17 @75 W TGP Intel Core i7-11800H 2.3GHz
GeForce RTX 3050 Ti Laptop GPU
min:
22.5 fps, P0.1:
141.4 fps, P1:
200 fps, max:
568 fps
0 100 200 300 400 500 Tooltip IdeaPad Gaming 3 15IAH7: Ø93.9 (57.94-533)
Victus 16-e0145ng: Ø113.9 (86.619-534)
: Ø93.1 (83.165-106.547)
...
NVIDIA GeForce RTX 3050 Ti Laptop GPU
...
max:
0 100 200 300 400 500 600 700 800 900 1000 1100 1200 1300 1400 1500 1600 Tooltip IdeaPad Gaming 3 15IAH7: Ø81.6 (57.004-133.6)
: Ø129.5 (82.33-1663)
Victus 16-e0145ng: Ø97.4 (72.805-299)
...
NVIDIA GeForce RTX 3050 Ti Laptop GPU
...
max:
0 100 200 300 400 Tooltip IdeaPad Gaming 3 15IAH7: Ø86.7 (49.904-288.1)
: Ø92.6 (77.25-173.1)
Victus 16-e0145ng: Ø98 (74.498-414)
...
NVIDIA GeForce RTX 3050 Ti Laptop GPU
...
max:
AMD Radeon 680M
NVIDIA GeForce RTX 3050 Ti Laptop GPU
...
max:
AMD Radeon 680M
NVIDIA GeForce RTX 3050 Ti Laptop GPU
...
max:
» Jouable avec tous les ordinateurs portables testés avec les détails paramétrés sur Ultra.
Additional Benchmarks
Highest Settings + Maximum Ray Tracing 1920x1080
32.2 [X] XMG Focus 17 @75 W TGP Intel Core i7-11800H 2.3GHz
GeForce RTX 3050 Ti Laptop GPU
min:
12.9 fps, P0.1:
14.2 fps, P1:
17.5 fps, max:
129.4 fps
...
NVIDIA GeForce RTX 3050 Ti Laptop GPU
...
max:
...
NVIDIA GeForce RTX 3050 Ti Laptop GPU
...
max:
Intel UHD Graphics 24EUs (Alder Lake-N)
...
NVIDIA GeForce RTX 3050 Ti Laptop GPU
...
max:
AMD Radeon 680M
NVIDIA GeForce RTX 3050 Ti Laptop GPU
...
max:
AMD Radeon 680M
NVIDIA GeForce RTX 3050 Ti Laptop GPU
...
max:
» Jouable avec tous les ordinateurs portables testés avec les détails paramétrés sur Ultra.
...
AMD Radeon 680M
NVIDIA GeForce RTX 3050 Ti Laptop GPU
...
max:
AMD Radeon RX Vega 8 (Ryzen 2000/3000)
...
NVIDIA GeForce RTX 3050 Ti Laptop GPU
...
max:
...
NVIDIA GeForce RTX 3050 Ti Laptop GPU
...
max:
AMD Radeon RX Vega 8 (Ryzen 2000/3000)
...
NVIDIA GeForce RTX 3050 Ti Laptop GPU
...
max:
AMD Radeon 680M
NVIDIA GeForce RTX 3050 Ti Laptop GPU
...
max:
NVIDIA GeForce RTX 3050 Ti Laptop GPU
...
max:
» Jouable avec la plupart des ordinateurs portables testés avec les détails paramétrés sur Ultra.
Additional Benchmarks
Ray Tracing Ultra Preset (DLSS off) 1920x1080
14.1 [X] XMG Focus 17 @75 W TGP Intel Core i7-11800H 2.3GHz
GeForce RTX 3050 Ti Laptop GPU
min:
5 fps
...
AMD Radeon 680M
NVIDIA GeForce RTX 3050 Ti Laptop GPU
...
NVIDIA GeForce RTX 3050 Ti Laptop GPU
...
0 100 200 300 400 500 600 700 800 900 1000 1100 1200 1300 1400 1500 1600 1700 1800 1900 2000 Tooltip
...
NVIDIA GeForce RTX 3050 Ti Laptop GPU
...
...
NVIDIA GeForce RTX 3050 Ti Laptop GPU
...
NVIDIA GeForce RTX 3050 Ti Laptop GPU
...
NVIDIA GeForce RTX 3050 Ti Laptop GPU
...
max:
» Jouable avec tous les ordinateurs portables testés avec les détails paramétrés sur Ultra.
Additional Benchmarks
Low / Off 1280x720
...
AMD Radeon 660M
NVIDIA GeForce GTX 1050 Ti Mobile
AMD Radeon RX 560X (Laptop)
AMD Radeon 680M
NVIDIA GeForce RTX 3050 Ti Laptop GPU
...
max:
...
AMD Radeon 680M
NVIDIA GeForce RTX 3050 Ti Laptop GPU
...
max:
Intel UHD Graphics 24EUs (Alder Lake-N)
...
NVIDIA GeForce RTX 3050 Ti Laptop GPU
...
max:
...
NVIDIA GeForce RTX 3050 Ti Laptop GPU
...
max:
NVIDIA GeForce RTX 3050 Ti Laptop GPU
...
max:
NVIDIA GeForce RTX 3050 Ti Laptop GPU
...
max:
» Jouable avec tous les ordinateurs portables testés avec les détails paramétrés sur Ultra.
0 100 Tooltip : Ø63 (52.484-75.7)
Victus 16-e0145ng: Ø68.5 (59.197-134.6)
...
AMD Radeon 680M
NVIDIA GeForce RTX 3050 Ti Laptop GPU
...
max:
0 100 Tooltip : Ø63.6 (44.489-103.2)
Victus 16-e0145ng: Ø68.2 (57.279-133.9)
...
AMD Radeon 680M
NVIDIA GeForce RTX 3050 Ti Laptop GPU
...
max:
0 100 200 300 400 500 Tooltip : Ø64.5 (43.119-200)
Victus 16-e0145ng: Ø80.5 (52.221-508)
Intel UHD Graphics Xe G4 48EUs
...
AMD Radeon 680M
NVIDIA GeForce RTX 3050 Ti Laptop GPU
...
max:
NVIDIA GeForce RTX 3050 Ti Laptop GPU
...
max:
NVIDIA GeForce RTX 3050 Ti Laptop GPU
...
max:
» Jouable avec tous les ordinateurs portables testés avec les détails paramétrés sur Ultra.
0 100 200 300 Tooltip Victus 16-e0145ng: Ø74.4 (45.022-369)
: Ø52.1 (47.466-63.4)
...
NVIDIA GeForce RTX 3050 Ti Laptop GPU
...
max:
0 Tooltip Victus 16-e0145ng: Ø40.8 (38.136-44.61)
: Ø47.4 (42.617-79.1)
...
NVIDIA GeForce RTX 3050 Ti Laptop GPU
...
max:
NVIDIA GeForce RTX 3050 Ti Laptop GPU
...
max:
NVIDIA GeForce RTX 3050 Ti Laptop GPU
...
max:
» Jouable avec tous les ordinateurs portables testés avec les détails paramétrés sur Élevé.
Additional Benchmarks
High Quality Raytracing 1920x1080
6.8 [X] XMG Focus 17 @75 W TGP Intel Core i7-11800H 2.3GHz
GeForce RTX 3050 Ti Laptop GPU
min:
2.2 fps, P0.1:
2.56 fps, P1:
4.56 fps, max:
14.2 fps
...
AMD Radeon 680M
NVIDIA GeForce RTX 3050 Ti Laptop GPU
...
max:
...
AMD Radeon 680M
NVIDIA GeForce RTX 3050 Ti Laptop GPU
...
max:
...
AMD Radeon 680M
NVIDIA GeForce RTX 3050 Ti Laptop GPU
...
max:
NVIDIA GeForce RTX 3050 Ti Laptop GPU
...
max:
NVIDIA GeForce RTX 3050 Ti Laptop GPU
...
max:
» Jouable avec tous les ordinateurs portables testés avec les détails paramétrés sur Ultra.
Intel UHD Graphics G1 (Ice Lake 32 EU)
...
NVIDIA GeForce RTX 3050 Ti Laptop GPU
...
max:
0 100 Tooltip : Ø64.9 (60.322-70.39)
Victus 16-e0145ng: Ø70.7 (61.259-145.2)
...
NVIDIA GeForce RTX 3050 Ti Laptop GPU
...
max:
0 100 Tooltip Victus 16-e0145ng: Ø52.2 (47.001-60.46)
: Ø59.1 (49.092-118.3)
...
NVIDIA GeForce RTX 3050 Ti Laptop GPU
...
max:
0 100 200 300 Tooltip Victus 16-e0145ng: Ø47.7 (22.604-346)
: Ø48.7 (30.095-211)
...
AMD Radeon 680M
NVIDIA GeForce RTX 3050 Ti Laptop GPU
...
max:
» Jouable avec tous les ordinateurs portables testés avec les détails paramétrés sur Élevé.
Additional Benchmarks
Low Preset 1280x720
113 [X] XMG Focus 17 @75 W TGP Intel Core i7-11800H 2.3GHz
GeForce RTX 3050 Ti Laptop GPU
min:
44.9 fps, P0.1:
71.2 fps, P1:
86.1 fps, max:
284 fps
0 100 Tooltip : Ø83.6 (74.05-94)
Victus 16-e0145ng: Ø90.9 (80.034-101.01)
...
NVIDIA GeForce GTX 1050 Ti Mobile
NVIDIA GeForce RTX 3050 Ti Laptop GPU
...
0 100 Tooltip Victus 16-e0145ng: Ø65.9 (49.212-139.4)
: Ø66.5 (54.89-88.5)
...
NVIDIA GeForce RTX 3050 Ti Laptop GPU
...
0 100 Tooltip Victus 16-e0145ng: Ø59.9 (40.071-128.4)
: Ø63.8 (50.387-110.8)
...
NVIDIA GeForce GTX 1050 Ti Mobile
NVIDIA GeForce RTX 3050 Ti Laptop GPU
...
NVIDIA GeForce RTX 3050 Ti Laptop GPU
...
NVIDIA GeForce RTX 3050 Ti Laptop GPU
...
» Jouable avec tous les ordinateurs portables testés avec les détails paramétrés sur Ultra.
0 100 Tooltip Victus 16-e0145ng: Ø134.5 (-0.04498-183.8)
: Ø150.4 (106.71-183.5)
...
NVIDIA GeForce RTX 3050 Ti Laptop GPU
...
max:
0 100 200 Tooltip Victus 16-e0145ng: Ø107.6 (-0.04133-148.3)
: Ø121.1 (105.038-220)
...
NVIDIA GeForce RTX 3050 Ti Laptop GPU
...
max:
0 100 200 300 Tooltip Victus 16-e0145ng: Ø105.3 (-0.06402-326)
: Ø98.4 (84.126-171.3)
...
NVIDIA GeForce RTX 3050 Ti Laptop GPU
...
max:
NVIDIA GeForce RTX 3050 Ti Laptop GPU
...
max:
NVIDIA GeForce RTX 3050 Ti Laptop GPU
...
max:
» Jouable avec tous les ordinateurs portables testés avec les détails paramétrés sur Ultra.
...
NVIDIA GeForce GTX 1050 Ti Mobile
AMD Radeon 680M
NVIDIA GeForce RTX 3050 Ti Laptop GPU
max:
Intel UHD Graphics Xe 32EUs (Tiger Lake-H)
...
NVIDIA GeForce GTX 1050 Ti Mobile
AMD Radeon RX 560X (Laptop)
AMD Radeon 680M
NVIDIA GeForce RTX 3050 Ti Laptop GPU
max:
...
NVIDIA GeForce GTX 1050 Ti Mobile
AMD Radeon RX 560X (Laptop)
AMD Radeon 680M
NVIDIA GeForce RTX 3050 Ti Laptop GPU
max:
AMD Radeon RX 560X (Laptop)
AMD Radeon 680M
NVIDIA GeForce RTX 3050 Ti Laptop GPU
...
» Jouable avec tous les ordinateurs portables testés avec les détails paramétrés sur Ultra.
Additional Benchmarks
Low Preset 1920x1080
97.3 [X] XMG Focus 17 @75 W TGP Intel Core i7-11800H 2.3GHz
GeForce RTX 3050 Ti Laptop GPU
min:
7.06 fps, P0.1:
20.5 fps, P1:
73.7 fps, max:
170 fps
Ultra Preset + Ray Tracing 1920x1080
3.7 [X] XMG Focus 17 @75 W TGP Intel Core i7-11800H 2.3GHz
GeForce RTX 3050 Ti Laptop GPU
min:
0.949 fps, P0.1:
1.021 fps, P1:
1.729 fps, max:
32.5 fps
Intel UHD Graphics Xe 16EUs (Tiger Lake-H)
...
AMD Radeon 680M
NVIDIA GeForce RTX 3050 Ti Laptop GPU
...
max:
...
AMD Radeon 680M
NVIDIA GeForce RTX 3050 Ti Laptop GPU
...
max:
...
AMD Radeon RX 560X (Laptop)
NVIDIA GeForce GTX 1050 Ti Mobile
NVIDIA GeForce RTX 3050 Ti Laptop GPU
AMD Radeon 680M
...
max:
» Jouable avec tous les ordinateurs portables testés avec les détails paramétrés sur Élevé.
Additional Benchmarks
Low Preset 1920x1080
115 [X] XMG Focus 17 @75 W TGP Intel Core i7-11800H 2.3GHz
GeForce RTX 3050 Ti Laptop GPU
NVIDIA GeForce GTX 1050 Ti Mobile
NVIDIA GeForce RTX 3050 Ti Laptop GPU
max:
NVIDIA GeForce GTX 1050 Ti Mobile
NVIDIA GeForce RTX 3050 Ti Laptop GPU
max:
NVIDIA GeForce GTX 1050 Ti Mobile
NVIDIA GeForce RTX 3050 Ti Laptop GPU
max:
» Jouable avec tous les ordinateurs portables testés avec les détails paramétrés sur Ultra.
Additional Benchmarks
Low Preset 1920x1080
98.5 [X] XMG Focus 17 @75 W TGP Intel Core i7-11800H 2.3GHz
GeForce RTX 3050 Ti Laptop GPU
min:
60.5 fps, P0.1:
74.8 fps, P1:
78.6 fps, max:
233 fps
...
NVIDIA GeForce RTX 3050 Ti Laptop GPU
...
max:
...
NVIDIA GeForce RTX 3050 Ti Laptop GPU
...
max:
...
NVIDIA GeForce RTX 3050 Ti Laptop GPU
...
max:
...
NVIDIA GeForce RTX 3050 Ti Laptop GPU
...
max:
NVIDIA GeForce RTX 3050 Ti Laptop GPU
max:
» Jouable avec tous les ordinateurs portables testés avec les détails paramétrés sur Ultra.
Additional Benchmarks
Low Preset 1920x1080
111 [X] XMG Focus 17 @75 W TGP Intel Core i7-11800H 2.3GHz
GeForce RTX 3050 Ti Laptop GPU
min:
85 fps
...
NVIDIA GeForce RTX 3050 Ti Laptop GPU
...
max:
...
NVIDIA GeForce RTX 3050 Ti Laptop GPU
...
max:
AMD Radeon RX 560X (Laptop)
...
NVIDIA GeForce RTX 3050 Ti Laptop GPU
...
max:
» Jouable avec tous les ordinateurs portables testés avec les détails paramétrés sur Ultra.
Additional Benchmarks
Low Preset 1920x1080
87 [X] XMG Focus 17 @75 W TGP Intel Core i7-11800H 2.3GHz
GeForce RTX 3050 Ti Laptop GPU
min:
61 fps
Ultra Preset + Ultra Ray-Tracing 1920x1080
7 [X] XMG Focus 17 @75 W TGP Intel Core i7-11800H 2.3GHz
GeForce RTX 3050 Ti Laptop GPU
min:
3 fps
0 100 Tooltip Victus 16-e0145ng: Ø144.8 (123.508-177.514)
: Ø155.1 (138.56-185.9)
...
NVIDIA GeForce RTX 3050 Ti Laptop GPU
...
0 100 Tooltip : Ø128.1 (110.639-170.9)
Victus 16-e0145ng: Ø126.7 (105.854-153)
...
NVIDIA GeForce RTX 3050 Ti Laptop GPU
...
0 100 200 300 400 500 600 Tooltip : Ø142.7 (100.854-694)
Victus 16-e0145ng: Ø120.9 (102-148.18)
Intel UHD Graphics Xe G4 48EUs
...
NVIDIA GeForce RTX 3050 Ti Laptop GPU
...
NVIDIA GeForce RTX 3050 Ti Laptop GPU
...
NVIDIA GeForce RTX 3050 Ti Laptop GPU
...
max:
» Jouable avec tous les ordinateurs portables testés avec les détails paramétrés sur Ultra.
Additional Benchmarks
Low Preset (DX12) 1920x1080
205 [X] XMG Focus 17 @75 W TGP Intel Core i7-11800H 2.3GHz
GeForce RTX 3050 Ti Laptop GPU
min:
22.6 fps, P0.1:
106 fps, P1:
134 fps, max:
443 fps
...
AMD Radeon RX 560X (Laptop)
NVIDIA GeForce GTX 1050 Ti Mobile
AMD Radeon 680M
NVIDIA GeForce RTX 3050 Ti Laptop GPU
...
max:
...
NVIDIA GeForce RTX 3050 Ti Laptop GPU
...
max:
Intel UHD Graphics Xe 32EUs (Tiger Lake-H)
...
NVIDIA GeForce RTX 3050 Ti Laptop GPU
...
max:
...
AMD Radeon 680M
NVIDIA GeForce RTX 3050 Ti Laptop GPU
...
max:
» Jouable avec tous les ordinateurs portables testés avec les détails paramétrés sur Ultra.
Additional Benchmarks
Low Graphics Quality 1920x1080
106 [X] XMG Focus 17 @75 W TGP Intel Core i7-11800H 2.3GHz
GeForce RTX 3050 Ti Laptop GPU
min:
95 fps
97 [X] Dell G15 5515 AMD Ryzen 7 5800H 3.2GHz
GeForce RTX 3050 Ti Laptop GPU
min:
62 fps, max:
114 fps
Ultra Graphics Quality + HD Textures + DXR TAA 1920x1080
8 [X] Dell G15 5515 AMD Ryzen 7 5800H 3.2GHz
GeForce RTX 3050 Ti Laptop GPU
min:
6 fps, max:
18 fps
0 100 200 Tooltip : Ø98.1 (86.53-145.3)
Victus 16-e0145ng: Ø111.8 (100.371-237.4)
...
AMD Radeon 680M
NVIDIA GeForce RTX 3050 Ti Laptop GPU
...
0 100 Tooltip : Ø88.2 (78.13-117)
Victus 16-e0145ng: Ø98.9 (89.076-130.1)
...
AMD Radeon RX 560X (Laptop)
NVIDIA GeForce RTX 3050 Ti Laptop GPU
...
max:
0 100 200 300 400 500 600 700 800 900 1000 1100 1200 1300 1400 1500 1600 1700 1800 1900 2000 2100 2200 2300 2400 2500 2600 2700 2800 2900 3000 3100 3200 3300 3400 3500 3600 3700 3800 3900 4000 4100 4200 4300 4400 4500 4600 4700 4800 4900 5000 5100 5200 5300 Tooltip
NVIDIA GeForce RTX 3050 Ti Laptop GPU
...
max:
» Jouable avec tous les ordinateurs portables testés avec les détails paramétrés sur Élevé.
Additional Benchmarks
Low Preset 1920x1080
99.7 [X] XMG Focus 17 @75 W TGP Intel Core i7-11800H 2.3GHz
GeForce RTX 3050 Ti Laptop GPU
min:
40.1 fps, P0.1:
45.1 fps, P1:
82.1 fps, max:
176 fps
0 100 200 Tooltip Zephyrus G14 GA401QEC: Ø197.1 (183.753-254.3)
AMD Radeon RX Vega 7
NVIDIA GeForce RTX 3050 Ti Laptop GPU
max:
0 100 200 Tooltip Zephyrus G14 GA401QEC: Ø180.1 (172.012-206.6)
: Ø200 (192.195-241.2)
...
AMD Radeon RX Vega 7
NVIDIA GeForce RTX 3050 Ti Laptop GPU
0 100 200 Tooltip Zephyrus G14 GA401QEC: Ø177.8 (167.026-226.2)
: Ø192.4 (186.065-207.1)
...
AMD Radeon RX Vega 7
NVIDIA GeForce RTX 3050 Ti Laptop GPU
max:
NVIDIA GeForce RTX 3060
0 100 200 Tooltip Zephyrus G14 GA401QEC: Ø164.5 (157.156-175.3)
: Ø182.2 (174.143-216.6)
...
AMD Radeon RX Vega 8 (Ryzen 2000/3000)
AMD Radeon RX Vega 7
NVIDIA GeForce RTX 3050 Ti Laptop GPU
max:
NVIDIA GeForce RTX 3060
0 100 200 300 Tooltip Zephyrus G14 GA401QEC: Ø135.3 (126.293-189.8)
: Ø149 (133.382-334)
AMD Radeon RX Vega 7
NVIDIA GeForce RTX 3050 Ti Laptop GPU
max:
NVIDIA GeForce RTX 3050 Ti Laptop GPU
max:
» Jouable avec tous les ordinateurs portables testés avec les détails paramétrés sur Ultra.
Additional Benchmarks
Low Rendering Quality 1920x1080
267 [X] XMG Focus 17 @75 W TGP Intel Core i7-11800H 2.3GHz
GeForce RTX 3050 Ti Laptop GPU
min:
14.7 fps, P0.1:
120 fps, P1:
170 fps, max:
417 fps
0 100 Tooltip Zephyrus G14 GA401QEC: Ø87 (57.46-132.9)
G15 5515: Ø100.8 (52.33-155.516)
...
AMD Radeon RX Vega 7
AMD Radeon RX 560X (Laptop)
AMD Radeon 680M
NVIDIA GeForce RTX 3050 Ti Laptop GPU
...
max:
0 100 200 Tooltip : Ø65.7 (53.839-135.6)
Zephyrus G14 GA401QEC: Ø71 (52.348-123.2)
G15 5515: Ø81.5 (53.466-204)
...
AMD Radeon 680M
NVIDIA GeForce RTX 3050 Ti Laptop GPU
...
max:
0 100 200 300 400 500 600 700 800 900 1000 Tooltip : Ø87.9 (45.042-1068)
Zephyrus G14 GA401QEC: Ø64.7 (44.539-89.1)
G15 5515: Ø75.5 (57-203)
...
AMD Radeon RX 560X (Laptop)
AMD Radeon 680M
NVIDIA GeForce RTX 3050 Ti Laptop GPU
...
max:
0 100 200 300 400 500 600 700 800 900 1000 1100 1200 Tooltip Zephyrus G14 GA401QEC: Ø46.5 (30.185-67.84)
: Ø80.7 (39.018-1218)
G15 5515: Ø53.5 (40.208-86.4)
...
AMD Radeon RX 560X (Laptop)
AMD Radeon 680M
NVIDIA GeForce RTX 3050 Ti Laptop GPU
...
max:
0 100 200 300 400 500 600 700 800 900 1000 1100 Tooltip Zephyrus G14 GA401QEC: Ø62.2 (20.043-1197)
: Ø38.3 (20.142-140)
NVIDIA GeForce RTX 3050 Ti Laptop GPU
max:
NVIDIA GeForce RTX 3050 Ti Laptop GPU
...
max:
» Jouable avec la plupart des ordinateurs portables testés avec les détails paramétrés sur Ultra.
Additional Benchmarks
Low Video Quality 1920x1080
72.8 [X] XMG Focus 17 @75 W TGP Intel Core i7-11800H 2.3GHz
GeForce RTX 3050 Ti Laptop GPU
min:
33.5 fps, P0.1:
36.9 fps, P1:
43.9 fps, max:
160 fps
89.9 [X] Dell G15 5515 AMD Ryzen 7 5800H 3.2GHz
GeForce RTX 3050 Ti Laptop GPU
min:
24.3 fps, P0.1:
34.9 fps, P1:
46.3 fps, max:
184 fps
0 100 200 300 400 500 Tooltip XMG Focus 17: Ø89.8 (60.25-535)
XMG Focus 15: Ø75.6 (60.27-112.7)
...
NVIDIA GeForce GTX 1050 Ti Mobile
AMD Radeon 680M
NVIDIA GeForce RTX 3050 Ti Laptop GPU
...
0 100 Tooltip XMG Focus 17: Ø52.3 (40.06-68.189)
XMG Focus 15: Ø63.4 (47.479-112)
...
NVIDIA GeForce GTX 1050 Ti Mobile
AMD Radeon 680M
NVIDIA GeForce RTX 3050 Ti Laptop GPU
...
0 Tooltip XMG Focus 17: Ø44.6 (32.366-62.66)
XMG Focus 15: Ø56.5 (41.603-92.2)
...
NVIDIA GeForce GTX 1050 Ti Mobile
AMD Radeon 680M
NVIDIA GeForce RTX 3050 Ti Laptop GPU
...
» Jouable avec tous les ordinateurs portables testés avec les détails paramétrés sur Ultra.
Additional Benchmarks
Low Preset 1920x1080
79.6 [X] SCHENKER XMG Focus 17 Intel Core i7-11800H 2.3GHz
GeForce RTX 3050 Ti Laptop GPU
min:
17.8 fps, P0.1:
58 fps, P1:
63.3 fps, max:
191 fps
...
AMD Radeon 680M
NVIDIA GeForce RTX 3050 Ti Laptop GPU
...
max:
...
AMD Radeon 680M
NVIDIA GeForce RTX 3050 Ti Laptop GPU
...
max:
...
NVIDIA GeForce RTX 3050 Ti Laptop GPU
...
max:
...
NVIDIA GeForce RTX 3050 Ti Laptop GPU
...
max:
AMD Radeon 680M
NVIDIA GeForce RTX 3050 Ti Laptop GPU
...
max:
...
NVIDIA GeForce RTX 3050 Ti Laptop GPU
...
max:
» Jouable avec tous les ordinateurs portables testés avec les détails paramétrés sur Ultra.
0 100 200 300 Tooltip XMG Focus 15: Ø149.7 (143.052-200.2)
XMG Focus 17: Ø152.7 (143.006-315)
...
NVIDIA GeForce RTX 3050 Ti Laptop GPU
...
max:
0 100 200 300 Tooltip XMG Focus 15: Ø150.3 (141.503-187.8)
XMG Focus 17: Ø154.6 (141.213-361)
...
NVIDIA GeForce RTX 3050 Ti Laptop GPU
max:
» Jouable avec tous les ordinateurs portables testés avec les détails paramétrés sur Élevé.
0 100 200 Tooltip XMG Focus 15: Ø98 (86.021-284)
XMG Focus 17: Ø95.3 (85.48-130.2)
...
NVIDIA GeForce RTX 3050 Ti Laptop GPU
...
0 100 200 300 400 500 600 Tooltip XMG Focus 15: Ø103.1 (74.278-639)
XMG Focus 17: Ø88.4 (76.015-249)
Intel UHD Graphics Xe 32EUs (Tiger Lake-H)
...
NVIDIA GeForce RTX 3050 Ti Laptop GPU
...
0 100 200 Tooltip XMG Focus 17: Ø65 (56.12-241)
XMG Focus 15: Ø67.4 (56.029-298)
...
NVIDIA GeForce RTX 3050 Ti Laptop GPU
...
max:
» Jouable avec tous les ordinateurs portables testés avec les détails paramétrés sur Ultra.
0 100 200 Tooltip XMG Focus 17: Ø114.3 (68.509-171.63)
XMG Focus 15: Ø122.8 (76.397-275)
...
NVIDIA GeForce RTX 3050 Ti Laptop GPU
» Jouable avec tous les ordinateurs portables testés avec les détails paramétrés sur Ultra.
0 100 Tooltip XMG Focus 15: Ø103.6 (88.347-129.7)
XMG Focus 17: Ø104.3 (85.541-118.932)
: Ø117.7 (97.85-154.3)
Intel UHD Graphics Xe 32EUs (Tiger Lake-H)
...
NVIDIA GeForce RTX 3050 Ti Laptop GPU
...
max:
AMD Radeon RX 6700 XT
0 100 Tooltip XMG Focus 15: Ø102.8 (85.027-130)
XMG Focus 17: Ø105.2 (86.3-163.9)
: Ø107.3 (85.699-129.3)
...
NVIDIA GeForce RTX 3050 Ti Laptop GPU
...
max:
AMD Radeon RX 6700 XT
0 100 200 Tooltip : Ø61.7 (50.158-159)
XMG Focus 15: Ø78.5 (66.45-101.9)
XMG Focus 17: Ø88.4 (67.57-230)
...
AMD Radeon 680M
NVIDIA GeForce RTX 3050 Ti Laptop GPU
...
NVIDIA GeForce RTX 3050 Ti Laptop GPU
...
max:
NVIDIA GeForce RTX 3050 Ti Laptop GPU
...
max:
» Jouable avec tous les ordinateurs portables testés avec les détails paramétrés sur Ultra.
Additional Benchmarks
Ray Tracing Preset 1920x1080
34.2 [X] XMG Prototyp AMD Ryzen 5 5600H 3.3GHz
GeForce RTX 3050 Ti Laptop GPU
min:
14.6 fps, P0.1:
15.1 fps, P1:
26.6 fps, max:
42.8 fps
0 100 Tooltip XMG Focus 15: Ø72.2 (48.159-153.1)
XMG Focus 17: Ø84 (62.15-156.9)
: Ø99 (79.055-126.28)
...
AMD Radeon RX 560X (Laptop)
AMD Radeon 680M
NVIDIA GeForce RTX 3050 Ti Laptop GPU
...
max:
AMD Radeon RX 6700 XT
0 100 200 300 400 500 600 700 800 900 1000 1100 1200 1300 1400 1500 1600 1700 1800 1900 2000 2100 2200 2300 2400 2500 2600 2700 2800 2900 3000 3100 3200 3300 3400 3500 3600 3700 3800 3900 4000 4100 4200 4300 4400 Tooltip XMG Focus 17: Ø70.9 (54.11-89.168)
XMG Focus 15: Ø72.1 (55.665-95.45)
: Ø318 (55.095-4443)
...
AMD Radeon 680M
NVIDIA GeForce RTX 3050 Ti Laptop GPU
...
max:
NVIDIA Titan RTX
0 100 Tooltip XMG Focus 15: Ø61 (31.67-90.2)
XMG Focus 17: Ø66.6 (52.495-80.67)
: Ø71 (55.056-111.4)
...
AMD Radeon 680M
NVIDIA GeForce RTX 3050 Ti Laptop GPU
...
max:
NVIDIA Titan RTX
NVIDIA GeForce RTX 3050 Ti Laptop GPU
...
max:
NVIDIA GeForce RTX 3050 Ti Laptop GPU
...
max:
» Jouable avec tous les ordinateurs portables testés avec les détails paramétrés sur Ultra.
...
AMD Radeon 660M
AMD Radeon RX 560X (Laptop)
NVIDIA GeForce GTX 1050 Ti Mobile
NVIDIA GeForce RTX 3050 Ti Laptop GPU
AMD Radeon 680M
...
max:
AMD Radeon RX 6700 XT
...
NVIDIA GeForce RTX 3050 Ti Laptop GPU
...
max:
...
NVIDIA GeForce RTX 3050 Ti Laptop GPU
...
max:
...
NVIDIA GeForce RTX 3050 Ti Laptop GPU
...
max:
...
NVIDIA GeForce RTX 3050 Ti Laptop GPU
...
max:
AMD Radeon 680M
NVIDIA GeForce RTX 3050 Ti Laptop GPU
...
max:
» Jouable avec tous les ordinateurs portables testés avec les détails paramétrés sur Ultra.
0 100 Tooltip G15 5515: Ø94.3 (68.22-134.9)
...
NVIDIA GeForce GTX 1050 Ti Mobile
NVIDIA GeForce RTX 3050 Ti Laptop GPU
NVIDIA GeForce RTX 2070 Super Max-Q
...
max:
AMD Radeon RX 6700 XT
0 100 200 Tooltip : Ø47 (30.07-212)
G15 5515: Ø51.3 (41.007-233)
...
NVIDIA GeForce RTX 3050 Ti Laptop GPU
NVIDIA GeForce GTX 1070 Mobile
...
max:
0 100 200 Tooltip G15 5515: Ø40.6 (32.133-159)
: Ø44.9 (28.883-273)
...
NVIDIA GeForce RTX 3050 Ti Laptop GPU
NVIDIA GeForce GTX 1070 Mobile
...
max:
0 100 200 300 400 500 600 700 800 Tooltip G15 5515: Ø46.5 (25.012-831)
: Ø35.2 (22.712-155)
...
NVIDIA GeForce RTX 3050 Ti Laptop GPU
NVIDIA GeForce GTX 1070 Mobile
...
max:
0 100 200 300 400 500 600 700 800 Tooltip
NVIDIA GeForce RTX 3050 Ti Laptop GPU
NVIDIA GeForce GTX 1070 Mobile
...
max:
NVIDIA GeForce RTX 3050 Ti Laptop GPU
NVIDIA GeForce GTX 1070 Mobile
...
max:
» Jouable avec tous les ordinateurs portables testés avec les détails paramétrés sur Moyen.
Additional Benchmarks
Low Preset 1920x1080
53.2 [X] Dell G15 5515 AMD Ryzen 7 5800H 3.2GHz
GeForce RTX 3050 Ti Laptop GPU
min:
22.5 fps, P0.1:
34.2 fps, P1:
40.9 fps, max:
89.2 fps
Ray Tracing Ultra Preset (DLSS off) 1920x1080
8.4 [X] XMG Prototyp AMD Ryzen 5 5600H 3.3GHz
GeForce RTX 3050 Ti Laptop GPU
min:
3.17 fps, P0.1:
3.21 fps, P1:
3.61 fps, max:
51.1 fps
11.2 [X] Dell G15 5515 AMD Ryzen 7 5800H 3.2GHz
GeForce RTX 3050 Ti Laptop GPU
min:
4.16 fps, P0.1:
4.7 fps, P1:
5.19 fps, max:
54.6 fps
...
AMD Radeon RX 560X (Laptop)
NVIDIA GeForce GTX 1050 Ti Mobile
NVIDIA GeForce RTX 3050 Ti Laptop GPU
...
Intel UHD Graphics G1 (Ice Lake 32 EU)
...
NVIDIA GeForce GTX 1070 Mobile
NVIDIA GeForce RTX 3050 Ti Laptop GPU
...
max:
...
NVIDIA GeForce GTX 1070 Mobile
NVIDIA GeForce RTX 3050 Ti Laptop GPU
...
max:
...
NVIDIA GeForce GTX 1070 Mobile
NVIDIA GeForce RTX 3050 Ti Laptop GPU
...
max:
...
NVIDIA GeForce GTX 1070 Mobile
NVIDIA GeForce RTX 3050 Ti Laptop GPU
...
max:
NVIDIA GeForce RTX 3050 Ti Laptop GPU
NVIDIA GeForce GTX 1070 Mobile
...
max:
» Jouable avec tous les ordinateurs portables testés avec les détails paramétrés sur Ultra.
0 100 Tooltip XMG Focus 15: Ø83.4 (72.108-155.9)
XMG Focus 17: Ø82.2 (71.106-88.85)
: Ø84 (72.014-99.9)
...
NVIDIA GeForce GTX 1070 Mobile
NVIDIA GeForce RTX 3050 Ti Laptop GPU
NVIDIA GeForce RTX 2070 Super Max-Q
NVIDIA GeForce RTX 2070 Super Mobile
...
0 100 200 Tooltip XMG Focus 15: Ø82 (67.217-164)
XMG Focus 17: Ø79.3 (69.402-107.1)
: Ø86.9 (72.66-233)
Intel UHD Graphics Xe 32EUs (Tiger Lake-H)
...
NVIDIA GeForce GTX 1070 Mobile
NVIDIA GeForce RTX 3050 Ti Laptop GPU
NVIDIA GeForce RTX 2070 Super Max-Q
NVIDIA GeForce RTX 2070 Super Mobile
...
0 100 Tooltip XMG Focus 15: Ø73 (60.002-152.2)
XMG Focus 17: Ø71.8 (61.258-126.3)
: Ø70.4 (56.141-82.87)
...
NVIDIA GeForce GTX 1070 Mobile
NVIDIA GeForce RTX 3050 Ti Laptop GPU
NVIDIA GeForce RTX 2070 Super Max-Q
NVIDIA GeForce RTX 2070 Super Mobile
...
...
NVIDIA GeForce GTX 1070 Mobile
NVIDIA GeForce RTX 3050 Ti Laptop GPU
NVIDIA GeForce RTX 2070 Super Mobile
...
NVIDIA GeForce GTX 1070 Mobile
NVIDIA GeForce RTX 3050 Ti Laptop GPU
NVIDIA GeForce RTX 2070 Super Mobile
...
max:
» Jouable avec tous les ordinateurs portables testés avec les détails paramétrés sur Ultra.
...
NVIDIA GeForce GTX 1070 Mobile
NVIDIA GeForce RTX 3050 Ti Laptop GPU
NVIDIA GeForce RTX 2070 Super Max-Q
NVIDIA GeForce RTX 2070 Super Mobile
max:
...
NVIDIA GeForce GTX 1050 Ti Mobile
NVIDIA GeForce RTX 3050 Ti Laptop GPU
NVIDIA GeForce GTX 1070 Mobile
...
max:
NVIDIA GeForce GTX 1050 Ti Mobile
NVIDIA GeForce RTX 3050 Ti Laptop GPU
NVIDIA GeForce GTX 1070 Mobile
...
max:
NVIDIA GeForce RTX 3050 Ti Laptop GPU
NVIDIA GeForce GTX 1070 Mobile
NVIDIA GeForce RTX 2070 Super Mobile
...
max:
NVIDIA GeForce RTX 3050 Ti Laptop GPU
NVIDIA GeForce GTX 1070 Mobile
NVIDIA GeForce RTX 2070 Super Mobile
...
max:
» Jouable avec tous les ordinateurs portables testés avec les détails paramétrés sur Ultra.
Additional Benchmarks
Highest Settings + Ultra Ray Tracing 1920x1080
30.1 [X] XMG Prototyp AMD Ryzen 5 5600H 3.3GHz
GeForce RTX 3050 Ti Laptop GPU
min:
20.1 fps, P0.1:
20.2 fps, P1:
21.6 fps, max:
70 fps
...
AMD Radeon RX 560X (Laptop)
AMD Radeon 680M
NVIDIA GeForce RTX 3050 Ti Laptop GPU
...
max:
...
NVIDIA GeForce RTX 3050 Ti Laptop GPU
NVIDIA GeForce GTX 1070 Mobile
...
max:
...
AMD Radeon RX 560X (Laptop)
AMD Radeon 680M
NVIDIA GeForce RTX 3050 Ti Laptop GPU
NVIDIA GeForce GTX 1070 Mobile
...
max:
...
NVIDIA GeForce GTX 1050 Ti Mobile
NVIDIA GeForce RTX 3050 Ti Laptop GPU
AMD Radeon 680M
...
max:
...
NVIDIA GeForce RTX 3050 Ti Laptop GPU
NVIDIA GeForce GTX 1070 Mobile
...
max:
» Jouable avec tous les ordinateurs portables testés avec les détails paramétrés sur Moyen.
Intel UHD Graphics Xe 16EUs (Tiger Lake-H)
...
AMD Radeon 660M
AMD Radeon 680M
NVIDIA GeForce RTX 3050 Ti Laptop GPU
NVIDIA GeForce RTX 2070 Super Max-Q
...
max:
...
NVIDIA GeForce GTX 1070 Mobile
NVIDIA GeForce RTX 3050 Ti Laptop GPU
...
max:
...
NVIDIA GeForce GTX 1070 Mobile
NVIDIA GeForce RTX 3050 Ti Laptop GPU
NVIDIA GeForce RTX 2070 Super Mobile
NVIDIA GeForce RTX 2070 Super Max-Q
...
max:
...
NVIDIA GeForce RTX 3050 Ti Laptop GPU
NVIDIA GeForce RTX 2070 Super Mobile
NVIDIA GeForce RTX 2070 Super Max-Q
...
max:
...
NVIDIA GeForce GTX 1070 Mobile
NVIDIA GeForce RTX 3050 Ti Laptop GPU
NVIDIA GeForce RTX 2070 Super Mobile
...
max:
NVIDIA GeForce GTX 1070 Mobile
NVIDIA GeForce RTX 3050 Ti Laptop GPU
NVIDIA GeForce RTX 2070 Super Mobile
...
max:
» Jouable avec tous les ordinateurs portables testés avec les détails paramétrés sur Ultra.
...
AMD Radeon RX Vega 7
AMD Radeon RX 560X (Laptop)
AMD Radeon 660M
NVIDIA GeForce GTX 1050 Ti Mobile
AMD Radeon 680M
NVIDIA GeForce RTX 3050 Ti Laptop GPU
...
max:
Intel UHD Graphics Xe 16EUs (Tiger Lake-H)
...
NVIDIA GeForce GTX 1070 Mobile
NVIDIA GeForce RTX 3050 Ti Laptop GPU
...
max:
...
NVIDIA GeForce GTX 1070 Mobile
NVIDIA GeForce RTX 3050 Ti Laptop GPU
...
max:
...
AMD Radeon 680M
NVIDIA GeForce RTX 3050 Ti Laptop GPU
NVIDIA GeForce GTX 1070 Mobile
...
max:
...
NVIDIA GeForce RTX 3050 Ti Laptop GPU
NVIDIA GeForce GTX 1070 Mobile
...
max:
NVIDIA GeForce RTX 3050 Ti Laptop GPU
NVIDIA GeForce GTX 1070 Mobile
...
max:
» Jouable avec tous les ordinateurs portables testés avec les détails paramétrés sur Élevé.
Additional Benchmarks
Ultra Preset + Ultra Ray Tracing (DX12) 1920x1080
11 [X] XMG Prototyp AMD Ryzen 5 5600H 3.3GHz
GeForce RTX 3050 Ti Laptop GPU
min:
7 fps
0 100 200 300 Tooltip : Ø201 (166.417-345)
XMG Focus 17: Ø237 (203.311-285.8)
XMG Focus 15: Ø238 (201.128-259.883)
...
NVIDIA GeForce GTX 1050 Ti Mobile
NVIDIA GeForce GTX 1070 Mobile
NVIDIA GeForce RTX 3050 Ti Laptop GPU
max:
0 100 200 Tooltip : Ø186.6 (177.106-218.3)
XMG Focus 17: Ø205 (192.267-227.2)
XMG Focus 15: Ø207 (197.169-224)
...
NVIDIA GeForce GTX 1070 Mobile
NVIDIA GeForce RTX 3050 Ti Laptop GPU
NVIDIA GeForce RTX 2080 Super Mobile
max:
0 100 200 Tooltip : Ø180.1 (172.119-228.6)
XMG Focus 15: Ø196.5 (182.09-268.2)
XMG Focus 17: Ø199.1 (185.546-229.4)
...
NVIDIA GeForce RTX 3050 Ti Laptop GPU
NVIDIA GeForce RTX 2080 Super Mobile
max:
NVIDIA GeForce GTX 1050 Ti Mobile
NVIDIA GeForce RTX 3050 Ti Laptop GPU
NVIDIA GeForce GTX 1070 Mobile
...
NVIDIA GeForce RTX 2080 Super Mobile
max:
NVIDIA GeForce GTX 1050 Ti Mobile
NVIDIA GeForce RTX 3050 Ti Laptop GPU
NVIDIA GeForce GTX 1070 Mobile
...
NVIDIA GeForce RTX 2080 Super Mobile
max:
» Jouable avec tous les ordinateurs portables testés avec les détails paramétrés sur Ultra.
0 100 200 300 Tooltip : Ø169.2 (147.39-315)
XMG Focus 17: Ø173.4 (148.283-241.3)
XMG Focus 15: Ø173.8 (153.21-194)
...
AMD Radeon 680M
NVIDIA GeForce GTX 1050 Ti Mobile
NVIDIA GeForce RTX 3050 Ti Laptop GPU
NVIDIA GeForce GTX 1070 Mobile
NVIDIA GeForce RTX 2070 Super Mobile
...
max:
0 100 200 300 400 Tooltip : Ø147.1 (124.73-166.1)
XMG Focus 15: Ø172.7 (130.422-497)
XMG Focus 17: Ø166.8 (136.065-274)
...
AMD Radeon 680M
NVIDIA GeForce GTX 1050 Ti Mobile
NVIDIA GeForce RTX 3050 Ti Laptop GPU
NVIDIA GeForce GTX 1070 Mobile
...
max:
0 100 200 Tooltip : Ø139.8 (116.316-154.07)
XMG Focus 15: Ø144.4 (121.847-198.2)
XMG Focus 17: Ø146.1 (122.9-211.6)
...
AMD Radeon RX 560X (Laptop)
AMD Radeon 680M
NVIDIA GeForce RTX 3050 Ti Laptop GPU
NVIDIA GeForce GTX 1070 Mobile
...
max:
NVIDIA GeForce GTX 1050 Ti Mobile
NVIDIA GeForce RTX 3050 Ti Laptop GPU
NVIDIA GeForce GTX 1070 Mobile
...
max:
NVIDIA GeForce GTX 1050 Ti Mobile
NVIDIA GeForce RTX 3050 Ti Laptop GPU
NVIDIA GeForce GTX 1070 Mobile
...
max:
» Jouable avec tous les ordinateurs portables testés avec les détails paramétrés sur Ultra.
0 100 200 Tooltip : Ø77 (69.937-97.3)
XMG Focus 15: Ø78.1 (71.346-109)
XMG Focus 17: Ø81 (70.235-211)
Intel UHD Graphics G1 (Ice Lake 32 EU)
...
NVIDIA GeForce RTX 3050 Ti Laptop GPU
NVIDIA GeForce GTX 1070 Mobile
...
max:
0 100 200 300 400 500 600 700 Tooltip XMG Focus 15: Ø70.8 (66.042-83.3)
: Ø96.5 (64.04-725)
XMG Focus 17: Ø76.1 (64.793-138.4)
...
NVIDIA GeForce RTX 3050 Ti Laptop GPU
NVIDIA GeForce GTX 1070 Mobile
...
max:
...
NVIDIA GeForce RTX 3050 Ti Laptop GPU
NVIDIA GeForce GTX 1070 Mobile
...
max:
NVIDIA GeForce GTX 1050 Ti Mobile
NVIDIA GeForce RTX 3050 Ti Laptop GPU
NVIDIA GeForce GTX 1070 Mobile
...
max:
» Jouable avec tous les ordinateurs portables testés avec les détails paramétrés sur Élevé.
...
NVIDIA GeForce GTX 1070 Mobile
NVIDIA GeForce RTX 3050 Ti Laptop GPU
NVIDIA GeForce RTX 2070 Super Max-Q
NVIDIA GeForce RTX 2070 Super Mobile
...
max:
...
NVIDIA GeForce GTX 1070 Mobile
NVIDIA GeForce RTX 3050 Ti Laptop GPU
NVIDIA GeForce RTX 2070 Super Max-Q
...
NVIDIA GeForce RTX 2080 Super Mobile
max:
...
NVIDIA GeForce GTX 1070 Mobile
NVIDIA GeForce RTX 3050 Ti Laptop GPU
NVIDIA GeForce RTX 2070 Super Max-Q
...
max:
...
NVIDIA GeForce GTX 1050 Ti Mobile
NVIDIA GeForce RTX 3050 Ti Laptop GPU
NVIDIA GeForce GTX 1070 Mobile
...
max:
» Jouable avec tous les ordinateurs portables testés avec les détails paramétrés sur Ultra.
0 100 Tooltip XMG Focus 17: Ø92.2 (80.326-116.1)
XMG Focus 15: Ø91.7 (81.82-106.434)
: Ø101.6 (84.231-172.3)
...
AMD Radeon 660M
AMD Radeon 680M
NVIDIA GeForce RTX 3050 Ti Laptop GPU
NVIDIA GeForce GTX 1070 Mobile
...
max:
0 Tooltip XMG Focus 17: Ø48 (41.225-56.202)
XMG Focus 15: Ø49.4 (42.219-63.4)
: Ø52.5 (44.155-64.51)
...
AMD Radeon 680M
NVIDIA GeForce RTX 3050 Ti Laptop GPU
NVIDIA GeForce GTX 1070 Mobile
...
max:
0 Tooltip XMG Focus 17: Ø33.5 (27.025-39.66)
XMG Focus 15: Ø34.1 (28.512-48.9)
: Ø34.4 (29.155-43.35)
...
AMD Radeon 680M
NVIDIA GeForce RTX 3050 Ti Laptop GPU
NVIDIA GeForce GTX 1070 Mobile
...
max:
NVIDIA GeForce RTX 3050 Ti Laptop GPU
NVIDIA GeForce GTX 1070 Mobile
...
max:
NVIDIA GeForce RTX 3050 Ti Laptop GPU
NVIDIA GeForce GTX 1070 Mobile
...
max:
» Jouable avec tous les ordinateurs portables testés avec les détails paramétrés sur Élevé.
0 100 Tooltip VivoBook Pro 16: Ø102.9 (60.415-190.3)
Intel UHD Graphics Xe 16EUs (Tiger Lake-H)
...
NVIDIA GeForce RTX 2070 Super Mobile
NVIDIA GeForce RTX 3050 Ti Laptop GPU
0 100 Tooltip VivoBook Pro 16: Ø56.5 (50.846-113.5)
AMD Radeon RX Vega 8 (Ryzen 2000/3000)
...
NVIDIA GeForce RTX 3050 Ti Laptop GPU
NVIDIA GeForce GTX 1070 Mobile
NVIDIA GeForce RTX 2070 Super Mobile
...
0 100 200 Tooltip VivoBook Pro 16: Ø46.7 (36.26-218.3)
...
NVIDIA GeForce RTX 3050 Ti Laptop GPU
NVIDIA GeForce GTX 1070 Mobile
...
0 100 200 300 Tooltip VivoBook Pro 16: Ø34.4 (25.076-344)
...
NVIDIA GeForce RTX 3050 Ti Laptop GPU
NVIDIA GeForce GTX 1070 Mobile
...
0 100 200 300 400 Tooltip VivoBook Pro 16: Ø31.7 (19.005-464)
NVIDIA GeForce GTX 1050 Ti Mobile
NVIDIA GeForce RTX 3050 Ti Laptop GPU
NVIDIA GeForce GTX 1070 Mobile
...
» Jouable avec tous les ordinateurs portables testés avec les détails paramétrés sur Élevé.
Additional Benchmarks
Low-End TAAAA 1920x1080
81.9 [X] Asus VivoBook Pro 16 Intel Core i7-12700H 1.7GHz
GeForce RTX 3050 Ti Laptop GPU
min:
12 fps, P0.1:
49.4 fps, P1:
60.9 fps, max:
110.1 fps
...
AMD Radeon RX Vega 7
NVIDIA GeForce RTX 3050 Ti Laptop GPU
NVIDIA GeForce GTX 1050 Ti Mobile
AMD Radeon 680M
...
max:
Intel UHD Graphics Xe 16EUs (Tiger Lake-H)
...
NVIDIA GeForce GTX 1050 Ti Mobile
NVIDIA GeForce RTX 3050 Ti Laptop GPU
NVIDIA GeForce GTX 1070 Mobile
...
max:
...
NVIDIA GeForce RTX 3050 Ti Laptop GPU
NVIDIA GeForce GTX 1070 Mobile
...
max:
...
NVIDIA GeForce RTX 3050 Ti Laptop GPU
NVIDIA GeForce GTX 1070 Mobile
...
max:
...
NVIDIA GeForce GTX 1070 Mobile
NVIDIA GeForce RTX 3050 Ti Laptop GPU
...
max:
» Jouable avec tous les ordinateurs portables testés avec les détails paramétrés sur Ultra.
0 100 Tooltip : Ø64.9 (51.72-94.1)
XMG Focus 15: Ø102.7 (89.12-126.8)
XMG Focus 17: Ø104.2 (93.46-131.8)
...
NVIDIA GeForce RTX 3050 Ti Laptop GPU
NVIDIA GeForce GTX 1070 Mobile
...
max:
0 100 Tooltip : Ø61.9 (49.543-86.1)
XMG Focus 15: Ø96.6 (79.269-141.5)
XMG Focus 17: Ø95.6 (87.125-112.2)
...
NVIDIA GeForce RTX 3050 Ti Laptop GPU
NVIDIA GeForce GTX 1070 Mobile
...
max:
0 100 Tooltip : Ø62.1 (45.412-99.9)
XMG Focus 15: Ø89.7 (73.66-117.4)
XMG Focus 17: Ø95.1 (84.216-120.9)
...
NVIDIA GeForce RTX 3050 Ti Laptop GPU
NVIDIA GeForce GTX 1070 Mobile
...
max:
NVIDIA GeForce GTX 1050 Ti Mobile
NVIDIA GeForce RTX 3050 Ti Laptop GPU
NVIDIA GeForce GTX 1070 Mobile
...
max:
NVIDIA GeForce GTX 1050 Ti Mobile
NVIDIA GeForce RTX 3050 Ti Laptop GPU
NVIDIA GeForce GTX 1070 Mobile
...
max:
» Jouable avec tous les ordinateurs portables testés avec les détails paramétrés sur Ultra.
...
NVIDIA GeForce GTX 1070 Mobile
NVIDIA GeForce RTX 3050 Ti Laptop GPU
...
max:
...
NVIDIA GeForce RTX 3050 Ti Laptop GPU
NVIDIA GeForce RTX 2070 Super Max-Q
...
max:
...
NVIDIA GeForce RTX 3050 Ti Laptop GPU
NVIDIA GeForce RTX 2070 Super Max-Q
NVIDIA GeForce RTX 2070 Super Mobile
...
max:
...
NVIDIA GeForce RTX 3050 Ti Laptop GPU
NVIDIA GeForce GTX 1070 Mobile
NVIDIA GeForce RTX 2070 Super Max-Q
...
max:
...
NVIDIA GeForce GTX 1050 Ti Mobile
NVIDIA GeForce RTX 3050 Ti Laptop GPU
NVIDIA GeForce GTX 1070 Mobile
...
max:
NVIDIA GeForce GTX 1050 Ti Mobile
NVIDIA GeForce RTX 3050 Ti Laptop GPU
NVIDIA GeForce GTX 1070 Mobile
...
max:
» Jouable avec tous les ordinateurs portables testés avec les détails paramétrés sur Ultra.
...
NVIDIA GeForce RTX 3050 Ti Laptop GPU
AMD Radeon 660M
AMD Radeon RX 560X (Laptop)
...
max:
...
NVIDIA GeForce RTX 3050 Ti Laptop GPU
NVIDIA GeForce GTX 1070 Mobile
NVIDIA GeForce RTX 2070 Super Max-Q
...
max:
...
NVIDIA GeForce RTX 3050 Ti Laptop GPU
NVIDIA GeForce GTX 1070 Mobile
NVIDIA GeForce RTX 2070 Super Max-Q
...
max:
...
NVIDIA GeForce RTX 3050 Ti Laptop GPU
NVIDIA GeForce GTX 1070 Mobile
NVIDIA GeForce RTX 2070 Super Max-Q
...
max:
...
NVIDIA GeForce GTX 1070 Mobile
NVIDIA GeForce RTX 3050 Ti Laptop GPU
NVIDIA GeForce RTX 2070 Super Mobile
...
max:
...
NVIDIA GeForce GTX 1070 Mobile
NVIDIA GeForce RTX 3050 Ti Laptop GPU
NVIDIA GeForce RTX 2070 Super Mobile
...
max:
» Jouable avec tous les ordinateurs portables testés avec les détails paramétrés sur Ultra.
0 100 200 Tooltip VivoBook Pro 16: Ø193.6 (147.2-222.7)
Zephyrus G14 GA401QEC: Ø204 (179.073-234.3)
...
NVIDIA GeForce GTX 1070 Mobile
NVIDIA GeForce RTX 3050 Ti Laptop GPU
NVIDIA GeForce RTX 2070 Super Mobile
NVIDIA GeForce RTX 2070 Super Max-Q
...
max:
0 100 200 Tooltip VivoBook Pro 16: Ø126.7 (86.302-208.3)
Zephyrus G14 GA401QEC: Ø123.3 (103.7-135.56)
Intel UHD Graphics Xe 16EUs (Tiger Lake-H)
...
NVIDIA GeForce RTX 3050 Ti Laptop GPU
NVIDIA GeForce GTX 1070 Mobile
NVIDIA GeForce RTX 2070 Super Max-Q
...
max:
0 100 Tooltip Zephyrus G14 GA401QEC: Ø118.3 (82.89-157.5)
Intel Iris Plus Graphics G7 (Ice Lake 64 EU)
...
NVIDIA GeForce RTX 3050 Ti Laptop GPU
NVIDIA GeForce RTX 2070 Super Max-Q
AMD Radeon 680M
...
max:
0 100 Tooltip Zephyrus G14 GA401QEC: Ø115.5 (83.29-146)
AMD Radeon RX Vega 8 (Ryzen 2000/3000)
...
AMD Radeon RX Vega 7
AMD Radeon Pro 560X
NVIDIA GeForce RTX 3050 Ti Laptop GPU
NVIDIA GeForce RTX 2070 Super Max-Q
...
max:
0 100 Tooltip Zephyrus G14 GA401QEC: Ø83.2 (65.349-102.5)
NVIDIA GeForce GTX 1070 Mobile
NVIDIA GeForce RTX 3050 Ti Laptop GPU
NVIDIA GeForce RTX 2070 Super Max-Q
...
max:
» Jouable avec tous les ordinateurs portables testés avec les détails paramétrés sur Ultra.
0 100 Tooltip : Ø92.8 (80.088-133.2)
XMG Focus 17: Ø89 (77.55-104.52)
XMG Focus 15: Ø95.8 (88.013-122.8)
...
NVIDIA GeForce RTX 3050 Ti Laptop GPU
NVIDIA GeForce GTX 1070 Mobile
NVIDIA GeForce RTX 2070 Super Max-Q
...
0 100 200 Tooltip : Ø84.9 (69.27-249)
XMG Focus 17: Ø80.5 (73.045-93.23)
XMG Focus 15: Ø86.3 (76.261-130.7)
...
NVIDIA GeForce RTX 3050 Ti Laptop GPU
NVIDIA GeForce GTX 1070 Mobile
NVIDIA GeForce RTX 2070 Super Max-Q
...
...
NVIDIA GeForce GTX 1050 Ti Mobile
NVIDIA GeForce RTX 3050 Ti Laptop GPU
NVIDIA GeForce GTX 1070 Mobile
NVIDIA GeForce RTX 2070 Super Max-Q
...
max:
NVIDIA GeForce GTX 1050 Max-Q
...
NVIDIA GeForce GTX 1050 Ti Mobile
NVIDIA GeForce GTX 1070 Mobile
NVIDIA GeForce RTX 3050 Ti Laptop GPU
NVIDIA GeForce RTX 2070 Super Max-Q
...
max:
» Jouable avec tous les ordinateurs portables testés avec les détails paramétrés sur Élevé.
AMD Radeon R4 (Stoney Ridge)
...
AMD Radeon RX 5300M
NVIDIA GeForce GTX 1070 Mobile
NVIDIA GeForce RTX 3050 Ti Laptop GPU
NVIDIA GeForce RTX 2070 Super Max-Q
...
max:
...
NVIDIA GeForce GTX 1070 Mobile
NVIDIA GeForce RTX 3050 Ti Laptop GPU
NVIDIA GeForce RTX 2070 Super Max-Q
...
max:
Intel UHD Graphics Xe 32EUs (Tiger Lake-H)
...
AMD Radeon RX 5300M
NVIDIA GeForce GTX 1070 Mobile
NVIDIA GeForce RTX 3050 Ti Laptop GPU
NVIDIA GeForce RTX 2070 Super Max-Q
...
max:
...
NVIDIA GeForce RTX 3050 Ti Laptop GPU
NVIDIA GeForce GTX 1070 Mobile
...
max:
» Jouable avec tous les ordinateurs portables testés avec les détails paramétrés sur Élevé.
...
NVIDIA GeForce GTX 1070 Mobile
NVIDIA GeForce RTX 3050 Ti Laptop GPU
NVIDIA GeForce RTX 2070 Super Max-Q
NVIDIA GeForce RTX 2070 Super Mobile
...
max:
...
NVIDIA GeForce GTX 1070 Mobile
NVIDIA GeForce RTX 3050 Ti Laptop GPU
NVIDIA GeForce RTX 2070 Super Max-Q
...
NVIDIA GeForce RTX 2080 Super Mobile
max:
...
NVIDIA GeForce GTX 1070 Mobile
NVIDIA GeForce RTX 3050 Ti Laptop GPU
NVIDIA GeForce RTX 2070 Super Max-Q
...
max:
...
NVIDIA GeForce GTX 1050 Ti Mobile
NVIDIA GeForce RTX 3050 Ti Laptop GPU
NVIDIA GeForce GTX 1070 Mobile
NVIDIA GeForce RTX 2070 Super Max-Q
...
max:
...
NVIDIA GeForce RTX 3050 Ti Laptop GPU
NVIDIA GeForce GTX 1070 Mobile
NVIDIA GeForce RTX 2070 Super Max-Q
NVIDIA GeForce RTX 2070 Super Mobile
...
max:
» Jouable avec tous les ordinateurs portables testés avec les détails paramétrés sur Ultra.
...
AMD Radeon RX 5300M
NVIDIA GeForce RTX 3050 Ti Laptop GPU
NVIDIA GeForce GTX 1070 Mobile
...
max:
Intel Iris Plus Graphics G7 (Ice Lake 64 EU)
...
AMD Radeon RX 5300M
NVIDIA GeForce RTX 3050 Ti Laptop GPU
NVIDIA GeForce GTX 1070 Mobile
...
max:
...
AMD Radeon RX 5300M
NVIDIA GeForce RTX 3050 Ti Laptop GPU
NVIDIA GeForce GTX 1070 Mobile
...
max:
0 100 200 300 400 500 600 700 800 Tooltip
...
NVIDIA GeForce GTX 1070 Mobile
NVIDIA GeForce RTX 3050 Ti Laptop GPU
NVIDIA GeForce RTX 2070 Super Max-Q
...
max:
NVIDIA Titan RTX
NVIDIA GeForce GTX 1050 Ti Mobile
...
NVIDIA GeForce GTX 1050 Max-Q
NVIDIA GeForce RTX 3050 Ti Laptop GPU
NVIDIA GeForce GTX 1070 Mobile
NVIDIA GeForce RTX 2070 Super Max-Q
...
max:
NVIDIA Titan RTX
» Jouable avec tous les ordinateurs portables testés avec les détails paramétrés sur Ultra.
...
NVIDIA GeForce GTX 1070 Mobile
NVIDIA GeForce RTX 3050 Ti Laptop GPU
NVIDIA GeForce RTX 2070 Super Max-Q
NVIDIA GeForce RTX 2070 Super Mobile
NVIDIA GeForce RTX 2080 Super Mobile
...
max:
NVIDIA Titan X Pascal
...
NVIDIA GeForce RTX 3050 Ti Laptop GPU
NVIDIA GeForce GTX 1070 Mobile
NVIDIA GeForce RTX 2070 Super Max-Q
...
max:
NVIDIA Titan RTX
...
NVIDIA GeForce RTX 3050 Ti Laptop GPU
NVIDIA GeForce GTX 1070 Mobile
NVIDIA GeForce RTX 2070 Super Max-Q
...
max:
NVIDIA Titan RTX
NVIDIA GeForce GTX 1050 Max-Q
NVIDIA GeForce GTX 1050 Ti Mobile
NVIDIA GeForce RTX 3050 Ti Laptop GPU
NVIDIA GeForce GTX 1070 Mobile
...
max:
NVIDIA Titan RTX
NVIDIA GeForce GTX 1050 Max-Q
NVIDIA GeForce GTX 1050 Ti Mobile
NVIDIA GeForce RTX 3050 Ti Laptop GPU
NVIDIA GeForce GTX 1070 Mobile
...
max:
» Jouable avec tous les ordinateurs portables testés avec les détails paramétrés sur Ultra.
...
AMD Radeon RX 5300M
NVIDIA GeForce GTX 1070 Mobile
NVIDIA GeForce RTX 3050 Ti Laptop GPU
...
max:
...
NVIDIA GeForce GTX 1070 Mobile
NVIDIA GeForce RTX 3050 Ti Laptop GPU
...
max:
Intel UHD Graphics Xe 16EUs (Tiger Lake-H)
...
Apple M1 Max 32-Core GPU
NVIDIA GeForce RTX 3050 Ti Laptop GPU
NVIDIA GeForce GTX 1070 Mobile
...
max:
Intel Iris Plus Graphics G4 (Ice Lake 48 EU)
...
Apple M1 Max 24-Core GPU
Apple M1 Max 32-Core GPU
NVIDIA GeForce RTX 3050 Ti Laptop GPU
NVIDIA GeForce GTX 1070 Mobile
...
max:
...
Apple M1 Max 32-Core GPU
NVIDIA GeForce RTX 3050 Ti Laptop GPU
NVIDIA GeForce GTX 1070 Mobile
NVIDIA GeForce RTX 2070 Super Max-Q
...
max:
NVIDIA GeForce GTX 1050 Ti Mobile
...
AMD Radeon 680M
NVIDIA GeForce RTX 3050 Ti Laptop GPU
NVIDIA GeForce GTX 1070 Mobile
Apple M1 Max 32-Core GPU
NVIDIA GeForce RTX 2070 Super Max-Q
...
max:
» Jouable avec tous les ordinateurs portables testés avec les détails paramétrés sur Ultra.
...
NVIDIA GeForce RTX 3050 Ti Laptop GPU
NVIDIA GeForce GTX 1070 Mobile
NVIDIA GeForce RTX 2070 Super Max-Q
...
max:
...
NVIDIA GeForce GTX 1070 Mobile
NVIDIA GeForce RTX 3050 Ti Laptop GPU
NVIDIA GeForce RTX 2070 Super Max-Q
...
max:
...
NVIDIA GeForce GTX 1070 Mobile
NVIDIA GeForce RTX 3050 Ti Laptop GPU
NVIDIA GeForce RTX 2070 Super Max-Q
...
max:
NVIDIA GeForce GTX 1050 Ti Mobile
...
AMD Radeon 680M
NVIDIA GeForce GTX 1070 Mobile
NVIDIA GeForce RTX 3050 Ti Laptop GPU
NVIDIA GeForce RTX 2070 Super Max-Q
...
max:
» Jouable avec tous les ordinateurs portables testés avec les détails paramétrés sur Élevé.
Additional Benchmarks
High Quality Preset & High Ray Tracing Preset (DX12) 1920x1080
35.7 [X] XMG Prototyp AMD Ryzen 5 5600H 3.3GHz
GeForce RTX 3050 Ti Laptop GPU
min:
11 fps
...
Apple M3 10-Core GPU
Apple M1 Pro 14-Core GPU
NVIDIA GeForce RTX 3050 Ti Laptop GPU
Apple M1 Max 24-Core GPU
...
max:
...
Apple M1 Pro 16-Core GPU
NVIDIA GeForce RTX 3050 Ti Laptop GPU
Apple M1 Max 24-Core GPU
...
max:
...
Apple M1 Pro 16-Core GPU
NVIDIA GeForce RTX 3050 Ti Laptop GPU
Apple M1 Max 24-Core GPU
...
max:
...
Apple M1 Pro 14-Core GPU
Apple M1 Pro 16-Core GPU
NVIDIA GeForce RTX 3050 Ti Laptop GPU
Apple M1 Max 24-Core GPU
...
max:
» Jouable avec tous les ordinateurs portables testés avec les détails paramétrés sur Ultra.
0 100 200 300 400 500 600 700 800 900 1000 1100 1200 Tooltip
...
NVIDIA GeForce GTX 1070 Mobile
NVIDIA GeForce RTX 3050 Ti Laptop GPU
NVIDIA GeForce RTX 2070 Super Max-Q
NVIDIA GeForce RTX 2070 Super Mobile
...
max:
...
NVIDIA GeForce GTX 1070 Mobile
NVIDIA GeForce RTX 3050 Ti Laptop GPU
...
max:
...
NVIDIA GeForce GTX 1070 Mobile
NVIDIA GeForce RTX 3050 Ti Laptop GPU
...
max:
...
NVIDIA GeForce GTX 1050 Max-Q
NVIDIA GeForce GTX 1050 Ti Mobile
NVIDIA GeForce RTX 3050 Ti Laptop GPU
NVIDIA GeForce GTX 1070 Mobile
NVIDIA GeForce RTX 2070 Super Max-Q
...
max:
...
NVIDIA GeForce GTX 1050 Ti Mobile
NVIDIA GeForce GTX 1050 Max-Q
NVIDIA GeForce RTX 3050 Ti Laptop GPU
NVIDIA GeForce GTX 1070 Mobile
NVIDIA GeForce RTX 2070 Super Max-Q
...
max:
» Jouable avec tous les ordinateurs portables testés avec les détails paramétrés sur Ultra.
...
AMD Radeon RX 5300M
NVIDIA GeForce RTX 3050 Ti Laptop GPU
NVIDIA GeForce GTX 1070 Mobile
...
max:
...
AMD Radeon RX 5300M
NVIDIA GeForce RTX 3050 Ti Laptop GPU
NVIDIA GeForce GTX 1070 Mobile
...
max:
...
NVIDIA GeForce RTX 3050 Ti Laptop GPU
NVIDIA GeForce GTX 1070 Mobile
...
max:
...
NVIDIA GeForce RTX 3050 Ti Laptop GPU
NVIDIA GeForce GTX 1070 Mobile
NVIDIA GeForce RTX 2070 Super Max-Q
...
max:
...
NVIDIA GeForce RTX 3050 Ti Laptop GPU
NVIDIA GeForce GTX 1070 Mobile
NVIDIA GeForce RTX 2070 Super Max-Q
...
max:
» Jouable avec tous les ordinateurs portables testés avec les détails paramétrés sur Ultra.
...
NVIDIA GeForce GTX 1050 Ti Mobile
NVIDIA GeForce GTX 1050 Ti Max-Q
AMD Radeon RX 5300M
NVIDIA GeForce GTX 1070 Mobile
NVIDIA GeForce RTX 3050 Ti Laptop GPU
...
max:
...
AMD Radeon RX 5300M
NVIDIA GeForce GTX 1070 Mobile
NVIDIA GeForce RTX 3050 Ti Laptop GPU
...
max:
...
NVIDIA GeForce GTX 1070 Mobile
NVIDIA GeForce RTX 3050 Ti Laptop GPU
...
max:
Intel UHD Graphics Xe 16EUs (Tiger Lake-H)
...
NVIDIA GeForce GTX 1070 Mobile
NVIDIA GeForce RTX 3050 Ti Laptop GPU
...
max:
...
NVIDIA GeForce GTX 1050 Ti Max-Q
NVIDIA GeForce RTX 3050 Ti Laptop GPU
NVIDIA GeForce GTX 1070 Mobile
NVIDIA GeForce RTX 2070 Super Max-Q
...
max:
...
NVIDIA GeForce GTX 1050 Ti Mobile
NVIDIA GeForce GTX 1050 Ti Max-Q
NVIDIA GeForce RTX 3050 Ti Laptop GPU
NVIDIA GeForce GTX 1070 Mobile
...
max:
» Jouable avec tous les ordinateurs portables testés avec les détails paramétrés sur Ultra.
...
AMD Radeon RX 5300M
NVIDIA GeForce GTX 1070 Mobile
NVIDIA GeForce RTX 3050 Ti Laptop GPU
...
max:
...
NVIDIA GeForce RTX 3050 Ti Laptop GPU
NVIDIA GeForce GTX 1070 Mobile
NVIDIA GeForce RTX 2070 Super Max-Q
...
max:
...
NVIDIA GeForce RTX 3050 Ti Laptop GPU
NVIDIA GeForce GTX 1070 Mobile
...
max:
AMD Radeon RX Vega 8 (Ryzen 2000/3000)
...
NVIDIA GeForce RTX 3050 Ti Laptop GPU
NVIDIA GeForce GTX 1070 Mobile
...
max:
...
NVIDIA GeForce RTX 3050 Ti Laptop GPU
NVIDIA GeForce GTX 1070 Mobile
NVIDIA GeForce RTX 2070 Super Max-Q
...
max:
AMD Radeon Pro W6800
NVIDIA GeForce GTX 1050 Ti Max-Q
...
NVIDIA GeForce RTX 3050 Ti Laptop GPU
NVIDIA GeForce GTX 1070 Mobile
NVIDIA GeForce RTX 2070 Super Max-Q
...
max:
» Jouable avec tous les ordinateurs portables testés avec les détails paramétrés sur Ultra.
Additional Benchmarks
Ultra Quality DXR 16xAF 1920x1080
36.8 [X] XMG Prototyp AMD Ryzen 5 5600H 3.3GHz
GeForce RTX 3050 Ti Laptop GPU
min:
22 fps
0 100 Tooltip : Ø144.5 (138.123-152.83)
...
NVIDIA GeForce RTX 3050 Ti Laptop GPU
NVIDIA GeForce RTX 2070 Super Mobile
NVIDIA GeForce RTX 2070 Super Max-Q
NVIDIA GeForce RTX 2080 Super Mobile
...
NVIDIA GeForce GTX 1070 Mobile
NVIDIA GeForce RTX 3050 Ti Laptop GPU
NVIDIA GeForce RTX 2070 Super Max-Q
NVIDIA GeForce RTX 2070 Super Mobile
...
0 100 Tooltip : Ø110.9 (104.045-121.76)
...
NVIDIA GeForce GTX 1070 Mobile
NVIDIA GeForce RTX 3050 Ti Laptop GPU
NVIDIA GeForce RTX 2070 Super Max-Q
...
...
NVIDIA GeForce GTX 1070 Mobile
NVIDIA GeForce RTX 3050 Ti Laptop GPU
NVIDIA GeForce RTX 2070 Super Max-Q
NVIDIA GeForce RTX 2070 Super Mobile
...
max:
...
NVIDIA GeForce GTX 1070 Mobile
NVIDIA GeForce RTX 3050 Ti Laptop GPU
NVIDIA GeForce RTX 2070 Super Max-Q
NVIDIA GeForce RTX 2070 Super Mobile
NVIDIA GeForce RTX 2080 Super Mobile
...
max:
» Jouable avec tous les ordinateurs portables testés avec les détails paramétrés sur Ultra.
...
AMD Radeon RX 5300M
NVIDIA GeForce RTX 3050 Ti Laptop GPU
NVIDIA GeForce GTX 1070 Mobile
...
NVIDIA GeForce RTX 2080 Super Mobile
max:
...
AMD Radeon RX 5300M
NVIDIA GeForce RTX 3050 Ti Laptop GPU
NVIDIA GeForce GTX 1070 Mobile
...
max:
...
AMD Radeon RX 5300M
NVIDIA GeForce RTX 3050 Ti Laptop GPU
NVIDIA GeForce GTX 1070 Mobile
...
max:
...
NVIDIA GeForce RTX 3050 Ti Laptop GPU
NVIDIA GeForce GTX 1070 Mobile
...
max:
...
NVIDIA GeForce RTX 3050 Ti Laptop GPU
NVIDIA GeForce GTX 1070 Mobile
...
max:
» Jouable avec tous les ordinateurs portables testés avec les détails paramétrés sur Ultra.
Additional Benchmarks
Ultra Preset DXR 1920x1080
39.8 [X] XMG Prototyp AMD Ryzen 5 5600H 3.3GHz
GeForce RTX 3050 Ti Laptop GPU
min:
6.26 fps, P0.1:
11 fps, P1:
18.7 fps, max:
153 fps
...
Apple M3 10-Core GPU
NVIDIA GeForce RTX 3050 Ti Laptop GPU
NVIDIA GeForce GTX 1070 Mobile
AMD Radeon RX 5300M
...
max:
...
Apple M1 Max 24-Core GPU
NVIDIA GeForce GTX 1070 Mobile
NVIDIA GeForce RTX 3050 Ti Laptop GPU
Apple M1 Max 32-Core GPU
...
max:
...
NVIDIA GeForce RTX 3050 Ti Laptop GPU
Apple M1 Max 24-Core GPU
NVIDIA GeForce GTX 1070 Mobile
...
max:
...
NVIDIA GeForce RTX 3050 Ti Laptop GPU
NVIDIA GeForce GTX 1070 Mobile
Apple M1 Max 24-Core GPU
...
max:
...
NVIDIA GeForce RTX 3050 Ti Laptop GPU
NVIDIA GeForce GTX 1070 Mobile
...
max:
AMD Radeon RX Vega 8 (Ryzen 2000/3000)
...
NVIDIA GeForce RTX 3050 Ti Laptop GPU
NVIDIA GeForce GTX 1070 Mobile
...
max:
» Jouable avec tous les ordinateurs portables testés avec les détails paramétrés sur Ultra.
Additional Benchmarks
Lowest Preset 1920x1080
103.3 [X] MSI Prestige 15 A12UD-093 1.47.22.14 D3D12
Intel Core i7-1280P 1.3GHz
GeForce RTX 3050 Ti Laptop GPU
min:
13.9 fps, P1:
50.2 fps, max:
213 fps
183.7 [X] Dell G15 5510-43NHT 1.47.22.14 D3D12
Intel Core i5-10200H 2.4GHz
GeForce RTX 3050 Ti Laptop GPU
min:
37.7 fps, P1:
125.4 fps, max:
340 fps
206 208 213 226 227 232 [X] SCHENKER Vision 14 1.47.22.14 D3D12
Intel Core i7-11370H 3.3GHz
GeForce RTX 3050 Ti Laptop GPU
min:
80.1 fps, P1:
181 fps, max:
387 fps
232 [X] Asus ROG Flow Z13 GZ301ZE 1.47.22.14 D3D12
Intel Core i9-12900H 1.8GHz
GeForce RTX 3050 Ti Laptop GPU
min:
79.2 fps, P1:
180 fps, max:
416 fps
241 [X] Asus VivoBook Pro 16 1.47.22.14 D3D12
Intel Core i7-12700H 1.7GHz
GeForce RTX 3050 Ti Laptop GPU
min:
138.2 fps, P1:
195.7 fps, max:
394 fps
245 245 [X] Dell G15 5515 1.47.22.14 D3D12
AMD Ryzen 7 5800H 3.2GHz
GeForce RTX 3050 Ti Laptop GPU
min:
111 fps, P1:
178 fps, max:
420 fps
256 259 259 270 281 289 297 [X] HP Victus 15 fa0020nr 1.47.22.14 D3D12
Intel Core i7-12700H 1.7GHz
GeForce RTX 3050 Ti Laptop GPU
min:
67 fps, P1:
220 fps, max:
466 fps
307 [X] Dell Inspiron 16 Plus 7620 1.47.22.14 D3D12
Intel Core i7-12700H 1.7GHz
GeForce RTX 3050 Ti Laptop GPU
min:
191.1 fps, P1:
230 fps, max:
486 fps
~ 239 fps
+ Comparer
- Cacher la comparaison
...
NVIDIA GeForce RTX 3050 Ti Laptop GPU
...
NVIDIA GeForce RTX 2080 Super Mobile
max:
53 [X] MSI Prestige 15 A12UD-093 1.47.22.14 D3D12
Intel Core i7-1280P 1.3GHz
GeForce RTX 3050 Ti Laptop GPU
min:
10.1 fps, P1:
27.3 fps, max:
301 fps
100 [X] Asus ROG Flow Z13 GZ301ZE 1.47.22.14 D3D12
Intel Core i9-12900H 1.8GHz
GeForce RTX 3050 Ti Laptop GPU
min:
77.1 fps, P1:
83.9 fps, max:
171 fps
109.6 110 [X] SCHENKER Vision 14 1.47.22.14 D3D12
Intel Core i7-11370H 3.3GHz
GeForce RTX 3050 Ti Laptop GPU
min:
45.7 fps, P1:
91.5 fps, max:
194 fps
114.8 115.9 [X] Dell G15 5510-43NHT 1.47.22.14 D3D12
Intel Core i5-10200H 2.4GHz
GeForce RTX 3050 Ti Laptop GPU
min:
48.3 fps, P1:
65 fps, max:
288 fps
117 118 119 121.2 [X] Asus VivoBook Pro 16 1.47.22.14 D3D12
Intel Core i7-12700H 1.7GHz
GeForce RTX 3050 Ti Laptop GPU
min:
46.3 fps, P1:
101.9 fps, max:
271 fps
126.9 126.9 128 129 129 132.8 133 134 138 [X] SCHENKER XMG Focus 15 1.47.22.14 D3D12
Intel Core i7-11800H 2.3GHz
GeForce RTX 3050 Ti Laptop GPU
min:
109 fps, P1:
112 fps, max:
213 fps
138 [X] Dell G15 5515 1.47.22.14 D3D12
AMD Ryzen 7 5800H 3.2GHz
GeForce RTX 3050 Ti Laptop GPU
min:
98.7 fps, P1:
112 fps, max:
203 fps
138.3 [X] Dell Inspiron 16 Plus 7620 1.47.22.14 D3D12
Intel Core i7-12700H 1.7GHz
GeForce RTX 3050 Ti Laptop GPU
min:
84.4 fps, P1:
116.2 fps, max:
231 fps
138.8 [X] HP Victus 15 fa0020nr 1.47.22.14 D3D12
Intel Core i7-12700H 1.7GHz
GeForce RTX 3050 Ti Laptop GPU
min:
35.4 fps, P1:
114.6 fps, max:
233 fps
139 [X] SCHENKER XMG Focus 17 1.47.22.14 D3D12
Intel Core i7-11800H 2.3GHz
GeForce RTX 3050 Ti Laptop GPU
min:
107 fps, P1:
112 fps, max:
258 fps
140.1 [X] HP Victus 16-e0145ng 1.47.22.14 D3D12
AMD Ryzen 5 5600H 3.3GHz
GeForce RTX 3050 Ti Laptop GPU
min:
98.8 fps, P1:
116.4 fps, max:
218 fps
145.5 ~ 124 fps
+ Comparer
- Cacher la comparaison
...
NVIDIA GeForce RTX 3050 Ti Laptop GPU
...
max:
79.2 [X] Asus ROG Flow Z13 GZ301ZE 1.47.22.14 D3D12
Intel Core i9-12900H 1.8GHz
GeForce RTX 3050 Ti Laptop GPU
min:
58.1 fps, P1:
59.6 fps, max:
118 fps
89.4 [X] SCHENKER Vision 14 1.47.22.14 D3D12
Intel Core i7-11370H 3.3GHz
GeForce RTX 3050 Ti Laptop GPU
min:
64.6 fps, P1:
67.3 fps, max:
160 fps
91.1 94 95.1 [X] Dell G15 5510-43NHT 1.47.22.14 D3D12
Intel Core i5-10200H 2.4GHz
GeForce RTX 3050 Ti Laptop GPU
min:
31.7 fps, P1:
54.5 fps, max:
254 fps
95.2 96.2 98.3 [X] Asus VivoBook Pro 16 1.47.22.14 D3D12
Intel Core i7-12700H 1.7GHz
GeForce RTX 3050 Ti Laptop GPU
min:
38.6 fps, P1:
75 fps, max:
266 fps
100.8 102.1 103 104.9 105.8 106 110.2 [X] Dell Inspiron 16 Plus 7620 1.47.22.14 D3D12
Intel Core i7-12700H 1.7GHz
GeForce RTX 3050 Ti Laptop GPU
min:
76.2 fps, P1:
84.7 fps, max:
164.6 fps
111 [X] SCHENKER XMG Focus 17 1.47.22.14 D3D12
Intel Core i7-11800H 2.3GHz
GeForce RTX 3050 Ti Laptop GPU
min:
80.8 fps, P1:
82.6 fps, max:
175 fps
112 [X] SCHENKER XMG Focus 15 1.47.22.14 D3D12
Intel Core i7-11800H 2.3GHz
GeForce RTX 3050 Ti Laptop GPU
min:
81.6 fps, P1:
82.7 fps, max:
177 fps
112 112 [X] Dell G15 5515 1.47.22.14 D3D12
AMD Ryzen 7 5800H 3.2GHz
GeForce RTX 3050 Ti Laptop GPU
min:
80.5 fps, P1:
83 fps, max:
181 fps
112.2 [X] HP Victus 15 fa0020nr 1.47.22.14 D3D12
Intel Core i7-12700H 1.7GHz
GeForce RTX 3050 Ti Laptop GPU
min:
38.3 fps, P1:
86.1 fps, max:
193.6 fps
114 114.5 [X] HP Victus 16-e0145ng 1.47.22.14 D3D12
AMD Ryzen 5 5600H 3.3GHz
GeForce RTX 3050 Ti Laptop GPU
min:
84.3 fps, P1:
86.6 fps, max:
188.2 fps
117.3 ~ 103 fps
+ Comparer
- Cacher la comparaison
...
NVIDIA GeForce RTX 3050 Ti Laptop GPU
...
max:
34.8 [X] MSI Prestige 15 A12UD-093 1.47.22.14 D3D12
Intel Core i7-1280P 1.3GHz
GeForce RTX 3050 Ti Laptop GPU
min:
17.1 fps, P1:
26.1 fps, max:
79.5 fps
68 [X] Asus ROG Flow Z13 GZ301ZE 1.47.22.14 D3D12
Intel Core i9-12900H 1.8GHz
GeForce RTX 3050 Ti Laptop GPU
min:
49.8 fps, P1:
52.8 fps, max:
101 fps
76.7 [X] SCHENKER Vision 14 1.47.22.14 D3D12
Intel Core i7-11370H 3.3GHz
GeForce RTX 3050 Ti Laptop GPU
min:
54 fps, P1:
57.9 fps, max:
130 fps
79.4 81.9 82.3 84 84.5 [X] Asus VivoBook Pro 16 1.47.22.14 D3D12
Intel Core i7-12700H 1.7GHz
GeForce RTX 3050 Ti Laptop GPU
min:
48.3 fps, P1:
64.9 fps, max:
231 fps
86 87.5 88.2 89.5 89.7 90 90.3 94.9 [X] Dell G15 5510-43NHT 1.47.22.14 D3D12
Intel Core i5-10200H 2.4GHz
GeForce RTX 3050 Ti Laptop GPU
min:
39.4 fps, P1:
54.7 fps, max:
254 fps
95.2 [X] Dell Inspiron 16 Plus 7620 1.47.22.14 D3D12
Intel Core i7-12700H 1.7GHz
GeForce RTX 3050 Ti Laptop GPU
min:
68.1 fps, P1:
72.5 fps, max:
151.2 fps
96.3 [X] SCHENKER XMG Focus 17 1.47.22.14 D3D12
Intel Core i7-11800H 2.3GHz
GeForce RTX 3050 Ti Laptop GPU
min:
69.8 fps, P1:
75.5 fps, max:
140 fps
96.4 [X] SCHENKER XMG Focus 15 1.47.22.14 D3D12
Intel Core i7-11800H 2.3GHz
GeForce RTX 3050 Ti Laptop GPU
min:
69.9 fps, P1:
75.5 fps, max:
148 fps
97 [X] Dell G15 5515 1.47.22.14 D3D12
AMD Ryzen 7 5800H 3.2GHz
GeForce RTX 3050 Ti Laptop GPU
min:
70.7 fps, P1:
76 fps, max:
145 fps
97.4 [X] HP Victus 15 fa0020nr 1.47.22.14 D3D12
Intel Core i7-12700H 1.7GHz
GeForce RTX 3050 Ti Laptop GPU
min:
34.3 fps, P1:
73.6 fps, max:
233 fps
97.5 98.9 [X] HP Victus 16-e0145ng 1.47.22.14 D3D12
AMD Ryzen 5 5600H 3.3GHz
GeForce RTX 3050 Ti Laptop GPU
min:
72.6 fps, P1:
78.6 fps, max:
158.3 fps
100 101.3 ~ 88 fps
+ Comparer
- Cacher la comparaison
...
NVIDIA GeForce RTX 3050 Ti Laptop GPU
...
max:
...
NVIDIA GeForce RTX 3050 Ti Laptop GPU
...
max:
...
AMD Radeon 680M
NVIDIA GeForce RTX 3050 Ti Laptop GPU
...
max:
» Jouable avec la plupart des ordinateurs portables testés avec les détails paramétrés sur Ultra.
0 100 Tooltip Prestige 15 A12UD-093: Ø56.5 (40-74)
Vivobook Pro 16X-M7600QE: Ø105.1 (57-127)
G15 5515: Ø124.6 (86-158)
ThinkBook 15p G2 ITH 21B1000YGE: Ø139.3 (106-181)
...
NVIDIA GeForce RTX 3050 Ti Laptop GPU
NVIDIA GeForce GTX 1070 Mobile
...
max:
0 100 Tooltip Prestige 15 A12UD-093: Ø44 (34-59)
Vivobook Pro 16X-M7600QE: Ø70.6 (54-86)
ThinkBook 15p G2 ITH 21B1000YGE: Ø90.2 (75-106)
G15 5515: Ø98.2 (86-111)
...
NVIDIA GeForce RTX 3050 Ti Laptop GPU
NVIDIA GeForce GTX 1070 Mobile
...
max:
0 100 Tooltip Prestige 15 A12UD-093: Ø36.4 (25-54)
Vivobook Pro 16X-M7600QE: Ø64.7 (49-81)
ThinkBook 15p G2 ITH 21B1000YGE: Ø84.7 (72-99)
G15 5515: Ø91.9 (82-107)
...
NVIDIA GeForce RTX 3050 Ti Laptop GPU
...
max:
0 Tooltip Prestige 15 A12UD-093: Ø30 (23-44)
Vivobook Pro 16X-M7600QE: Ø62.1 (50-73)
ThinkBook 15p G2 ITH 21B1000YGE: Ø79.3 (71-91)
G15 5515: Ø86.5 (75-100)
...
NVIDIA GeForce RTX 3050 Ti Laptop GPU
...
max:
0 Tooltip Prestige 15 A12UD-093: Ø18.9 (16-23)
ThinkBook 15p G2 ITH 21B1000YGE: Ø54.6 (49-64)
...
NVIDIA GeForce RTX 3050 Ti Laptop GPU
NVIDIA GeForce GTX 1070 Mobile
...
max:
0 Tooltip Prestige 15 A12UD-093: Ø13.2 (10-19)
ThinkBook 15p G2 ITH 21B1000YGE: Ø25.9 (22-30)
...
NVIDIA GeForce GTX 1050 Ti Max-Q
NVIDIA GeForce RTX 3050 Ti Laptop GPU
NVIDIA GeForce GTX 1070 Mobile
...
max:
» Jouable avec la plupart des ordinateurs portables testés avec les détails paramétrés sur Ultra.
Additional Benchmarks
Low Preset TAA 1920x1080
109 [X] Dell G15 5515 AMD Ryzen 7 5800H 3.2GHz
GeForce RTX 3050 Ti Laptop GPU
min:
89 fps, max:
124 fps
...
NVIDIA Quadro P620
NVIDIA GeForce RTX 3050 Ti Laptop GPU
NVIDIA GeForce RTX 2070 Super Mobile
...
max:
...
NVIDIA GeForce RTX 3050 Ti Laptop GPU
NVIDIA GeForce RTX 2070 Super Mobile
...
max:
...
NVIDIA GeForce RTX 3050 Ti Laptop GPU
...
max:
...
NVIDIA GeForce RTX 3050 Ti Laptop GPU
...
max:
» Jouable avec tous les ordinateurs portables testés avec les détails paramétrés sur Élevé.
...
AMD Radeon RX 5300M
NVIDIA GeForce RTX 3050 Ti Laptop GPU
...
max:
...
NVIDIA GeForce RTX 3050 Ti Laptop GPU
NVIDIA GeForce GTX 1070 Mobile
...
max:
...
NVIDIA GeForce RTX 3050 Ti Laptop GPU
NVIDIA GeForce GTX 1070 Mobile
...
max:
...
NVIDIA GeForce RTX 3050 Ti Laptop GPU
...
max:
...
NVIDIA GeForce RTX 3050 Ti Laptop GPU
NVIDIA GeForce GTX 1070 Mobile
...
max:
» Jouable avec la plupart des ordinateurs portables testés avec les détails paramétrés sur Élevé.
...
NVIDIA GeForce RTX 3050 Ti Laptop GPU
NVIDIA GeForce GTX 1050 Max-Q
...
max:
...
NVIDIA GeForce RTX 3050 Ti Laptop GPU
NVIDIA GeForce GTX 1050 Max-Q
...
max:
NVIDIA GeForce RTX 3070 Ti
...
NVIDIA GeForce RTX 3050 Ti Laptop GPU
...
max:
...
NVIDIA GeForce RTX 3050 Ti Laptop GPU
...
max:
NVIDIA GeForce RTX 3070 Ti
...
NVIDIA GeForce GTX 1050 Ti Max-Q
NVIDIA GeForce RTX 3050 Ti Laptop GPU
...
NVIDIA GeForce RTX 2080 Super Mobile
max:
» Jouable avec tous les ordinateurs portables testés avec les détails paramétrés sur Ultra.
0 100 200 300 400 Tooltip Summit E16 Flip A12UDT-031: Ø190.8 (149.116-317.2)
G15 5515: Ø254 (232.43-280.2)
Zephyrus G14 GA401QEC: Ø259 (236.567-415)
...
NVIDIA GeForce RTX 3050 Ti Laptop GPU
NVIDIA GeForce GTX 1070 Mobile
...
max:
0 100 Tooltip Summit E16 Flip A12UDT-031: Ø111.4 (102.214-126.9)
G15 5515: Ø164 (146.098-189.003)
...
NVIDIA GeForce RTX 3050 Ti Laptop GPU
NVIDIA GeForce GTX 1070 Mobile
...
max:
0 100 Tooltip Summit E16 Flip A12UDT-031: Ø64.9 (56.066-73.56)
Zephyrus G14 GA401QEC: Ø105 (93.75-188.9)
G15 5515: Ø104.6 (88.335-116.77)
...
NVIDIA GeForce RTX 3050 Ti Laptop GPU
NVIDIA GeForce GTX 1070 Mobile
...
max:
0 Tooltip Prestige 15 A12UD-093: Ø22.3 (17-25)
XPS 15 9520 RTX 3050 Ti: Ø45.5 (39-49)
XPS 15 9510 11800H RTX 3050 Ti OLED BIOS 1.4 Ultra Performance: Ø34.3 (30-42)
XPS 15 9510 11800H RTX 3050 Ti OLED BIOS 1.4 Ultra Performance: Ø36.2 (31-46)
XPS 15 9510 11800H RTX 3050 Ti OLED BIOS 1.4 Ultra Performance: Ø37.1 (33-46)
XPS 15 9510 11800H RTX 3050 Ti OLED BIOS 1.4 Ultra Performance: Ø43.7 (32-48)
ROG Flow Z13 GZ301ZE: Ø37.1 (34-40)
Vision 14: Ø41.4 (39-43)
Surface Laptop Studio i7 RTX 3050 Ti: Ø41.6 (39-44)
Vision 14 2022 RTX 3050 Ti: Ø44.2 (42-48)
Summit E16 Flip A12UDT-031: Ø51.2 (46-55)
Ideapad Gaming 3 15IHU-82K1002RGE: Ø47.1 (45-49)
VivoBook Pro 16: Ø48.1 (43-51)
Zenbook Pro 15 OLED UM535Q: Ø46.8 (44-50)
ThinkPad X1 Extreme G4-20Y5CTO1WW (3050 Ti): Ø47.3 (45-50)
Pavilion Gaming 17-cd2146ng: Ø51.2 (49-53)
ThinkBook 15p G2 ITH 21B1000YGE: Ø38.9 (36-42)
Zephyrus G14 GA401QEC: Ø52.9 (51-55)
G15 5510-43NHT: Ø54.4 (44-58)
Victus 15 fa0020nr: Ø52.9 (49-56)
Victus 16-e0145ng: Ø55.4 (52-57)
XMG Focus 15: Ø54.7 (51-57)
XMG Focus 17: Ø55.1 (50-60)
G15 5515: Ø54.9 (50-57)
Inspiron 16 Plus 7620: Ø50.5 (48-54)
ROG Strix G17 G713QE-RB74: Ø54.4 (18-58)
IdeaPad Gaming 3 15IAH7: Ø59.4 (56-62)
...
NVIDIA GeForce RTX 3050 Ti Laptop GPU
...
max:
...
AMD Radeon RX 580 (Laptop)
NVIDIA GeForce RTX 3050 Ti Laptop GPU
...
max:
» Jouable avec la plupart des ordinateurs portables testés avec les détails paramétrés sur Ultra.
Additional Benchmarks
Medium Graphics & Postprocessing 1920x1080
102.7 134 144 163 [X] SCHENKER Vision 14 Intel Core i7-11370H 3.3GHz
GeForce RTX 3050 Ti Laptop GPU
min:
5.05 fps, P1:
90.9 fps, max:
352 fps
170 170.6 172 172.8 174 [X] Dell G15 5515 AMD Ryzen 7 5800H 3.2GHz
GeForce RTX 3050 Ti Laptop GPU
min:
4.18 fps, P1:
125 fps, max:
264 fps
175 175 175.1 [X] Asus VivoBook Pro 16 Intel Core i7-12700H 1.7GHz
GeForce RTX 3050 Ti Laptop GPU
min:
3.22 fps, P1:
125 fps, max:
370 fps
176 179 [X] XMG Prototyp AMD Ryzen 5 5600H 3.3GHz
GeForce RTX 3050 Ti Laptop GPU
min:
3.34 fps, P1:
143 fps, max:
277 fps
179 179.5 [X] HP Victus 15 fa0020nr Intel Core i7-12700H 1.7GHz
GeForce RTX 3050 Ti Laptop GPU
min:
4.1 fps, P1:
125 fps, max:
322 fps
179.7 180 181 181.7 185 ~ 169 fps
+ Comparer
- Cacher la comparaison
...
NVIDIA GeForce GTX 1070 Mobile
NVIDIA GeForce RTX 3050 Ti Laptop GPU
...
max:
88.4 118 136 154 [X] SCHENKER Vision 14 Intel Core i7-11370H 3.3GHz
GeForce RTX 3050 Ti Laptop GPU
min:
4.56 fps, P1:
83.3 fps, max:
296 fps
156.1 160.7 163 163.3 164 [X] Dell G15 5515 AMD Ryzen 7 5800H 3.2GHz
GeForce RTX 3050 Ti Laptop GPU
min:
4.78 fps, P1:
100 fps, max:
277 fps
166 167.2 167.7 [X] HP Victus 16-e0145ng AMD Ryzen 5 5600H 3.3GHz
GeForce RTX 3050 Ti Laptop GPU
min:
3.96 fps, P1:
111.1 fps, max:
274 fps
169 169 170.9 [X] Asus VivoBook Pro 16 Intel Core i7-12700H 1.7GHz
GeForce RTX 3050 Ti Laptop GPU
min:
56.3 fps, P1:
111.1 fps, max:
273 fps
172 173 [X] HP Victus 15 fa0020nr Intel Core i7-12700H 1.7GHz
GeForce RTX 3050 Ti Laptop GPU
min:
3.33 fps, P1:
111.1 fps, max:
301 fps
173.8 174 176.1 180 [X] SCHENKER XMG Focus 15 Intel Core i7-11800H 2.3GHz
GeForce RTX 3050 Ti Laptop GPU
min:
2.92 fps, P1:
125 fps, max:
373 fps
180 [X] SCHENKER XMG Focus 17 Intel Core i7-11800H 2.3GHz
GeForce RTX 3050 Ti Laptop GPU
min:
3.06 fps, P1:
143 fps, max:
315 fps
181.3 ~ 162 fps
+ Comparer
- Cacher la comparaison
...
NVIDIA GeForce RTX 3050 Ti Laptop GPU
...
max:
53.8 62.2 85.6 90.3 104 [X] SCHENKER Vision 14 Intel Core i7-11370H 3.3GHz
GeForce RTX 3050 Ti Laptop GPU
min:
8.49 fps, P1:
71.4 fps, max:
198 fps
110 111 111.9 [X] Asus VivoBook Pro 16 Intel Core i7-12700H 1.7GHz
GeForce RTX 3050 Ti Laptop GPU
min:
37.8 fps, P1:
76.9 fps, max:
231 fps
114 114.3 119.9 121 122 123.7 124 125 [X] Dell G15 5515 AMD Ryzen 7 5800H 3.2GHz
GeForce RTX 3050 Ti Laptop GPU
min:
29.7 fps, P1:
90.9 fps, max:
180 fps
129 [X] XMG Prototyp AMD Ryzen 5 5600H 3.3GHz
GeForce RTX 3050 Ti Laptop GPU
min:
43.5 fps, P1:
90.9 fps, max:
196 fps
130 130.6 131 131.4 [X] HP Victus 16-e0145ng AMD Ryzen 5 5600H 3.3GHz
GeForce RTX 3050 Ti Laptop GPU
min:
38.8 fps, P1:
100 fps, max:
203 fps
144.7 [X] HP Victus 15 fa0020nr Intel Core i7-12700H 1.7GHz
GeForce RTX 3050 Ti Laptop GPU
min:
4.22 fps, P1:
90.9 fps, max:
245 fps
147 [X] SCHENKER XMG Focus 15 Intel Core i7-11800H 2.3GHz
GeForce RTX 3050 Ti Laptop GPU
min:
4.88 fps, P1:
100 fps, max:
302 fps
148.7 149 [X] SCHENKER XMG Focus 17 Intel Core i7-11800H 2.3GHz
GeForce RTX 3050 Ti Laptop GPU
min:
4.65 fps, P1:
100 fps, max:
291 fps
~ 117 fps
+ Comparer
- Cacher la comparaison
...
NVIDIA GeForce RTX 3050 Ti Laptop GPU
NVIDIA GeForce GTX 1070 Mobile
...
max:
27.8 39.6 49.9 52.2 [X] SCHENKER Vision 14 Intel Core i7-11370H 3.3GHz
GeForce RTX 3050 Ti Laptop GPU
min:
9.58 fps, P1:
29.4 fps, max:
142 fps
53.8 [X] Asus VivoBook Pro 16 Intel Core i7-12700H 1.7GHz
GeForce RTX 3050 Ti Laptop GPU
min:
30.1 fps, P1:
38.5 fps, max:
98.5 fps
54.9 55 57.1 57.2 63.2 63.9 65.6 66.7 66.9 67.5 69 71.6 71.8 [X] Dell G15 5515 AMD Ryzen 7 5800H 3.2GHz
GeForce RTX 3050 Ti Laptop GPU
min:
21.9 fps, P1:
52.6 fps, max:
119 fps
72.2 72.9 [X] XMG Prototyp AMD Ryzen 5 5600H 3.3GHz
GeForce RTX 3050 Ti Laptop GPU
min:
25.9 fps, P1:
52.6 fps, max:
120 fps
73.1 [X] HP Victus 15 fa0020nr Intel Core i7-12700H 1.7GHz
GeForce RTX 3050 Ti Laptop GPU
min:
6.87 fps, P1:
47.6 fps, max:
123.1 fps
73.5 73.7 [X] HP Victus 16-e0145ng AMD Ryzen 5 5600H 3.3GHz
GeForce RTX 3050 Ti Laptop GPU
min:
21 fps, P1:
52.6 fps, max:
124 fps
74.5 [X] SCHENKER XMG Focus 15 Intel Core i7-11800H 2.3GHz
GeForce RTX 3050 Ti Laptop GPU
min:
24.4 fps, P1:
50 fps, max:
144 fps
75.4 75.6 [X] SCHENKER XMG Focus 17 Intel Core i7-11800H 2.3GHz
GeForce RTX 3050 Ti Laptop GPU
min:
40.2 fps, P1:
50 fps, max:
136 fps
~ 63 fps
+ Comparer
- Cacher la comparaison
...
NVIDIA GeForce RTX 3050 Ti Laptop GPU
NVIDIA GeForce GTX 1070 Mobile
...
max:
...
AMD Radeon 680M
NVIDIA GeForce RTX 3050 Ti Laptop GPU
...
max:
...
NVIDIA GeForce GTX 1050 Max-Q
NVIDIA GeForce GTX 1050 Ti Max-Q
NVIDIA GeForce RTX 3050 Ti Laptop GPU
NVIDIA GeForce GTX 1070 Mobile
...
max:
» Jouable avec la plupart des ordinateurs portables testés avec les détails paramétrés sur Ultra.
Additional Benchmarks
Highest Settings possible 16xAF 4xMSAA + FXAA 3840x2160
Normal/Off 4xAF 1920x1080
169 [X] XMG Prototyp AMD Ryzen 5 5600H 3.3GHz
GeForce RTX 3050 Ti Laptop GPU
min:
4.54 fps, P1:
125 fps, max:
298 fps
162 [X] Dell G15 5515 AMD Ryzen 7 5800H 3.2GHz
GeForce RTX 3050 Ti Laptop GPU
min:
4.71 fps, P1:
100 fps, max:
281 fps
Lowest Settings possible 1920x1080
177 [X] XMG Prototyp AMD Ryzen 5 5600H 3.3GHz
GeForce RTX 3050 Ti Laptop GPU
min:
3.37 fps, P1:
125 fps, max:
232 fps
169 [X] Dell G15 5515 AMD Ryzen 7 5800H 3.2GHz
GeForce RTX 3050 Ti Laptop GPU
min:
4.47 fps, P1:
111 fps, max:
271 fps
Pour plus de jeux susceptibles d'être fluides avec cette carte graphique et obtenir une liste exhaustive de tous les jeux et cartes graphiques testés, consultez notre liste des jeux .
v1.26
log 05. 01:01:48
#0 no ids found in url (should be separated by "_") +0s ... 0s
#1 not redirecting to Ajax server +0s ... 0s
#2 did not recreate cache, as it is less than 5 days old! Created at Sat, 04 May 2024 05:42:18 +0200 +0.001s ... 0.001s
#3 no comparison url found in template nbc.compare_page_1 needed +0.079s ... 0.08s
#4 no comparison url found in template nbc.compare_page_1 needed +0s ... 0.08s
#5 no comparison url found in template nbc.compare_page_1 needed +0s ... 0.08s
#6 no comparison url found in template nbc.compare_page_1 needed +0s ... 0.081s
#7 no comparison url found in template nbc.compare_page_1 needed +0s ... 0.081s
#8 no comparison url found in template nbc.compare_page_1 needed +0s ... 0.081s
#9 no comparison url found in template nbc.compare_page_1 needed +0s ... 0.082s
#10 no comparison url found in template nbc.compare_page_1 needed +0s ... 0.082s
#11 no comparison url found in template nbc.compare_page_1 needed +0s ... 0.082s
#12 no comparison url found in template nbc.compare_page_1 needed +0s ... 0.083s
#13 no comparison url found in template nbc.compare_page_1 needed +0s ... 0.083s
#14 no comparison url found in template nbc.compare_page_1 needed +0s ... 0.083s
#15 no comparison url found in template nbc.compare_page_1 needed +0s ... 0.084s
#16 no comparison url found in template nbc.compare_page_1 needed +0s ... 0.084s
#17 no comparison url found in template nbc.compare_page_1 needed +0s ... 0.084s
#18 no comparison url found in template nbc.compare_page_1 needed +0s ... 0.085s
#19 no comparison url found in template nbc.compare_page_1 needed +0s ... 0.085s
#20 no comparison url found in template nbc.compare_page_1 needed +0s ... 0.085s
#21 no comparison url found in template nbc.compare_page_1 needed +0s ... 0.086s
#22 no comparison url found in template nbc.compare_page_1 needed +0s ... 0.086s
#23 composed specs +0s ... 0.086s
#24 did output specs +0s ... 0.086s
#25 start showIntegratedCPUs +0s ... 0.086s
#26 getting avg benchmarks for device 10667 +0.039s ... 0.125s
#27 got single benchmarks 10667 +0.212s ... 0.338s
#28 got avg benchmarks for devices +0s ... 0.338s
#29 min, max, avg, median took s +1.207s ... 1.545s
#30 before gaming benchmark output +0s ... 1.545s
#31 Got 1447 rows for game benchmarks. +0.414s ... 1.959s
#32 composed SQL query for gamebenchmarks +0s ... 1.959s
#33 got data and put it in $dataArray +0.083s ... 2.042s
#34 benchmarks composed for output. +5.049s ... 7.091s
#35 no comparison url found in template nbc.compare_page_1 needed +0.012s ... 7.103s
#36 return log +0s ... 7.103s
Testés dans les ordinateurs portables : NVIDIA GeForce RTX 3050 Ti Laptop GPU carte graphique
Test de l'Asus VivoBook Pro 16 : PC portable multimédia avec Core i7, RTX 3050 Ti et DCI-P3 Le VivoBook n'est pas vraiment équipé du matériel le plus récent (Alder Lake, Ampere), mais il marque des points pour d'autres raisons : L'ordinateur portable d...
Intel Core i7-12700H | NVIDIA GeForce RTX 3050 Ti Laptop GPU | 16.00" | 1.9 kg
Test du HP Victus 15 : cher pour un joueur à petit budget Le Victus 15 est censé être une alternative économique à la série Omen, mais il est sur la corde raide avec son prix de détail élevé de 1200 $ US pour un GPU d'...
Intel Core i7-12700H | NVIDIA GeForce RTX 3050 Ti Laptop GPU | 15.60" | 2.3 kg
Test du MSI Prestige 15 : Qualité d'image 4K éblouissante, performances solides L'ordinateur portable Creator de MSI associe des valeurs d'image exceptionnelles à un processeur efficace et puissant ainsi qu'à une puce graphique séparée avec...
Intel Core i7-1280P | NVIDIA GeForce RTX 3050 Ti Laptop GPU | 15.60" | 1.8 kg
Test du Schenker Vision 14 : énormes améliorations des performances du Core i7-12700H Compte tenu de son faible poids, même le Tiger Lake Schenker Vision 14 équipé du GPU GeForce RTX 3050 Ti était un ordinateur portable de 14 pouces très puissant...
Intel Core i7-12700H | NVIDIA GeForce RTX 3050 Ti Laptop GPU | 14.00" | 1.3 kg
Test du MSI Summit E16 Flip : PC portable 2-en-1 avec stylet, écran 16/10 et RTX 3050 Ti Le Summit E16 Flip offre un écran tactile de 16 pouces au format 16:10, plus adapté à la bureautique, un port Thunderbolt 4 et un GPU dédié GeForce RTX 3050 Ti ...
Intel Core i7-1280P | NVIDIA GeForce RTX 3050 Ti Laptop GPU | 16.00" | 1.9 kg
Lenovo IdeaPad Gaming 3 15IAH7 : Intel Core i5-12500H, 15.60", 2.4 kgCritique » Test du Lenovo IdeaPad Gaming 3 15IAH7 : l'un des plus puissants PC portables RTX 3050 Ti
HP Pavilion Gaming 17-cd2146ng : Intel Core i5-11300H, 17.30", 2.8 kgCritique » Test du HP Pavilion Gaming 17 : PC portable de jeu avec un bon écran et abordable
Dell Inspiron 16 Plus 7620 : Intel Core i7-12700H, 16.00", 2.1 kgCritique » Test du Dell Inspiron 16 Plus 7620 : ordinateur portable multimédia polyvalent
Dell XPS 15 9520 RTX 3050 Ti : Intel Core i7-12700H, 15.60", 1.9 kgCritique » Test du Dell XPS 15 9520 3.5K OLED 2022 : acheter ou laisser tomber ?
HP Victus 16-e0145ng : AMD Ryzen 5 5600H, 16.10", 2.4 kgCritique » Test du HP Victus 16 : PC portable de jeu abordable avec processeur AMD et GPU Nvidia
Asus Zenbook Pro 15 OLED UM535Q : AMD Ryzen 9 5900HX, 15.60", 1.9 kgCritique » Test de l'Asus Zenbook Pro 15 OLED UM535Q : comme un XPS 15 équipé d'AMD
Dell G15 5510-43NHT : Intel Core i5-10200H, 15.60", 2.5 kgCritique » Test du Dell G15 5510 : PC portable de jeu 120 Hz bon marché face à son homologue AMD
Lenovo ThinkBook 15p G2 ITH 21B1000YGE : Intel Core i7-11800H, 15.60", 1.9 kgCritique » Test du Lenovo ThinkBook 15p G2 : PC portable pour créatifs avec RTX et 4K
Lenovo Ideapad Gaming 3 15IHU-82K1002RGE : Intel Core i5-11300H, 15.60", 2 kgCritique » Test du Lenovo IdeaPad Gaming 3i 15 G6 : PC portable de jeu à petit prix et écran médiocre
Microsoft Surface Laptop Studio i7 RTX 3050 Ti : Intel Core i7-11370H, 14.40", 1.8 kgCritique » Test du Microsoft Surface Laptop Studio : un concept intéressant au processeur Intel lent
Asus ROG Flow Z13 GZ301ZE : Intel Core i9-12900H, 13.40", 1.2 kgCritique » Test de l'Asus ROG Flow Z13 : tablette de jeu avec un puissant processeur Alder Lake i9
SCHENKER Vision 14 : Intel Core i7-11370H, 14.00", 1.1 kgCritique » Test du Schenker Vision 14 : maintenant avec GeForce RTX 3050 Ti
Asus Vivobook Pro 16X-M7600QE : AMD Ryzen 9 5900HX, 16.10", 1.9 kgCritique » Test de l'Asus Vivobook Pro 16X (préproduction) : performances, endurance et écran OLED
Lenovo ThinkPad X1 Extreme G4-20Y5CTO1WW (3050 Ti) : Intel Core i7-11800H, 16.00", 2 kgCritique » Test du Lenovo ThinkPad X1 Extreme Gen 4 : PC-phare performant avec écran tactile 16:10
Dell G15 5515 : AMD Ryzen 7 5800H, 15.60", 2.4 kgCritique » Test du Dell G15 5515 Ryzen Edition : PC portable de jeu FHD abordable
Asus Zephyrus G14 GA401QEC : AMD Ryzen 9 5900HS, 14.00", 1.7 kgCritique » Test de l'Asus Zephyrus G14 GA401Q : PC portable de jeu de 14 pouces édition spéciale Alan Walker
SCHENKER XMG Focus 17 : Intel Core i7-11800H, 17.30", 2.5 kgCritique » Test du XMG Focus 17 (Clevo NP70HK) : PC portable de jeu de milieu de gamme avec RTX 3050 Ti
SCHENKER XMG Focus 15 : Intel Core i7-11800H, 15.60", 1.9 kgCritique » Test du XMG Focus 15 (Clevo NP50HK) : La RTX 3050 Ti a ses limites
Asus ROG Strix G17 G713QE-RB74 : AMD Ryzen 7 5800H, 17.30", 2.5 kgCritique » Test de l'Asus ROG Strix G17 G713QE : la GeForce RTX 3050 Ti tire vers le bas un excellent système
Dell XPS 15 9510 11800H RTX 3050 Ti OLED : Intel Core i7-11800H, 15.60", 1.9 kgCritique » Test du Dell XPS 15 9510 : le PC portable multimédia convainc avec sa nouvelle dalle OLED
Dell G15 5515 : AMD Ryzen 7 5800H, 15.60", 2.4 kgAutres tests » Dell G15 5515
HP Victus 16-e1000ax : AMD Ryzen 5 6600H, 16.10", 2.4 kgAutres tests » HP Victus 16-e1000ax
HP Victus 16-e0145ng : AMD Ryzen 5 5600H, 16.10", 2.4 kgAutres tests » HP Victus 16-e0145ng
HP Victus 16-d1008ns : Intel Core i5-12500H, 16.10", 2.5 kgAutres tests » HP Victus 16-d1008ns
HP Victus 16-d1018ns : Intel Core i5-12500H, 16.10", 2.5 kgAutres tests » HP Victus 16-d1018ns
Acer Aspire 7 A715-51G-51BY : Intel Core i5-1240P, 15.60", 2.1 kgAutres tests » Acer Aspire 7 A715-51G-51BY
HP Victus 16-d1023ns : Intel Core i7-12700H, 16.10", 2.5 kgAutres tests » HP Victus 16-d1023ns
HP Omen 16-c0025ns : AMD Ryzen 7 5800H, 16.10", 2.3 kgAutres tests » HP Omen 16-c0025ns
Acer Nitro 5 AN515-58-7365 : Intel Core i7-12700H, 15.60", 2.5 kgAutres tests » Acer Nitro 5 AN515-58-7365
Asus VivoBook Pro 16 : Intel Core i7-12700H, 16.00", 1.9 kgAutres tests » Asus VivoBook Pro 16 K6602ZE-KV040W
MSI Katana GF66 12UD-436 : Intel Core i7-12650H, 15.60", 2.3 kgAutres tests » MSI Katana GF66 12UD-436
Acer Aspire 7 A715-43G-R83Y : AMD Ryzen 7 5825U, 15.60", 2.2 kgAutres tests » Acer Aspire 7 A715-43G-R83Y
MSI Sword 17 A12UD : Intel Core i7-12700H, 17.30", 2.6 kgAutres tests » MSI Sword 17 A12UD
LG UltraPC 17, i7-1260P RTX 3050 Ti : Intel Core i7-1260P, 17.00", 2 kgAutres tests » LG UltraPC 17, i7-1260P RTX 3050 Ti
Asus ZenBook Pro 15 UM535QE, R7 5800H : AMD Ryzen 7 5800H, 15.60", 2 kgAutres tests » Asus ZenBook Pro 15 UM535QE, R7 5800H
Dell G15 5520, i5-12500H RTX 3050 Ti : Intel Core i5-12500H, 15.60", 2.7 kgAutres tests » Dell G15 5520, i5-12500H RTX 3050 Ti
Asus TUF Gaming A17 FA707RE-HX030W : AMD Ryzen 7 6800H, 17.30", 2.6 kgAutres tests » Asus TUF Gaming A17 FA707RE-HX030W
Acer Swift X SFX14-42G-R607 : AMD Ryzen 7 5825U, 14.00", 1.4 kgAutres tests » Acer Swift X SFX14-42G-R607
MSI Katana GF66 12UD-064FR : Intel Core i7-12700H, 15.60", 2.3 kgAutres tests » MSI Katana GF66 12UD-064FR
Asus Vivobook Pro 14X N7401ZE : Intel Core i7-12700H, 14.50", 1.7 kgAutres tests » Asus Vivobook Pro 14X N7401ZE
Asus VivoBook Pro 16X M7600RE : AMD Ryzen 9 6900HX, 16.00", 2 kgAutres tests » Asus VivoBook Pro 16X M7600RE
HP Victus 16-d1027ns : Intel Core i7-12700H, 16.10", 2.5 kgAutres tests » HP Victus 16-d1027ns
HP Omen 16-n0000ns : AMD Ryzen 7 6800H, 16.10", 2.3 kgAutres tests » HP Omen 16-n0000ns
Dell G15 5520, i7-12700H RTX 3050 Ti : Intel Core i7-12700H, 15.60", 2.7 kgAutres tests » Dell G15 5520, i7-12700H RTX 3050 Ti
Lenovo Legion 5 15IAH7-82RC004JGE : Intel Core i5-12500H, 15.60", 2.4 kgAutres tests » Lenovo Legion 5 15IAH7-82RC004JGE
Lenovo Ideapad Gaming 3 15ARH7-82SB0073GE : AMD Ryzen 7 6800H, 15.60", 2.3 kgAutres tests » Lenovo Ideapad Gaming 3 15ARH7-82SB0073GE
HP Victus 16-e0091ns : AMD Ryzen 5 5600H, 16.10", 2.5 kgAutres tests » HP Victus 16-e0091ns
Lenovo IdeaPad Gaming 3 15IAH7-82S90075SP : Intel Core i5-12500H, 15.60", 2.3 kgAutres tests » Lenovo IdeaPad Gaming 3 15IAH7-82S90075SP
Lenovo IdeaPad Gaming 3 15IAH7, i7-12700H RTX 3050 Ti : Intel Core i7-12700H, 15.60", 2.3 kgAutres tests » Lenovo IdeaPad Gaming 3 15IAH7, i7-12700H RTX 3050 Ti
Alienware x14, i7-12700H 3050 Ti : Intel Core i7-12700H, 14.00", 1.8 kgAutres tests » Alienware x14, i7-12700H 3050 Ti
Dell Inspiron 16 Plus 7620 : Intel Core i7-12700H, 16.00", 2.1 kgAutres tests » Dell Inspiron 16 Plus 7620
HP Omen 16-c0027ns : AMD Ryzen 7 5800H, 16.10", 2.3 kgAutres tests » HP Omen 16-c0027ns
HP Victus 16-e0093ns : AMD Ryzen 7 5800H, 16.10", 2.5 kgAutres tests » HP Victus 16-e0093ns
HP Victus 15-fb0012AX : AMD Ryzen 7 5800H, 15.60", 2.3 kgAutres tests » HP Victus 15-fb0012AX
HP Victus 16-e1085cl : AMD Ryzen 7 6800H, 16.10", 2.5 kgAutres tests » HP Victus 16-e1085cl
MSI Thin GF63 11UD : Intel Core i7-11800H, 15.60", 1.9 kgAutres tests » MSI Thin GF63 11UD
Acer Predator Triton 300 PT315-53-54XN : Intel Core i5-11400H, 15.60", 2.1 kgAutres tests » Acer Predator Triton 300 PT315-53-54XN
HP Victus 15-fb0028n : AMD Ryzen 7 5800H, 15.60", 2.3 kgAutres tests » HP Victus 15-fb0028n
MSI Summit E16 Flip A12UDT-031 : Intel Core i7-1280P, 16.00", 1.9 kgAutres tests » MSI Summit E16 Flip A12UDT-031
MSI Prestige 15 A12UD-049ES : Intel Core i7-1280P, 15.60", 1.7 kgAutres tests » MSI Prestige 15 A12UD-049ES
Dell XPS 15 9520, i9-12900H 3050 Ti : Intel Core i9-12900H, 15.60", 1.9 kgAutres tests » Dell XPS 15 9520, i9-12900H 3050 Ti
Dell Vostro 16 7620, i7-12700H RTX 3050 Ti : Intel Core i7-12700H, 16.00", 2 kgAutres tests » Dell Vostro 16 7620, i7-12700H RTX 3050 Ti
Lenovo IdeaPad Gaming 3 15IAH7, i7-12650H RTX 3050 Ti : Intel Core i7-12650H, 15.60", 2.3 kgAutres tests » Lenovo IdeaPad Gaming 3 15IAH7, i7-12650H RTX 3050 Ti
Asus ROG Strix G17 G713IC-HX011 : AMD Ryzen 7 4800H, 17.30", 2.4 kgAutres tests » Asus ROG Strix G17 G713IC-HX011
HP Omen 16-c0615nd : AMD Ryzen 7 5800H, 16.10", 2.3 kgAutres tests » HP Omen 16-c0615nd
Acer Nitro 5 AN515-57-505V : Intel Core i5-11400H, 15.60", 2.2 kgAutres tests » Acer Nitro 5 AN515-57-505V
Alienware m15 R7, i7-12700H RTX 3050 Ti : Intel Core i7-12700H, 15.60", 2.4 kgAutres tests » Alienware m15 R7, i7-12700H RTX 3050 Ti
Asus TUF Dash F15 FX517ZE-HN044W : Intel Core i5-12450H, 15.60", 2 kgAutres tests » Asus TUF Dash F15 FX517ZE-HN044W
Acer Nitro 5 AN515-58-NH.QFKEK.001 : Intel Core i5-12500H, 15.60", 2.5 kgAutres tests » Acer Nitro 5 AN515-58-NH.QFKEK.001
Acer Predator Helios 300 PH315-54 NH.QC5EP.00A : Intel Core i5-11400H, 15.60", 2.2 kgAutres tests » Acer Predator Helios 300 PH315-54 NH.QC5EP.00A
Asus ROG Zephyrus G15 GA503QE : AMD Ryzen 9 5900HS, 15.60", 1.9 kgAutres tests » Asus ROG Zephyrus G15 GA503QE
Acer Predator Helios 300 PH315-54-582Q : Intel Core i5-11400H, 15.60", 2.9 kgAutres tests » Acer Predator Helios 300 PH315-54-582Q
Asus TUF Gaming F15 FX506HE-HN012 : Intel Core i5-11400H, 15.60", 2.3 kgAutres tests » Asus TUF Gaming F15 FX506HE-HN012
Asus ZenBook Pro 14 Duo UX8402ZE-M3075W : Intel Core i7-12700H, 14.00", 1.8 kgAutres tests » Asus ZenBook Pro 14 Duo UX8402ZE-M3075W
MSI Summit E16 Flip A12UDT-006 : Intel Core i7-1260P, 16.00", 1.9 kgAutres tests » MSI Summit E14 Flip Evo A12MT-016
HP Victus 16-e0090ns : AMD Ryzen 7 5800H, 16.10", 2.5 kgAutres tests » HP Victus 16-e0090ns
Asus TUF Dash F15 FX517ZE : Intel Core i7-12650H, 15.60", 2 kgAutres tests » Asus TUF Dash F15 FX517ZE
Asus Zenbook Pro 14 Duo UX8402ZE-M3030W : Intel Core i9-12900H, 14.50", 1.8 kgAutres tests » Asus Zenbook Pro Duo 14 UX8402ZE-M3030W
MSI Prestige 15 A12UD-093 : Intel Core i7-1280P, 15.60", 1.8 kgAutres tests » MSI Prestige 15 A12UD-093
Dell XPS 15 9520 RTX 3050 Ti : Intel Core i7-12700H, 15.60", 1.9 kgAutres tests » Dell XPS 15 9520 RTX 3050 Ti
MSI Katana GF66 12UD-251 : Intel Core i7-12700H, 15.60", 2.3 kgAutres tests » MSI Katana GF66 12UD-251
Lenovo Legion S7 15ACH6-82K8002YGE : AMD Ryzen 7 5800H, 15.60", 1.9 kgAutres tests » Lenovo Legion S7 15ACH6-82K8002YGE
MSI Creator M16 A12UD-283 : Intel Core i7-12700H, 16.00", 2.3 kgAutres tests » MSI Creator M16 A12UD-283
MSI Katana GF76 12UD-041 : Intel Core i7-12700H, 17.30", 2.6 kgAutres tests » MSI Katana GF76 12UD-041
Asus ROG Flow X13 GV301RE-LJ096W : AMD Ryzen 9 6900HS, 13.40", 1.3 kgAutres tests » Asus ROG Flow X13 GV301RE-LJ096W
Acer Nitro 5 AN515-58-77YB : Intel Core i7-12700H, 15.60", 2.5 kgAutres tests » Acer Nitro 5 AN515-58-77YB
Asus ROG Flow X13 GV301RE-LI134W : AMD Ryzen 7 6800HS, 13.40", 1.3 kgAutres tests » Asus ROG Flow X13 GV301RE-LI134W
MSI Katana GF66 11UD-1222PL : Intel Core i5-11400H, 15.60", 2.1 kgAutres tests » MSI Katana GF66 11UD-1222PL
MSI Katana GF66 11UD-480XUA : Intel Core i5-11400H, 15.60", 2.1 kgAutres tests » MSI Katana GF66 11UD-480XUA
Acer Swift X SFX14-51G-79RJ : Intel Core i7-1260P, 14.00", 1.4 kgAutres tests » Acer Swift X SFX14-51G-79RJ
HP Omen 16-c0010ca : AMD Ryzen 7 5800H, 16.10", 2.3 kgAutres tests » HP Omen 16-c0010ca
HP Omen 16-b0352TX : Intel Core i7-11800H, 16.00", 2.3 kgAutres tests » HP Omen 16-b0352TX
Lenovo ThinkPad X1 Extreme G4-20Y5001NGE : Intel Core i7-11800H, 16.00", 1.9 kgAutres tests » Lenovo ThinkPad X1 Extreme G4-20Y5001NGE
HP Envy 15-ep1074ng : Intel Core i7-11800H, 15.60", 2.2 kgAutres tests » HP Envy 15-ep1074ng
Lenovo ThinkBook 15p G2 ITH 21B1000YGE : Intel Core i7-11800H, 15.60", 1.9 kgAutres tests » Lenovo ThinkBook 15p G2 ITH 21B1000YGE
Asus Zenbook Pro 15 OLED UM535Q : AMD Ryzen 9 5900HX, 15.60", 1.9 kgAutres tests » Asus Zenbook Pro 15 OLED UM535Q
Acer Swift X SFX14-41G-R1GH : AMD Ryzen 7 5800U, 14.00", 1.5 kgAutres tests » Acer Swift X SFX14-41G-R1GH
Microsoft Surface Laptop Studio i7 RTX 3050 Ti : Intel Core i7-11370H, 14.40", 1.8 kgAutres tests » Microsoft Surface Laptop Studio i7 RTX 3050 Ti
HP Pavilion Gaming 15-dk2070ng : Intel Core i7-11370H, 15.60", 2.3 kgAutres tests » HP Pavilion Gaming 15-dk2070ng
Asus ROG Zephyrus G14 GA401QE-HZ047 : AMD Ryzen 9 5900HS, 14.00", 1.6 kgAutres tests » Asus ROG Zephyrus G14 GA401QE-HZ047
Asus ROG Strix G17 G713IE-HX011 : AMD Ryzen 7 4800H, 17.30", 2.7 kgAutres tests » Asus ROG Strix G17 G713IE-HX011
Samsung Galaxy Book Odyssey 15 NP762XDA-XA1US : Intel Core i7-11600H, 15.60", 1.9 kgAutres tests » Samsung Galaxy Book Odyssey 15 NP762XDA-XA1US
Asus ROG Flow Z13 GZ301ZE : Intel Core i9-12900H, 13.40", 1.2 kgAutres tests » Asus ROG Flow Z13 GZ301ZE
Lenovo Legion 5 15ITH6, i7-11600H RTX 3050 Ti : Intel Core i7-11600H, 15.60", 2.4 kgAutres tests » Lenovo Legion 5 15ITH6, i7-11600H RTX 3050 Ti
HP Victus 16-d0065ng : Intel Core i7-11800H, 16.10", 2.5 kgAutres tests » HP Victus 16-d0065ng
Asus ROG Strix G15 G513IE-HN004W : AMD Ryzen 7 4800H, 15.60", 2.3 kgAutres tests » Asus ROG Strix G15 G513IE-HN004W
MSI Sword 15 A11UD : Intel Core i7-11800H, 15.60", 2.3 kgAutres tests » MSI Sword 15 A11UD
Acer Nitro 5 AN517-54-79L1 : Intel Core i7-11800H, 17.30", 2.7 kgAutres tests » Acer Nitro 5 AN517-54-79L1
Asus VivoBook Pro 15 M3500-L1179T : AMD Ryzen 9 5900HX, 15.60", 1.7 kgAutres tests » Asus VivoBook Pro 15 M3500-L1179T
Asus TUF Gaming F15 FX506HCB-HN243T : Intel Core i5-11400H, 15.60", 2.3 kgAutres tests » Asus TUF Gaming F15 FX506HCB-HN243T
Dell G15 5511-RNGVW : Intel Core i7-11800H, 15.60", 2.8 kgAutres tests » Dell G15 5511-RNGVW
Dell G15 5515-2CMCX : AMD Ryzen 7 5800H, 15.60", 2.8 kgAutres tests » Dell G15 5515-2CMCX
Tuxedo InfinityBook Pro 14 Gen6, 11370H 3K : Intel Core i7-11370H, 14.00", 1 kgAutres tests » Tuxedo InfinityBook Pro 14 Gen6, 11370H 2K
Asus Vivobook Pro 16X-M7600QE : AMD Ryzen 9 5900HX, 16.10", 1.9 kgAutres tests » Asus Vivobook Pro 16X-M7600QE
HP Victus 16-d0367ng : Intel Core i5-11400H, 16.10", 2.5 kgAutres tests » HP Victus 16-d0367ng
Dell G15 5515, 5600H RTX 3050 Ti : AMD Ryzen 5 5600H, 15.60", 2.6 kgAutres tests » Dell G15 5515, 5600H RTX 3050 Ti
Lenovo Legion S7 15ACH6-82K8CTO1WW : AMD Ryzen 5 5600H, 15.60", 1.9 kgAutres tests » Lenovo Legion S7 15ACH6-82K8CTO1WW
Acer Swift X SFX16-51G-76HE : Intel Core i7-11390H, 16.00", 1.8 kgAutres tests » Acer Swift X SFX16-51G-76HE
Acer ConceptD 3 Ezel CC315-73G-74TT : Intel Core i7-11800H, 15.60", 2.2 kgAutres tests » Acer ConceptD 3 Ezel CC315-73G-74TT
Asus Vivobook Pro 14X M7400, 5800H 3050 Ti : AMD Ryzen 7 5800H, 14.00", 1.5 kgAutres tests » Asus Vivobook Pro 14X M7400, 5800H 3050 Ti
Lenovo Legion 5 15ITH6, i7-11800H 3050 Ti : Intel Core i7-11800H, 15.60", 2.4 kgAutres tests » Lenovo Legion 5 15ITH6, i7-11800H 3050 Ti
Dell XPS 15 9510, 11900H RTX 3050 Ti OLED : Intel Core i9-11900H, 15.60", 2 kgAutres tests » Dell XPS 15 9510, 11900H RTX 3050 Ti OLED
Acer Nitro 5 AN517-54-77KG : Intel Core i7-11800H, 17.30", 2.7 kgAutres tests » Acer Nitro 5 AN517-54-77KG
HP Victus 16-e0076ng : AMD Ryzen 7 5800H, 16.10", 2.5 kgAutres tests » HP Victus 16-e0076ng
Asus ROG Zephyrus G14 GA401QE-HZ055T : AMD Ryzen 7 5800HS, 14.00", 1.7 kgAutres tests » Asus ROG Zephyrus G14 GA401QE-HZ055T
Microsoft Surface Laptop Studio, i7-11370H RTX 3050 Ti : Intel Core i7-11370H, 14.40", 1.8 kgAutres tests » Microsoft Surface Laptop Studio, i7-11370H RTX 3050 Ti
Gigabyte G5 MD-51US123SH : Intel Core i5-11400H, 15.60", 2.2 kgAutres tests » Gigabyte G5 MD-51US123SH
MSI GF75 Thin 10UD : Intel Core i7-10750H, 17.30", 2.2 kgAutres tests » MSI GF75 Thin 10UD
MSI Katana GF66 11UD-836XFR : Intel Core i5-11400H, 15.60", 2.1 kgAutres tests » MSI Katana GF66 11UD-836XFR
Asus Vivobook Pro 14X M7400, 5900HX 3050 Ti : AMD Ryzen 9 5900HX, 14.00", 1.5 kgAutres tests » Asus Vivobook Pro 14X M7400, 5900HX 3050 Ti
Acer Nitro 5 AN515-57-796N : Intel Core i7-11800H, 15.60", 2.3 kgAutres tests » Acer Nitro 5 AN515-57-796N
Asus Vivobook Pro 16X M7600, 5900HX 3050 Ti : AMD Ryzen 9 5900HX, 16.00", 2 kgAutres tests » Asus Vivobook Pro 16X M7600, 5900HX 3050 Ti
Acer Swift X SFX14-41G-R1S6 : AMD Ryzen 7 5800U, 14.00", 1.5 kgAutres tests » Acer Swift X SFX14-41G-R1S6
MSI Katana GF66 11UD-092 : Intel Core i7-11800H, 15.60", 2.1 kgAutres tests » MSI Katana GF66 11UD-092
MSI Pulse GL66 11UDK : Intel Core i7-11800H, 15.60", 2.3 kgAutres tests » MSI Pulse GL66 11UDK
MSI Pulse GL76 11UDK : Intel Core i7-11800H, 17.30", 2.3 kgAutres tests » MSI Pulse GL76 11UDK
Dell XPS 15 9510, 11800H RTX 3050 Ti FHD : Intel Core i7-11800H, 15.60", 2 kgAutres tests » Dell XPS 15 9510, 11800H RTX 3050 Ti FHD
Dell XPS 15 9510 11800H RTX 3050 Ti OLED : Intel Core i7-11800H, 15.60", 1.9 kgAutres tests » Dell XPS 15 9510 11800H RTX 3050 Ti OLED
Asus Zephyrus G14 GA401QEC : AMD Ryzen 9 5900HS, 14.00", 1.7 kgAutres tests » Asus Zephyrus G14 GA401Q - Alan Walker Special Edition
Lenovo Legion 5 15ACH6H-82JW0012US : AMD Ryzen 7 5800H, 15.60", 2.4 kgAutres tests » Lenovo Legion 5 15ACH6H-82JW0012US
Asus TUF Dash F15 TUF516PE-AB73 : Intel Core i7-11370H, 15.60", 2 kgAutres tests » Asus TUF Dash F15 TUF516PE-AB73
Asus ROG Flow X13 GV301QE-K6149T : AMD Ryzen 9 5900HS, 13.40", 1.3 kgAutres tests » Asus ROG Flow X13 GV301QE-K6149T
Asus ROG Strix G17 G713QE-RB74 : AMD Ryzen 7 5800H, 17.30", 2.5 kgAutres tests » Asus ROG Strix G17 G713QE-RB74
MSI Katana GF76 11UD-050 : Intel Core i7-11800H, 17.30", 2.3 kgAutres tests » MSI Katana GF76 11UD-050
Asus TUF Gaming F15 TUF506HE-DS74 : Intel Core i7-11800H, 15.60", 2.3 kgAutres tests » Asus TUF Gaming F15 TUF506HE-DS74
Asus TUF Dash F15 FX516PE-HN006T : Intel Core i7-11370H, 15.60", 2 kgAutres tests » Asus TUF Dash F15 FX516P-EHN006T
Dell G15 5510, i5-10200H RTX 3050 Ti : Intel Core i5-10200H, 15.60", 2.7 kgAutres tests » Dell G15 5510, i5-10200H RTX 3050 Ti
Acer Swift X SFX14-41G-R4VH : AMD Ryzen 7 5800U, 14.00", 1.4 kgAutres tests » Acer Swift X SFX14-41G-R4VH
SCHENKER Vision 14 : Intel Core i7-11370H, 14.00", 1.1 kgLe Schenker Vision 14 avec le GeForce RTX 3050 Ti n'a pas vraiment de concurrent
Dell XPS 15 9510 11800H RTX 3050 Ti OLED : Intel Core i7-11800H, 15.60", 1.9 kgQuand aurons-nous enfin le Dell XPS 15 avec les CPU Ryzen d'AMD ?
»
Le nouveau Dell XPS 15 9510 OLED a des problèmes avec les performances du GPU
Please share our article, every link counts!
Rang 1 GeForce RTX 2080 Super Mobile
Rang 2 M1 Max 32-Core GPU *
GeForce RTX 2070 Super Mobile
M1 Max 24-Core GPU *
Radeon RX 5700M *
M1 Pro 16-Core GPU *
Radeon PRO W6600M *
GeForce RTX 2070 Super Max-Q
M1 Pro 14-Core GPU *
GeForce GTX 1070 Mobile
Radeon RX 580X (Laptop) *
Radeon RX 580 (Laptop)
Radeon Pro 5300M
Radeon RX 5300M
Radeon RX 570X (Laptop) *
Radeon RX 570 (Laptop) *
Radeon RX 470 (Laptop) *
Rang 3 GeForce GTX 1050 Ti Mobile
Radeon 680M
Quadro P2000 Max-Q
Radeon R9 M395X
GeForce GTX 1050 Ti Max-Q *
Radeon R9 M485X
GeForce GTX 1050 Max-Q *
Radeon 660M
Radeon RX 560X (Laptop)
Radeon RX 560 (Laptop)
Radeon Pro 560X
Radeon Pro 560
Radeon Pro 460
Quadro P620 *
Radeon RX 550X (Laptop)
Radeon Pro 555X
Radeon Pro 555
Radeon Pro 455
Quadro P600
Radeon RX 540X *
Radeon Pro WX 2100 *
Radeon Pro 450
Radeon 630
Radeon 540X *
Quadro P520
Quadro P500 *
Iris Plus Graphics G7 (Ice Lake 64 EU) *
Vega 10 *
Iris Pro Graphics 580
Vega 9
UHD Graphics Xe G4 48EUs *
UHD Graphics 32EUs
UHD Graphics Xe 32EUs (Tiger Lake-H) *
UHD Graphics 750
Vega 7
Vega 8
Iris Plus Graphics G4 (Ice Lake 48 EU)
FirePro W4190M
Radeon R7 M445
UHD Graphics 24EUs (Alder Lake-N) *
Radeon R7 M460 *
Radeon R7 M340
Radeon 610M *
UHD Graphics G1 (Ice Lake 32 EU)
UHD Graphics Xe 16EUs (Tiger Lake-H) *
Adreno 690 *
Adreno 685 *
Adreno 680 *
Rang 4 UHD Graphics 730
Radeon R5 M315 *
Radeon R5 M420 *
UHD Graphics 617
UHD Graphics 615
Radeon R4 (Stoney Ridge)
Radeon R2 (Stoney Ridge)
Rang 5 * Position approximative de la carte graphique
Klaus Hinum, 2021-08- 5 (Update: 2021-08- 5)
 Deutsch
 English
 Español
 Français
 Italiano
 Nederlands
 Polski
 Português
 Русский
 Türkçe
 Svenska
 Chinese
 Magyar