NVIDIA GeForce RTX 3070 Ti Laptop GPU
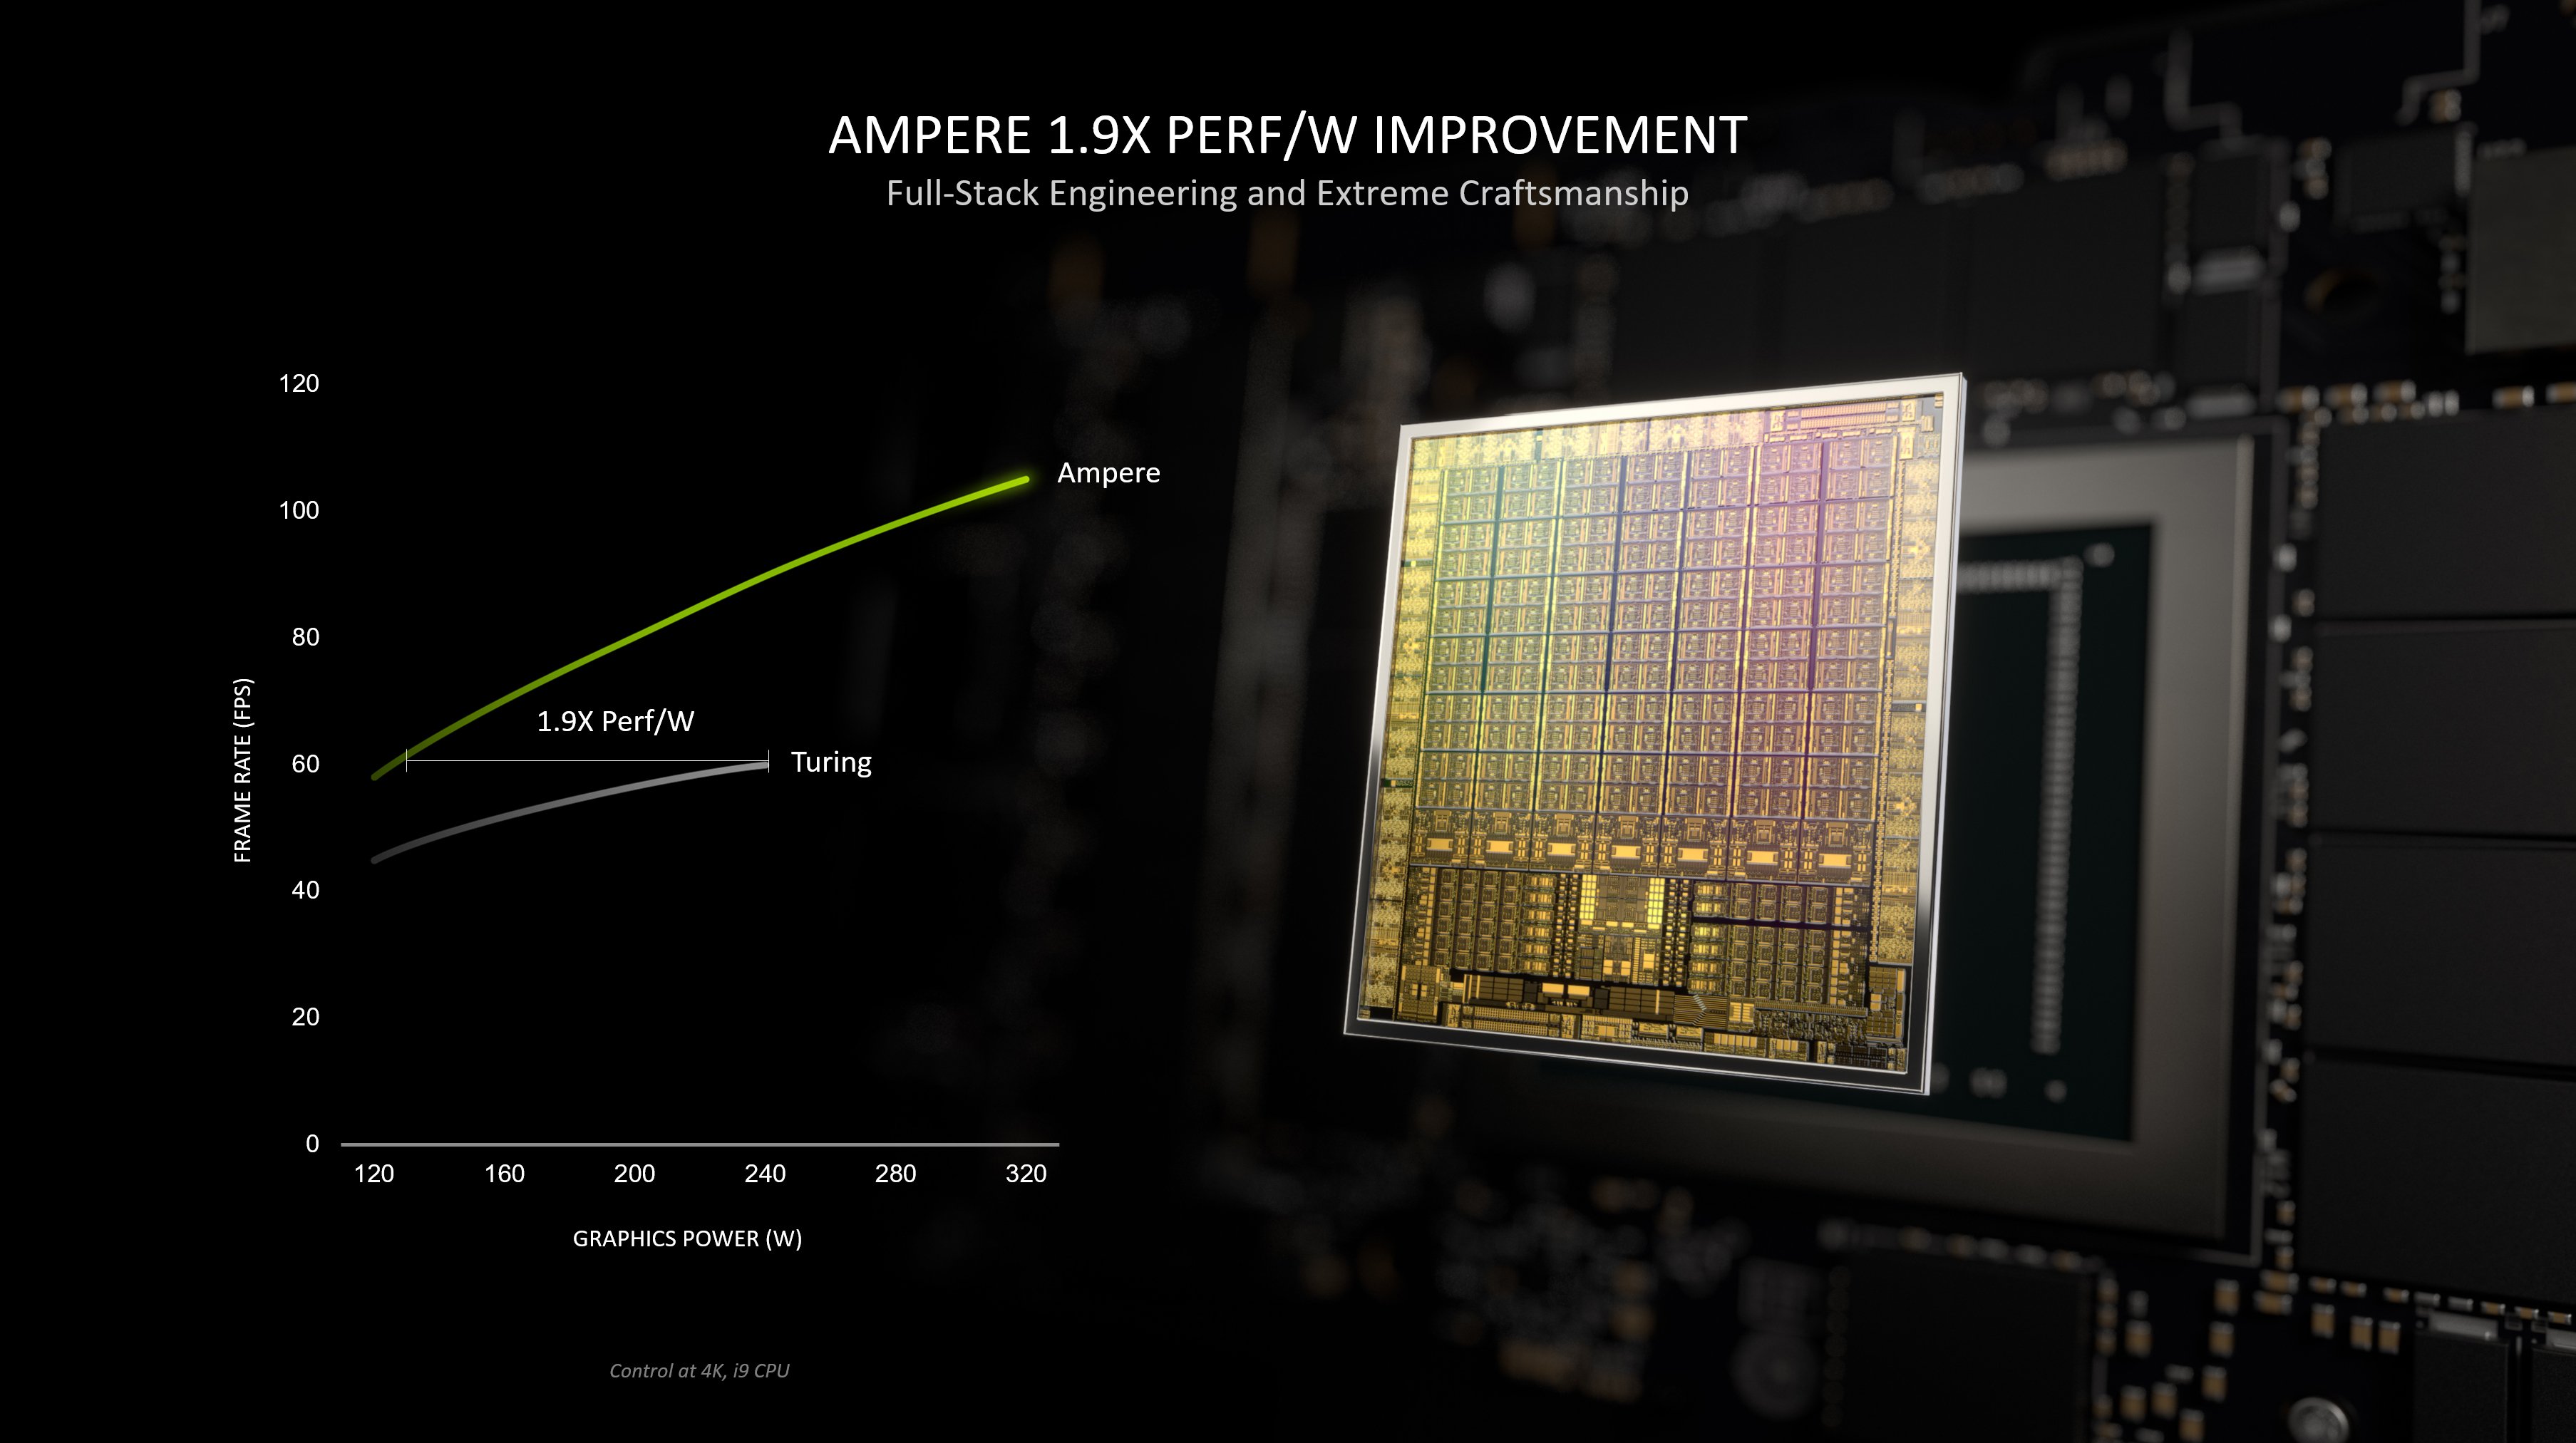
La Nvidia GeForce RTX 3070 Ti Laptop GPU (mobile, GN20-E6, Max-P, Max-Q) est une carte graphique mobile pour ordinateurs portables et le rafraîchissement de la RTX 3070. Elle a été annoncée début 2021 au CES et est basée sur la même puce GA104 Ampère que l'ancienne RTX 3070 Laptop. Par rapport à l'ancienne carte, la nouvelle offre 15% de shaders en plus mais une vitesse d'horloge moindre. Elle disposera toujours du bus mémoire de 256 bits et de 8 Go de GDDR6. La RTX 3070ti est disponible dans différentes variantes de puissance allant de 80 Watt TGP avec une horloge Boost de 1035 MHz jusqu'à des modèles de 125 Watt avec une horloge Boost de 1485 MHz.
Il n'y a plus de variante Max-Q (utilisée auparavant pour les variantes à faible puissance) mais chaque OEM peut choisir d'implémenter les technologies Max-Q (Dynamic Boost, Whispermode).
Les performances dépendent du réglage TGP et du refroidissement de l'ordinateur portable. En moyenne, elles devraient se situer entre celles de l'ancienne RTX 3070 Mobile et de la RTX 3080 Mobile (à des paramètres TDP similaires). Par conséquent, la carte est mieux adaptée aux jeux QHD avec un maximum de détails (pour des jeux exigeants comme Cyberpunk 2077). Les jeux moins exigeants comme Farming Simulator 22 ou les jeux plus anciens devraient également fonctionner en 4K avec des paramètres de détail maximum.
La puce GA104 offre 6 144 FP32 ALUs, dont la moitié peut également exécuter des instructions INT32 (soit 3 072 INT32 ALUs). La RTX 3070 Ti n'utilisera cependant pas toutes les UAL de la puce. Avec Turing, tous les shaders pourraient encore exécuter des instructions FP32 ou INT32. Le raytracing et les cœurs tenseurs de la puce ont également été améliorés selon Nvidia. La série mobile RTX 3070 Ti utilise 5 888 des 6 144 cœurs. Les puces Ampere comprennent également un encodeur vidéo amélioré de 5e génération (NVENC pour H.264 et H.265) et un décodeur de 7e génération (pour divers formats, dont AV1).
La puce GA104 est fabriquée par Samsung en 8 nm (8N), ce qui n'est pas tout à fait à la hauteur du nœud de 7 nm de TSMC (utilisé par exemple par AMD et également pour la puce professionnelle GA100 d'Ampere).
GeForce RTX 3000 Gamme Nom de code GN20-E6 Architecture Ampere Pipelines 5888 - unifiés TMUs 184 ROPs 96 Raytracing Cores 46 Tensor / AI Cores 184 Fréquence du noyau interne 915 - 1480 (Boost) MHz Fréquence de la mémoire 14000 effective = 1750 MHz Largeur du bus mémoire 256 Bit Type de mémoire GDDR6 Quantité maximale possible de mémoire embarquée 8 GB Mémoire partagée non Memory Bandwidth 448 GB/s API DirectX 12_2, Shader 6.7, OpenGL 4.6 Consommation d'énergie 125 Watt(s) (80 - 125 Watt(s) TGP) Nombre de transistors 17.4 Billion Die Size 392 mm² technologie 8 nm PCIe 4.0 Displays HDMI 2.1, DisplayPort 1.4a Caractéristiques NVIDIA DLSS, NVIDIA Reflex, Resizable BAR, NVIDIA Broadcast, NVIDIA Ansel, NVIDIA ShadowPlay®, NVIDIA G-SYNC®, Advanced Optimus, Nvidia Max-Q, Dynamic Boost, VR-ready, Nvidia Omniverse Dimension de l'ordinateur portable de grandes dimensions (en remplacement d'un ordinateur de bureau) Date de présentation 04.01.2022
Benchmarks Performance Rating - 3DMark 11 + Fire Strike + Time Spy
12.7 pt (38%)
...
NVIDIA GeForce RTX 3070 Ti Laptop GPU
max:
3DMark - 3DMark Time Spy Score
min: 7369 moyenne: 10556 médian: 10673 (31%) maximum: 12239 Points
GPU TDP ? TDP 90 W TDP 95 W TDP 100 W TDP 105 W TDP 110 W TDP 115 W TDP 120 W TDP 125 W TDP 130 W TDP 135 W TDP 140 W TDP 150 W 88% 80% 80% 84% 87% 91% 91% 85% 90% 92% 93% 100% 98%
...
NVIDIA GeForce RTX 2080 Super Mobile
NVIDIA GeForce RTX 3070 Ti Laptop GPU
max:
3DMark - 3DMark Time Spy Graphics
min: 8142 moyenne: 10478 médian: 10462 (28%) maximum: 12324 Points
GPU TDP ? TDP 90 W TDP 95 W TDP 100 W TDP 105 W TDP 110 W TDP 115 W TDP 120 W TDP 125 W TDP 130 W TDP 135 W TDP 140 W TDP 150 W 91% 79% 80% 86% 86% 91% 89% 83% 92% 92% 93% 99% 100%
...
NVIDIA GeForce RTX 2080 Super Mobile
NVIDIA GeForce RTX 3070 Ti Laptop GPU
...
max:
3DMark - 3DMark Ice Storm Unlimited Graphics
min: 180384 moyenne: 516185 médian: 581927 (66%) maximum: 646153 Points
GPU TDP 115 W TDP 125 W TDP 130 W TDP 150 W 90% 28% 100% 91%
...
NVIDIA GeForce RTX 2070 Super Mobile
NVIDIA GeForce RTX 3070 Ti Laptop GPU
max:
NVIDIA GeForce RTX 3070 Ti
3DMark - 3DMark Ice Storm Extreme Graphics
min: 73475 moyenne: 116904 médian: 122313 (16%) maximum: 154923 Points
GPU TDP 115 W TDP 130 W TDP 150 W 47% 100% 79%
...
NVIDIA GeForce RTX 3070 Ti Laptop GPU
NVIDIA Quadro P620
NVIDIA Quadro P600
NVIDIA GeForce GTX 1050 Ti Mobile
AMD Radeon 680M
...
max:
3DMark - 3DMark Cloud Gate Score
min: 19528 moyenne: 55293 médian: 58464 (62%) maximum: 68738 Points
GPU TDP ? TDP 90 W TDP 100 W TDP 105 W TDP 110 W TDP 115 W TDP 120 W TDP 125 W TDP 130 W TDP 135 W TDP 140 W TDP 150 W 81% 90% 97% 70% 97% 88% 97% 83% 92% 100% 81% 94%
...
NVIDIA GeForce RTX 2080 Super Mobile
NVIDIA GeForce RTX 3070 Ti Laptop GPU
...
max:
3DMark - 3DMark Cloud Gate Graphics
min: 33126 moyenne: 130456 médian: 141689 (37%) maximum: 181005 Points
GPU TDP ? TDP 90 W TDP 100 W TDP 105 W TDP 110 W TDP 115 W TDP 120 W TDP 125 W TDP 130 W TDP 135 W TDP 140 W TDP 150 W 81% 93% 100% 52% 92% 68% 88% 67% 90% 90% 50% 85%
...
NVIDIA GeForce RTX 2070 Super Mobile
NVIDIA GeForce RTX 3070 Ti Laptop GPU
NVIDIA GeForce RTX 2080 Super Mobile
...
max:
3DMark - 3DMark Fire Strike Standard Score
min: 13606 moyenne: 23800 médian: 24043 (42%) maximum: 28492 Points
GPU TDP ? TDP 90 W TDP 95 W TDP 100 W TDP 105 W TDP 110 W TDP 115 W TDP 120 W TDP 125 W TDP 130 W TDP 135 W TDP 140 W TDP 150 W 87% 85% 84% 93% 90% 94% 92% 85% 94% 96% 97% 100% 100%
...
NVIDIA GeForce RTX 3070 Ti Laptop GPU
...
max:
3DMark - 3DMark Fire Strike Standard Graphics
min: 22612 moyenne: 27554 médian: 27776 (31%) maximum: 32550 Points
GPU TDP ? TDP 90 W TDP 95 W TDP 100 W TDP 105 W TDP 110 W TDP 115 W TDP 120 W TDP 125 W TDP 130 W TDP 135 W TDP 140 W TDP 150 W 88% 78% 80% 87% 84% 89% 86% 81% 87% 91% 92% 100% 97%
...
NVIDIA GeForce RTX 3070 Ti Laptop GPU
...
max:
3DMark - 3DMark Ice Storm Graphics
min: 71049 moyenne: 116608 médian: 124203 (15%) maximum: 154571 Points
GPU TDP 115 W TDP 130 W TDP 150 W 46% 100% 80%
...
NVIDIA GeForce RTX 3070 Ti Laptop GPU
NVIDIA Quadro P620
...
max:
3DMark - 3DMark Wild Life Unlimited
min: 65778 moyenne: 68001 médian: 65913 (33%) maximum: 72313 Points
GPU TDP 115 W TDP 135 W TDP 150 W 91% 91% 100%
...
NVIDIA GeForce RTX 2070 Super Max-Q
NVIDIA GeForce RTX 2070 Super Mobile
NVIDIA GeForce RTX 3070 Ti Laptop GPU
Apple M1 Max 32-Core GPU
...
Apple M1 Max 32-Core GPU
max:
3DMark - 3DMark Wild Life Extreme Unlimited
min: 18372 moyenne: 21359 médian: 21676.5 (25%) maximum: 23709 Points
GPU TDP 95 W TDP 115 W TDP 130 W TDP 150 W 77% 90% 93% 100%
...
Apple M1 Max 24-Core GPU
Apple M1 Max 32-Core GPU
NVIDIA GeForce RTX 3070 Ti Laptop GPU
max:
3DMark - 3DMark Night Raid
min: 35985 moyenne: 42868 médian: 42099.5 (40%) maximum: 51287 Points
GPU TDP 105 W TDP 115 W TDP 135 W TDP 150 W 85% 70% 79% 100%
...
NVIDIA GeForce RTX 3070 Ti Laptop GPU
...
max:
3DMark - 3DMark Night Raid Graphics Score
min: 46335 moyenne: 70518 médian: 73622.5 (28%) maximum: 88491 Points
GPU TDP 105 W TDP 115 W TDP 135 W TDP 150 W 98% 52% 68% 100%
...
NVIDIA GeForce RTX 3070 Ti Laptop GPU
...
max:
3DMark 11 - 3DM11 Performance Score
min: 14168 moyenne: 29851 médian: 30737 (43%) maximum: 34703 Points
GPU TDP ? TDP 90 W TDP 95 W TDP 100 W TDP 105 W TDP 110 W TDP 115 W TDP 120 W TDP 125 W TDP 130 W TDP 135 W TDP 140 W TDP 150 W 84% 85% 83% 84% 73% 92% 95% 87% 89% 94% 96% 100% 95%
...
NVIDIA GeForce RTX 2080 Super Mobile
NVIDIA GeForce RTX 3070 Ti Laptop GPU
...
max:
3DMark 11 - 3DM11 Performance GPU
min: 13799 moyenne: 35944 médian: 36969.5 (32%) maximum: 42569 Points
GPU TDP ? TDP 90 W TDP 95 W TDP 100 W TDP 105 W TDP 110 W TDP 115 W TDP 120 W TDP 125 W TDP 130 W TDP 135 W TDP 140 W TDP 150 W 91% 79% 81% 86% 68% 91% 90% 81% 91% 90% 94% 100% 99%
...
NVIDIA GeForce RTX 2080 Super Mobile
NVIDIA GeForce RTX 3070 Ti Laptop GPU
...
max:
3DMark Vantage + 3DMark Vantage - 3DM Vant. Perf. total
81895 Points (24%)
...
NVIDIA GeForce RTX 2080 Super Mobile
NVIDIA GeForce RTX 2070 Super Mobile
NVIDIA GeForce RTX 3070 Ti Laptop GPU
max:
3DM Vant. Perf. GPU no PhysX + 3DMark Vantage - 3DM Vant. Perf. GPU no PhysX
85672 Points (49%)
...
NVIDIA GeForce RTX 2070 Super Mobile
NVIDIA GeForce RTX 2080 Super Mobile
NVIDIA GeForce RTX 3070 Ti Laptop GPU
max:
3DMark 06 3DMark 06 - Standard 1280x1024 +
min: 43453 moyenne: 49439 médian: 50062 (65%) maximum: 54178 Points
GPU TDP 105 W TDP 110 W TDP 130 W TDP 150 W 100% 90% 95% 80%
...
NVIDIA GeForce RTX 3070 Ti Laptop GPU
max:
Blender - Blender 3.3 Classroom CUDA *
min: 36 moyenne: 41.4 médian: 41 (6%) maximum: 46 Seconds
GPU TDP ? TDP 95 W TDP 110 W TDP 115 W TDP 120 W TDP 125 W TDP 130 W TDP 135 W TDP 150 W 100% 100% 100% 100% 100% 101% 101% 101% 101%
...
NVIDIA GeForce RTX 3070 Ti Laptop GPU
...
Blender - Blender 3.3 Classroom OPTIX *
min: 22 moyenne: 25.3 médian: 25 (9%) maximum: 30 Seconds
GPU TDP ? TDP 95 W TDP 110 W TDP 115 W TDP 120 W TDP 130 W TDP 135 W TDP 150 W 101% 101% 102% 100% 101% 103% 102% 103%
...
NVIDIA GeForce RTX 3070 Ti Laptop GPU
...
Blender - Blender 3.3 Classroom HIP *
380 Seconds (31%)
AMD Radeon 680M
NVIDIA GeForce RTX 3070 Ti Laptop GPU
AMD Radeon 660M
AMD Radeon RX Vega 7
AMD Radeon RX Vega 8 (Ryzen 2000/3000)
SPECviewperf 13 specvp13 sw-04 + SPECviewperf 13 - specvp13 sw-04
103.4 fps (28%)
Intel Iris Plus Graphics G7 (Ice Lake 64 EU)
...
NVIDIA GeForce RTX 3070 Ti Laptop GPU
...
max:
specvp13 snx-03 + SPECviewperf 13 - specvp13 snx-03
19.2 fps (2%)
...
AMD Radeon RX Vega 10
NVIDIA GeForce RTX 3070 Ti Laptop GPU
NVIDIA GeForce RTX 2070 Super Max-Q
NVIDIA GeForce RTX 2070 Super Mobile
...
max:
specvp13 showcase-02 + SPECviewperf 13 - specvp13 showcase-02
130.4 fps (28%)
Intel UHD Graphics 24EUs (Alder Lake-N)
...
NVIDIA GeForce RTX 2080 Super Mobile
NVIDIA GeForce RTX 2070 Super Mobile
NVIDIA GeForce RTX 3070 Ti Laptop GPU
max:
specvp13 medical-02 + SPECviewperf 13 - specvp13 medical-02
67.4 fps (14%)
...
NVIDIA GeForce RTX 2080 Super Mobile
NVIDIA GeForce RTX 3070 Ti Laptop GPU
...
max:
specvp13 maya-05 + SPECviewperf 13 - specvp13 maya-05
270.4 fps (31%)
Intel UHD Graphics 24EUs (Alder Lake-N)
...
NVIDIA GeForce RTX 3070 Ti Laptop GPU
...
max:
specvp13 energy-02 + SPECviewperf 13 - specvp13 energy-02
23 fps (7%)
...
NVIDIA GeForce RTX 2070 Super Mobile
NVIDIA GeForce RTX 2080 Super Mobile
NVIDIA GeForce RTX 3070 Ti Laptop GPU
...
Intel UHD Graphics 24EUs (Alder Lake-N)
specvp13 creo-02 + SPECviewperf 13 - specvp13 creo-02
204.5 fps (30%)
Intel Iris Plus Graphics G7 (Ice Lake 64 EU)
...
NVIDIA GeForce RTX 2080 Super Mobile
NVIDIA GeForce RTX 2070 Super Mobile
NVIDIA GeForce RTX 3070 Ti Laptop GPU
...
max:
specvp13 catia-05 + SPECviewperf 13 - specvp13 catia-05
150.6 fps (17%)
Intel UHD Graphics 24EUs (Alder Lake-N)
...
NVIDIA GeForce RTX 2070 Super Mobile
NVIDIA GeForce RTX 2080 Super Mobile
NVIDIA GeForce RTX 3070 Ti Laptop GPU
...
max:
specvp13 3dsmax-06 + SPECviewperf 13 - specvp13 3dsmax-06
195.1 fps (34%)
Intel UHD Graphics 24EUs (Alder Lake-N)
...
NVIDIA GeForce RTX 2080 Super Mobile
NVIDIA GeForce RTX 2070 Super Mobile
NVIDIA GeForce RTX 3070 Ti Laptop GPU
...
max:
SPECviewperf 2020 specvp2020 solidworks-05 1080p + SPECviewperf 2020 - specvp2020 solidworks-05 1080p
226 fps (44%)
...
NVIDIA GeForce RTX 3070 Ti Laptop GPU
specvp2020 snx-04 1080p + SPECviewperf 2020 - specvp2020 snx-04 1080p
min: 19.92 moyenne: 20.2 médian: 20.2 (3%) maximum: 20.4 fps
GPU TDP 110 W TDP 125 W 100% 98%
NVIDIA GeForce RTX 2070 Super Max-Q
NVIDIA GeForce RTX 3070 Ti Laptop GPU
AMD Radeon RX Vega 7
NVIDIA Quadro P520
...
max:
specvp2020 medical-03 1080p + SPECviewperf 2020 - specvp2020 medical-03 1080p
min: 32.08 moyenne: 32.6 médian: 32.6 (23%) maximum: 33.1 fps
GPU TDP 110 W TDP 125 W 100% 97%
...
NVIDIA GeForce RTX 3070 Ti Laptop GPU
...
max:
specvp2020 maya-06 1080p + SPECviewperf 2020 - specvp2020 maya-06 1080p
334 fps (49%)
...
NVIDIA GeForce RTX 3070 Ti Laptop GPU
max:
specvp2020 energy-03 1080p + SPECviewperf 2020 - specvp2020 energy-03 1080p
min: 23.6 moyenne: 23.7 médian: 23.7 (19%) maximum: 23.8 fps
GPU TDP 110 W TDP 125 W 99% 100%
...
NVIDIA GeForce RTX 2070 Super Max-Q
NVIDIA GeForce RTX 3070 Ti Laptop GPU
...
max:
specvp2020 creo-03 1080p + SPECviewperf 2020 - specvp2020 creo-03 1080p
95 fps (47%)
...
NVIDIA GeForce RTX 2070 Super Max-Q
NVIDIA GeForce RTX 3070 Ti Laptop GPU
...
max:
specvp2020 catia-06 1080p + SPECviewperf 2020 - specvp2020 catia-06 1080p
min: 63.58 moyenne: 64.5 médian: 64.5 (42%) maximum: 65.5 fps
GPU TDP 110 W TDP 125 W 100% 97%
...
NVIDIA GeForce RTX 3070 Ti Laptop GPU
...
max:
specvp2020 3dsmax-07 1080p + SPECviewperf 2020 - specvp2020 3dsmax-07 1080p
min: 95.55 moyenne: 97 médian: 97 (44%) maximum: 98.5 fps
GPU TDP 110 W TDP 125 W 100% 97%
...
NVIDIA GeForce RTX 2070 Super Max-Q
NVIDIA GeForce RTX 3070 Ti Laptop GPU
...
max:
Cinebench R10 Cinebench R10 Shading (32bit) + Cinebench R10 - Cinebench R10 Shading (32bit)
min: 15906 moyenne: 17947 médian: 17947 (13%) maximum: 19988 points
GPU TDP 105 W TDP 150 W 100% 80%
...
NVIDIA GeForce RTX 3070 Ti Laptop GPU
...
Cinebench R11.5 Cinebench R11.5 OpenGL 64 Bit + Cinebench R11.5 - Cinebench R11.5 OpenGL 64 Bit
min: 93.54 moyenne: 132 médian: 132 (46%) maximum: 170.5 fps
GPU TDP 105 W TDP 150 W 100% 55%
...
NVIDIA Quadro P620
NVIDIA GeForce RTX 3070 Ti Laptop GPU
...
max:
Cinebench R15 + Cinebench R15 - Cinebench R15 OpenGL 64 Bit
min: 98.7 moyenne: 196.9 médian: 201.5 (12%) maximum: 276 fps
GPU TDP ? TDP 90 W TDP 95 W TDP 100 W TDP 105 W TDP 110 W TDP 115 W TDP 120 W TDP 125 W TDP 130 W TDP 135 W TDP 150 W 71% 80% 46% 67% 76% 77% 84% 100% 50% 80% 72% 65%
...
NVIDIA GeForce RTX 3070 Ti Laptop GPU
...
Cinebench R15 OpenGL Ref. Match 64 Bit + Cinebench R15 - Cinebench R15 OpenGL Ref. Match 64 Bit
min: 97.8 moyenne: 99.6 médian: 99.6 (100%) maximum: 99.62 %
GPU TDP ? TDP 90 W TDP 95 W TDP 100 W TDP 105 W TDP 110 W TDP 115 W TDP 120 W TDP 125 W TDP 130 W TDP 135 W TDP 150 W 100% 100% 98% 100% 100% 100% 100% 100% 100% 100% 100% 100%
...
NVIDIA GeForce RTX 3070 Ti Laptop GPU
...
NVIDIA GeForce GTX 1070 Mobile
LuxMark v2.0 64Bit - LuxMark v2.0 Room GPU
3623 Samples/s (16%)
...
NVIDIA GeForce GTX 1070 Mobile
NVIDIA GeForce RTX 3070 Ti Laptop GPU
NVIDIA GeForce RTX 2080 Super Mobile
...
max:
LuxMark v2.0 64Bit - LuxMark v2.0 Sala GPU
8022 Samples/s (14%)
...
NVIDIA GeForce RTX 3070 Ti Laptop GPU
NVIDIA GeForce RTX 2080 Super Mobile
...
max:
ComputeMark v2.1 - ComputeMark v2.1 Result
22796 points (25%)
...
NVIDIA GeForce RTX 3070 Ti Laptop GPU
...
max:
Power Consumption - Furmark Stress Test Power Consumption - external Monitor *
min: 123.6 moyenne: 175.1 médian: 190 (27%) maximum: 211 Watt
GPU TDP ? TDP 90 W TDP 95 W TDP 100 W TDP 105 W TDP 110 W TDP 115 W TDP 120 W TDP 125 W TDP 130 W TDP 135 W TDP 140 W TDP 150 W 100% 118% 118% 112% 114% 115% 110% 116% 109% 103% 102% 103% 103%
...
NVIDIA GeForce RTX 2070 Super Mobile
NVIDIA GeForce RTX 3070 Ti Laptop GPU
...
max:
0 15 30 45 60 75 90 105 120 135 150 165 180 195 210 225 Tooltip MSI Creator Z17 A12UGST-054: Ø123.6 (120.5-134.7)
SCHENKER Vision 16 Pro RTX 3070 Ti: Ø124.7 (119.7-146.9)
Asus ROG Zephyrus M16 GU603Z: Ø130.6 (127.18-136.05)
MSI Stealth GS66 12UGS: Ø132.6 (129-138)
Razer Blade 15 OLED (Early 2022): Ø137.1 (132.4-160.1)
MSI Katana GF66 12UGS: Ø144 (142-146)
Asus ProArt StudioBook 16 H7600ZW: Ø150.6 (146.8-169.3)
Razer Blade 14 Ryzen 9 6900HX: Ø150.8 (147.1-159.1)
MSI Katana GF76 12UGS: Ø151.2 (145.27-156.15)
Asus ROG Flow X16 GV601RW-M5082W: Ø168.6 (159.3-207)
HP Omen 16-b1090ng: Ø173.3 (168.2-208)
SCHENKER XMG Neo 15 (Ryzen 9 6900HX, RTX 3070 Ti): Ø180.3 (173.85-184.8)
Acer Nitro 5 AN515-58-72QR: Ø183.2 (176-189.3)
Aorus 17 XE4: Ø190.1 (186-193)
MSI Vector GP76 12UGS-434: Ø190.9 (183-198)
Aorus 15 XE5: Ø191.4 (187.6-196.6)
Asus ROG Strix Scar 15 G533ZW-LN106WS: Ø192 (185.1-208)
Acer Nitro 5 AN515-46-R1A1: Ø192.6 (181.7-224)
Lenovo Legion 5 Pro 16ARH7H RTX 3070 Ti: Ø192.6 (185-198.4)
Eurocom Raptor X15: Ø194.5 (187.6-228)
Razer Blade 17 (i7-12800H, RTX 3070 Ti): Ø200 (196.64-207.52)
HP Omen 17-ck1075ng: Ø200 (195.4-210)
Acer Predator Helios 300 (i7-12700H, RTX 3070 Ti): Ø200 (193.51-205.81)
Lenovo Legion 5 Pro 16 G7 i7 RTX 3070Ti: Ø205 (199-212)
MSI GE67 HX 12UGS: Ø208 (201-239)
Aorus 17X XES: Ø209 (203-214)
MSI Vector GP66 12UGS: Ø211 (205-217)
Power Consumption - The Witcher 3 Power Consumption - external Monitor *
min: 115 moyenne: 181 médian: 191 (27%) maximum: 234 Watt
GPU TDP ? TDP 90 W TDP 95 W TDP 100 W TDP 105 W TDP 110 W TDP 115 W TDP 120 W TDP 130 W TDP 135 W TDP 140 W TDP 150 W 100% 116% 115% 113% 116% 116% 110% 118% 105% 104% 101% 105%
...
NVIDIA GeForce RTX 3070 Ti Laptop GPU
...
max:
0 15 30 45 60 75 90 105 120 135 150 165 180 195 210 225 240 Tooltip Razer Blade 17 (i7-12800H, RTX 3070 Ti): Ø115.1 (112.72-119.98)
Asus ROG Zephyrus M16 GU603Z: Ø134.4 (129.69-138.76)
MSI Stealth GS66 12UGS: Ø136.8 (132-146)
MSI Katana GF66 12UGS: Ø143.1 (141-148)
Razer Blade 15 OLED (Early 2022): Ø143.3 (134.9-149.9)
MSI Creator Z17 A12UGST-054: Ø145.4 (142-151.5)
SCHENKER Vision 16 Pro RTX 3070 Ti: Ø148.9 (145.7-154.3)
MSI Katana GF76 12UGS: Ø115.1 (112.72-119.98)
Razer Blade 14 Ryzen 9 6900HX: Ø156.7 (154.9-159.5)
Asus ProArt StudioBook 16 H7600ZW: Ø169.1 (164.2-175.7)
HP Omen 16-b1090ng: Ø177.3 (172.7-185.6)
Acer Nitro 5 AN515-58-72QR: Ø184.7 (152.6-191.3)
Aorus 17 XE4: Ø190.9 (186-207)
SCHENKER XMG Neo 15 (Ryzen 9 6900HX, RTX 3070 Ti): Ø193.3 (191.07-195.82)
Aorus 15 XE5: Ø193.7 (188.5-206)
HP Omen 17-ck1075ng: Ø205 (198.5-223.1)
Acer Nitro 5 AN515-46-R1A1: Ø204 (173.7-209)
Asus ROG Strix Scar 15 G533ZW-LN106WS: Ø207 (177-234)
Lenovo Legion 5 Pro 16ARH7H RTX 3070 Ti: Ø210 (203-221)
Aorus 17X XES: Ø213 (206-234)
Acer Predator Helios 300 (i7-12700H, RTX 3070 Ti): Ø215 (210.4-226.36)
Eurocom Raptor X15: Ø216 (212-232)
Lenovo Legion 5 Pro 16 G7 i7 RTX 3070Ti: Ø217 (210-228)
MSI Vector GP66 12UGS: Ø223 (219-232)
MSI GE67 HX 12UGS: Ø234 (230-248)
Power Consumption - Witcher 3 Power Consumption *
min: 144 moyenne: 190 médian: 196.1 (43%) maximum: 237 Watt
GPU TDP ? TDP 90 W TDP 95 W TDP 100 W TDP 105 W TDP 110 W TDP 115 W TDP 120 W TDP 125 W TDP 130 W TDP 135 W TDP 140 W TDP 150 W 100% 132% 130% 129% 131% 133% 120% 129% 118% 108% 107% 103% 106%
...
NVIDIA GeForce GTX 1070 Mobile
NVIDIA GeForce RTX 3070 Ti Laptop GPU
NVIDIA GeForce RTX 2070 Super Mobile
AMD Radeon RX 580 (Laptop)
...
0 15 30 45 60 75 90 105 120 135 150 165 180 195 210 225 240 255 Tooltip Asus ROG Zephyrus M16 GU603Z: Ø143.7 (127.65-153.76)
MSI Katana GF66 12UGS: Ø148.6 (147-152)
Razer Blade 15 OLED (Early 2022): Ø149.6 (124.3-155)
MSI Stealth GS66 12UGS: Ø150.5 (145-169)
MSI Creator Z17 A12UGST-054: Ø152.5 (145.9-158.7)
SCHENKER Vision 16 Pro RTX 3070 Ti: Ø155.2 (151.5-160.3)
Razer Blade 14 Ryzen 9 6900HX: Ø158.7 (156.5-165.3)
MSI Katana GF76 12UGS: Ø159.4 (61.52-179.88)
Asus ProArt StudioBook 16 H7600ZW: Ø172.6 (168.8-179.4)
Asus ROG Zephyrus M16 GU603Z: Ø175.5 (172.3-181.1)
HP Omen 16-b1090ng: Ø183.2 (177.5-197)
Asus ROG Flow X16 GV601RW-M5082W: Ø183.6 (161.2-190.7)
Acer Nitro 5 AN515-58-72QR: Ø195.1 (188.6-206)
Aorus 17 XE4: Ø196 (187-208)
Asus ROG Strix Scar 15 G533ZW-LN106WS: Ø196.2 (171.4-222)
MSI Vector GP76 12UGS-434: Ø199.2 (192-210)
SCHENKER XMG Neo 15 (Ryzen 9 6900HX, RTX 3070 Ti): Ø200 (192.94-225.82)
Aorus 15 XE5: Ø202 (197.6-211)
Acer Nitro 5 AN515-46-R1A1: Ø203 (180.5-209)
HP Omen 17-ck1075ng: Ø210 (204.193-220.129)
Lenovo Legion 5 Pro 16ARH7H RTX 3070 Ti: Ø209 (199.1-224)
Razer Blade 17 (i7-12800H, RTX 3070 Ti): Ø218 (81.62-248.22)
Eurocom Raptor X15: Ø219 (216-245)
Aorus 17X XES: Ø221 (214-242)
MSI Vector GP66 12UGS: Ø225 (221-237)
Lenovo Legion 5 Pro 16 G7 i7 RTX 3070Ti: Ø227 (220-238)
Acer Predator Helios 300 (i7-12700H, RTX 3070 Ti): Ø231 (219.64-251.66)
MSI GE67 HX 12UGS: Ø237 (232-262)
Power Consumption - Witcher 3 ultra Power Efficiency
min: 0.424 moyenne: 0.5 médian: 0.5 (53%) maximum: 0.691 fps per Watt
GPU TDP ? TDP 90 W TDP 95 W TDP 100 W TDP 105 W TDP 115 W TDP 120 W TDP 125 W TDP 130 W TDP 135 W TDP 140 W TDP 150 W 74% 86% 79% 87% 88% 83% 100% 77% 69% 72% 74% 76%
...
NVIDIA GeForce RTX 3070 Ti Laptop GPU
...
Apple M2 10-Core GPU
0 15 30 45 60 75 90 105 120 135 150 165 180 195 Tooltip MSI Vector GP76 12UGS-434: Ø191.2 (185-201)
Power Consumption - Witcher 3 ultra Power Efficiency - external Monitor
min: 0.4399 moyenne: 0.6 médian: 0.6 (46%) maximum: 0.97 fps per Watt
GPU TDP ? TDP 90 W TDP 95 W TDP 100 W TDP 105 W TDP 115 W TDP 120 W TDP 130 W TDP 135 W TDP 140 W TDP 150 W 69% 84% 77% 82% 87% 79% 100% 66% 68% 69% 78%
...
NVIDIA GeForce RTX 3070 Ti Laptop GPU
...
Emissions Witcher 3 Fan Noise + Emissions - Witcher 3 Fan Noise
min: 42.1 moyenne: 52 médian: 52.2 (84%) maximum: 62.48 dB(A)
GPU TDP ? TDP 90 W TDP 95 W TDP 100 W TDP 105 W TDP 115 W TDP 120 W TDP 130 W TDP 135 W TDP 140 W TDP 150 W 100% 93% 88% 72% 81% 88% 84% 90% 90% 88% 94%
...
NVIDIA GeForce RTX 3070 Ti Laptop GPU
NVIDIA GeForce RTX 2070 Super Mobile
AMD Radeon RX 580 (Laptop)
NVIDIA GeForce RTX 2080 Super Mobile
...
Clock Speed - GPU Clock Witcher 3 ultra
min: 1155 moyenne: 1341 médian: 1393 (55%) maximum: 1410 MHz
GPU TDP 105 W TDP 115 W TDP 130 W TDP 150 W 88% 100% 100% 99%
...
NVIDIA GeForce RTX 3070 Ti Laptop GPU
NVIDIA GeForce RTX 2070 Super Max-Q
NVIDIA GeForce GTX 1050 Ti Max-Q
...
Clock Speed - GPU Clock Speed Furmark
min: 735 moyenne: 1155 médian: 1154.5 (46%) maximum: 1574 MHz
GPU TDP 105 W TDP 150 W 47% 100%
...
AMD Radeon RX Vega 8 (Ryzen 2000/3000)
NVIDIA GeForce RTX 2070 Super Mobile
NVIDIA GeForce RTX 3070 Ti Laptop GPU
AMD Radeon RX 560X (Laptop)
...
max:
AMD Radeon RX 6700 XT
- Amplitude des valeurs obtenues dans le benchmark avec cette carte graphique
- Valeur moyenne obtenue dans le benchmark avec cette carte graphique
* Plus les chiffres sont petits, plus les performances sont élevées
Benchmarks de jeux Les benchmarks qui suivent sont tirés de tests effectués dans nos critiques des ordinateurs portables. Les performances dépendent du type et de la quantité de mémoire graphique embaquée, mais aussi de sa fréquence, du processeur, des paramètres système, des pilotes et du système d'exploitation. Les résultats ne sont donc pas représentatifs de tous les appareils intégrant cette carte graphique. Pour plus de détails sur les résultats, cliquez sur le nombre d'images par seconde.
...
NVIDIA GeForce RTX 3070 Ti Laptop GPU
max:
...
NVIDIA GeForce RTX 3070 Ti Laptop GPU
...
max:
...
NVIDIA GeForce RTX 3070 Ti Laptop GPU
max:
NVIDIA GeForce RTX 3070 Ti Laptop GPU
max:
NVIDIA GeForce RTX 3070 Ti Laptop GPU
max:
NVIDIA GeForce RTX 3070 Ti Laptop GPU
max:
» Jouable avec tous les ordinateurs portables testés avec les détails paramétrés sur Ultra.
...
NVIDIA GeForce RTX 3070 Ti Laptop GPU
max:
...
NVIDIA GeForce RTX 3070 Ti Laptop GPU
max:
...
NVIDIA GeForce RTX 3070 Ti Laptop GPU
...
max:
NVIDIA GeForce RTX 3070 Ti Laptop GPU
max:
NVIDIA GeForce RTX 3070 Ti Laptop GPU
max:
NVIDIA GeForce RTX 3070 Ti Laptop GPU
max:
» Jouable avec tous les ordinateurs portables testés avec les détails paramétrés sur Ultra.
AMD Radeon 680M
NVIDIA GeForce RTX 3070 Ti Laptop GPU
...
max:
AMD Radeon 680M
NVIDIA GeForce RTX 3070 Ti Laptop GPU
...
max:
...
NVIDIA GeForce RTX 3070 Ti Laptop GPU
...
max:
0 100 Tooltip : Ø131.2 (116.382-146.92)
NVIDIA GeForce RTX 3070 Ti Laptop GPU
max:
NVIDIA GeForce RTX 3070 Ti Laptop GPU
max:
» Jouable avec tous les ordinateurs portables testés avec les détails paramétrés sur Ultra.
...
NVIDIA GeForce RTX 3070 Ti Laptop GPU
...
max:
...
NVIDIA GeForce RTX 3070 Ti Laptop GPU
...
max:
...
NVIDIA GeForce RTX 3070 Ti Laptop GPU
max:
...
NVIDIA GeForce RTX 3070 Ti Laptop GPU
...
max:
...
NVIDIA GeForce RTX 3070 Ti Laptop GPU
...
max:
» Jouable avec tous les ordinateurs portables testés avec les détails paramétrés sur Ultra.
Additional Benchmarks
Ray Tracing Ultra Preset (DLSS off) 1920x1080
36.7 [X] Acer Predator Helios 300 PH315-55 Intel Core i7-12700H 1.7GHz
GeForce RTX 3070 Ti Laptop GPU
min:
25 fps
...
NVIDIA GeForce RTX 3070 Ti Laptop GPU
max:
...
NVIDIA GeForce RTX 3070 Ti Laptop GPU
...
max:
...
NVIDIA GeForce RTX 3070 Ti Laptop GPU
max:
NVIDIA GeForce RTX 3070 Ti Laptop GPU
...
max:
NVIDIA GeForce RTX 3070 Ti Laptop GPU
max:
0 100 200 300 400 500 600 Tooltip
NVIDIA GeForce RTX 3070 Ti Laptop GPU
max:
» Jouable avec tous les ordinateurs portables testés avec les détails paramétrés sur Ultra.
...
NVIDIA GeForce RTX 3070 Ti Laptop GPU
...
max:
...
NVIDIA GeForce RTX 3070 Ti Laptop GPU
...
max:
...
NVIDIA GeForce RTX 3070 Ti Laptop GPU
...
max:
NVIDIA GeForce RTX 3070 Ti Laptop GPU
...
max:
NVIDIA GeForce RTX 3070 Ti Laptop GPU
max:
» Jouable avec tous les ordinateurs portables testés avec les détails paramétrés sur Ultra.
...
NVIDIA GeForce RTX 3070 Ti Laptop GPU
max:
...
NVIDIA GeForce RTX 3070 Ti Laptop GPU
max:
...
NVIDIA GeForce RTX 3070 Ti Laptop GPU
max:
0 100 200 300 400 500 600 700 800 900 1000 1100 1200 1300 1400 1500 1600 1700 1800 1900 2000 2100 2200 2300 2400 2500 2600 2700 2800 2900 3000 3100 3200 3300 3400 3500 3600 3700 3800 3900 4000 4100 4200 4300 4400 4500 4600 4700 4800 4900 5000 5100 5200 5300 5400 5500 5600 5700 5800 5900 6000 6100 6200 6300 6400 6500 6600 6700 6800 6900 Tooltip
NVIDIA GeForce RTX 3070 Ti Laptop GPU
max:
NVIDIA GeForce RTX 3070 Ti Laptop GPU
max:
» Jouable avec tous les ordinateurs portables testés avec les détails paramétrés sur Ultra.
...
NVIDIA GeForce RTX 3070 Ti Laptop GPU
max:
...
NVIDIA GeForce RTX 3070 Ti Laptop GPU
max:
...
NVIDIA GeForce RTX 3070 Ti Laptop GPU
max:
NVIDIA GeForce RTX 3070 Ti Laptop GPU
max:
NVIDIA GeForce RTX 3070 Ti Laptop GPU
max:
» Jouable avec tous les ordinateurs portables testés avec les détails paramétrés sur Ultra.
...
NVIDIA GeForce RTX 3070 Ti Laptop GPU
max:
...
NVIDIA GeForce RTX 3070 Ti Laptop GPU
max:
NVIDIA GeForce RTX 3070 Ti Laptop GPU
max:
NVIDIA GeForce RTX 3070 Ti Laptop GPU
max:
» Jouable avec tous les ordinateurs portables testés avec les détails paramétrés sur Ultra.
0 100 200 300 400 500 600 700 800 900 1000 1100 1200 1300 1400 1500 1600 1700 1800 1900 2000 2100 2200 Tooltip
...
NVIDIA GeForce RTX 3070 Ti Laptop GPU
max:
0 100 Tooltip : Ø120.3 (111.044-130.67)
...
NVIDIA GeForce RTX 3070 Ti Laptop GPU
max:
...
NVIDIA GeForce RTX 3070 Ti Laptop GPU
max:
NVIDIA GeForce RTX 3070 Ti Laptop GPU
max:
NVIDIA GeForce RTX 3070 Ti Laptop GPU
max:
» Jouable avec tous les ordinateurs portables testés avec les détails paramétrés sur Ultra.
...
NVIDIA GeForce RTX 3070 Ti Laptop GPU
max:
...
NVIDIA GeForce RTX 3070 Ti Laptop GPU
max:
...
NVIDIA GeForce RTX 3070 Ti Laptop GPU
max:
...
NVIDIA GeForce RTX 3070 Ti Laptop GPU
max:
...
NVIDIA GeForce RTX 3070 Ti Laptop GPU
max:
NVIDIA GeForce RTX 3070 Ti Laptop GPU
max:
» Jouable avec tous les ordinateurs portables testés avec les détails paramétrés sur Ultra.
...
AMD Radeon 680M
NVIDIA GeForce RTX 3070 Ti Laptop GPU
max:
AMD Radeon RX 560X (Laptop)
...
AMD Radeon 680M
NVIDIA GeForce RTX 3070 Ti Laptop GPU
max:
...
NVIDIA GeForce RTX 3070 Ti Laptop GPU
max:
NVIDIA GeForce RTX 3070 Ti Laptop GPU
max:
NVIDIA GeForce RTX 3070 Ti Laptop GPU
max:
» Jouable avec tous les ordinateurs portables testés avec les détails paramétrés sur Ultra.
Additional Benchmarks
Very High Preset + Very High Raytracing TAA 1920x1080
38.3 [X] Acer Predator Helios 300 PH315-55 Intel Core i7-12700H 1.7GHz
GeForce RTX 3070 Ti Laptop GPU
min:
1.283 fps, P0.1:
3.92 fps, P1:
17.7 fps, max:
74.5 fps
...
NVIDIA GeForce RTX 3070 Ti Laptop GPU
max:
Intel UHD Graphics Xe 16EUs (Tiger Lake-H)
...
NVIDIA GeForce RTX 3070 Ti Laptop GPU
max:
...
NVIDIA GeForce RTX 3070 Ti Laptop GPU
max:
...
NVIDIA GeForce RTX 3070 Ti Laptop GPU
max:
NVIDIA GeForce RTX 3070 Ti Laptop GPU
...
max:
» Jouable avec tous les ordinateurs portables testés avec les détails paramétrés sur Ultra.
...
NVIDIA GeForce RTX 3070 Ti Laptop GPU
max:
...
NVIDIA GeForce RTX 3070 Ti Laptop GPU
max:
...
NVIDIA GeForce RTX 3070 Ti Laptop GPU
max:
...
NVIDIA GeForce RTX 3070 Ti Laptop GPU
max:
NVIDIA GeForce RTX 3070 Ti Laptop GPU
max:
NVIDIA GeForce RTX 3070 Ti Laptop GPU
max:
» Jouable avec tous les ordinateurs portables testés avec les détails paramétrés sur Ultra.
...
NVIDIA GeForce RTX 3070 Ti Laptop GPU
max:
AMD Radeon RX 560X (Laptop)
...
NVIDIA GeForce RTX 3070 Ti Laptop GPU
...
max:
...
NVIDIA GeForce RTX 3070 Ti Laptop GPU
max:
...
NVIDIA GeForce RTX 3070 Ti Laptop GPU
...
max:
NVIDIA GeForce RTX 3070 Ti Laptop GPU
max:
» Jouable avec tous les ordinateurs portables testés avec les détails paramétrés sur Ultra.
AMD Radeon RX Vega 8 (Ryzen 2000/3000)
...
NVIDIA GeForce RTX 3070 Ti Laptop GPU
max:
...
NVIDIA GeForce RTX 3070 Ti Laptop GPU
max:
...
NVIDIA GeForce RTX 3070 Ti Laptop GPU
max:
NVIDIA GeForce RTX 3070 Ti Laptop GPU
max:
NVIDIA GeForce RTX 3070 Ti Laptop GPU
max:
» Jouable avec tous les ordinateurs portables testés avec les détails paramétrés sur Ultra.
...
NVIDIA GeForce RTX 3070 Ti Laptop GPU
max:
...
NVIDIA GeForce RTX 3070 Ti Laptop GPU
max:
...
NVIDIA GeForce RTX 3070 Ti Laptop GPU
max:
NVIDIA GeForce RTX 3070 Ti Laptop GPU
max:
NVIDIA GeForce RTX 3070 Ti Laptop GPU
max:
» Jouable avec tous les ordinateurs portables testés avec les détails paramétrés sur Ultra.
AMD Radeon RX Vega 8 (Ryzen 2000/3000)
...
NVIDIA GeForce RTX 3070 Ti Laptop GPU
max:
...
NVIDIA GeForce RTX 3070 Ti Laptop GPU
max:
...
NVIDIA GeForce RTX 3070 Ti Laptop GPU
max:
NVIDIA GeForce RTX 3070 Ti Laptop GPU
max:
NVIDIA GeForce RTX 3070 Ti Laptop GPU
max:
» Jouable avec tous les ordinateurs portables testés avec les détails paramétrés sur Ultra.
...
NVIDIA GeForce RTX 3070 Ti Laptop GPU
max:
...
NVIDIA GeForce RTX 3070 Ti Laptop GPU
max:
...
NVIDIA GeForce RTX 3070 Ti Laptop GPU
max:
...
NVIDIA GeForce RTX 3070 Ti Laptop GPU
max:
NVIDIA GeForce RTX 3070 Ti Laptop GPU
max:
» Jouable avec tous les ordinateurs portables testés avec les détails paramétrés sur Ultra.
...
NVIDIA GeForce RTX 3070 Ti Laptop GPU
...
max:
...
NVIDIA GeForce RTX 3070 Ti Laptop GPU
max:
0 100 200 300 400 500 600 700 800 900 1000 1100 Tooltip
...
NVIDIA GeForce RTX 3070 Ti Laptop GPU
max:
...
NVIDIA GeForce RTX 3070 Ti Laptop GPU
max:
NVIDIA GeForce RTX 3070 Ti Laptop GPU
max:
» Jouable avec tous les ordinateurs portables testés avec les détails paramétrés sur Ultra.
...
NVIDIA GeForce RTX 3070 Ti Laptop GPU
max:
...
NVIDIA GeForce RTX 3070 Ti Laptop GPU
max:
...
NVIDIA GeForce RTX 3070 Ti Laptop GPU
max:
...
NVIDIA GeForce RTX 3070 Ti Laptop GPU
max:
...
NVIDIA GeForce RTX 3070 Ti Laptop GPU
max:
» Jouable avec tous les ordinateurs portables testés avec les détails paramétrés sur Ultra.
0 100 Tooltip Blade 15 OLED (Early 2022): Ø100.6 (79.306-200)
Intel UHD Graphics G1 (Ice Lake 32 EU)
...
NVIDIA GeForce RTX 3070 Ti Laptop GPU
...
max:
0 100 Tooltip Blade 15 OLED (Early 2022): Ø85.1 (66.134-192.7)
...
NVIDIA GeForce RTX 3070 Ti Laptop GPU
...
max:
0 Tooltip Blade 15 OLED (Early 2022): Ø72 (57.239-92.5)
...
NVIDIA GeForce RTX 3070 Ti Laptop GPU
...
max:
0 100 Tooltip Blade 15 OLED (Early 2022): Ø64 (47.289-125.5)
...
NVIDIA GeForce RTX 3070 Ti Laptop GPU
max:
0 Tooltip Blade 15 OLED (Early 2022): Ø47.3 (37.13-69.3)
NVIDIA GeForce RTX 3070 Ti Laptop GPU
max:
» Jouable avec tous les ordinateurs portables testés avec les détails paramétrés sur Ultra.
Additional Benchmarks
Low Preset Low TAA 1280x720
Ultra Preset + Full Ray Tracing High TAA 1920x1080
0 100 Tooltip Blade 15 OLED (Early 2022): Ø86 (70.265-144)
Intel UHD Graphics Xe 16EUs (Tiger Lake-H)
...
NVIDIA GeForce RTX 3070 Ti Laptop GPU
max:
0 Tooltip Blade 15 OLED (Early 2022): Ø74.6 (63.764-88.986)
...
NVIDIA GeForce RTX 3070 Ti Laptop GPU
max:
0 100 Tooltip Blade 15 OLED (Early 2022): Ø76 (61.178-139.1)
AMD Radeon RX 560X (Laptop)
...
NVIDIA GeForce RTX 3070 Ti Laptop GPU
max:
0 Tooltip Blade 15 OLED (Early 2022): Ø69.4 (60.137-91.5)
...
NVIDIA GeForce RTX 3070 Ti Laptop GPU
max:
0 100 Tooltip Blade 15 OLED (Early 2022): Ø51.8 (42.372-125.6)
...
NVIDIA GeForce RTX 3070 Ti Laptop GPU
max:
» Jouable avec tous les ordinateurs portables testés avec les détails paramétrés sur Ultra.
Additional Benchmarks
Low Preset TAA 1280x720
0 100 200 Tooltip Blade 15 OLED (Early 2022): Ø178 (154.671-220.55)
...
NVIDIA GeForce RTX 3070 Ti Laptop GPU
max:
0 100 Tooltip Blade 15 OLED (Early 2022): Ø153.6 (132.19-175.36)
...
NVIDIA GeForce RTX 3070 Ti Laptop GPU
max:
0 100 Tooltip Blade 15 OLED (Early 2022): Ø85.2 (73.059-160.4)
...
NVIDIA GeForce RTX 3070 Ti Laptop GPU
...
max:
0 100 Tooltip Blade 15 OLED (Early 2022): Ø77.9 (60.203-173.1)
...
NVIDIA GeForce RTX 3070 Ti Laptop GPU
...
max:
0 Tooltip Blade 15 OLED (Early 2022): Ø49.9 (42.646-70.8)
NVIDIA GeForce RTX 3070 Ti Laptop GPU
...
max:
» Jouable avec tous les ordinateurs portables testés avec les détails paramétrés sur Ultra.
Additional Benchmarks
Low Preset / Off 1280x720
RT Ultra Preset / On FXAA 1920x1080
0 100 200 300 400 500 Tooltip Blade 15 OLED (Early 2022): Ø191.1 (150.04-509)
Intel UHD Graphics Xe 16EUs (Tiger Lake-H)
...
NVIDIA GeForce RTX 3070 Ti Laptop GPU
...
max:
0 100 200 300 400 500 Tooltip Blade 15 OLED (Early 2022): Ø157.2 (106.1-522)
...
NVIDIA GeForce RTX 3070 Ti Laptop GPU
max:
0 100 Tooltip Blade 15 OLED (Early 2022): Ø121.1 (85.053-153.4)
...
NVIDIA GeForce RTX 3070 Ti Laptop GPU
max:
0 100 Tooltip Blade 15 OLED (Early 2022): Ø103.8 (82.18-158.1)
...
NVIDIA GeForce RTX 3070 Ti Laptop GPU
max:
0 100 Tooltip Blade 15 OLED (Early 2022): Ø64.3 (43.658-109.6)
NVIDIA GeForce RTX 3070 Ti Laptop GPU
max:
» Jouable avec tous les ordinateurs portables testés avec les détails paramétrés sur Ultra.
Additional Benchmarks
Low Preset 1280x720
...
NVIDIA GeForce RTX 3070 Ti Laptop GPU
max:
...
NVIDIA GeForce RTX 3070 Ti Laptop GPU
max:
...
NVIDIA GeForce RTX 3070 Ti Laptop GPU
max:
...
NVIDIA GeForce RTX 3070 Ti Laptop GPU
...
max:
NVIDIA GeForce RTX 3070 Ti Laptop GPU
...
max:
» Jouable avec tous les ordinateurs portables testés avec les détails paramétrés sur Ultra.
Additional Benchmarks
Low Preset (without FSR Upscaling) 1280x720
0 100 Tooltip Blade 15 OLED (Early 2022): Ø115 (103.1-126.21)
...
NVIDIA GeForce RTX 3070 Ti Laptop GPU
max:
0 100 200 Tooltip Blade 15 OLED (Early 2022): Ø117 (97.444-292.1)
...
NVIDIA GeForce RTX 3070 Ti Laptop GPU
max:
0 100 Tooltip Blade 15 OLED (Early 2022): Ø96.5 (82.496-113.6)
...
NVIDIA GeForce RTX 3070 Ti Laptop GPU
max:
0 100 200 300 400 500 600 700 800 900 1000 1100 1200 1300 1400 1500 1600 1700 1800 1900 2000 2100 2200 2300 2400 2500 2600 2700 Tooltip Blade 15 OLED (Early 2022): Ø163.5 (73.631-2794)
...
NVIDIA GeForce RTX 3070 Ti Laptop GPU
max:
0 Tooltip Blade 15 OLED (Early 2022): Ø68.8 (60.05-76.6)
NVIDIA GeForce RTX 3070 Ti Laptop GPU
max:
» Jouable avec tous les ordinateurs portables testés avec les détails paramétrés sur Ultra.
Additional Benchmarks
Low Preset 1280x720
0 100 200 300 400 Tooltip Blade 15 OLED (Early 2022): Ø137 (100.028-487)
15 XE5: Ø114.5 (95.614-165.2)
Intel UHD Graphics Xe 16EUs (Tiger Lake-H)
...
NVIDIA GeForce RTX 3070 Ti Laptop GPU
max:
0 100 200 300 400 500 600 700 800 900 1000 1100 1200 Tooltip Blade 15 OLED (Early 2022): Ø130.9 (91.67-639)
15 XE5: Ø151.2 (96.55-1267)
...
NVIDIA GeForce RTX 3070 Ti Laptop GPU
max:
0 100 200 300 Tooltip 15 XE5: Ø94 (87.49-102.16)
Blade 15 OLED (Early 2022): Ø108.7 (89.174-357)
...
NVIDIA GeForce RTX 3070 Ti Laptop GPU
max:
0 100 Tooltip 15 XE5: Ø93 (75.178-113)
Blade 15 OLED (Early 2022): Ø96.9 (85.528-141.2)
...
NVIDIA GeForce RTX 3070 Ti Laptop GPU
max:
0 100 Tooltip Blade 15 OLED (Early 2022): Ø73.9 (65.029-130.6)
15 XE5: Ø75.3 (66.856-87.823)
...
NVIDIA GeForce RTX 3070 Ti Laptop GPU
...
max:
» Jouable avec tous les ordinateurs portables testés avec les détails paramétrés sur Ultra.
Additional Benchmarks
Very Low Preset 1280x720
122.3 [X] Aorus 15 XE5 Intel Core i7-12700H 1.7GHz
GeForce RTX 3070 Ti Laptop GPU
min:
55.4 fps, P0.1:
65.7 fps, P1:
87.2 fps, max:
177.2 fps
Very High Preset + Ray-Tracing TAA 1920x0180
54.3 [X] Aorus 15 XE5 Intel Core i7-12700H 1.7GHz
GeForce RTX 3070 Ti Laptop GPU
min:
25.3 fps, P0.1:
27.9 fps, P1:
37.7 fps, max:
98.4 fps
...
NVIDIA GeForce RTX 3070 Ti Laptop GPU
max:
...
NVIDIA GeForce RTX 3070 Ti Laptop GPU
...
max:
AMD Radeon RX Vega 8 (Ryzen 2000/3000)
...
AMD Radeon 680M
NVIDIA GeForce RTX 3070 Ti Laptop GPU
...
max:
...
NVIDIA GeForce RTX 3070 Ti Laptop GPU
max:
NVIDIA GeForce RTX 3070 Ti Laptop GPU
max:
» Jouable avec tous les ordinateurs portables testés avec les détails paramétrés sur Ultra.
Additional Benchmarks
Basic Quality Preset T2X SMAA 1280x720
0 100 200 Tooltip Blade 15 OLED (Early 2022): Ø82.6 (73.19-134.2)
15 XE5: Ø91 (73.647-208.1)
...
NVIDIA GeForce RTX 3070 Ti Laptop GPU
max:
0 100 Tooltip Blade 15 OLED (Early 2022): Ø80 (73.17-110.5)
15 XE5: Ø82.4 (71.052-97)
AMD Radeon RX Vega 8 (Ryzen 2000/3000)
...
NVIDIA GeForce RTX 3070 Ti Laptop GPU
max:
0 100 Tooltip Blade 15 OLED (Early 2022): Ø76 (67.182-116.6)
15 XE5: Ø77 (68.415-88.6)
...
NVIDIA GeForce RTX 3070 Ti Laptop GPU
max:
0 100 200 Tooltip Blade 15 OLED (Early 2022): Ø76.6 (64.111-105.2)
15 XE5: Ø84.1 (66.036-221)
...
NVIDIA GeForce RTX 3070 Ti Laptop GPU
max:
0 Tooltip 15 XE5: Ø58.9 (48.661-80.3)
Blade 15 OLED (Early 2022): Ø57.6 (52.365-61.23)
NVIDIA GeForce RTX 3070 Ti Laptop GPU
max:
» Jouable avec tous les ordinateurs portables testés avec les détails paramétrés sur Ultra.
Additional Benchmarks
Low Preset 1280x720
87.3 [X] Aorus 15 XE5 Intel Core i7-12700H 1.7GHz
GeForce RTX 3070 Ti Laptop GPU
min:
55.9 fps, P0.1:
65.4 fps, P1:
69.3 fps, max:
113.7 fps
0 100 200 300 Tooltip 15 XE5: Ø104.4 (81.106-336)
Blade 15 OLED (Early 2022): Ø104.9 (91.87-155.6)
Intel UHD Graphics Xe 16EUs (Tiger Lake-H)
...
NVIDIA GeForce RTX 3070 Ti Laptop GPU
max:
0 100 200 300 Tooltip 15 XE5: Ø90 (74.096-301)
Blade 15 OLED (Early 2022): Ø85.7 (75.021-106.1)
...
NVIDIA GeForce RTX 3070 Ti Laptop GPU
max:
0 100 Tooltip 15 XE5: Ø74.2 (64.654-124.2)
Blade 15 OLED (Early 2022): Ø77.6 (66.069-143.9)
...
NVIDIA GeForce RTX 3070 Ti Laptop GPU
max:
0 100 200 Tooltip 15 XE5: Ø66.4 (54.011-203.6)
Blade 15 OLED (Early 2022): Ø66.9 (55.066-124.8)
...
NVIDIA GeForce RTX 3070 Ti Laptop GPU
...
max:
0 100 200 300 400 500 600 700 800 900 1000 1100 1200 1300 1400 1500 Tooltip 15 XE5: Ø52.8 (43.043-101)
Blade 15 OLED (Early 2022): Ø90.1 (45.698-1580)
...
NVIDIA GeForce RTX 3070 Ti Laptop GPU
...
max:
» Jouable avec tous les ordinateurs portables testés avec les détails paramétrés sur Ultra.
Additional Benchmarks
Low Preset 1280x720
106.1 [X] Aorus 15 XE5 Intel Core i7-12700H 1.7GHz
GeForce RTX 3070 Ti Laptop GPU
min:
21.4 fps, P0.1:
25.7 fps, P1:
35.1 fps, max:
166.9 fps
0 100 200 Tooltip Blade 15 OLED (Early 2022): Ø113.9 (100.423-261.6)
NVIDIA GeForce RTX 3070 Ti Laptop GPU
max:
0 100 200 300 Tooltip Nitro 5 AN515-46-R1A1: Ø155.6 (102.42-304.2)
15 XE5: Ø158.5 (139.104-201)
Intel UHD Graphics Xe 16EUs (Tiger Lake-H)
...
NVIDIA GeForce RTX 3070 Ti Laptop GPU
max:
0 100 Tooltip 15 XE5: Ø122.4 (99.771-153)
Nitro 5 AN515-46-R1A1: Ø122.8 (87.02-145.4)
Intel UHD Graphics Xe G4 48EUs
...
NVIDIA GeForce RTX 3070 Ti Laptop GPU
max:
0 100 200 Tooltip 15 XE5: Ø106.2 (82.342-209.8)
Nitro 5 AN515-46-R1A1: Ø104.2 (81.947-133.57)
...
NVIDIA GeForce RTX 3070 Ti Laptop GPU
max:
0 100 Tooltip 15 XE5: Ø83.7 (70.059-104.745)
Nitro 5 AN515-46-R1A1: Ø84.4 (66.452-112.5)
...
NVIDIA GeForce RTX 3070 Ti Laptop GPU
max:
0 100 Tooltip 15 XE5: Ø60.9 (50.215-134.6)
...
NVIDIA GeForce RTX 3070 Ti Laptop GPU
max:
» Jouable avec tous les ordinateurs portables testés avec les détails paramétrés sur Ultra.
Additional Benchmarks
Low Preset 1280x720
214 [X] Aorus 15 XE5 Intel Core i7-12700H 1.7GHz
GeForce RTX 3070 Ti Laptop GPU
min:
18.6 fps, P0.1:
85.4 fps, P1:
152.5 fps, max:
338 fps
Intel UHD Graphics Xe 16EUs (Tiger Lake-H)
...
NVIDIA GeForce RTX 3070 Ti Laptop GPU
...
max:
Intel UHD Graphics Xe 16EUs (Tiger Lake-H)
...
NVIDIA GeForce RTX 3070 Ti Laptop GPU
...
max:
Intel UHD Graphics Xe 16EUs (Tiger Lake-H)
...
NVIDIA GeForce RTX 3070 Ti Laptop GPU
...
max:
58.1 64 [X] Razer Blade 15 RZ09-0421NGG3-R3G1 939134
Intel Core i9-12900H 1.8GHz
GeForce RTX 3070 Ti Laptop GPU
min:
55 fps, P1:
47 fps, max:
75 fps
64.2 [X] Aorus 15 XE5 928484
Intel Core i7-12700H 1.7GHz
GeForce RTX 3070 Ti Laptop GPU
min:
55 fps, P1:
51 fps, max:
74 fps
65.2 66.3 [X] Aorus 15 XE5 928484, Turbo Mode
Intel Core i7-12700H 1.7GHz
GeForce RTX 3070 Ti Laptop GPU
min:
57 fps, P1:
53 fps, max:
76 fps
67.4 [X] Razer Blade 15 OLED (Early 2022) 959964,
Intel Core i9-12900H 1.8GHz
GeForce RTX 3070 Ti Laptop GPU
min:
58 fps, P1:
51 fps, max:
78 fps
73.2 80 [X] Acer Nitro 5 AN515-46-R1A1 923650, dGPU
AMD Ryzen 7 6800H 3.2GHz
GeForce RTX 3070 Ti Laptop GPU
min:
66 fps, P1:
61 fps, max:
94 fps
~ 67 fps
+ Comparer
- Cacher la comparaison
...
NVIDIA GeForce RTX 3070 Ti Laptop GPU
...
max:
36.8 41.9 [X] Razer Blade 15 RZ09-0421NGG3-R3G1 939134
Intel Core i9-12900H 1.8GHz
GeForce RTX 3070 Ti Laptop GPU
min:
36 fps, P1:
32 fps, max:
50 fps
42.3 42.7 [X] Aorus 15 XE5 928484
Intel Core i7-12700H 1.7GHz
GeForce RTX 3070 Ti Laptop GPU
min:
36 fps, P1:
32 fps, max:
50 fps
42.8 [X] Razer Blade 15 OLED (Early 2022) 959964, dGPU
Intel Core i9-12900H 1.8GHz
GeForce RTX 3070 Ti Laptop GPU
min:
37 fps, P1:
32 fps, max:
51 fps
43.5 [X] Aorus 15 XE5 928484, Turbo Mode
Intel Core i7-12700H 1.7GHz
GeForce RTX 3070 Ti Laptop GPU
min:
37 fps, P1:
34 fps, max:
51 fps
50.5 [X] Acer Nitro 5 AN515-46-R1A1 923650, dGPU
AMD Ryzen 7 6800H 3.2GHz
GeForce RTX 3070 Ti Laptop GPU
min:
43 fps, P1:
42 fps, max:
59 fps
~ 43 fps
+ Comparer
- Cacher la comparaison
...
NVIDIA GeForce RTX 3070 Ti Laptop GPU
...
max:
» Jouable avec tous les ordinateurs portables testés avec les détails paramétrés sur Ultra.
Additional Benchmarks
Ultra Low Preset 16xAF TAA 1280x720
287 [X] Aorus 15 XE5 Intel Core i7-12700H 1.7GHz
GeForce RTX 3070 Ti Laptop GPU
min:
213 fps, P1:
177 fps, max:
321 fps
0 100 200 300 400 500 Tooltip Nitro 5 AN515-46-R1A1: Ø215 (171.48-592)
...
NVIDIA GeForce RTX 3070 Ti Laptop GPU
max:
0 100 200 300 400 500 600 700 Tooltip Nitro 5 AN515-46-R1A1: Ø209 (151.587-780)
Omen 16-b1090ng: Ø209 (175.321-280.2)
...
NVIDIA GeForce RTX 3070 Ti Laptop GPU
...
max:
0 100 200 300 400 Tooltip Nitro 5 AN515-46-R1A1: Ø175.2 (145.16-232.9)
Omen 16-b1090ng: Ø205 (169.25-411)
...
NVIDIA GeForce RTX 3070 Ti Laptop GPU
max:
0 100 200 Tooltip Nitro 5 AN515-46-R1A1: Ø174.1 (142.23-280.9)
Omen 16-b1090ng: Ø195.3 (163.123-260.5)
Intel UHD Graphics Xe G4 48EUs
...
NVIDIA GeForce RTX 3070 Ti Laptop GPU
...
max:
0 100 200 300 400 500 600 Tooltip Omen 16-b1090ng: Ø153.9 (112.11-668)
...
NVIDIA GeForce RTX 3070 Ti Laptop GPU
max:
» Jouable avec tous les ordinateurs portables testés avec les détails paramétrés sur Ultra.
Additional Benchmarks
Low Preset 1280x720
...
NVIDIA GeForce RTX 3070 Ti Laptop GPU
max:
0 100 200 300 400 Tooltip Omen 16-b1090ng: Ø163.1 (126.96-442)
...
NVIDIA GeForce RTX 3070 Ti Laptop GPU
max:
0 100 Tooltip Omen 16-b1090ng: Ø148.9 (124.012-166.7)
...
NVIDIA GeForce RTX 3070 Ti Laptop GPU
max:
0 100 200 300 Tooltip ROG Flow X16 GV601RW-M5082W: Ø134.4 (115.391-185.9)
Omen 16-b1090ng: Ø153 (120.82-324.7)
...
NVIDIA GeForce RTX 3070 Ti Laptop GPU
max:
0 100 200 300 400 500 600 700 800 900 1000 1100 1200 1300 1400 1500 1600 1700 1800 1900 2000 2100 2200 2300 2400 2500 2600 2700 2800 2900 3000 3100 3200 3300 3400 3500 3600 3700 3800 3900 4000 4100 4200 4300 4400 4500 4600 4700 4800 4900 5000 5100 5200 5300 5400 5500 5600 5700 5800 5900 6000 6100 6200 6300 6400 6500 6600 6700 6800 6900 7000 7100 7200 7300 7400 7500 7600 7700 7800 7900 8000 8100 8200 8300 8400 8500 8600 8700 8800 8900 9000 9100 9200 9300 9400 9500 9600 9700 9800 9900 Tooltip ROG Flow X16 GV601RW-M5082W: Ø629 (76.377-21066)
Omen 16-b1090ng: Ø101.7 (80.477-352)
...
NVIDIA GeForce RTX 3070 Ti Laptop GPU
max:
» Jouable avec tous les ordinateurs portables testés avec les détails paramétrés sur Ultra.
Additional Benchmarks
Highest Settings + Maximum Ray Tracing 1920x1080
...
NVIDIA GeForce RTX 3070 Ti Laptop GPU
...
max:
...
NVIDIA GeForce RTX 3070 Ti Laptop GPU
max:
...
NVIDIA GeForce RTX 3070 Ti Laptop GPU
...
max:
Intel UHD Graphics 24EUs (Alder Lake-N)
...
NVIDIA GeForce RTX 3070 Ti Laptop GPU
...
max:
...
NVIDIA GeForce RTX 3070 Ti Laptop GPU
...
max:
» Jouable avec tous les ordinateurs portables testés avec les détails paramétrés sur Ultra.
Additional Benchmarks
Lowest Preset (DX12) 1280x720
...
NVIDIA GeForce RTX 3070 Ti Laptop GPU
max:
AMD Radeon RX Vega 8 (Ryzen 2000/3000)
...
NVIDIA GeForce RTX 3070 Ti Laptop GPU
...
max:
...
NVIDIA GeForce RTX 3070 Ti Laptop GPU
...
max:
AMD Radeon RX Vega 8 (Ryzen 2000/3000)
...
NVIDIA GeForce RTX 3070 Ti Laptop GPU
max:
...
NVIDIA GeForce RTX 3070 Ti Laptop GPU
...
max:
...
NVIDIA GeForce RTX 3070 Ti Laptop GPU
...
max:
» Jouable avec tous les ordinateurs portables testés avec les détails paramétrés sur Ultra.
Additional Benchmarks
Low Preset 1280x720
140 [X] Aorus 17 XE4 1.52
Intel Core i7-12700H 1.7GHz
GeForce RTX 3070 Ti Laptop GPU
min:
79.2 fps, max:
191 fps
Ray Tracing Ultra Preset (DLSS off) 1920x1080
31.9 [X] Aorus 17 XE4 1.52
Intel Core i7-12700H 1.7GHz
GeForce RTX 3070 Ti Laptop GPU
min:
23.4 fps, max:
45.4 fps
27.9 [X] Razer Blade 15 RZ09-0421NGG3-R3G1 Intel Core i9-12900H 1.8GHz
GeForce RTX 3070 Ti Laptop GPU
min:
11.35 fps, max:
73.02 fps
Ray Tracing Ultra Preset (DLSS off) 3840x2160
0 100 Tooltip 17 XE4: Ø111.9 (102.163-122.97)
...
NVIDIA GeForce RTX 3070 Ti Laptop GPU
0 100 Tooltip 17 XE4: Ø107.2 (82.22-157)
...
NVIDIA GeForce RTX 3070 Ti Laptop GPU
0 100 200 Tooltip 17 XE4: Ø93.5 (72.037-202)
Vector GP76 12UGS-434: Ø101.4 (90.033-112.03)
...
NVIDIA GeForce RTX 3070 Ti Laptop GPU
0 100 Tooltip 17 XE4: Ø85.8 (69.64-127.7)
Vector GP76 12UGS-434: Ø90.5 (78.756-106.46)
...
NVIDIA GeForce RTX 3070 Ti Laptop GPU
» Jouable avec tous les ordinateurs portables testés avec les détails paramétrés sur Ultra.
Additional Benchmarks
Low / Off 1280x720
112 [X] Aorus 17 XE4 1.52
Intel Core i7-12700H 1.7GHz
GeForce RTX 3070 Ti Laptop GPU
min:
37.3 fps, P0.1:
85.5 fps, P1:
95 fps, max:
162 fps
...
NVIDIA GeForce RTX 3070 Ti Laptop GPU
max:
...
NVIDIA GeForce RTX 3070 Ti Laptop GPU
max:
Intel UHD Graphics 24EUs (Alder Lake-N)
...
NVIDIA GeForce RTX 3070 Ti Laptop GPU
...
max:
...
NVIDIA GeForce RTX 3070 Ti Laptop GPU
...
max:
...
NVIDIA GeForce RTX 3070 Ti Laptop GPU
max:
» Jouable avec tous les ordinateurs portables testés avec les détails paramétrés sur Ultra.
Additional Benchmarks
Low Preset 1280x720
212.2 [X] Aorus 17 XE4 1.52
Intel Core i7-12700H 1.7GHz
GeForce RTX 3070 Ti Laptop GPU
min:
166 fps, max:
242.2 fps
0 Tooltip Omen 16-b1090ng: Ø64.1 (59.079-91.5)
...
NVIDIA GeForce RTX 3070 Ti Laptop GPU
max:
0 100 200 300 400 Tooltip Omen 16-b1090ng: Ø66.9 (58.218-108.6)
Vector GP76 12UGS-434: Ø91.5 (59.002-450)
...
NVIDIA GeForce RTX 3070 Ti Laptop GPU
...
max:
0 100 Tooltip Vector GP76 12UGS-434: Ø48.8 (3.966-96.5)
Omen 16-b1090ng: Ø70.3 (59.17-110.7)
Intel UHD Graphics Xe G4 48EUs
...
AMD Radeon 680M
NVIDIA GeForce RTX 3070 Ti Laptop GPU
...
max:
0 100 200 Tooltip Omen 16-b1090ng: Ø75.9 (58.045-242.5)
...
NVIDIA GeForce RTX 3070 Ti Laptop GPU
max:
» Jouable avec tous les ordinateurs portables testés avec les détails paramétrés sur Ultra.
0 100 Tooltip ROG Flow X16 GV601RW-M5082W: Ø123.3 (116.064-151)
...
NVIDIA GeForce RTX 3070 Ti Laptop GPU
max:
0 100 Tooltip Stealth GS66 12UGS: Ø85 (75.307-179.2)
ROG Flow X16 GV601RW-M5082W: Ø84.3 (78.059-113.2)
Omen 16-b1090ng: Ø84 (78.018-102.3)
...
NVIDIA GeForce RTX 3070 Ti Laptop GPU
max:
0 100 Tooltip Stealth GS66 12UGS: Ø72.7 (68.071-89.1)
Omen 16-b1090ng: Ø75.3 (68.105-149.8)
ROG Flow X16 GV601RW-M5082W: Ø73.5 (68.18-81.8)
...
NVIDIA GeForce RTX 3070 Ti Laptop GPU
max:
0 100 Tooltip ROG Flow X16 GV601RW-M5082W: Ø50.2 (45.006-58.4)
Omen 16-b1090ng: Ø51.9 (49.17-54.93)
Stealth GS66 12UGS: Ø56.8 (49.853-116.5)
...
NVIDIA GeForce RTX 3070 Ti Laptop GPU
max:
0 Tooltip Stealth GS66 12UGS: Ø29.4 (26.156-31.9)
NVIDIA GeForce RTX 3070 Ti Laptop GPU
max:
» Jouable avec tous les ordinateurs portables testés avec les détails paramétrés sur Élevé.
Additional Benchmarks
Low Quality 1280x720
High Quality Raytracing 1920x1080
31.1 [X] MSI Stealth GS66 12UGS Intel Core i7-12700H 1.7GHz
GeForce RTX 3070 Ti Laptop GPU
min:
4.28 fps, P0.1:
6.05 fps, P1:
19.2 fps, max:
153 fps
...
AMD Radeon 680M
NVIDIA GeForce RTX 3070 Ti Laptop GPU
max:
...
NVIDIA GeForce RTX 3070 Ti Laptop GPU
max:
...
NVIDIA GeForce RTX 3070 Ti Laptop GPU
max:
...
NVIDIA GeForce RTX 3070 Ti Laptop GPU
max:
...
NVIDIA GeForce RTX 3070 Ti Laptop GPU
max:
NVIDIA GeForce RTX 3070 Ti Laptop GPU
max:
» Jouable avec tous les ordinateurs portables testés avec les détails paramétrés sur Ultra.
Additional Benchmarks
Ultra Low Preset (with Fixed Resolution Quality) 1280x720
322 [X] Aorus 17 XE4 1.52
Intel Core i7-12700H 1.7GHz
GeForce RTX 3070 Ti Laptop GPU
min:
256 fps, max:
373 fps
0 100 Tooltip Nitro 5 AN515-46-R1A1: Ø118.3 (84.635-143.9)
17 XE4: Ø127.5 (103.631-167)
Intel UHD Graphics G1 (Ice Lake 32 EU)
...
NVIDIA GeForce RTX 3070 Ti Laptop GPU
max:
0 100 200 300 400 500 600 700 800 900 1000 1100 1200 1300 1400 Tooltip Stealth GS66 12UGS: Ø94.2 (85.073-118.2)
17 XE4: Ø108.3 (100.11-128.8)
Nitro 5 AN515-46-R1A1: Ø160.1 (82.46-1463)
...
NVIDIA GeForce RTX 3070 Ti Laptop GPU
max:
0 100 200 300 400 500 Tooltip Stealth GS66 12UGS: Ø80 (72.028-92.1)
ROG Flow X16 GV601RW-M5082W: Ø84.9 (78.36-94.97)
17 XE4: Ø87.2 (80.83-102.3)
Nitro 5 AN515-46-R1A1: Ø109.6 (82.891-510)
...
NVIDIA GeForce RTX 3070 Ti Laptop GPU
...
max:
0 100 Tooltip Stealth GS66 12UGS: Ø57.1 (48.217-69.25)
17 XE4: Ø65 (53.558-176)
ROG Flow X16 GV601RW-M5082W: Ø66.2 (56.075-120.5)
Nitro 5 AN515-46-R1A1: Ø67.1 (57.676-88.3)
...
NVIDIA GeForce RTX 3070 Ti Laptop GPU
...
max:
0 Tooltip ROG Flow X16 GV601RW-M5082W: Ø50.1 (41.01-98.5)
Stealth GS66 12UGS: Ø49.2 (42.94-73.8)
...
NVIDIA GeForce RTX 3070 Ti Laptop GPU
...
max:
0 Tooltip Stealth GS66 12UGS: Ø34.8 (30.23-47.4)
NVIDIA GeForce RTX 3070 Ti Laptop GPU
...
max:
» Jouable avec tous les ordinateurs portables testés avec les détails paramétrés sur Ultra.
Additional Benchmarks
Low Preset 1280x720
136 [X] Aorus 17 XE4 1.52
Intel Core i7-12700H 1.7GHz
GeForce RTX 3070 Ti Laptop GPU
min:
56.8 fps, P0.1:
67.1 fps, P1:
81.5 fps, max:
301 fps
0 100 Tooltip Stealth GS66 12UGS: Ø121.5 (109.436-137.45)
17 XE4: Ø132.5 (119.551-153.6)
...
NVIDIA GeForce RTX 3070 Ti Laptop GPU
0 100 200 Tooltip Stealth GS66 12UGS: Ø104.2 (93.262-115.36)
17 XE4: Ø121.4 (105.272-238.3)
...
NVIDIA GeForce RTX 3070 Ti Laptop GPU
0 100 Tooltip Stealth GS66 12UGS: Ø102.3 (88.083-171.2)
17 XE4: Ø109 (98.148-120.71)
...
NVIDIA GeForce RTX 3070 Ti Laptop GPU
0 100 Tooltip Stealth GS66 12UGS: Ø72.2 (59.293-167)
NVIDIA GeForce RTX 3070 Ti Laptop GPU
0 100 200 Tooltip Stealth GS66 12UGS: Ø43.3 (31.737-201)
NVIDIA GeForce RTX 3070 Ti Laptop GPU
» Jouable avec tous les ordinateurs portables testés avec les détails paramétrés sur Ultra.
Additional Benchmarks
Low Preset 1920x1080
149.5 [X] Aorus 17 XE4 1.52
Intel Core i7-12700H 1.7GHz
GeForce RTX 3070 Ti Laptop GPU
min:
40.7 fps, P0.1:
78.1 fps, P1:
98.3 fps, max:
289 fps
0 100 200 300 Tooltip Omen 16-b1090ng: Ø172.2 (-0.03149-219.1)
Stealth GS66 12UGS: Ø203 (-0.0316-355)
...
NVIDIA GeForce RTX 3070 Ti Laptop GPU
max:
0 100 200 Tooltip Omen 16-b1090ng: Ø155.8 (-0.03706-230.1)
Stealth GS66 12UGS: Ø180.4 (-0.0438-292)
...
NVIDIA GeForce RTX 3070 Ti Laptop GPU
max:
0 100 200 Tooltip Omen 16-b1090ng: Ø143.6 (-0.03898-221)
Stealth GS66 12UGS: Ø146.2 (-0.038-187.8)
...
NVIDIA GeForce RTX 3070 Ti Laptop GPU
max:
0 100 200 300 400 500 600 700 800 900 1000 1100 1200 1300 1400 1500 1600 1700 1800 1900 2000 2100 2200 2300 2400 2500 2600 2700 2800 2900 3000 3100 3200 3300 3400 3500 3600 3700 3800 3900 4000 4100 4200 4300 4400 4500 4600 4700 4800 4900 5000 5100 5200 5300 5400 5500 5600 5700 5800 5900 6000 6100 6200 6300 6400 6500 6600 6700 6800 6900 7000 7100 7200 7300 7400 7500 7600 7700 7800 7900 8000 8100 Tooltip Stealth GS66 12UGS: Ø118.9 (-0.0403-242)
Omen 16-b1090ng: Ø342 (-0.03713-8182)
...
NVIDIA GeForce RTX 3070 Ti Laptop GPU
max:
0 100 Tooltip Stealth GS66 12UGS: Ø76.4 (-0.0392-168.7)
...
NVIDIA GeForce RTX 3070 Ti Laptop GPU
max:
» Jouable avec tous les ordinateurs portables testés avec les détails paramétrés sur Ultra.
0 100 200 Tooltip 17 XE4: Ø142.4 (125.994-205.9)
...
NVIDIA GeForce GTX 1050 Ti Mobile
AMD Radeon 680M
NVIDIA GeForce RTX 3070 Ti Laptop GPU
max:
0 100 200 Tooltip 17 XE4: Ø114.2 (102.59-145.2)
Stealth GS66 12UGS: Ø121.3 (106.714-274)
Intel UHD Graphics Xe 32EUs (Tiger Lake-H)
...
NVIDIA GeForce RTX 3070 Ti Laptop GPU
max:
0 100 200 Tooltip Stealth GS66 12UGS: Ø104.6 (84.742-281)
17 XE4: Ø110 (88.084-297.3)
...
AMD Radeon 680M
NVIDIA GeForce RTX 3070 Ti Laptop GPU
max:
0 100 200 Tooltip Stealth GS66 12UGS: Ø89.5 (70.424-144.5)
17 XE4: Ø97.1 (74.026-273)
...
AMD Radeon RX 560X (Laptop)
AMD Radeon 680M
NVIDIA GeForce RTX 3070 Ti Laptop GPU
0 100 Tooltip Stealth GS66 12UGS: Ø71.7 (53.352-181)
NVIDIA GeForce RTX 3070 Ti Laptop GPU
0 100 200 300 Tooltip Stealth GS66 12UGS: Ø49.9 (34.38-321)
NVIDIA GeForce RTX 3070 Ti Laptop GPU
» Jouable avec tous les ordinateurs portables testés avec les détails paramétrés sur Ultra.
Additional Benchmarks
Low Preset 1920x1080
119.4 [X] Aorus 17 XE4 1.52
Intel Core i7-12700H 1.7GHz
GeForce RTX 3070 Ti Laptop GPU
min:
10.9 fps, P0.1:
33.4 fps, P1:
84 fps, max:
169.9 fps
Ultra Preset + Ray Tracing 1920x1080
69.1 [X] MSI Stealth GS66 12UGS Intel Core i7-12700H 1.7GHz
GeForce RTX 3070 Ti Laptop GPU
min:
12.5 fps, P0.1:
18.4 fps, P1:
36.6 fps, max:
117 fps
69.8 [X] Aorus 17 XE4 1.52
Intel Core i7-12700H 1.7GHz
GeForce RTX 3070 Ti Laptop GPU
min:
20.8 fps, P0.1:
24.7 fps, P1:
40.4 fps, max:
110.3 fps
...
AMD Radeon 680M
NVIDIA GeForce RTX 3070 Ti Laptop GPU
max:
Intel UHD Graphics Xe 16EUs (Tiger Lake-H)
...
NVIDIA GeForce RTX 3070 Ti Laptop GPU
max:
...
NVIDIA GeForce RTX 3070 Ti Laptop GPU
max:
...
NVIDIA GeForce RTX 3070 Ti Laptop GPU
max:
...
NVIDIA GeForce RTX 3070 Ti Laptop GPU
max:
NVIDIA GeForce RTX 3070 Ti Laptop GPU
max:
» Jouable avec tous les ordinateurs portables testés avec les détails paramétrés sur Ultra.
Additional Benchmarks
Low Preset 1920x1080
...
NVIDIA GeForce RTX 3070 Ti Laptop GPU
max:
...
NVIDIA GeForce RTX 3070 Ti Laptop GPU
max:
...
NVIDIA GeForce RTX 3070 Ti Laptop GPU
max:
...
NVIDIA GeForce RTX 3070 Ti Laptop GPU
max:
...
NVIDIA GeForce RTX 3070 Ti Laptop GPU
max:
...
NVIDIA GeForce RTX 3070 Ti Laptop GPU
max:
» Jouable avec tous les ordinateurs portables testés avec les détails paramétrés sur Ultra.
Additional Benchmarks
Low Preset 1920x1080
164 [X] Aorus 17 XE4 1.52
Intel Core i7-12700H 1.7GHz
GeForce RTX 3070 Ti Laptop GPU
min:
134 fps, max:
192 fps
...
NVIDIA GeForce RTX 3070 Ti Laptop GPU
max:
...
NVIDIA GeForce RTX 3070 Ti Laptop GPU
...
max:
...
NVIDIA GeForce RTX 3070 Ti Laptop GPU
...
max:
AMD Radeon RX 560X (Laptop)
...
NVIDIA GeForce RTX 3070 Ti Laptop GPU
...
max:
...
NVIDIA GeForce RTX 3070 Ti Laptop GPU
max:
NVIDIA GeForce RTX 3070 Ti Laptop GPU
max:
» Jouable avec tous les ordinateurs portables testés avec les détails paramétrés sur Ultra.
Additional Benchmarks
Low Preset 1920x1080
109 [X] Aorus 17 XE4 1.52
Intel Core i7-12700H 1.7GHz
GeForce RTX 3070 Ti Laptop GPU
min:
52 fps, max:
133 fps
Ultra Preset + Ultra Ray-Tracing 1920x1080
69 [X] Aorus 17 XE4 1.52
Intel Core i7-12700H 1.7GHz
GeForce RTX 3070 Ti Laptop GPU
min:
44 fps, max:
85 fps
0 100 200 Tooltip Omen 16-b1090ng: Ø223 (180.263-281.8)
Stealth GS66 12UGS: Ø224 (198.785-281.46)
...
NVIDIA GeForce RTX 3070 Ti Laptop GPU
0 100 200 Tooltip Stealth GS66 12UGS: Ø191.4 (161.2-238.753)
Omen 16-b1090ng: Ø199.1 (163.463-263.9)
...
NVIDIA GeForce RTX 3070 Ti Laptop GPU
0 100 200 300 400 500 600 700 Tooltip Stealth GS66 12UGS: Ø179.6 (149.5-220.35)
Omen 16-b1090ng: Ø212 (160.237-714)
Intel UHD Graphics Xe G4 48EUs
...
NVIDIA GeForce RTX 3070 Ti Laptop GPU
0 100 200 300 400 Tooltip Stealth GS66 12UGS: Ø136.8 (104.181-480)
Omen 16-b1090ng: Ø134.2 (111.74-206.7)
...
NVIDIA GeForce RTX 3070 Ti Laptop GPU
0 Tooltip Stealth GS66 12UGS: Ø66.6 (56.026-87.2)
...
NVIDIA GeForce RTX 3070 Ti Laptop GPU
max:
» Jouable avec tous les ordinateurs portables testés avec les détails paramétrés sur Ultra.
...
NVIDIA GeForce RTX 3070 Ti Laptop GPU
max:
...
NVIDIA GeForce RTX 3070 Ti Laptop GPU
...
max:
Intel UHD Graphics Xe 32EUs (Tiger Lake-H)
...
NVIDIA GeForce RTX 3070 Ti Laptop GPU
...
max:
...
NVIDIA GeForce RTX 3070 Ti Laptop GPU
...
max:
...
NVIDIA GeForce RTX 3070 Ti Laptop GPU
...
max:
...
AMD Radeon 680M
NVIDIA GeForce RTX 3070 Ti Laptop GPU
max:
» Jouable avec tous les ordinateurs portables testés avec les détails paramétrés sur Ultra.
Additional Benchmarks
Low Graphics Quality 1920x1080
129 [X] Aorus 17 XE4 1.52
Intel Core i7-12700H 1.7GHz
GeForce RTX 3070 Ti Laptop GPU
min:
111 fps, max:
153 fps
Ultra Graphics Quality + HD Textures + DXR TAA 1920x1080
77.7 [X] Aorus 17 XE4 1.52
Intel Core i7-12700H 1.7GHz
GeForce RTX 3070 Ti Laptop GPU
min:
66 fps, max:
94 fps
0 100 200 Tooltip 17 XE4: Ø172.8 (150.359-218.7)
...
AMD Radeon 680M
AMD Radeon RX 560X (Laptop)
NVIDIA GeForce RTX 3070 Ti Laptop GPU
0 100 200 Tooltip 17 XE4: Ø140.9 (125.478-195.494)
Stealth GS66 12UGS: Ø156.7 (141.208-200.6)
...
NVIDIA GeForce RTX 3070 Ti Laptop GPU
0 100 200 Tooltip 17 XE4: Ø134.7 (114.272-230.5)
Stealth GS66 12UGS: Ø153.8 (137.384-293)
...
NVIDIA GeForce RTX 3070 Ti Laptop GPU
max:
0 100 Tooltip Stealth GS66 12UGS: Ø106.4 (97.021-119.6)
...
NVIDIA GeForce RTX 3070 Ti Laptop GPU
max:
0 Tooltip Stealth GS66 12UGS: Ø60.4 (52.272-92.5)
NVIDIA GeForce RTX 3070 Ti Laptop GPU
...
max:
» Jouable avec tous les ordinateurs portables testés avec les détails paramétrés sur Élevé.
0 100 200 Tooltip Omen 16-b1090ng: Ø104.8 (81.09-246.7)
Stealth GS66 12UGS: Ø112.6 (91.15-187.9)
...
NVIDIA GeForce RTX 3070 Ti Laptop GPU
max:
0 100 200 Tooltip Omen 16-b1090ng: Ø97.1 (79.02-151.2)
Stealth GS66 12UGS: Ø101.1 (76.074-219.7)
...
NVIDIA GeForce RTX 3070 Ti Laptop GPU
max:
0 100 Tooltip Stealth GS66 12UGS: Ø85.4 (66.31-115.288)
Omen 16-b1090ng: Ø88.8 (69.808-144.3)
...
NVIDIA GeForce RTX 3070 Ti Laptop GPU
max:
0 100 Tooltip Stealth GS66 12UGS: Ø61.7 (47.059-105.3)
Omen 16-b1090ng: Ø72.7 (52.19-93.04)
NVIDIA GeForce RTX 3070 Ti Laptop GPU
max:
0 Tooltip Stealth GS66 12UGS: Ø35.5 (26.177-96.7)
NVIDIA GeForce RTX 3070 Ti Laptop GPU
max:
» Jouable avec tous les ordinateurs portables testés avec les détails paramétrés sur Ultra.
0 100 200 300 Tooltip Stealth GS66 12UGS: Ø125.5 (98.077-312)
Omen 16-b1090ng: Ø131 (112.336-153.52)
...
NVIDIA GeForce RTX 3070 Ti Laptop GPU
0 100 Tooltip Stealth GS66 12UGS: Ø101.9 (83.978-132.4)
Omen 16-b1090ng: Ø115.3 (97.275-149.5)
...
NVIDIA GeForce RTX 3070 Ti Laptop GPU
0 100 200 Tooltip Stealth GS66 12UGS: Ø84.3 (67.053-116.9)
Omen 16-b1090ng: Ø99.8 (75.659-268.8)
...
NVIDIA GeForce RTX 3070 Ti Laptop GPU
0 100 Tooltip Stealth GS66 12UGS: Ø60.9 (49.002-109.6)
Omen 16-b1090ng: Ø64.7 (55.134-76.1)
NVIDIA GeForce RTX 3070 Ti Laptop GPU
0 100 Tooltip Stealth GS66 12UGS: Ø36 (27.042-111.4)
NVIDIA GeForce RTX 3070 Ti Laptop GPU
max:
» Jouable avec tous les ordinateurs portables testés avec les détails paramétrés sur Ultra.
...
NVIDIA GeForce RTX 3070 Ti Laptop GPU
max:
...
NVIDIA GeForce RTX 3070 Ti Laptop GPU
...
max:
...
NVIDIA GeForce RTX 3070 Ti Laptop GPU
max:
67.3 [X] HP Omen 17-ck1075ng 874931
Intel Core i7-12700H 1.7GHz
GeForce RTX 3070 Ti Laptop GPU
min:
52 fps, P1:
46 fps, max:
85 fps
88.1 [X] Acer Nitro 5 AN515-58-72QR 874931, Leise
Intel Core i7-12700H 1.7GHz
GeForce RTX 3070 Ti Laptop GPU
min:
67 fps, P1:
62 fps, max:
108 fps
89.6 [X] Asus TUF Dash F15 FX517ZR 874931, Leise
Intel Core i7-12650H 1.7GHz
GeForce RTX 3070 Ti Laptop GPU
min:
73 fps, P1:
66 fps, max:
105 fps
106.2 108 109.1 116 [X] Aorus 17 XE4 865624
Intel Core i7-12700H 1.7GHz
GeForce RTX 3070 Ti Laptop GPU
min:
98 fps, P1:
89 fps, max:
125 fps
116.9 [X] Acer Nitro 5 AN515-58-72QR 874931, Leistung
Intel Core i7-12700H 1.7GHz
GeForce RTX 3070 Ti Laptop GPU
min:
99 fps, P1:
87 fps, max:
126 fps
118 [X] Aorus 17 XE4 868399, Turbo Mode
Intel Core i7-12700H 1.7GHz
GeForce RTX 3070 Ti Laptop GPU
min:
101 fps, P1:
90 fps, max:
126 fps
119.8 129.6 [X] Acer Nitro 5 AN515-58-72QR 874931, dGPU, Leistung
Intel Core i7-12700H 1.7GHz
GeForce RTX 3070 Ti Laptop GPU
min:
108 fps, P1:
94 fps, max:
146 fps
130 134.2 ~ 110 fps
+ Comparer
- Cacher la comparaison
...
NVIDIA GeForce RTX 3070 Ti Laptop GPU
max:
47.5 [X] HP Omen 17-ck1075ng 874931
Intel Core i7-12700H 1.7GHz
GeForce RTX 3070 Ti Laptop GPU
min:
36 fps, P1:
31 fps, max:
63 fps
68.7 [X] Asus TUF Dash F15 FX517ZR 874931, Leise
Intel Core i7-12650H 1.7GHz
GeForce RTX 3070 Ti Laptop GPU
min:
60 fps, P1:
53 fps, max:
76 fps
71.6 [X] Acer Nitro 5 AN515-58-72QR 874931, Leise
Intel Core i7-12700H 1.7GHz
GeForce RTX 3070 Ti Laptop GPU
min:
60 fps, P1:
53 fps, max:
88 fps
80 82.2 82.6 90 [X] Acer Nitro 5 AN515-58-72QR 874931, Leistung
Intel Core i7-12700H 1.7GHz
GeForce RTX 3070 Ti Laptop GPU
min:
77 fps, P1:
65 fps, max:
98 fps
93.5 98.3 [X] Acer Nitro 5 AN515-58-72QR 874931, dGPU, Leistung
Intel Core i7-12700H 1.7GHz
GeForce RTX 3070 Ti Laptop GPU
min:
83 fps, P1:
73 fps, max:
109 fps
98.4 99.2 ~ 83 fps
+ Comparer
- Cacher la comparaison
...
NVIDIA GeForce RTX 3070 Ti Laptop GPU
max:
...
NVIDIA GeForce RTX 3070 Ti Laptop GPU
max:
» Jouable avec tous les ordinateurs portables testés avec les détails paramétrés sur Ultra.
Additional Benchmarks
Ultra Low Preset 1920x1080
0 100 200 300 Tooltip Stealth GS66 12UGS: Ø135.3 (123.366-231.1)
Omen 16-b1090ng: Ø157.8 (121.031-323)
...
NVIDIA GeForce RTX 3070 Ti Laptop GPU
0 100 200 300 400 500 600 700 800 900 1000 1100 1200 1300 1400 1500 1600 1700 1800 1900 2000 2100 2200 2300 2400 2500 2600 2700 2800 2900 3000 3100 3200 3300 Tooltip Stealth GS66 12UGS: Ø121.2 (108.192-226)
Omen 16-b1090ng: Ø205 (125.521-3398)
Intel UHD Graphics Xe 32EUs (Tiger Lake-H)
...
NVIDIA GeForce RTX 3070 Ti Laptop GPU
0 100 Tooltip Stealth GS66 12UGS: Ø95.4 (81.471-192)
Omen 16-b1090ng: Ø104.6 (96.084-140.2)
...
NVIDIA GeForce RTX 3070 Ti Laptop GPU
max:
0 100 200 300 400 500 Tooltip Stealth GS66 12UGS: Ø77.5 (61.343-526)
Omen 16-b1090ng: Ø79.3 (71.038-149.2)
...
NVIDIA GeForce RTX 3070 Ti Laptop GPU
max:
0 Tooltip Stealth GS66 12UGS: Ø39.5 (36.017-53.4)
...
NVIDIA GeForce RTX 3070 Ti Laptop GPU
max:
» Jouable avec tous les ordinateurs portables testés avec les détails paramétrés sur Ultra.
0 100 200 300 400 Tooltip Omen 16-b1090ng: Ø137.1 (79.8-498)
Stealth GS66 12UGS: Ø151 (89.35-275.7)
...
NVIDIA GeForce RTX 3070 Ti Laptop GPU
0 100 200 Tooltip Omen 16-b1090ng: Ø122.7 (77.014-176.32)
Stealth GS66 12UGS: Ø133 (87.47-213.8)
...
NVIDIA GeForce RTX 3070 Ti Laptop GPU
0 100 Tooltip Stealth GS66 12UGS: Ø84.2 (73.31-108.8)
...
NVIDIA GeForce RTX 3070 Ti Laptop GPU
max:
» Jouable avec tous les ordinateurs portables testés avec les détails paramétrés sur Ultra.
0 100 200 300 400 500 600 Tooltip Stealth GS66 12UGS: Ø202 (143.27-693)
Omen 16-b1090ng: Ø198.9 (160.81-300.8)
Intel UHD Graphics Xe 32EUs (Tiger Lake-H)
...
NVIDIA GeForce RTX 3070 Ti Laptop GPU
max:
AMD Radeon RX 6700 XT
0 100 200 Tooltip Stealth GS66 12UGS: Ø168.7 (133.222-257)
Omen 16-b1090ng: Ø184.9 (151.32-272.8)
...
NVIDIA GeForce RTX 3070 Ti Laptop GPU
max:
AMD Radeon RX 6700 XT
0 100 200 Tooltip Stealth GS66 12UGS: Ø146.2 (120.213-203.7)
Omen 16-b1090ng: Ø156 (135.81-190.25)
...
NVIDIA GeForce RTX 3070 Ti Laptop GPU
0 100 Tooltip Stealth GS66 12UGS: Ø101.2 (83.34-144.2)
Omen 16-b1090ng: Ø107.7 (88.154-152.3)
...
NVIDIA GeForce RTX 3070 Ti Laptop GPU
max:
0 100 Tooltip Stealth GS66 12UGS: Ø61.2 (47.34-118.4)
...
NVIDIA GeForce RTX 3070 Ti Laptop GPU
max:
» Jouable avec tous les ordinateurs portables testés avec les détails paramétrés sur Ultra.
Additional Benchmarks
Ray Tracing Preset 1920x1080
89.7 [X] MSI Stealth GS66 12UGS Intel Core i7-12700H 1.7GHz
GeForce RTX 3070 Ti Laptop GPU
min:
42.2 fps, P0.1:
65.6 fps, P1:
73.2 fps, max:
127 fps
0 100 Tooltip Stealth GS66 12UGS: Ø145.7 (117-192.76)
...
NVIDIA GeForce RTX 3070 Ti Laptop GPU
max:
AMD Radeon RX 6700 XT
0 100 Tooltip Stealth GS66 12UGS: Ø127.2 (108.11-155.85)
Omen 16-b1090ng: Ø137.6 (112.848-186.075)
...
NVIDIA GeForce RTX 3070 Ti Laptop GPU
max:
NVIDIA Titan RTX
0 100 Tooltip Stealth GS66 12UGS: Ø108.7 (85.923-141.9)
Omen 16-b1090ng: Ø118.6 (97.51-145.995)
...
NVIDIA GeForce RTX 3070 Ti Laptop GPU
max:
NVIDIA Titan RTX
0 Tooltip Stealth GS66 12UGS: Ø73.2 (60.429-95.5)
Omen 16-b1090ng: Ø83.5 (70.159-99.149)
...
NVIDIA GeForce RTX 3070 Ti Laptop GPU
max:
0 Tooltip Stealth GS66 12UGS: Ø38.4 (33.999-48.38)
NVIDIA GeForce RTX 3070 Ti Laptop GPU
max:
» Jouable avec tous les ordinateurs portables testés avec les détails paramétrés sur Ultra.
...
NVIDIA GeForce RTX 3070 Ti Laptop GPU
max:
AMD Radeon RX 6700 XT
...
NVIDIA GeForce RTX 3070 Ti Laptop GPU
...
max:
...
NVIDIA GeForce RTX 3070 Ti Laptop GPU
...
max:
...
NVIDIA GeForce RTX 3070 Ti Laptop GPU
max:
...
NVIDIA GeForce RTX 3070 Ti Laptop GPU
max:
...
NVIDIA GeForce RTX 3070 Ti Laptop GPU
max:
» Jouable avec tous les ordinateurs portables testés avec les détails paramétrés sur Ultra.
Additional Benchmarks
Minimum Settings 1920x1080
0 100 200 300 Tooltip Stealth GS66 12UGS: Ø91.1 (75.069-386)
...
NVIDIA GeForce RTX 2070 Super Max-Q
NVIDIA GeForce RTX 3070 Ti Laptop GPU
max:
0 100 Tooltip Stealth GS66 12UGS: Ø70.4 (61.06-170)
...
NVIDIA GeForce RTX 2070 Super Max-Q
NVIDIA GeForce RTX 3070 Ti Laptop GPU
max:
0 100 Tooltip Stealth GS66 12UGS: Ø60.1 (47.57-154)
...
NVIDIA GeForce RTX 2070 Super Max-Q
NVIDIA GeForce RTX 3070 Ti Laptop GPU
max:
0 Tooltip Stealth GS66 12UGS: Ø39.1 (29.512-87.7)
...
NVIDIA GeForce GTX 1070 Mobile
NVIDIA GeForce RTX 3070 Ti Laptop GPU
max:
0 Tooltip Stealth GS66 12UGS: Ø23.4 (15.072-98.4)
...
NVIDIA GeForce GTX 1070 Mobile
NVIDIA GeForce RTX 3070 Ti Laptop GPU
max:
» Jouable avec tous les ordinateurs portables testés avec les détails paramétrés sur Ultra.
Additional Benchmarks
Ray Tracing Ultra Preset (DLSS off) 1920x1080
30 [X] MSI Stealth GS66 12UGS Intel Core i7-12700H 1.7GHz
GeForce RTX 3070 Ti Laptop GPU
min:
11.3 fps, P0.1:
19 fps, P1:
22.6 fps, max:
87.2 fps
0 100 200 Tooltip Stealth GS66 12UGS: Ø125.8 (106.048-243)
...
NVIDIA GeForce RTX 2070 Super Max-Q
NVIDIA GeForce RTX 2070 Super Mobile
NVIDIA GeForce RTX 3070 Ti Laptop GPU
0 100 200 300 Tooltip Stealth GS66 12UGS: Ø123 (103.356-325)
Intel UHD Graphics Xe 32EUs (Tiger Lake-H)
...
NVIDIA GeForce RTX 2070 Super Max-Q
NVIDIA GeForce RTX 2070 Super Mobile
NVIDIA GeForce RTX 3070 Ti Laptop GPU
0 100 Tooltip Stealth GS66 12UGS: Ø101.8 (86.25-115.6)
...
NVIDIA GeForce RTX 2070 Super Max-Q
NVIDIA GeForce RTX 2070 Super Mobile
NVIDIA GeForce RTX 3070 Ti Laptop GPU
0 100 Tooltip Stealth GS66 12UGS: Ø72.9 (60.194-127.7)
...
NVIDIA GeForce RTX 2070 Super Mobile
NVIDIA GeForce RTX 3070 Ti Laptop GPU
0 Tooltip Stealth GS66 12UGS: Ø39.4 (34.147-54.9)
...
NVIDIA GeForce RTX 2070 Super Mobile
NVIDIA GeForce RTX 3070 Ti Laptop GPU
max:
» Jouable avec tous les ordinateurs portables testés avec les détails paramétrés sur Ultra.
...
NVIDIA GeForce RTX 2070 Super Max-Q
NVIDIA GeForce RTX 2070 Super Mobile
NVIDIA GeForce RTX 3070 Ti Laptop GPU
max:
...
NVIDIA GeForce RTX 2070 Super Max-Q
NVIDIA GeForce RTX 2070 Super Mobile
NVIDIA GeForce RTX 3070 Ti Laptop GPU
max:
...
NVIDIA GeForce RTX 2070 Super Max-Q
NVIDIA GeForce RTX 2070 Super Mobile
NVIDIA GeForce RTX 3070 Ti Laptop GPU
...
max:
...
NVIDIA GeForce RTX 2070 Super Max-Q
NVIDIA GeForce RTX 2070 Super Mobile
NVIDIA GeForce RTX 3070 Ti Laptop GPU
...
max:
...
NVIDIA GeForce RTX 3070 Ti Laptop GPU
max:
...
NVIDIA GeForce RTX 3070 Ti Laptop GPU
max:
» Jouable avec tous les ordinateurs portables testés avec les détails paramétrés sur Ultra.
Intel UHD Graphics Xe 16EUs (Tiger Lake-H)
...
NVIDIA GeForce RTX 2070 Super Mobile
NVIDIA GeForce RTX 3070 Ti Laptop GPU
max:
...
NVIDIA GeForce RTX 3070 Ti Laptop GPU
max:
...
NVIDIA GeForce RTX 2070 Super Max-Q
NVIDIA GeForce RTX 3070 Ti Laptop GPU
max:
...
NVIDIA GeForce RTX 2070 Super Max-Q
NVIDIA GeForce RTX 3070 Ti Laptop GPU
...
max:
...
NVIDIA GeForce RTX 2070 Super Mobile
NVIDIA GeForce RTX 3070 Ti Laptop GPU
...
max:
...
NVIDIA GeForce RTX 2070 Super Mobile
NVIDIA GeForce RTX 3070 Ti Laptop GPU
max:
» Jouable avec tous les ordinateurs portables testés avec les détails paramétrés sur Ultra.
...
NVIDIA GeForce RTX 2070 Super Mobile
NVIDIA GeForce RTX 3070 Ti Laptop GPU
max:
Intel UHD Graphics Xe 16EUs (Tiger Lake-H)
...
NVIDIA GeForce RTX 2070 Super Max-Q
NVIDIA GeForce RTX 2070 Super Mobile
NVIDIA GeForce RTX 3070 Ti Laptop GPU
...
max:
...
NVIDIA GeForce RTX 2070 Super Max-Q
NVIDIA GeForce RTX 2070 Super Mobile
NVIDIA GeForce RTX 3070 Ti Laptop GPU
...
max:
...
NVIDIA GeForce RTX 2070 Super Max-Q
NVIDIA GeForce RTX 2070 Super Mobile
NVIDIA GeForce RTX 3070 Ti Laptop GPU
max:
...
NVIDIA GeForce RTX 2070 Super Mobile
NVIDIA GeForce RTX 3070 Ti Laptop GPU
max:
...
NVIDIA GeForce RTX 2070 Super Mobile
NVIDIA GeForce RTX 3070 Ti Laptop GPU
max:
» Jouable avec tous les ordinateurs portables testés avec les détails paramétrés sur Ultra.
Additional Benchmarks
Ultra Preset + Ultra Ray Tracing (DX12) 1920x1080
41.2 [X] Aorus 17 XE4 1.52
Intel Core i7-12700H 1.7GHz
GeForce RTX 3070 Ti Laptop GPU
min:
16.22 fps, P1:
29.19 fps, max:
112.53 fps
0 100 200 300 Tooltip Stealth GS66 12UGS: Ø296 (248.309-322.2)
...
NVIDIA GeForce RTX 2070 Super Mobile
NVIDIA GeForce RTX 3070 Ti Laptop GPU
max:
0 100 200 300 Tooltip Stealth GS66 12UGS: Ø279 (231.08-395)
...
NVIDIA GeForce RTX 2070 Super Mobile
NVIDIA GeForce RTX 2080 Super Mobile
NVIDIA GeForce RTX 3070 Ti Laptop GPU
max:
0 100 200 Tooltip Stealth GS66 12UGS: Ø239 (192.219-268.21)
...
NVIDIA GeForce RTX 2070 Super Mobile
NVIDIA GeForce RTX 3070 Ti Laptop GPU
NVIDIA GeForce RTX 2080 Super Mobile
max:
0 100 Tooltip Stealth GS66 12UGS: Ø169.1 (148.016-184)
...
NVIDIA GeForce RTX 3070 Ti Laptop GPU
NVIDIA GeForce RTX 2080 Super Mobile
max:
0 100 Tooltip Stealth GS66 12UGS: Ø96.5 (83.1-122.4)
...
NVIDIA GeForce GTX 1070 Mobile
NVIDIA GeForce RTX 3070 Ti Laptop GPU
NVIDIA GeForce RTX 2080 Super Mobile
max:
» Jouable avec tous les ordinateurs portables testés avec les détails paramétrés sur Ultra.
0 100 200 Tooltip 17 XE4: Ø164.9 (144.57-235.6)
...
NVIDIA GeForce RTX 2070 Super Mobile
NVIDIA GeForce RTX 3070 Ti Laptop GPU
max:
0 100 Tooltip Stealth GS66 12UGS: Ø106.2 (96.128-131.1)
17 XE4: Ø122.3 (114.644-144.7)
Intel UHD Graphics G1 (Ice Lake 32 EU)
...
NVIDIA GeForce RTX 2070 Super Mobile
NVIDIA GeForce RTX 3070 Ti Laptop GPU
max:
0 100 200 300 400 Tooltip Stealth GS66 12UGS: Ø99.3 (90.724-107.4)
17 XE4: Ø124.9 (103.39-462)
...
NVIDIA GeForce RTX 2070 Super Mobile
NVIDIA GeForce RTX 3070 Ti Laptop GPU
NVIDIA GeForce RTX 2080 Super Mobile
max:
0 Tooltip Stealth GS66 12UGS: Ø67.8 (63.145-78.1)
...
NVIDIA GeForce RTX 3070 Ti Laptop GPU
NVIDIA GeForce RTX 2080 Super Mobile
max:
0 100 Tooltip Stealth GS66 12UGS: Ø42.9 (35.069-123.8)
NVIDIA GeForce GTX 1050 Ti Mobile
...
NVIDIA GeForce GTX 1070 Mobile
NVIDIA GeForce RTX 3070 Ti Laptop GPU
NVIDIA GeForce RTX 2080 Super Mobile
max:
» Jouable avec tous les ordinateurs portables testés avec les détails paramétrés sur Élevé.
...
NVIDIA GeForce RTX 2070 Super Max-Q
NVIDIA GeForce RTX 2070 Super Mobile
NVIDIA GeForce RTX 3070 Ti Laptop GPU
max:
...
NVIDIA GeForce RTX 2070 Super Max-Q
NVIDIA GeForce RTX 2070 Super Mobile
NVIDIA GeForce RTX 3070 Ti Laptop GPU
NVIDIA GeForce RTX 2080 Super Mobile
max:
...
NVIDIA GeForce RTX 2070 Super Max-Q
NVIDIA GeForce RTX 2070 Super Mobile
NVIDIA GeForce RTX 3070 Ti Laptop GPU
NVIDIA GeForce RTX 2080 Super Mobile
max:
...
NVIDIA GeForce RTX 2070 Super Mobile
NVIDIA GeForce RTX 3070 Ti Laptop GPU
NVIDIA GeForce RTX 2080 Super Mobile
max:
NVIDIA GeForce RTX 2070 Super Mobile
NVIDIA GeForce RTX 3070 Ti Laptop GPU
NVIDIA GeForce RTX 2080 Super Mobile
max:
» Jouable avec tous les ordinateurs portables testés avec les détails paramétrés sur Ultra.
0 100 200 300 Tooltip Stealth GS66 12UGS: Ø188.3 (154.793-333)
...
NVIDIA GeForce RTX 3070 Ti Laptop GPU
max:
0 100 Tooltip Stealth GS66 12UGS: Ø78.6 (63.052-135.5)
...
NVIDIA GeForce GTX 1070 Mobile
NVIDIA GeForce RTX 3070 Ti Laptop GPU
max:
0 100 Tooltip Stealth GS66 12UGS: Ø68.5 (57.15-108.5)
...
NVIDIA GeForce RTX 3070 Ti Laptop GPU
max:
0 Tooltip Stealth GS66 12UGS: Ø50.5 (43.151-65.3)
...
NVIDIA GeForce RTX 3070 Ti Laptop GPU
max:
0 Tooltip Stealth GS66 12UGS: Ø31.6 (24.371-60.6)
...
NVIDIA GeForce GTX 1070 Mobile
NVIDIA GeForce RTX 3070 Ti Laptop GPU
max:
» Jouable avec tous les ordinateurs portables testés avec les détails paramétrés sur Ultra.
0 100 Tooltip Blade 15 OLED (Early 2022): Ø129.3 (76.342-182.3)
Intel UHD Graphics Xe 16EUs (Tiger Lake-H)
...
NVIDIA GeForce RTX 2070 Super Mobile
NVIDIA GeForce RTX 3070 Ti Laptop GPU
0 100 Tooltip Blade 15 OLED (Early 2022): Ø101.3 (81.405-138.7)
AMD Radeon RX Vega 8 (Ryzen 2000/3000)
...
NVIDIA GeForce RTX 2070 Super Mobile
NVIDIA GeForce RTX 3070 Ti Laptop GPU
0 100 Tooltip Blade 15 OLED (Early 2022): Ø73.1 (58-110.2)
...
NVIDIA GeForce RTX 2070 Super Mobile
NVIDIA GeForce RTX 2080 Super Mobile
NVIDIA GeForce RTX 3070 Ti Laptop GPU
0 100 Tooltip Blade 15 OLED (Early 2022): Ø55.4 (43.967-101.5)
...
NVIDIA GeForce RTX 2070 Super Mobile
NVIDIA GeForce RTX 2080 Super Mobile
NVIDIA GeForce RTX 3070 Ti Laptop GPU
0 Tooltip Blade 15 OLED (Early 2022): Ø43.9 (40.008-89.3)
NVIDIA GeForce GTX 1050 Ti Mobile
...
NVIDIA GeForce RTX 2080 Super Mobile
NVIDIA GeForce RTX 3070 Ti Laptop GPU
» Jouable avec tous les ordinateurs portables testés avec les détails paramétrés sur Ultra.
Additional Benchmarks
Low-End TAAAA 1920x1080
0 100 200 Tooltip 17 XE4: Ø166.5 (144.306-296.4)
...
NVIDIA GeForce RTX 2070 Super Mobile
NVIDIA GeForce RTX 3070 Ti Laptop GPU
NVIDIA GeForce RTX 2070 Super Max-Q
max:
AMD Radeon RX 6700 XT
0 100 200 Tooltip Stealth GS66 12UGS: Ø147.2 (128.022-211.3)
17 XE4: Ø148.1 (138.289-174.9)
...
NVIDIA GeForce RTX 2070 Super Mobile
NVIDIA GeForce RTX 3070 Ti Laptop GPU
max:
0 100 Tooltip Stealth GS66 12UGS: Ø134.2 (123.243-154.8)
17 XE4: Ø141.5 (125.8-168.2)
...
NVIDIA GeForce RTX 2070 Super Mobile
NVIDIA GeForce RTX 3070 Ti Laptop GPU
NVIDIA GeForce RTX 2080 Super Mobile
max:
0 100 200 Tooltip Stealth GS66 12UGS: Ø135 (121.859-203.6)
17 XE4: Ø145.7 (128.28-254.7)
...
NVIDIA GeForce RTX 2070 Super Mobile
NVIDIA GeForce RTX 3070 Ti Laptop GPU
NVIDIA GeForce RTX 2080 Super Mobile
max:
0 100 Tooltip Stealth GS66 12UGS: Ø98.4 (88.062-144.5)
...
NVIDIA GeForce RTX 2070 Super Mobile
NVIDIA GeForce RTX 3070 Ti Laptop GPU
NVIDIA GeForce RTX 2080 Super Mobile
max:
0 Tooltip Stealth GS66 12UGS: Ø57.8 (51.467-71.3)
...
NVIDIA GeForce RTX 2070 Super Mobile
NVIDIA GeForce RTX 3070 Ti Laptop GPU
NVIDIA GeForce RTX 2080 Super Mobile
max:
» Jouable avec tous les ordinateurs portables testés avec les détails paramétrés sur Ultra.
...
NVIDIA GeForce RTX 2070 Super Mobile
NVIDIA GeForce RTX 3070 Ti Laptop GPU
NVIDIA GeForce RTX 2080 Super Mobile
max:
...
NVIDIA GeForce RTX 2070 Super Mobile
NVIDIA GeForce RTX 3070 Ti Laptop GPU
NVIDIA GeForce RTX 2080 Super Mobile
max:
...
NVIDIA GeForce RTX 2070 Super Mobile
NVIDIA GeForce RTX 3070 Ti Laptop GPU
NVIDIA GeForce RTX 2080 Super Mobile
max:
...
NVIDIA GeForce RTX 2070 Super Mobile
NVIDIA GeForce RTX 3070 Ti Laptop GPU
NVIDIA GeForce RTX 2080 Super Mobile
max:
...
NVIDIA GeForce RTX 2070 Super Mobile
NVIDIA GeForce RTX 3070 Ti Laptop GPU
NVIDIA GeForce RTX 2080 Super Mobile
max:
» Jouable avec tous les ordinateurs portables testés avec les détails paramétrés sur Ultra.
0 100 200 300 400 Tooltip 17 XE4: Ø368 (162.078-439.21)
...
AMD Radeon 680M
NVIDIA GeForce RTX 3070 Ti Laptop GPU
max:
0 100 200 Tooltip Stealth GS66 12UGS: Ø227 (183.42-281.33)
17 XE4: Ø247 (173.93-281)
Intel UHD Graphics Xe 16EUs (Tiger Lake-H)
...
NVIDIA GeForce RTX 2070 Super Mobile
NVIDIA GeForce RTX 2080 Super Mobile
NVIDIA GeForce RTX 3070 Ti Laptop GPU
max:
0 100 200 Tooltip Stealth GS66 12UGS: Ø197.5 (167.448-227.08)
17 XE4: Ø212 (172.67-236.584)
Intel Iris Plus Graphics G7 (Ice Lake 64 EU)
...
NVIDIA GeForce RTX 2070 Super Mobile
NVIDIA GeForce RTX 3070 Ti Laptop GPU
NVIDIA GeForce RTX 2080 Super Mobile
max:
0 100 200 Tooltip Stealth GS66 12UGS: Ø192.3 (134.101-240.2)
17 XE4: Ø202 (152.044-244.3)
AMD Radeon RX Vega 8 (Ryzen 2000/3000)
...
NVIDIA GeForce RTX 2070 Super Mobile
NVIDIA GeForce RTX 3070 Ti Laptop GPU
NVIDIA GeForce RTX 2080 Super Mobile
max:
0 100 200 Tooltip Stealth GS66 12UGS: Ø151.9 (125.1-203.8)
...
NVIDIA GeForce RTX 2070 Super Mobile
NVIDIA GeForce RTX 3070 Ti Laptop GPU
NVIDIA GeForce RTX 2080 Super Mobile
max:
0 100 200 300 Tooltip Stealth GS66 12UGS: Ø95.4 (71.636-398)
...
NVIDIA GeForce RTX 2070 Super Mobile
NVIDIA GeForce RTX 3070 Ti Laptop GPU
NVIDIA GeForce RTX 2080 Super Mobile
max:
» Jouable avec tous les ordinateurs portables testés avec les détails paramétrés sur Ultra.
0 100 200 Tooltip Stealth GS66 12UGS: Ø147.1 (132.477-249)
...
NVIDIA GeForce RTX 2070 Super Max-Q
NVIDIA GeForce RTX 2070 Super Mobile
NVIDIA GeForce RTX 3070 Ti Laptop GPU
NVIDIA GeForce RTX 2080 Super Mobile
0 100 Tooltip Stealth GS66 12UGS: Ø120.1 (107.03-146.5)
ROG Flow X16 GV601RW-M5082W: Ø131 (110.797-175.3)
...
NVIDIA GeForce RTX 2070 Super Mobile
NVIDIA GeForce RTX 3070 Ti Laptop GPU
NVIDIA GeForce RTX 2080 Super Mobile
0 100 200 300 Tooltip Stealth GS66 12UGS: Ø95 (72.067-326)
ROG Flow X16 GV601RW-M5082W: Ø87 (72.01-154.3)
...
NVIDIA GeForce RTX 2070 Super Mobile
NVIDIA GeForce RTX 3070 Ti Laptop GPU
NVIDIA GeForce RTX 2080 Super Mobile
max:
0 Tooltip Stealth GS66 12UGS: Ø40.5 (35.037-63.8)
NVIDIA GeForce GTX 1050 Max-Q
...
NVIDIA GeForce RTX 2070 Super Max-Q
NVIDIA GeForce RTX 2070 Super Mobile
NVIDIA GeForce RTX 3070 Ti Laptop GPU
NVIDIA GeForce RTX 2080 Super Mobile
max:
» Jouable avec tous les ordinateurs portables testés avec les détails paramétrés sur Élevé.
...
NVIDIA GeForce RTX 3070 Ti Laptop GPU
NVIDIA GeForce RTX 2070 Super Max-Q
...
max:
Intel UHD Graphics Xe 16EUs (Tiger Lake-H)
...
NVIDIA GeForce RTX 2070 Super Mobile
NVIDIA GeForce RTX 3070 Ti Laptop GPU
NVIDIA GeForce RTX 2080 Super Mobile
...
max:
Intel Iris Plus Graphics G4 (Ice Lake 48 EU)
...
NVIDIA GeForce RTX 2070 Super Mobile
NVIDIA GeForce RTX 3070 Ti Laptop GPU
NVIDIA GeForce RTX 2080 Super Mobile
...
max:
...
NVIDIA GeForce RTX 2070 Super Mobile
NVIDIA GeForce RTX 3070 Ti Laptop GPU
NVIDIA GeForce RTX 2080 Super Mobile
...
max:
» Jouable avec tous les ordinateurs portables testés avec les détails paramétrés sur Ultra.
...
NVIDIA GeForce RTX 3070 Ti Laptop GPU
...
max:
...
NVIDIA GeForce RTX 2070 Super Mobile
NVIDIA GeForce RTX 2080 Super Mobile
NVIDIA GeForce RTX 3070 Ti Laptop GPU
...
max:
...
NVIDIA GeForce RTX 2070 Super Mobile
NVIDIA GeForce RTX 2080 Super Mobile
NVIDIA GeForce RTX 3070 Ti Laptop GPU
...
max:
AMD Radeon RX Vega 8 (Ryzen 2000/3000)
...
NVIDIA GeForce RTX 2070 Super Mobile
NVIDIA GeForce RTX 2080 Super Mobile
NVIDIA GeForce RTX 3070 Ti Laptop GPU
max:
...
NVIDIA GeForce RTX 2070 Super Max-Q
NVIDIA GeForce RTX 3070 Ti Laptop GPU
NVIDIA GeForce RTX 2070 Super Mobile
NVIDIA GeForce RTX 2080 Super Mobile
...
max:
AMD Radeon Pro W6800
» Jouable avec tous les ordinateurs portables testés avec les détails paramétrés sur Ultra.
Additional Benchmarks
Ultra Quality DXR 16xAF 1920x1080
...
NVIDIA GeForce RTX 2070 Super Mobile
NVIDIA GeForce RTX 3070 Ti Laptop GPU
NVIDIA GeForce RTX 2080 Super Mobile
...
max:
...
NVIDIA GeForce RTX 2080 Super Mobile
NVIDIA GeForce RTX 3070 Ti Laptop GPU
max:
...
NVIDIA GeForce RTX 2070 Super Mobile
NVIDIA GeForce RTX 3070 Ti Laptop GPU
NVIDIA GeForce RTX 2080 Super Mobile
max:
» Jouable avec tous les ordinateurs portables testés avec les détails paramétrés sur Ultra.
150 [X] Aorus 17 XE4 1.47.22.14 D3D12, Silence Mode
Intel Core i7-12700H @2.1GHz
GeForce RTX 3070 Ti Laptop GPU
min:
6.8 fps, P1:
116 fps, max:
273 fps
289 304 305 351 358 [X] Acer Nitro 5 AN515-58-72QR 1.47.22.14 D3D12
Intel Core i7-12700H 1.7GHz
GeForce RTX 3070 Ti Laptop GPU
min:
88.4 fps, P1:
267 fps, max:
545 fps
369 376 383 393 405 425 [X] MSI Katana GF76 12UGS 1.47.22.14 D3D12
Intel Core i7-12700H 1.7GHz
GeForce RTX 3070 Ti Laptop GPU
min:
228 fps, P1:
308 fps, max:
708 fps
426 [X] Aorus 17 XE4 1.47.22.14 D3D12
Intel Core i7-12700H 1.7GHz
GeForce RTX 3070 Ti Laptop GPU
min:
205 fps, P1:
310 fps, max:
694 fps
435 [X] MSI Katana GF66 12UGS 1.47.22.14 D3D12
Intel Core i7-12700H 1.7GHz
GeForce RTX 3070 Ti Laptop GPU
min:
47 fps, P1:
314 fps, max:
705 fps
441 [X] HP Omen 17-ck1075ng 1.47.22.14 D3D12
Intel Core i7-12700H 1.7GHz
GeForce RTX 3070 Ti Laptop GPU
min:
66.7 fps, P1:
300 fps, max:
715 fps
445 [X] Aorus 15 XE5 1.47.22.14 D3D12
Intel Core i7-12700H 1.7GHz
GeForce RTX 3070 Ti Laptop GPU
min:
200 fps, P1:
330 fps, max:
677 fps
453 453 [X] MSI GE67 HX 12UGS 1.47.22.14 D3D12
Intel Core i7-12800HX 1.5GHz
GeForce RTX 3070 Ti Laptop GPU
min:
227 fps, P1:
346 fps, max:
687 fps
460 471 [X] MSI Vector GP66 12UGS 1.47.22.14 D3D12
Intel Core i9-12900H 1.8GHz
GeForce RTX 3070 Ti Laptop GPU
min:
207 fps, P1:
340 fps, max:
729 fps
490 [X] Eurocom Raptor X15 1.47.22.14 D3D12
Intel Core i7-12700K 2.7GHz
GeForce RTX 3070 Ti Laptop GPU
min:
229 fps, P1:
348 fps, max:
816 fps
519 ~ 396 fps
+ Comparer
- Cacher la comparaison
...
NVIDIA GeForce RTX 3070 Ti Laptop GPU
...
NVIDIA GeForce RTX 2080 Super Mobile
max:
116 [X] Aorus 17 XE4 1.47.22.14 D3D12, Silence Mode
Intel Core i7-12700H @2.1GHz
GeForce RTX 3070 Ti Laptop GPU
min:
67.6 fps, P1:
88.1 fps, max:
161 fps
212 [X] Acer Nitro 5 AN515-46-R1A1 1.47.22.14 D3D12
AMD Ryzen 7 6800H 3.2GHz
GeForce RTX 3070 Ti Laptop GPU
min:
100.1 fps, P1:
159.2 fps, max:
321 fps
214 216 [X] MSI Stealth GS66 12UGS 1.47.22.14 D3D12
Intel Core i7-12700H 1.7GHz
GeForce RTX 3070 Ti Laptop GPU
min:
117 fps, P1:
177 fps, max:
400 fps
224 [X] MSI Katana GF76 12UGS 1.47.22.14 D3D12
Intel Core i7-12700H 1.7GHz
GeForce RTX 3070 Ti Laptop GPU
min:
135.6 fps, P1:
178.2 fps, max:
363 fps
224 227 229 231 [X] Acer Nitro 5 AN515-58-72QR 1.47.22.14 D3D12
Intel Core i7-12700H 1.7GHz
GeForce RTX 3070 Ti Laptop GPU
min:
125.4 fps, P1:
158.2 fps, max:
433 fps
232 [X] MSI Katana GF66 12UGS 1.47.22.14 D3D12
Intel Core i7-12700H 1.7GHz
GeForce RTX 3070 Ti Laptop GPU
min:
110.6 fps, P1:
177.2 fps, max:
375 fps
240 244 [X] Aorus 17 XE4 1.47.22.14 D3D12
Intel Core i7-12700H 1.7GHz
GeForce RTX 3070 Ti Laptop GPU
min:
107 fps, P1:
183 fps, max:
392 fps
254 255 [X] Aorus 15 XE5 1.47.22.14 D3D12
Intel Core i7-12700H 1.7GHz
GeForce RTX 3070 Ti Laptop GPU
min:
133.2 fps, P1:
207 fps, max:
425 fps
257 258 259 [X] HP Omen 16-b1090ng 1.47.22.14 D3D12
Intel Core i7-12700H 1.7GHz
GeForce RTX 3070 Ti Laptop GPU
min:
78.8 fps, P1:
156.8 fps, max:
492 fps
263 [X] MSI Vector GP76 12UGS-434 1.47.22.14 D3D12
Intel Core i7-12700H 1.7GHz
GeForce RTX 3070 Ti Laptop GPU
min:
107.6 fps, P1:
177.5 fps, max:
483 fps
267 [X] HP Omen 17-ck1075ng 1.47.22.14 D3D12
Intel Core i7-12700H 1.7GHz
GeForce RTX 3070 Ti Laptop GPU
min:
96.3 fps, P1:
210 fps, max:
447 fps
270 271 [X] Eurocom Raptor X15 1.47.22.14 D3D12
Intel Core i7-12700K 2.7GHz
GeForce RTX 3070 Ti Laptop GPU
min:
55.4 fps, P1:
209 fps, max:
468 fps
274 288 [X] MSI GE67 HX 12UGS 1.47.22.14 D3D12
Intel Core i7-12800HX 1.5GHz
GeForce RTX 3070 Ti Laptop GPU
min:
173 fps, P1:
227 fps, max:
473 fps
298 [X] MSI Vector GP66 12UGS 1.47.22.14 D3D12
Intel Core i9-12900H 1.8GHz
GeForce RTX 3070 Ti Laptop GPU
min:
114 fps, P1:
246 fps, max:
428 fps
298 ~ 245 fps
+ Comparer
- Cacher la comparaison
...
NVIDIA GeForce RTX 3070 Ti Laptop GPU
NVIDIA GeForce RTX 2080 Super Mobile
...
max:
112 [X] Aorus 17 XE4 1.47.22.14 D3D12, Silence Mode
Intel Core i7-12700H @2.1GHz
GeForce RTX 3070 Ti Laptop GPU
min:
67.6 fps, P1:
84.6 fps, max:
154 fps
164.1 [X] HP Omen 16-b1090ng 1.47.22.14 D3D12
Intel Core i7-12700H 1.7GHz
GeForce RTX 3070 Ti Laptop GPU
min:
81.9 fps, P1:
109.9 fps, max:
326 fps
175 [X] MSI Stealth GS66 12UGS 1.47.22.14 D3D12
Intel Core i7-12700H 1.7GHz
GeForce RTX 3070 Ti Laptop GPU
min:
95.7 fps, P1:
131 fps, max:
371 fps
183.1 [X] MSI Katana GF76 12UGS 1.47.22.14 D3D12
Intel Core i7-12700H 1.7GHz
GeForce RTX 3070 Ti Laptop GPU
min:
44.6 fps, P1:
132.3 fps, max:
302 fps
184 184.7 [X] Aorus 17X XES 1.47.22.14 D3D12
Intel Core i9-12900HX 1.7GHz
GeForce RTX 3070 Ti Laptop GPU
min:
122.1 fps, P1:
133.5 fps, max:
308 fps
186.1 187.9 190.3 193.4 [X] MSI Katana GF66 12UGS 1.47.22.14 D3D12
Intel Core i7-12700H 1.7GHz
GeForce RTX 3070 Ti Laptop GPU
min:
81.6 fps, P1:
142 fps, max:
330 fps
197.2 198.2 [X] Acer Nitro 5 AN515-58-72QR 1.47.22.14 D3D12
Intel Core i7-12700H 1.7GHz
GeForce RTX 3070 Ti Laptop GPU
min:
99 fps, P1:
137.5 fps, max:
380 fps
200 [X] Aorus 17 XE4 1.47.22.14 D3D12
Intel Core i7-12700H 1.7GHz
GeForce RTX 3070 Ti Laptop GPU
min:
42.1 fps, P1:
151 fps, max:
336 fps
202 206 209 212 [X] Aorus 15 XE5 1.47.22.14 D3D12
Intel Core i7-12700H 1.7GHz
GeForce RTX 3070 Ti Laptop GPU
min:
42.5 fps, P1:
153.3 fps, max:
326 fps
214 [X] HP Omen 17-ck1075ng 1.47.22.14 D3D12
Intel Core i7-12700H 1.7GHz
GeForce RTX 3070 Ti Laptop GPU
min:
73.2 fps, P1:
156.4 fps, max:
440 fps
217 222 [X] MSI Vector GP76 12UGS-434 1.47.22.14 D3D12
Intel Core i7-12700H 1.7GHz
GeForce RTX 3070 Ti Laptop GPU
min:
94.8 fps, P1:
155.5 fps, max:
472 fps
223 [X] Eurocom Raptor X15 1.47.22.14 D3D12
Intel Core i7-12700K 2.7GHz
GeForce RTX 3070 Ti Laptop GPU
min:
137.3 fps, P1:
166.1 fps, max:
378 fps
224 235 235 [X] MSI GE67 HX 12UGS 1.47.22.14 D3D12
Intel Core i7-12800HX 1.5GHz
GeForce RTX 3070 Ti Laptop GPU
min:
75.3 fps, P1:
181.1 fps, max:
443 fps
241 244 [X] MSI Vector GP66 12UGS 1.47.22.14 D3D12
Intel Core i9-12900H 1.8GHz
GeForce RTX 3070 Ti Laptop GPU
min:
113 fps, P1:
182 fps, max:
424 fps
248 ~ 203 fps
+ Comparer
- Cacher la comparaison
...
NVIDIA GeForce RTX 3070 Ti Laptop GPU
NVIDIA GeForce RTX 2080 Super Mobile
...
max:
109 [X] Aorus 17 XE4 1.47.22.14 D3D12, Silence Mode
Intel Core i7-12700H @2.1GHz
GeForce RTX 3070 Ti Laptop GPU
min:
66.6 fps, P1:
79.6 fps, max:
152 fps
146.6 [X] HP Omen 16-b1090ng 1.47.22.14 D3D12
Intel Core i7-12700H 1.7GHz
GeForce RTX 3070 Ti Laptop GPU
min:
72.6 fps, P1:
102.4 fps, max:
272 fps
149.1 [X] Asus TUF Dash F15 FX517ZR 1.47.22.14 D3D12, Leise
Intel Core i7-12650H 1.7GHz
GeForce RTX 3070 Ti Laptop GPU
min:
58.5 fps, P1:
103.6 fps, max:
224 fps
151.8 [X] Acer Nitro 5 AN515-58-72QR 1.47.22.14 D3D12, Leise
Intel Core i7-12700H 1.7GHz
GeForce RTX 3070 Ti Laptop GPU
min:
42.3 fps, P1:
83.6 fps, max:
337 fps
153 [X] MSI Stealth GS66 12UGS 1.47.22.14 D3D12
Intel Core i7-12700H 1.7GHz
GeForce RTX 3070 Ti Laptop GPU
min:
77.1 fps, P1:
115 fps, max:
342 fps
159.5 [X] MSI Katana GF76 12UGS 1.47.22.14 D3D12
Intel Core i7-12700H 1.7GHz
GeForce RTX 3070 Ti Laptop GPU
min:
112.5 fps, P1:
117.2 fps, max:
272 fps
160.6 162.6 163.2 [X] Aorus 17X XES 1.47.22.14 D3D12
Intel Core i9-12900HX 1.7GHz
GeForce RTX 3070 Ti Laptop GPU
min:
82.8 fps, P1:
122.4 fps, max:
343 fps
163.8 167.2 171.2 [X] MSI Katana GF66 12UGS 1.47.22.14 D3D12
Intel Core i7-12700H 1.7GHz
GeForce RTX 3070 Ti Laptop GPU
min:
98.2 fps, P1:
131 fps, max:
282 fps
173.4 175.9 [X] Razer Blade 15 OLED (Early 2022) 1.47.22.14 D3D12, dGPU
Intel Core i9-12900H 1.8GHz
GeForce RTX 3070 Ti Laptop GPU
min:
41.6 fps, P1:
131.7 fps, max:
317 fps
177 177.4 177.4 [X] Razer Blade 15 RZ09-0421NGG3-R3G1 1.47.22.14 D3D12
Intel Core i9-12900H 1.8GHz
GeForce RTX 3070 Ti Laptop GPU
min:
48.8 fps, P1:
147.4 fps, max:
332 fps
178 [X] Aorus 17 XE4 1.47.22.14 D3D12
Intel Core i7-12700H 1.7GHz
GeForce RTX 3070 Ti Laptop GPU
min:
94.9 fps, P1:
133 fps, max:
311 fps
178.3 [X] Acer Nitro 5 AN515-58-72QR 1.47.22.14 D3D12
Intel Core i7-12700H 1.7GHz
GeForce RTX 3070 Ti Laptop GPU
min:
43.7 fps, P1:
126.3 fps, max:
331 fps
183 [X] Aorus 17 XE4 1.47.22.14 D3D12, Turbo Mode
Intel Core i7-12700H 1.7GHz
GeForce RTX 3070 Ti Laptop GPU
min:
42.4 fps, P1:
134 fps, max:
318 fps
183.8 186.4 [X] HP Omen 17-ck1075ng 1.47.22.14 D3D12
Intel Core i7-12700H 1.7GHz
GeForce RTX 3070 Ti Laptop GPU
min:
71.9 fps, P1:
139.2 fps, max:
381 fps
188.5 [X] Aorus 15 XE5 1.47.22.14 D3D12
Intel Core i7-12700H 1.7GHz
GeForce RTX 3070 Ti Laptop GPU
min:
48.7 fps, P1:
134 fps, max:
325 fps
189 189.7 [X] Acer Nitro 5 AN515-58-72QR 1.47.22.14 D3D12, Leistung
Intel Core i7-12700H 1.7GHz
GeForce RTX 3070 Ti Laptop GPU
min:
68.6 fps, P1:
137 fps, max:
348 fps
191.7 192.1 [X] Aorus 15 XE5 1.47.22.14 D3D12, Turbo Mode
Intel Core i7-12700H 1.7GHz
GeForce RTX 3070 Ti Laptop GPU
min:
74.8 fps, P1:
150.7 fps, max:
315 fps
194 [X] Eurocom Raptor X15 1.47.22.14 D3D12
Intel Core i7-12700K 2.7GHz
GeForce RTX 3070 Ti Laptop GPU
min:
79.8 fps, P1:
146.4 fps, max:
330 fps
195.1 [X] MSI Vector GP76 12UGS-434 1.47.22.14 D3D12
Intel Core i7-12700H 1.7GHz
GeForce RTX 3070 Ti Laptop GPU
min:
81.6 fps, P1:
145.4 fps, max:
348 fps
196.2 199 204 [X] Acer Nitro 5 AN515-58-72QR 1.47.22.14 D3D12, dGPU, Leistung
Intel Core i7-12700H 1.7GHz
GeForce RTX 3070 Ti Laptop GPU
min:
63.4 fps, P1:
152.9 fps, max:
350 fps
207 [X] MSI GE67 HX 12UGS 1.47.22.14 D3D12
Intel Core i7-12800HX 1.5GHz
GeForce RTX 3070 Ti Laptop GPU
min:
107.5 fps, P1:
154.2 fps, max:
325 fps
209 213 [X] MSI Vector GP66 12UGS 1.47.22.14 D3D12
Intel Core i9-12900H 1.8GHz
GeForce RTX 3070 Ti Laptop GPU
min:
67.3 fps, P1:
162 fps, max:
379 fps
217 221 [X] Acer Nitro 5 AN515-46-R1A1 1.47.22.14 D3D12, dGPU
AMD Ryzen 7 6800H 3.2GHz
GeForce RTX 3070 Ti Laptop GPU
min:
40.7 fps, P1:
155.6 fps, max:
352 fps
~ 180 fps
+ Comparer
- Cacher la comparaison
...
NVIDIA GeForce RTX 3070 Ti Laptop GPU
NVIDIA GeForce RTX 2080 Super Mobile
...
max:
110.7 [X] Asus TUF Dash F15 FX517ZR 1.47.22.14 D3D12, Leise
Intel Core i7-12650H 1.7GHz
GeForce RTX 3070 Ti Laptop GPU
min:
53.6 fps, P1:
85.9 fps, max:
187.4 fps
117.4 [X] Acer Nitro 5 AN515-58-72QR 1.47.22.14 D3D12, Leise
Intel Core i7-12700H 1.7GHz
GeForce RTX 3070 Ti Laptop GPU
min:
34.9 fps, P1:
74.6 fps, max:
251 fps
119.3 119.8 130 130 130.9 131.9 [X] Razer Blade 15 RZ09-0421NGG3-R3G1 1.47.22.14 D3D12
Intel Core i9-12900H 1.8GHz
GeForce RTX 3070 Ti Laptop GPU
min:
34.5 fps, P1:
105.9 fps, max:
271 fps
132.3 [X] Razer Blade 15 OLED (Early 2022) 1.47.22.14 D3D12, dGPU
Intel Core i9-12900H 1.8GHz
GeForce RTX 3070 Ti Laptop GPU
min:
15.6 fps, P1:
103.6 fps, max:
342 fps
136.7 136.9 140.9 [X] Aorus 15 XE5 1.47.22.14 D3D12
Intel Core i7-12700H 1.7GHz
GeForce RTX 3070 Ti Laptop GPU
min:
58.7 fps, P1:
115 fps, max:
299 fps
143 144 [X] Acer Nitro 5 AN515-58-72QR 1.47.22.14 D3D12, Leistung
Intel Core i7-12700H 1.7GHz
GeForce RTX 3070 Ti Laptop GPU
min:
13.3 fps, P1:
101.2 fps, max:
271 fps
144.4 [X] Aorus 15 XE5 1.47.22.14 D3D12, Turbo Mode
Intel Core i7-12700H 1.7GHz
GeForce RTX 3070 Ti Laptop GPU
min:
73.2 fps, P1:
116.4 fps, max:
268 fps
148.5 150 151.4 152.6 [X] Acer Nitro 5 AN515-58-72QR 1.47.22.14 D3D12, dGPU, Leistung
Intel Core i7-12700H 1.7GHz
GeForce RTX 3070 Ti Laptop GPU
min:
27 fps, P1:
121.4 fps, max:
225 fps
154.1 [X] MSI GE67 HX 12UGS 1.47.22.14 D3D12
Intel Core i7-12800HX 1.5GHz
GeForce RTX 3070 Ti Laptop GPU
min:
113.5 fps, P1:
117.6 fps, max:
239 fps
160.5 ~ 137 fps
+ Comparer
- Cacher la comparaison
...
NVIDIA GeForce RTX 3070 Ti Laptop GPU
...
max:
...
NVIDIA GeForce RTX 2080 Super Mobile
NVIDIA GeForce RTX 3070 Ti Laptop GPU
...
max:
» Jouable avec tous les ordinateurs portables testés avec les détails paramétrés sur Ultra.
0 100 200 Tooltip Nitro 5 AN515-46-R1A1: Ø134 (97-178)
Nitro 5 AN515-58-72QR: Ø144.2 (113-177)
ROG Strix Scar 15 G533ZW-LN106WS: Ø159.8 (128-204)
15 XE5: Ø166.2 (112-206)
Blade 15 OLED (Early 2022): Ø170.3 (123-212)
17 XE4: Ø176.8 (138-227)
ProArt StudioBook 16 H7600ZW: Ø182.2 (139-242)
...
NVIDIA GeForce RTX 2070 Super Max-Q
NVIDIA GeForce RTX 3070 Ti Laptop GPU
max:
0 100 Tooltip Nitro 5 AN515-58-72QR: Ø105 (87-129)
Nitro 5 AN515-46-R1A1: Ø115.7 (84-151)
Blade 15 OLED (Early 2022): Ø140.8 (112-174)
ROG Strix Scar 15 G533ZW-LN106WS: Ø143 (121-177)
15 XE5: Ø143.6 (114-180)
17 XE4: Ø145.6 (121-177)
ProArt StudioBook 16 H7600ZW: Ø153.6 (127-177)
Omen 17-ck1075ng: Ø109.3 (78-141)
...
NVIDIA GeForce RTX 2070 Super Max-Q
NVIDIA GeForce RTX 3070 Ti Laptop GPU
max:
0 100 200 Tooltip Nitro 5 AN515-58-72QR: Ø99.2 (80-122)
Nitro 5 AN515-46-R1A1: Ø112.4 (91-148)
Blade 15 OLED (Early 2022): Ø134.5 (109-165)
15 XE5: Ø136.8 (108-170)
17 XE4: Ø137.9 (113-167)
ROG Strix Scar 15 G533ZW-LN106WS: Ø137.9 (117-172)
17X XES: Ø143.6 (123-163)
ProArt StudioBook 16 H7600ZW: Ø144.9 (123-167)
Omen 17-ck1075ng: Ø103.9 (76-140)
Vector GP76 12UGS-434: Ø158.3 (126.072-239.7)
...
NVIDIA GeForce RTX 2070 Super Max-Q
NVIDIA GeForce RTX 3070 Ti Laptop GPU
max:
0 100 Tooltip Nitro 5 AN515-58-72QR: Ø91.3 (67-114)
Nitro 5 AN515-58-72QR dGPU, Leistung: Ø102.9 (80-130)
Nitro 5 AN515-46-R1A1: Ø105.9 (83-136)
Nitro 5 AN515-46-R1A1 dGPU: Ø110.3 (86-145)
Blade 15 OLED (Early 2022): Ø126.3 (99-155)
15 XE5: Ø129.1 (102-163)
17 XE4: Ø130.4 (104-158)
ROG Strix Scar 15 G533ZW-LN106WS: Ø130.3 (102-158)
17X XES: Ø135.1 (112-154)
Omen 17-ck1075ng: Ø97.4 (76-135)
ProArt StudioBook 16 H7600ZW: Ø136.6 (118-163)
...
NVIDIA GeForce RTX 2070 Super Max-Q
NVIDIA GeForce RTX 2070 Super Mobile
NVIDIA GeForce RTX 3070 Ti Laptop GPU
...
max:
0 100 Tooltip Nitro 5 AN515-58-72QR: Ø76.7 (55-92)
Nitro 5 AN515-58-72QR dGPU, Leistung: Ø90.1 (66-118)
Blade 15 OLED (Early 2022): Ø99.8 (90-119)
15 XE5: Ø103 (93-124)
ProArt StudioBook 16 H7600ZW: Ø104.1 (89-121)
ROG Strix Scar 15 G533ZW-LN106WS: Ø107.1 (95-118)
...
NVIDIA GeForce RTX 3070 Ti Laptop GPU
...
max:
0 Tooltip ProArt StudioBook 16 H7600ZW: Ø56.5 (50-66)
ROG Strix Scar 15 G533ZW-LN106WS: Ø61.3 (55-71)
...
NVIDIA GeForce RTX 3070 Ti Laptop GPU
...
max:
» Jouable avec tous les ordinateurs portables testés avec les détails paramétrés sur Ultra.
Additional Benchmarks
Low Preset TAA 1920x1080
163 [X] Aorus 17 XE4 1.52
Intel Core i7-12700H 1.7GHz
GeForce RTX 3070 Ti Laptop GPU
min:
131 fps, max:
201 fps
159 [X] Aorus 15 XE5 Intel Core i7-12700H 1.7GHz
GeForce RTX 3070 Ti Laptop GPU
min:
93 fps, max:
196 fps
68.8 [X] Aorus 17 XE4 Silence Mode
Intel Core i7-12700H @2.1GHz
GeForce RTX 3070 Ti Laptop GPU
97.4 100.3 109.5 112.5 [X] Acer Nitro 5 AN515-46-R1A1 dGPU
AMD Ryzen 7 6800H 3.2GHz
GeForce RTX 3070 Ti Laptop GPU
114.9 119.6 126.2 126.3 127.2 127.5 [X] Acer Nitro 5 AN515-58-72QR Leistung
Intel Core i7-12700H 1.7GHz
GeForce RTX 3070 Ti Laptop GPU
128 129.5 [X] Asus TUF Dash F15 FX517ZR Leise
Intel Core i7-12650H 1.7GHz
GeForce RTX 3070 Ti Laptop GPU
130.5 [X] Acer Nitro 5 AN515-58-72QR Leise
Intel Core i7-12700H 1.7GHz
GeForce RTX 3070 Ti Laptop GPU
133.3 135.9 138.6 139 139.1 142 143.2 143.8 144 144.3 [X] Acer Nitro 5 AN515-58-72QR dGPU, Leistung
Intel Core i7-12700H 1.7GHz
GeForce RTX 3070 Ti Laptop GPU
145.5 145.9 [X] Aorus 15 XE5 Turbo Mode
Intel Core i7-12700H 1.7GHz
GeForce RTX 3070 Ti Laptop GPU
147 148 [X] Aorus 17 XE4 Turbo Mode
Intel Core i7-12700H 1.7GHz
GeForce RTX 3070 Ti Laptop GPU
149.4 [X] Razer Blade 15 RZ09-0421NGG3-R3G1 Intel Core i9-12900H 1.8GHz
GeForce RTX 3070 Ti Laptop GPU
150.9 [X] Razer Blade 15 OLED (Early 2022) dGPU
Intel Core i9-12900H 1.8GHz
GeForce RTX 3070 Ti Laptop GPU
151.2 152.5 155 160.9 161 166.8 ~ 135 fps
+ Comparer
- Cacher la comparaison
...
NVIDIA GeForce RTX 2080 Super Mobile
NVIDIA GeForce RTX 3070 Ti Laptop GPU
...
max:
57.3 [X] Aorus 17 XE4 Silence Mode
Intel Core i7-12700H @2.1GHz
GeForce RTX 3070 Ti Laptop GPU
87.9 89.3 94.9 100.8 101.3 [X] Acer Nitro 5 AN515-46-R1A1 dGPU
AMD Ryzen 7 6800H 3.2GHz
GeForce RTX 3070 Ti Laptop GPU
103.6 [X] Acer Nitro 5 AN515-58-72QR Leise
Intel Core i7-12700H 1.7GHz
GeForce RTX 3070 Ti Laptop GPU
103.6 107.5 [X] Acer Nitro 5 AN515-58-72QR Leistung
Intel Core i7-12700H 1.7GHz
GeForce RTX 3070 Ti Laptop GPU
109.1 109.8 111.2 112.9 [X] Asus TUF Dash F15 FX517ZR Leise
Intel Core i7-12650H 1.7GHz
GeForce RTX 3070 Ti Laptop GPU
114.7 115.2 117 117.7 121.6 123 125 126.4 127.5 [X] Acer Nitro 5 AN515-58-72QR dGPU, Leistung
Intel Core i7-12700H 1.7GHz
GeForce RTX 3070 Ti Laptop GPU
128 129.6 [X] Aorus 15 XE5 Turbo Mode
Intel Core i7-12700H 1.7GHz
GeForce RTX 3070 Ti Laptop GPU
130 [X] Razer Blade 15 RZ09-0421NGG3-R3G1 Intel Core i9-12900H 1.8GHz
GeForce RTX 3070 Ti Laptop GPU
130.7 131 132 [X] Aorus 17 XE4 Turbo Mode
Intel Core i7-12700H 1.7GHz
GeForce RTX 3070 Ti Laptop GPU
132.5 [X] Razer Blade 15 OLED (Early 2022) dGPU
Intel Core i9-12900H 1.8GHz
GeForce RTX 3070 Ti Laptop GPU
133.4 135.3 136.1 137.6 141.3 143 145.7 ~ 118 fps
+ Comparer
- Cacher la comparaison
...
NVIDIA GeForce RTX 2070 Super Max-Q
NVIDIA GeForce RTX 2080 Super Mobile
NVIDIA GeForce RTX 3070 Ti Laptop GPU
...
max:
51.6 [X] Aorus 17 XE4 Silence Mode
Intel Core i7-12700H @2.1GHz
GeForce RTX 3070 Ti Laptop GPU
70.8 72.3 77.6 80.8 [X] Acer Nitro 5 AN515-46-R1A1 dGPU
AMD Ryzen 7 6800H 3.2GHz
GeForce RTX 3070 Ti Laptop GPU
81.7 82.9 [X] Acer Nitro 5 AN515-58-72QR Leise
Intel Core i7-12700H 1.7GHz
GeForce RTX 3070 Ti Laptop GPU
83.9 86.9 [X] Acer Nitro 5 AN515-58-72QR Leistung
Intel Core i7-12700H 1.7GHz
GeForce RTX 3070 Ti Laptop GPU
89.7 91.1 91.3 [X] Asus TUF Dash F15 FX517ZR Leise
Intel Core i7-12650H 1.7GHz
GeForce RTX 3070 Ti Laptop GPU
91.4 91.6 92.4 95 95 95.8 100 100.7 [X] Razer Blade 15 RZ09-0421NGG3-R3G1 Intel Core i9-12900H 1.8GHz
GeForce RTX 3070 Ti Laptop GPU
100.8 [X] Razer Blade 15 OLED (Early 2022) dGPU
Intel Core i9-12900H 1.8GHz
GeForce RTX 3070 Ti Laptop GPU
100.9 [X] Acer Nitro 5 AN515-58-72QR dGPU, Leistung
Intel Core i7-12700H 1.7GHz
GeForce RTX 3070 Ti Laptop GPU
101 101.6 102.5 102.8 [X] Aorus 15 XE5 Turbo Mode
Intel Core i7-12700H 1.7GHz
GeForce RTX 3070 Ti Laptop GPU
103 105 [X] Aorus 17 XE4 Turbo Mode
Intel Core i7-12700H 1.7GHz
GeForce RTX 3070 Ti Laptop GPU
105.3 105.9 107.6 108.4 109.9 112 112.5 115 116.9 ~ 96 fps
+ Comparer
- Cacher la comparaison
...
NVIDIA GeForce RTX 2070 Super Max-Q
NVIDIA GeForce RTX 2080 Super Mobile
NVIDIA GeForce RTX 3070 Ti Laptop GPU
...
max:
...
NVIDIA GeForce RTX 2070 Super Max-Q
NVIDIA GeForce RTX 2080 Super Mobile
NVIDIA GeForce RTX 3070 Ti Laptop GPU
...
max:
» Jouable avec tous les ordinateurs portables testés avec les détails paramétrés sur Élevé.
...
NVIDIA GeForce RTX 2070 Super Max-Q
NVIDIA GeForce RTX 3070 Ti Laptop GPU
NVIDIA GeForce RTX 2080 Super Mobile
...
max:
...
NVIDIA GeForce RTX 2070 Super Mobile
NVIDIA GeForce RTX 2080 Super Mobile
NVIDIA GeForce RTX 3070 Ti Laptop GPU
...
max:
49.5 [X] Aorus 17 XE4 1.3, Silence Mode
Intel Core i7-12700H @2.1GHz
GeForce RTX 3070 Ti Laptop GPU
67.4 [X] Acer Nitro 5 AN515-58-72QR 1.3, Leise
Intel Core i7-12700H 1.7GHz
GeForce RTX 3070 Ti Laptop GPU
78.2 [X] Asus TUF Dash F15 FX517ZR 1.3, Leise
Intel Core i7-12650H 1.7GHz
GeForce RTX 3070 Ti Laptop GPU
85.4 87 88.3 89.5 89.7 91.4 94.7 [X] Aorus 17X XES 1.3
Intel Core i9-12900HX 1.7GHz
GeForce RTX 3070 Ti Laptop GPU
94.8 94.9 95.7 96.5 [X] Aorus 17 XE4 1.3
Intel Core i7-12700H 1.7GHz
GeForce RTX 3070 Ti Laptop GPU
96.6 [X] Acer Nitro 5 AN515-58-72QR 1.3, Leistung
Intel Core i7-12700H 1.7GHz
GeForce RTX 3070 Ti Laptop GPU
97.8 [X] Aorus 17 XE4 1.3, Turbo Mode
Intel Core i7-12700H 1.7GHz
GeForce RTX 3070 Ti Laptop GPU
98.1 99.6 100.3 102.8 103.2 103.8 [X] Razer Blade 15 OLED (Early 2022) 1.3, dGPU
Intel Core i9-12900H 1.8GHz
GeForce RTX 3070 Ti Laptop GPU
104.6 [X] Acer Nitro 5 AN515-58-72QR 1.3, dGPU, Leistung
Intel Core i7-12700H 1.7GHz
GeForce RTX 3070 Ti Laptop GPU
104.6 [X] Aorus 15 XE5 1.3
Intel Core i7-12700H 1.7GHz
GeForce RTX 3070 Ti Laptop GPU
106.9 107 107.3 [X] Aorus 15 XE5 1.3, Turbo Mode
Intel Core i7-12700H 1.7GHz
GeForce RTX 3070 Ti Laptop GPU
107.7 108.6 109.5 115 115.6 116.8 117.1 [X] Acer Nitro 5 AN515-46-R1A1 1.3, dGPU
AMD Ryzen 7 6800H 3.2GHz
GeForce RTX 3070 Ti Laptop GPU
122.4 ~ 99 fps
+ Comparer
- Cacher la comparaison
...
NVIDIA GeForce RTX 2070 Super Mobile
NVIDIA GeForce RTX 3070 Ti Laptop GPU
NVIDIA GeForce RTX 2080 Super Mobile
...
max:
57.9 [X] Asus TUF Dash F15 FX517ZR 1.3, Leise
Intel Core i7-12650H 1.7GHz
GeForce RTX 3070 Ti Laptop GPU
59.7 [X] Acer Nitro 5 AN515-58-72QR 1.3, Leise
Intel Core i7-12700H 1.7GHz
GeForce RTX 3070 Ti Laptop GPU
62.5 67 68.2 70.1 72.1 72.2 74.1 74.3 [X] Acer Nitro 5 AN515-58-72QR 1.3, Leistung
Intel Core i7-12700H 1.7GHz
GeForce RTX 3070 Ti Laptop GPU
75.1 75.5 75.9 [X] Razer Blade 15 OLED (Early 2022) 1.3, dGPU
Intel Core i9-12900H 1.8GHz
GeForce RTX 3070 Ti Laptop GPU
76 78.5 79.2 [X] Aorus 15 XE5 1.3
Intel Core i7-12700H 1.7GHz
GeForce RTX 3070 Ti Laptop GPU
79.8 [X] Aorus 15 XE5 1.3, Turbo Mode
Intel Core i7-12700H 1.7GHz
GeForce RTX 3070 Ti Laptop GPU
81 [X] Acer Nitro 5 AN515-58-72QR 1.3, dGPU, Leistung
Intel Core i7-12700H 1.7GHz
GeForce RTX 3070 Ti Laptop GPU
81.1 82.3 85.4 90.4 92.1 [X] Acer Nitro 5 AN515-46-R1A1 1.3, dGPU
AMD Ryzen 7 6800H 3.2GHz
GeForce RTX 3070 Ti Laptop GPU
93 ~ 76 fps
+ Comparer
- Cacher la comparaison
...
NVIDIA GeForce RTX 3070 Ti Laptop GPU
NVIDIA GeForce RTX 2080 Super Mobile
...
max:
...
NVIDIA GeForce RTX 2070 Super Mobile
NVIDIA GeForce RTX 3070 Ti Laptop GPU
NVIDIA GeForce RTX 2080 Super Mobile
max:
» Jouable avec tous les ordinateurs portables testés avec les détails paramétrés sur Élevé.
89.3 [X] Aorus 17 XE4 Silence Mode
Intel Core i7-12700H @2.1GHz
GeForce RTX 3070 Ti Laptop GPU
min:
71.6 fps, max:
-1 fps
130.9 135.4 135.9 137.7 [X] Acer Nitro 5 AN515-46-R1A1 dGPU
AMD Ryzen 7 6800H 3.2GHz
GeForce RTX 3070 Ti Laptop GPU
min:
117.5 fps, max:
-1 fps
145.6 150.4 158.1 [X] Acer Nitro 5 AN515-58-72QR Leistung
Intel Core i7-12700H 1.7GHz
GeForce RTX 3070 Ti Laptop GPU
min:
141.4 fps, max:
-1 fps
159.4 [X] Asus TUF Dash F15 FX517ZR Leise
Intel Core i7-12650H 1.7GHz
GeForce RTX 3070 Ti Laptop GPU
min:
137.1 fps, max:
-1 fps
161 [X] Acer Nitro 5 AN515-58-72QR Leise
Intel Core i7-12700H 1.7GHz
GeForce RTX 3070 Ti Laptop GPU
min:
144.5 fps, max:
-1 fps
161.9 162 163.1 164.6 [X] Razer Blade 15 OLED (Early 2022) dGPU
Intel Core i9-12900H 1.8GHz
GeForce RTX 3070 Ti Laptop GPU
min:
140.4 fps, max:
-1 fps
164.8 166.6 166.9 [X] Acer Nitro 5 AN515-58-72QR dGPU, Leistung
Intel Core i7-12700H 1.7GHz
GeForce RTX 3070 Ti Laptop GPU
min:
148.6 fps, max:
-1 fps
167.8 168.4 [X] Aorus 15 XE5 Intel Core i7-12700H 1.7GHz
GeForce RTX 3070 Ti Laptop GPU
min:
145 fps, max:
-1 fps
168.8 [X] Aorus 15 XE5 Turbo Mode
Intel Core i7-12700H 1.7GHz
GeForce RTX 3070 Ti Laptop GPU
min:
144.9 fps, max:
-1 fps
169 [X] Aorus 17 XE4 Turbo Mode
Intel Core i7-12700H 1.7GHz
GeForce RTX 3070 Ti Laptop GPU
min:
148 fps, max:
-1 fps
171.4 [X] Razer Blade 15 RZ09-0421NGG3-R3G1 Intel Core i9-12900H 1.8GHz
GeForce RTX 3070 Ti Laptop GPU
min:
150.8 fps, max:
-1 fps
172.1 173.6 174 [X] Aorus 17 XE4 Intel Core i7-12700H 1.7GHz
GeForce RTX 3070 Ti Laptop GPU
min:
155.3 fps, max:
-1 fps
178 178 180.4 180.8 [X] HP Omen 16-b1090ng Intel Core i7-12700H 1.7GHz
GeForce RTX 3070 Ti Laptop GPU
min:
154.1 fps, max:
-1 fps
181 181.2 [X] MSI GE67 HX 12UGS Intel Core i7-12800HX 1.5GHz
GeForce RTX 3070 Ti Laptop GPU
min:
161 fps, max:
-1 fps
185 187 190.6 191.9 195.2 199 [X] Eurocom Raptor X15 Intel Core i7-12700K 2.7GHz
GeForce RTX 3070 Ti Laptop GPU
min:
176.3 fps, max:
-1 fps
~ 166 fps
+ Comparer
- Cacher la comparaison
...
NVIDIA GeForce RTX 2070 Super Max-Q
NVIDIA GeForce RTX 2070 Super Mobile
NVIDIA Quadro P620
NVIDIA GeForce RTX 3070 Ti Laptop GPU
NVIDIA GeForce RTX 2080 Super Mobile
...
max:
79.7 [X] Aorus 17 XE4 Silence Mode
Intel Core i7-12700H @2.1GHz
GeForce RTX 3070 Ti Laptop GPU
min:
67.3 fps, max:
-1 fps
120 123.1 125.8 [X] Acer Nitro 5 AN515-46-R1A1 dGPU
AMD Ryzen 7 6800H 3.2GHz
GeForce RTX 3070 Ti Laptop GPU
min:
108.9 fps, max:
-1 fps
128.9 131.1 138 142.6 [X] Acer Nitro 5 AN515-58-72QR Leistung
Intel Core i7-12700H 1.7GHz
GeForce RTX 3070 Ti Laptop GPU
min:
127 fps, max:
-1 fps
142.9 [X] Acer Nitro 5 AN515-58-72QR Leise
Intel Core i7-12700H 1.7GHz
GeForce RTX 3070 Ti Laptop GPU
min:
128.7 fps, max:
-1 fps
145 146.2 [X] Asus TUF Dash F15 FX517ZR Leise
Intel Core i7-12650H 1.7GHz
GeForce RTX 3070 Ti Laptop GPU
min:
124.2 fps, max:
-1 fps
147 [X] Razer Blade 15 OLED (Early 2022) dGPU
Intel Core i9-12900H 1.8GHz
GeForce RTX 3070 Ti Laptop GPU
min:
125.9 fps, max:
-1 fps
148.2 148.2 150.2 [X] Acer Nitro 5 AN515-58-72QR dGPU, Leistung
Intel Core i7-12700H 1.7GHz
GeForce RTX 3070 Ti Laptop GPU
min:
134.1 fps, max:
-1 fps
150.7 152 [X] Aorus 17 XE4 Turbo Mode
Intel Core i7-12700H 1.7GHz
GeForce RTX 3070 Ti Laptop GPU
min:
134.1 fps, max:
-1 fps
152.8 153.6 153.7 155 [X] Aorus 17 XE4 Intel Core i7-12700H 1.7GHz
GeForce RTX 3070 Ti Laptop GPU
min:
136.7 fps, max:
-1 fps
155.6 [X] Razer Blade 15 RZ09-0421NGG3-R3G1 Intel Core i9-12900H 1.8GHz
GeForce RTX 3070 Ti Laptop GPU
min:
137 fps, max:
-1 fps
156.5 [X] Aorus 15 XE5 Turbo Mode
Intel Core i7-12700H 1.7GHz
GeForce RTX 3070 Ti Laptop GPU
min:
134.9 fps, max:
-1 fps
158 [X] Aorus 15 XE5 Intel Core i7-12700H 1.7GHz
GeForce RTX 3070 Ti Laptop GPU
min:
136.2 fps, max:
-1 fps
159.3 161 161.2 [X] HP Omen 16-b1090ng Intel Core i7-12700H 1.7GHz
GeForce RTX 3070 Ti Laptop GPU
min:
142.4 fps, max:
-1 fps
164.7 165.1 165.6 [X] MSI GE67 HX 12UGS Intel Core i7-12800HX 1.5GHz
GeForce RTX 3070 Ti Laptop GPU
min:
143.9 fps, max:
-1 fps
166 169 173.3 174.7 174.7 177.5 178.4 [X] Eurocom Raptor X15 Intel Core i7-12700K 2.7GHz
GeForce RTX 3070 Ti Laptop GPU
min:
158.6 fps, max:
-1 fps
~ 151 fps
+ Comparer
- Cacher la comparaison
...
NVIDIA Quadro P620
NVIDIA GeForce RTX 2070 Super Mobile
NVIDIA GeForce RTX 2070 Super Max-Q
NVIDIA GeForce RTX 3070 Ti Laptop GPU
NVIDIA GeForce RTX 2080 Super Mobile
...
max:
NVIDIA GeForce RTX 3070 Ti
75.4 [X] Aorus 17 XE4 Silence Mode
Intel Core i7-12700H @2.1GHz
GeForce RTX 3070 Ti Laptop GPU
min:
61 fps, max:
-1 fps
112.1 116 116.3 122.5 [X] Acer Nitro 5 AN515-46-R1A1 dGPU
AMD Ryzen 7 6800H 3.2GHz
GeForce RTX 3070 Ti Laptop GPU
min:
104.2 fps, max:
-1 fps
126 128.1 [X] Asus TUF Dash F15 FX517ZR Leise
Intel Core i7-12650H 1.7GHz
GeForce RTX 3070 Ti Laptop GPU
min:
104.5 fps, max:
-1 fps
131.2 [X] Acer Nitro 5 AN515-58-72QR Leise
Intel Core i7-12700H 1.7GHz
GeForce RTX 3070 Ti Laptop GPU
min:
116.1 fps, max:
-1 fps
132.2 132.4 [X] Acer Nitro 5 AN515-58-72QR Leistung
Intel Core i7-12700H 1.7GHz
GeForce RTX 3070 Ti Laptop GPU
min:
118.2 fps, max:
-1 fps
133.3 138.1 139.8 [X] Razer Blade 15 OLED (Early 2022) dGPU
Intel Core i9-12900H 1.8GHz
GeForce RTX 3070 Ti Laptop GPU
min:
119.5 fps, max:
-1 fps
140.9 141.2 142 [X] Aorus 17 XE4 Turbo Mode
Intel Core i7-12700H 1.7GHz
GeForce RTX 3070 Ti Laptop GPU
min:
124.5 fps, max:
-1 fps
142.6 143.4 145.1 [X] Acer Nitro 5 AN515-58-72QR dGPU, Leistung
Intel Core i7-12700H 1.7GHz
GeForce RTX 3070 Ti Laptop GPU
min:
123.5 fps, max:
-1 fps
147 [X] Aorus 17 XE4 Intel Core i7-12700H 1.7GHz
GeForce RTX 3070 Ti Laptop GPU
min:
130.6 fps, max:
-1 fps
148.1 148.3 [X] Aorus 15 XE5 Turbo Mode
Intel Core i7-12700H 1.7GHz
GeForce RTX 3070 Ti Laptop GPU
min:
127.8 fps, max:
-1 fps
148.4 148.4 [X] Aorus 15 XE5 Intel Core i7-12700H 1.7GHz
GeForce RTX 3070 Ti Laptop GPU
min:
127.4 fps, max:
-1 fps
149.1 [X] HP Omen 16-b1090ng Intel Core i7-12700H 1.7GHz
GeForce RTX 3070 Ti Laptop GPU
min:
131.9 fps, max:
-1 fps
150 150 [X] Razer Blade 15 RZ09-0421NGG3-R3G1 Intel Core i9-12900H 1.8GHz
GeForce RTX 3070 Ti Laptop GPU
min:
130.9 fps, max:
-1 fps
152 155.3 [X] MSI GE67 HX 12UGS Intel Core i7-12800HX 1.5GHz
GeForce RTX 3070 Ti Laptop GPU
min:
136.9 fps, max:
-1 fps
155.4 158 158.3 [X] Aorus 17X XES Intel Core i9-12900HX 1.7GHz
GeForce RTX 3070 Ti Laptop GPU
min:
135.1 fps, max:
-1 fps
164 164.8 165.6 166.3 [X] Eurocom Raptor X15 Intel Core i7-12700K 2.7GHz
GeForce RTX 3070 Ti Laptop GPU
min:
147.7 fps, max:
-1 fps
168.3 170.2 ~ 143 fps
+ Comparer
- Cacher la comparaison
...
NVIDIA GeForce RTX 2070 Super Max-Q
NVIDIA GeForce RTX 3070 Ti Laptop GPU
NVIDIA GeForce RTX 2080 Super Mobile
...
max:
68.7 [X] Aorus 17 XE4 Silence Mode
Intel Core i7-12700H @2.1GHz
GeForce RTX 3070 Ti Laptop GPU
min:
57.8 fps, max:
-1 fps
108.5 112.1 114.1 115.8 [X] Acer Nitro 5 AN515-46-R1A1 dGPU
AMD Ryzen 7 6800H 3.2GHz
GeForce RTX 3070 Ti Laptop GPU
min:
99.1 fps, max:
-1 fps
117.8 [X] Asus TUF Dash F15 FX517ZR Leise
Intel Core i7-12650H 1.7GHz
GeForce RTX 3070 Ti Laptop GPU
min:
99.1 fps, max:
-1 fps
120.5 125.2 [X] Acer Nitro 5 AN515-58-72QR Leistung
Intel Core i7-12700H 1.7GHz
GeForce RTX 3070 Ti Laptop GPU
min:
111.4 fps, max:
-1 fps
125.4 [X] Acer Nitro 5 AN515-58-72QR Leise
Intel Core i7-12700H 1.7GHz
GeForce RTX 3070 Ti Laptop GPU
min:
110.4 fps, max:
-1 fps
126.6 126.8 132.8 133 134.4 134.5 134.9 [X] Razer Blade 15 OLED (Early 2022) dGPU
Intel Core i9-12900H 1.8GHz
GeForce RTX 3070 Ti Laptop GPU
min:
115.1 fps, max:
-1 fps
135 [X] Aorus 17 XE4 Turbo Mode
Intel Core i7-12700H 1.7GHz
GeForce RTX 3070 Ti Laptop GPU
min:
103.1 fps, max:
-1 fps
135.8 137.9 [X] Acer Nitro 5 AN515-58-72QR dGPU, Leistung
Intel Core i7-12700H 1.7GHz
GeForce RTX 3070 Ti Laptop GPU
min:
121.9 fps, max:
-1 fps
138.1 139 [X] Aorus 17 XE4 Intel Core i7-12700H 1.7GHz
GeForce RTX 3070 Ti Laptop GPU
min:
122.8 fps, max:
-1 fps
140.8 140.8 [X] Aorus 15 XE5 Intel Core i7-12700H 1.7GHz
GeForce RTX 3070 Ti Laptop GPU
min:
121.1 fps, max:
-1 fps
140.8 [X] Aorus 15 XE5 Turbo Mode
Intel Core i7-12700H 1.7GHz
GeForce RTX 3070 Ti Laptop GPU
min:
120.6 fps, max:
-1 fps
141.6 142.7 [X] Razer Blade 15 RZ09-0421NGG3-R3G1 Intel Core i9-12900H 1.8GHz
GeForce RTX 3070 Ti Laptop GPU
min:
125.3 fps, max:
-1 fps
145 145.2 [X] HP Omen 16-b1090ng Intel Core i7-12700H 1.7GHz
GeForce RTX 3070 Ti Laptop GPU
min:
127.1 fps, max:
-1 fps
146.7 147.7 [X] MSI GE67 HX 12UGS Intel Core i7-12800HX 1.5GHz
GeForce RTX 3070 Ti Laptop GPU
min:
130.1 fps, max:
-1 fps
148 [X] Aorus 17X XES Intel Core i9-12900HX 1.7GHz
GeForce RTX 3070 Ti Laptop GPU
min:
121.3 fps, max:
-1 fps
151 155 155.6 [X] Eurocom Raptor X15 Intel Core i7-12700K 2.7GHz
GeForce RTX 3070 Ti Laptop GPU
min:
136.2 fps, max:
-1 fps
158.4 158.5 159.2 160.5 ~ 136 fps
+ Comparer
- Cacher la comparaison
...
NVIDIA GeForce RTX 2070 Super Max-Q
NVIDIA GeForce RTX 3070 Ti Laptop GPU
NVIDIA GeForce RTX 2080 Super Mobile
max:
NVIDIA GeForce RTX 3070 Ti
...
NVIDIA GeForce RTX 2070 Super Max-Q
NVIDIA GeForce RTX 3070 Ti Laptop GPU
NVIDIA GeForce RTX 2080 Super Mobile
...
NVIDIA GeForce RTX 2080 Super Mobile
max:
» Jouable avec tous les ordinateurs portables testés avec les détails paramétrés sur Ultra.
0 100 200 300 400 500 600 700 800 Tooltip Nitro 5 AN515-46-R1A1: Ø295 (237.61-536)
Nitro 5 AN515-58-72QR: Ø331 (278.742-381.484)
15 XE5: Ø360 (320.195-408.31)
17 XE4: Ø439 (375.33-822)
ProArt StudioBook 16 H7600ZW: Ø428 (368-477)
ROG Strix Scar 15 G533ZW-LN106WS: Ø441 (359-495)
...
NVIDIA GeForce RTX 3070 Ti Laptop GPU
NVIDIA GeForce RTX 2080 Super Mobile
max:
237 244 [X] Acer Nitro 5 AN515-58-72QR Intel Core i7-12700H 1.7GHz
GeForce RTX 3070 Ti Laptop GPU
min:
28.9 fps, P0.1:
74.5 fps, P1:
147.8 fps, max:
458 fps
251 264 267 267 271 273.2 288.5 289.4 291 [X] Aorus 17 XE4 Intel Core i7-12700H 1.7GHz
GeForce RTX 3070 Ti Laptop GPU
min:
44.5 fps, P0.1:
82.6 fps, P1:
180 fps, max:
552 fps
296.4 300 [X] Aorus 15 XE5 Intel Core i7-12700H 1.7GHz
GeForce RTX 3070 Ti Laptop GPU
min:
27.5 fps, P0.1:
46.1 fps, P1:
159.5 fps, max:
520 fps
300.4 308 308.8 316 317.5 324 326 329 [X] MSI GE67 HX 12UGS Intel Core i7-12800HX 1.5GHz
GeForce RTX 3070 Ti Laptop GPU
min:
295 fps, max:
348 fps
329.2 [X] Eurocom Raptor X15 Intel Core i7-12700K 2.7GHz
GeForce RTX 3070 Ti Laptop GPU
min:
295 fps, max:
356 fps
360 ~ 294 fps
+ Comparer
- Cacher la comparaison
+ 📈 Graph
- 📈 Hide Graph
0 100 200 300 400 500 Tooltip Nitro 5 AN515-46-R1A1: Ø239 (222.389-274.854)
Nitro 5 AN515-58-72QR: Ø247 (224.64-278.23)
ROG Strix Scar 15 G533ZW-LN106WS: Ø251 (213-269)
ROG Strix Scar 15 G533ZW-LN106WS: Ø326 (275-363)
17 XE4: Ø293 (270.592-334.78)
15 XE5: Ø311 (267.146-502.2)
ProArt StudioBook 16 H7600ZW: Ø316 (279-353)
...
NVIDIA GeForce RTX 2070 Super Mobile
NVIDIA GeForce RTX 3070 Ti Laptop GPU
NVIDIA GeForce RTX 2080 Super Mobile
max:
139.7 158 162.7 165 165.6 166 171 172 173.4 176.6 179.4 180 [X] Aorus 17 XE4 Intel Core i7-12700H 1.7GHz
GeForce RTX 3070 Ti Laptop GPU
min:
32.6 fps, P0.1:
55 fps, P1:
121 fps, max:
406 fps
183.2 [X] Aorus 15 XE5 Intel Core i7-12700H 1.7GHz
GeForce RTX 3070 Ti Laptop GPU
min:
23.5 fps, P0.1:
35.9 fps, P1:
81.4 fps, max:
371 fps
187.5 188 189 195 195.9 204.8 209 210 213.9 [X] Eurocom Raptor X15 Intel Core i7-12700K 2.7GHz
GeForce RTX 3070 Ti Laptop GPU
min:
198 fps, max:
233 fps
219 219 [X] MSI Vector GP76 12UGS-434 Intel Core i7-12700H 1.7GHz
GeForce RTX 3070 Ti Laptop GPU
min:
10.9 fps, P0.1:
64.3 fps, P1:
149.7 fps, max:
535 fps
223.3 [X] MSI GE67 HX 12UGS Intel Core i7-12800HX 1.5GHz
GeForce RTX 3070 Ti Laptop GPU
min:
204 fps, max:
238 fps
223.9 226 ~ 189 fps
+ Comparer
- Cacher la comparaison
+ 📈 Graph
- 📈 Hide Graph
0 100 200 300 400 500 600 700 800 900 1000 1100 1200 1300 1400 1500 1600 1700 1800 1900 2000 2100 2200 2300 2400 2500 2600 2700 2800 2900 3000 3100 3200 3300 3400 3500 3600 3700 3800 3900 4000 4100 4200 4300 4400 4500 4600 4700 4800 4900 5000 5100 5200 5300 5400 5500 5600 5700 5800 5900 6000 6100 6200 6300 6400 6500 6600 6700 6800 6900 7000 7100 7200 7300 Tooltip Nitro 5 AN515-58-72QR: Ø165.8 (143.02-187.787)
Nitro 5 AN515-46-R1A1: Ø182.1 (157.41-235.7)
17 XE4: Ø182.9 (160.225-201.38)
15 XE5: Ø189.3 (161.011-251.8)
ProArt StudioBook 16 H7600ZW: Ø195.9 (174-212)
ROG Strix Scar 15 G533ZW-LN106WS: Ø209 (173-228)
Vector GP76 12UGS-434: Ø344 (189.099-7312)
...
NVIDIA GeForce RTX 3070 Ti Laptop GPU
NVIDIA GeForce RTX 2080 Super Mobile
max:
76.8 [X] Aorus 17 XE4 Silence Mode
Intel Core i7-12700H @2.1GHz
GeForce RTX 3070 Ti Laptop GPU
min:
6.28 fps, P0.1:
19 fps, P1:
38.1 fps, max:
141 fps
77.2 [X] Asus TUF Dash F15 FX517ZR Leise
Intel Core i7-12650H 1.7GHz
GeForce RTX 3070 Ti Laptop GPU
min:
6.67 fps, P0.1:
21 fps, P1:
41.7 fps, max:
146.6 fps
84.9 90.4 90.5 91.5 93.7 [X] Aorus 17X XES Intel Core i9-12900HX 1.7GHz
GeForce RTX 3070 Ti Laptop GPU
min:
80 fps
94.1 [X] Acer Nitro 5 AN515-58-72QR Leise
Intel Core i7-12700H 1.7GHz
GeForce RTX 3070 Ti Laptop GPU
min:
16.5 fps, P0.1:
24.2 fps, P1:
49.9 fps, max:
184.3 fps
95.2 96.4 96.8 97.7 97.7 [X] Razer Blade 15 OLED (Early 2022) dGPU
Intel Core i9-12900H 1.8GHz
GeForce RTX 3070 Ti Laptop GPU
min:
84 fps, max:
110 fps
97.8 99.4 [X] Acer Nitro 5 AN515-58-72QR Intel Core i7-12700H 1.7GHz
GeForce RTX 3070 Ti Laptop GPU
min:
18.6 fps, P0.1:
23.1 fps, P1:
56.2 fps, max:
203 fps
99.5 99.9 [X] Aorus 17 XE4 Intel Core i7-12700H 1.7GHz
GeForce RTX 3070 Ti Laptop GPU
min:
29.7 fps, P0.1:
45.7 fps, P1:
74.1 fps, max:
252 fps
100.1 [X] Aorus 15 XE5 Intel Core i7-12700H 1.7GHz
GeForce RTX 3070 Ti Laptop GPU
min:
21.9 fps, P0.1:
25.6 fps, P1:
52.5 fps, max:
268 fps
101.1 [X] Razer Blade 15 RZ09-0421NGG3-R3G1 Intel Core i9-12900H 1.8GHz
GeForce RTX 3070 Ti Laptop GPU
P0.1:
20.8 fpsP1:
36.8 fps
103 103 [X] Asus ROG Zephyrus M16 GU603Z Intel Core i9-12900H 1.8GHz
GeForce RTX 3070 Ti Laptop GPU
103.7 104.7 [X] Aorus 15 XE5 Turbo Mode
Intel Core i7-12700H 1.7GHz
GeForce RTX 3070 Ti Laptop GPU
min:
17.8 fps, P0.1:
30.4 fps, P1:
51.7 fps, max:
284 fps
105 [X] Aorus 17 XE4 Turbo Mode
Intel Core i7-12700H 1.7GHz
GeForce RTX 3070 Ti Laptop GPU
min:
39.2 fps, P0.1:
46.2 fps, P1:
78.2 fps, max:
286 fps
105.6 107.4 [X] Acer Nitro 5 AN515-58-72QR Leistung
Intel Core i7-12700H 1.7GHz
GeForce RTX 3070 Ti Laptop GPU
min:
18.8 fps, P0.1:
30.8 fps, P1:
60.2 fps, max:
201 fps
107.4 [X] Acer Nitro 5 AN515-58-72QR dGPU, Leistung
Intel Core i7-12700H 1.7GHz
GeForce RTX 3070 Ti Laptop GPU
min:
18.8 fps, P0.1:
30.8 fps, P1:
60.2 fps, max:
201 fps
108.5 110 111 111.4 [X] Eurocom Raptor X15 Intel Core i7-12700K 2.7GHz
GeForce RTX 3070 Ti Laptop GPU
min:
107 fps, max:
114 fps
111.6 112.7 [X] MSI GE67 HX 12UGS Intel Core i7-12800HX 1.5GHz
GeForce RTX 3070 Ti Laptop GPU
min:
105 fps, max:
118 fps
112.8 [X] MSI Vector GP76 12UGS-434 Intel Core i7-12700H 1.7GHz
GeForce RTX 3070 Ti Laptop GPU
min:
10.7 fps, P0.1:
57.6 fps, P1:
86.9 fps, max:
330 fps
114.6 117 119 119.8 [X] Acer Nitro 5 AN515-46-R1A1 dGPU
AMD Ryzen 7 6800H 3.2GHz
GeForce RTX 3070 Ti Laptop GPU
min:
17 fps, P0.1:
27.2 fps, P1:
55.5 fps, max:
290 fps
124.1 [X] Razer Blade 15 RZ09-0421NGG3-R3G1 Intel Core i9-12900H 1.8GHz
GeForce RTX 3070 Ti Laptop GPU
min:
119 fps, P1:
120 fps, max:
127 fps
~ 102 fps
+ Comparer
- Cacher la comparaison
+ 📈 Graph
- 📈 Hide Graph
0 100 200 Tooltip 17 XE4 Silence Mode: Ø87.9 (47-95)
TUF Dash F15 FX517ZR Leise: Ø66.7 (55-87)
Vision 16 Pro RTX 3070 Ti: Ø84.9 (80-93)
Stealth GS66 12UGS: Ø81.3 (77-86)
Creator Z17 A12UGST-054: Ø81 (74-93)
Katana GF76 12UGS: Ø82.8 (77-88)
17X XES: Ø92.2 (85-97)
Nitro 5 AN515-58-72QR Leise: Ø74.2 (61-102)
Blade 14 Ryzen 9 6900HX: Ø90.5 (85-97)
Blade 15 OLED (Early 2022): Ø91.3 (87-96)
Katana GF66 12UGS: Ø87.3 (80-102)
Omen 16-b1090ng: Ø96.2 (88-100)
ROG Flow X16 GV601RW-M5082W @Turbo: Ø101.3 (96-106)
Nitro 5 AN515-58-72QR: Ø94.2 (72-103)
ROG Zephyrus M16 GU603Z: Ø91 (74-97)
17 XE4: Ø96.5 (87-103)
15 XE5: Ø100.3 (92-105)
Legion 5 Pro 16 G7 i7 RTX 3070Ti: Ø103.3 (89-111)
ROG Zephyrus M16 GU603Z: Ø100.7 (96-107)
Omen 17-ck1075ng: Ø105.5 (72.6-190.19)
15 XE5 Turbo Mode: Ø103.9 (98-108)
17 XE4 Turbo Mode: Ø109.9 (90.067-136.3)
ProArt StudioBook 16 H7600ZW: Ø105.7 (102-109)
Nitro 5 AN515-58-72QR Leistung: Ø104.8 (98-110)
Nitro 5 AN515-58-72QR dGPU, Leistung: Ø110.5 (99-115)
Nitro 5 AN515-46-R1A1: Ø102 (98-107)
XMG Neo 15 (Ryzen 9 6900HX, RTX 3070 Ti): Ø104.8 (99-112)
ROG Strix Scar 15 G533ZW-LN106WS: Ø109 (96-120)
Raptor X15: Ø104.1 (98-110)
Blade 17 (i7-12800H, RTX 3070 Ti): Ø109 (97-114)
GE67 HX 12UGS: Ø110.9 (105-117)
Vector GP76 12UGS-434: Ø119.6 (96.022-275.1)
Vector GP66 12UGS: Ø109.3 (61-117)
Legion 5 Pro 16ARH7H RTX 3070 Ti: Ø110.7 (100-116)
Predator Helios 300 (i7-12700H, RTX 3070 Ti): Ø108.7 (103-115)
Nitro 5 AN515-46-R1A1 dGPU: Ø115.7 (110-120)
Blade 15 RZ09-0421NGG3-R3G1: Ø124.1 (119-127)
...
NVIDIA GeForce RTX 3070 Ti Laptop GPU
NVIDIA GeForce RTX 2080 Super Mobile
max:
0 Tooltip ProArt StudioBook 16 H7600ZW: Ø73.2 (65-79)
ROG Strix Scar 15 G533ZW-LN106WS: Ø78 (68-84)
...
NVIDIA GeForce RTX 2080 Super Mobile
NVIDIA GeForce RTX 3070 Ti Laptop GPU
...
max:
» Jouable avec tous les ordinateurs portables testés avec les détails paramétrés sur Ultra.
Additional Benchmarks
Ultra Graphics & Postprocessing (HBAO+) 3840x2160
Medium Graphics & Postprocessing 1920x1080
101 [X] Aorus 17 XE4 Silence Mode
Intel Core i7-12700H @2.1GHz
GeForce RTX 3070 Ti Laptop GPU
min:
6.25 fps, P1:
47.6 fps, max:
195 fps
174.2 176.6 178.4 180.3 180.7 [X] MSI Katana GF66 12UGS Intel Core i7-12700H 1.7GHz
GeForce RTX 3070 Ti Laptop GPU
min:
2.57 fps, P1:
125 fps, max:
386 fps
181.5 182.6 182.7 182.7 184.6 [X] MSI Katana GF76 12UGS Intel Core i7-12700H 1.7GHz
GeForce RTX 3070 Ti Laptop GPU
min:
2.94 fps, P1:
142.9 fps, max:
273 fps
185 [X] MSI Vector GP66 12UGS Intel Core i9-12900H 1.8GHz
GeForce RTX 3070 Ti Laptop GPU
min:
2 fps, P1:
143 fps, max:
405 fps
185 185 [X] Aorus 17 XE4 Intel Core i7-12700H 1.7GHz
GeForce RTX 3070 Ti Laptop GPU
min:
2.08 fps, P1:
143 fps, max:
362 fps
185.9 186.1 [X] HP Omen 17-ck1075ng Intel Core i7-12700H 1.7GHz
GeForce RTX 3070 Ti Laptop GPU
min:
2.33 fps, P1:
125 fps, max:
386 fps
186.4 [X] Aorus 15 XE5 Intel Core i7-12700H 1.7GHz
GeForce RTX 3070 Ti Laptop GPU
min:
1.722 fps, P1:
166.7 fps, max:
426 fps
186.6 [X] Eurocom Raptor X15 Intel Core i7-12700K 2.7GHz
GeForce RTX 3070 Ti Laptop GPU
min:
1.605 fps, P1:
142.9 fps, max:
500 fps
186.8 [X] MSI GE67 HX 12UGS Intel Core i7-12800HX 1.5GHz
GeForce RTX 3070 Ti Laptop GPU
min:
3.06 fps, P1:
200 fps, max:
275 fps
187.2 ~ 179 fps
+ Comparer
- Cacher la comparaison
...
NVIDIA GeForce RTX 3070 Ti Laptop GPU
NVIDIA GeForce RTX 2070 Super Max-Q
NVIDIA GeForce RTX 2070 Super Mobile
...
max:
95.5 [X] Aorus 17 XE4 Silence Mode
Intel Core i7-12700H @2.1GHz
GeForce RTX 3070 Ti Laptop GPU
min:
4.9 fps, P1:
47.6 fps, max:
180 fps
167.3 170.3 173.1 174.4 [X] MSI Katana GF76 12UGS Intel Core i7-12700H 1.7GHz
GeForce RTX 3070 Ti Laptop GPU
min:
3.89 fps, P1:
125 fps, max:
358 fps
175.2 [X] MSI Katana GF66 12UGS Intel Core i7-12700H 1.7GHz
GeForce RTX 3070 Ti Laptop GPU
min:
3.02 fps, P1:
125 fps, max:
373 fps
176.5 176.8 176.9 177.2 179 [X] Aorus 17 XE4 Intel Core i7-12700H 1.7GHz
GeForce RTX 3070 Ti Laptop GPU
min:
3.41 fps, P1:
143 fps, max:
376 fps
179.1 179.3 179.5 [X] HP Omen 16-b1090ng Intel Core i7-12700H 1.7GHz
GeForce RTX 3070 Ti Laptop GPU
min:
2.14 fps, P1:
125 fps, max:
357 fps
180.1 [X] HP Omen 17-ck1075ng Intel Core i7-12700H 1.7GHz
GeForce RTX 3070 Ti Laptop GPU
min:
2.4 fps, P1:
100 fps, max:
377 fps
181 181.7 [X] HP Omen 17-ck1075ng Intel Core i7-12700H 1.7GHz
GeForce RTX 3070 Ti Laptop GPU
min:
2.13 fps, P1:
125 fps, max:
417 fps
182 182.1 182.3 [X] Aorus 15 XE5 Intel Core i7-12700H 1.7GHz
GeForce RTX 3070 Ti Laptop GPU
min:
2.12 fps, P1:
142.9 fps, max:
323 fps
182.8 [X] Eurocom Raptor X15 Intel Core i7-12700K 2.7GHz
GeForce RTX 3070 Ti Laptop GPU
min:
1.91 fps, P1:
125 fps, max:
362 fps
184 [X] MSI Vector GP66 12UGS Intel Core i9-12900H 1.8GHz
GeForce RTX 3070 Ti Laptop GPU
min:
3.96 fps, P1:
143 fps, max:
396 fps
184.5 184.6 184.7 [X] MSI GE67 HX 12UGS Intel Core i7-12800HX 1.5GHz
GeForce RTX 3070 Ti Laptop GPU
min:
1.994 fps, P1:
125 fps, max:
263 fps
186.4 ~ 176 fps
+ Comparer
- Cacher la comparaison
...
NVIDIA GeForce RTX 2070 Super Max-Q
NVIDIA GeForce RTX 3070 Ti Laptop GPU
NVIDIA GeForce RTX 2070 Super Mobile
NVIDIA GeForce RTX 2080 Super Mobile
...
max:
80 [X] Aorus 17 XE4 Silence Mode
Intel Core i7-12700H @2.1GHz
GeForce RTX 3070 Ti Laptop GPU
min:
4.99 fps, P1:
43.5 fps, max:
138 fps
149.5 152.5 156 [X] MSI Katana GF76 12UGS Intel Core i7-12700H 1.7GHz
GeForce RTX 3070 Ti Laptop GPU
min:
6.75 fps, P1:
111.1 fps, max:
308 fps
156 [X] Acer Nitro 5 AN515-58-72QR Leistung
Intel Core i7-12700H 1.7GHz
GeForce RTX 3070 Ti Laptop GPU
min:
4.46 fps, P1:
90.9 fps, max:
295 fps
156.2 156.3 158.4 164.2 167.6 167.9 168 [X] MSI Katana GF66 12UGS Intel Core i7-12700H 1.7GHz
GeForce RTX 3070 Ti Laptop GPU
min:
4.3 fps, P1:
111.1 fps, max:
276 fps
170 171 171.4 172.2 172.8 173.5 173.9 [X] HP Omen 16-b1090ng Intel Core i7-12700H 1.7GHz
GeForce RTX 3070 Ti Laptop GPU
min:
3.58 fps, P1:
125 fps, max:
319 fps
174.6 [X] Eurocom Raptor X15 Intel Core i7-12700K 2.7GHz
GeForce RTX 3070 Ti Laptop GPU
min:
3.85 fps, P1:
125 fps, max:
379 fps
175 [X] Aorus 17 XE4 Intel Core i7-12700H 1.7GHz
GeForce RTX 3070 Ti Laptop GPU
min:
6 fps, P1:
111 fps, max:
304 fps
175.8 176.4 [X] Aorus 15 XE5 Intel Core i7-12700H 1.7GHz
GeForce RTX 3070 Ti Laptop GPU
min:
3.74 fps, P1:
125 fps, max:
358 fps
177.3 [X] HP Omen 17-ck1075ng Intel Core i7-12700H 1.7GHz
GeForce RTX 3070 Ti Laptop GPU
min:
2.97 fps, P1:
111.1 fps, max:
364 fps
178.1 [X] MSI GE67 HX 12UGS Intel Core i7-12800HX 1.5GHz
GeForce RTX 3070 Ti Laptop GPU
min:
3.97 fps, P1:
142.9 fps, max:
245 fps
178.5 [X] Aorus 17X XES Intel Core i9-12900HX 1.7GHz
GeForce RTX 3070 Ti Laptop GPU
min:
3.24 fps, P1:
125 fps, max:
340 fps
179 [X] MSI Vector GP66 12UGS Intel Core i9-12900H 1.8GHz
GeForce RTX 3070 Ti Laptop GPU
min:
3.57 fps, P1:
125 fps, max:
315 fps
181.9 ~ 166 fps
+ Comparer
- Cacher la comparaison
...
NVIDIA GeForce RTX 2070 Super Max-Q
NVIDIA GeForce RTX 2070 Super Mobile
NVIDIA GeForce RTX 3070 Ti Laptop GPU
NVIDIA GeForce RTX 2080 Super Mobile
max:
44 [X] Aorus 17 XE4 Silence Mode
Intel Core i7-12700H @2.1GHz
GeForce RTX 3070 Ti Laptop GPU
min:
12.5 fps, P1:
27 fps, max:
84 fps
86.6 [X] Asus TUF Dash F15 FX517ZR Leise
Intel Core i7-12650H 1.7GHz
GeForce RTX 3070 Ti Laptop GPU
min:
40.5 fps, P1:
62.5 fps, max:
163.5 fps
87.9 [X] Acer Nitro 5 AN515-58-72QR Leise
Intel Core i7-12700H 1.7GHz
GeForce RTX 3070 Ti Laptop GPU
min:
17.4 fps, P1:
58.8 fps, max:
147.7 fps
92.5 92.5 [X] Acer Nitro 5 AN515-46-R1A1 dGPU
AMD Ryzen 7 6800H 3.2GHz
GeForce RTX 3070 Ti Laptop GPU
min:
7.07 fps, P1:
66.7 fps, max:
165.1 fps
93 94.6 95 97.6 97.7 [X] MSI Katana GF76 12UGS Intel Core i7-12700H 1.7GHz
GeForce RTX 3070 Ti Laptop GPU
min:
6.21 fps, P1:
71.4 fps, max:
188.9 fps
102.5 [X] MSI Katana GF66 12UGS Intel Core i7-12700H 1.7GHz
GeForce RTX 3070 Ti Laptop GPU
min:
10.1 fps, P1:
66.7 fps, max:
185.7 fps
103.8 104 104.8 [X] Razer Blade 15 RZ09-0421NGG3-R3G1 Intel Core i9-12900H 1.8GHz
GeForce RTX 3070 Ti Laptop GPU
min:
20.5 fps, P1:
71.4 fps, max:
201 fps
105 [X] MSI Stealth GS66 12UGS Intel Core i7-12700H 1.7GHz
GeForce RTX 3070 Ti Laptop GPU
min:
21.6 fps, P1:
71.4 fps, max:
186 fps
108.1 109.7 110.1 110.2 [X] HP Omen 16-b1090ng Intel Core i7-12700H 1.7GHz
GeForce RTX 3070 Ti Laptop GPU
min:
10.6 fps, P1:
76.9 fps, max:
208 fps
110.9 [X] Aorus 17X XES Intel Core i9-12900HX 1.7GHz
GeForce RTX 3070 Ti Laptop GPU
min:
6.17 fps, P1:
76.9 fps, max:
222 fps
112.9 [X] Acer Nitro 5 AN515-58-72QR dGPU, Leistung
Intel Core i7-12700H 1.7GHz
GeForce RTX 3070 Ti Laptop GPU
min:
4.82 fps, P1:
76.9 fps, max:
202 fps
112.9 113 113.7 [X] Razer Blade 15 OLED (Early 2022) dGPU
Intel Core i9-12900H 1.8GHz
GeForce RTX 3070 Ti Laptop GPU
min:
33.2 fps, P1:
76.9 fps, max:
217 fps
115.6 [X] Aorus 15 XE5 Intel Core i7-12700H 1.7GHz
GeForce RTX 3070 Ti Laptop GPU
min:
3.67 fps, P1:
83.3 fps, max:
206 fps
116.5 [X] Eurocom Raptor X15 Intel Core i7-12700K 2.7GHz
GeForce RTX 3070 Ti Laptop GPU
min:
4.68 fps, P1:
83.3 fps, max:
211 fps
117 117 [X] Aorus 17 XE4 Intel Core i7-12700H 1.7GHz
GeForce RTX 3070 Ti Laptop GPU
min:
24.8 fps, P1:
83.3 fps, max:
212 fps
117.5 [X] HP Omen 17-ck1075ng Intel Core i7-12700H 1.7GHz
GeForce RTX 3070 Ti Laptop GPU
min:
5.88 fps, P1:
83.3 fps, max:
218 fps
118.7 121 [X] Aorus 17 XE4 Turbo Mode
Intel Core i7-12700H 1.7GHz
GeForce RTX 3070 Ti Laptop GPU
min:
49.4 fps, P1:
90.9 fps, max:
213 fps
122 [X] MSI GE67 HX 12UGS Intel Core i7-12800HX 1.5GHz
GeForce RTX 3070 Ti Laptop GPU
min:
6.11 fps, P1:
90.9 fps, max:
212 fps
122.2 122.9 [X] Aorus 15 XE5 Turbo Mode
Intel Core i7-12700H 1.7GHz
GeForce RTX 3070 Ti Laptop GPU
min:
24.4 fps, P1:
90.9 fps, max:
245 fps
123 [X] MSI Vector GP66 12UGS Intel Core i9-12900H 1.8GHz
GeForce RTX 3070 Ti Laptop GPU
min:
4.38 fps, P1:
83.3 fps, max:
216 fps
123.9 ~ 107 fps
+ Comparer
- Cacher la comparaison
...
NVIDIA GeForce RTX 2070 Super Mobile
NVIDIA GeForce RTX 2080 Super Mobile
NVIDIA GeForce RTX 3070 Ti Laptop GPU
...
max:
72.7 [X] Asus TUF Dash F15 FX517ZR Leise
Intel Core i7-12650H 1.7GHz
GeForce RTX 3070 Ti Laptop GPU
min:
12 fps, P1:
47.6 fps, max:
126 fps
74.5 [X] Acer Nitro 5 AN515-58-72QR Leise
Intel Core i7-12700H 1.7GHz
GeForce RTX 3070 Ti Laptop GPU
min:
14.8 fps, P1:
52.6 fps, max:
132.6 fps
81.8 83.7 86 [X] Acer Nitro 5 AN515-58-72QR Leistung
Intel Core i7-12700H 1.7GHz
GeForce RTX 3070 Ti Laptop GPU
min:
23.3 fps, P1:
62.5 fps, max:
159.5 fps
88.8 89.5 90.3 [X] Razer Blade 15 RZ09-0421NGG3-R3G1 Intel Core i9-12900H 1.8GHz
GeForce RTX 3070 Ti Laptop GPU
min:
19.8 fps, P1:
62.5 fps, max:
171.4 fps
90.7 93 93.9 94.3 94.6 [X] Razer Blade 15 OLED (Early 2022) dGPU
Intel Core i9-12900H 1.8GHz
GeForce RTX 3070 Ti Laptop GPU
min:
0.956 fps, P1:
66.7 fps, max:
186.1 fps
97.6 98.7 [X] Acer Nitro 5 AN515-58-72QR dGPU, Leistung
Intel Core i7-12700H 1.7GHz
GeForce RTX 3070 Ti Laptop GPU
min:
7.98 fps, P1:
66.7 fps, max:
177.9 fps
98.8 99.9 [X] Aorus 15 XE5 Intel Core i7-12700H 1.7GHz
GeForce RTX 3070 Ti Laptop GPU
min:
18.4 fps, P1:
71.4 fps, max:
210 fps
100 101.2 [X] Aorus 15 XE5 Turbo Mode
Intel Core i7-12700H 1.7GHz
GeForce RTX 3070 Ti Laptop GPU
min:
16 fps, P1:
71.4 fps, max:
198 fps
101.9 103 108.7 [X] MSI GE67 HX 12UGS Intel Core i7-12800HX 1.5GHz
GeForce RTX 3070 Ti Laptop GPU
min:
11.2 fps, P1:
76.9 fps, max:
205 fps
~ 93 fps
+ Comparer
- Cacher la comparaison
...
NVIDIA GeForce RTX 2080 Super Mobile
NVIDIA GeForce RTX 3070 Ti Laptop GPU
...
max:
...
NVIDIA GeForce RTX 3070 Ti Laptop GPU
NVIDIA GeForce RTX 2080 Super Mobile
...
max:
» Jouable avec tous les ordinateurs portables testés avec les détails paramétrés sur Ultra.
Additional Benchmarks
Highest Settings possible 16xAF 4xMSAA + FXAA 3840x2160
Normal/Off 4xAF 1920x1080
183 [X] MSI Vector GP66 12UGS 1.47.22.14 D3D12
Intel Core i9-12900H 1.8GHz
GeForce RTX 3070 Ti Laptop GPU
min:
3.38 fps, P1:
143 fps, max:
391 fps
180 [X] Aorus 17 XE4 1.52
Intel Core i7-12700H 1.7GHz
GeForce RTX 3070 Ti Laptop GPU
min:
2.6 fps, P1:
143 fps, max:
266 fps
97.2 [X] Aorus 17 XE4 1.47.22.14 D3D12, Silence Mode
Intel Core i7-12700H @2.1GHz
GeForce RTX 3070 Ti Laptop GPU
min:
30.3 fps, P1:
45.5 fps, max:
171 fps
180.8 [X] Aorus 15 XE5 Intel Core i7-12700H 1.7GHz
GeForce RTX 3070 Ti Laptop GPU
min:
3.13 fps, P1:
142.9 fps, max:
395 fps
183.7 [X] MSI GE67 HX 12UGS Intel Core i7-12800HX 1.5GHz
GeForce RTX 3070 Ti Laptop GPU
min:
2.06 fps, P1:
142.9 fps, max:
411 fps
Lowest Settings possible 1920x1080
186 [X] MSI Vector GP66 12UGS 1.47.22.14 D3D12
Intel Core i9-12900H 1.8GHz
GeForce RTX 3070 Ti Laptop GPU
min:
1.984 fps, P1:
143 fps, max:
414 fps
185 [X] Aorus 17 XE4 1.52
Intel Core i7-12700H 1.7GHz
GeForce RTX 3070 Ti Laptop GPU
min:
2.64 fps, P1:
143 fps, max:
397 fps
185 [X] Aorus 15 XE5 Intel Core i7-12700H 1.7GHz
GeForce RTX 3070 Ti Laptop GPU
min:
2.57 fps, P1:
142.9 fps, max:
460 fps
186.9 [X] MSI GE67 HX 12UGS Intel Core i7-12800HX 1.5GHz
GeForce RTX 3070 Ti Laptop GPU
min:
2.1 fps, P1:
166.7 fps, max:
402 fps
Bas Moyen Élevé Ultra QHD 4K Lords of the Fallen 76.6 56.4 39.4 27 10.9 Assassin's Creed Mirage 106 102 80 63 40 EA Sports FC 24 154 134.2 129.7 129.2 81.8 Cyberpunk 2077 2.0 Phantom Liberty 99 90.7 81.9 54 26.3 Lies of P 151.3 134.1 121.1 84.7 44.9 The Crew Motorfest 60 60 60 55 35 Starfield 61.7 50 44.8 36.2 23.5 Armored Core 6 96.3 89.5 84.6 74.5 47.6 Immortals of Aveum 52.5 42.7 29.9 16.1 Atlas Fallen 124.2 118.6 101.7 77.8 47.3 Baldur's Gate 3 110.9 94.9 93.4 66.3 34 Ratchet & Clank Rift Apart 73.9 59.5 55 45.8 30.6 F1 23 229 178 63 41 19 Diablo 4 280 248 223 189.2 129.6 67.4 Star Wars Jedi Survivor 79.5 74.3 71.8 46 22.8 Dead Island 2 198.6 173.3 134.1 95.1 48.5 Resident Evil 4 Remake 121.5 110.7 81.7 61.4 35.4 Company of Heroes 3 186 148 146 109 67 Sons of the Forest 85 82.8 81.7 65.5 44.2 Atomic Heart 157.9 94.5 76.3 60.2 37 Returnal 113 103 89 66 39 Hogwarts Legacy 88.5 79 69.7 59.3 42.6 Dead Space Remake 82.1 74.6 68.1 66.8 47.2 The Witcher 3 v4.00 174.4 149.6 81.3 71.4 47.4 High On Life 175.7 139.4 117.5 97.1 60.8 The Callisto Protocol 117 99.3 71 70.7 52.8 Need for Speed Unbound 112.8 106.9 93 84.6 66.7 Spider-Man Miles Morales 108 103 94 92 72 Call of Duty Modern Warfare 2 2022 127 112 88 85 62 Uncharted Legacy of Thieves Collection 80 78 74 71 56 A Plague Tale Requiem 98 83 72 62 50 FIFA 23 104.3 The Quarry 153 120 100 81 56.1 F1 22 210 207 176 67 43 Vampire Bloodhunt 197.6 195 184 179 128.4 Ghostwire Tokyo 154 144 138 133 89 Tiny Tina's Wonderlands 183.3 162 116 91 62 Cyberpunk 2077 1.6 130 113 93 79 50 26 Elex 2 110 104 90 81 GRID Legends 198 169 149 113 99 Elden Ring 59.8 60 53 59.7 Dying Light 2 106 84 73 52 28.3 Rainbow Six Extraction 210 182 177 140 91 46 God of War 121 100 85 60 45 31.5 Halo Infinite 125 107 101 65.5 34.6 Farming Simulator 22 183 160 141 115 69.7 Battlefield 2042 136.4 113 99 88 63.2 39.5 Forza Horizon 5 195 133 125 78 65 47 Riders Republic 189 133 110 101 70 39 Guardians of the Galaxy 120 118 118 114 87 49 Back 4 Blood 220 192 182 122 63.9 Far Cry 6 149 113 100 92 72 38 Alan Wake Remastered 169.3 145 138 104 56.7 New World 104 94 85 64 32.2 Deathloop 123 105 85 59 30.8 F1 2021 343 241 196 110 83 52 Days Gone 141 125 94 69 36.9 Mass Effect Legendary Edition 135 124 80.5 Resident Evil Village 185 169 148 101 52.9 Outriders 145 130 110 75 37.4 Hitman 3 229 174 158 151 95.8 54.3 Cyberpunk 2077 1.0 82.1 66.9 56.1 35.9 17.5 Yakuza Like a Dragon 117 113 100 68.5 37 Assassin´s Creed Valhalla 159 107 89 77 60 36 Dirt 5 219 130 105 84 64 41.6 Watch Dogs Legion 121 107 97 68 50 29 Star Wars Squadrons 292 269 237 167 92.9 Mafia Definitive Edition 161.8 111 103 66.1 35.7 Serious Sam 4 110 99.2 82.4 64.2 40.5 Crysis Remastered 178 71.8 64.3 48.5 27.6 Flight Simulator 2020 124.8 97.8 70.2 52.2 41.3 Death Stranding 156.9 141 135 133 94.4 55.2 Gears Tactics 204 135 102 75.2 40.1 Doom Eternal 365 231 202 193 145 78.2 Hunt Showdown 139 121 79 36.5 Borderlands 3 104.2 92.4 80.9 58.7 Metro Exodus 145 117 93 74 52.7 Shadow of the Tomb Raider 128 124 83 Strange Brigade 396 245 203 180 137 81 Far Cry 5 164 136 130 120 97 59 X-Plane 11.11 135 118 96 95 Final Fantasy XV Benchmark 184 134 99 76 44 Dota 2 Reborn 166 151 143 136 118 The Witcher 3 388 294 189 102 76 GTA V 179 176 166 107 93 95 < 30 fps < 60 fps < 120 fps ≥ 120 fps 9 36 1 37 43 4 48 31 8 50 20 2 25 46 8 11 38 13
Pour plus de jeux susceptibles d'être fluides avec cette carte graphique et obtenir une liste exhaustive de tous les jeux et cartes graphiques testés, consultez notre liste des jeux .
v1.26
log 04. 02:46:11
#0 no ids found in url (should be separated by "_") +0s ... 0s
#1 not redirecting to Ajax server +0s ... 0s
#2 did not recreate cache, as it is less than 5 days old! Created at Wed, 01 May 2024 05:36:19 +0200 +0.001s ... 0.001s
#3 no comparison url found in template nbc.compare_page_1 needed +0.063s ... 0.064s
#4 no comparison url found in template nbc.compare_page_1 needed +0s ... 0.065s
#5 no comparison url found in template nbc.compare_page_1 needed +0s ... 0.065s
#6 no comparison url found in template nbc.compare_page_1 needed +0s ... 0.066s
#7 no comparison url found in template nbc.compare_page_1 needed +0s ... 0.066s
#8 no comparison url found in template nbc.compare_page_1 needed +0s ... 0.066s
#9 no comparison url found in template nbc.compare_page_1 needed +0s ... 0.066s
#10 no comparison url found in template nbc.compare_page_1 needed +0s ... 0.067s
#11 no comparison url found in template nbc.compare_page_1 needed +0s ... 0.067s
#12 no comparison url found in template nbc.compare_page_1 needed +0s ... 0.067s
#13 no comparison url found in template nbc.compare_page_1 needed +0s ... 0.068s
#14 no comparison url found in template nbc.compare_page_1 needed +0s ... 0.068s
#15 no comparison url found in template nbc.compare_page_1 needed +0s ... 0.068s
#16 no comparison url found in template nbc.compare_page_1 needed +0s ... 0.068s
#17 no comparison url found in template nbc.compare_page_1 needed +0s ... 0.069s
#18 no comparison url found in template nbc.compare_page_1 needed +0s ... 0.069s
#19 no comparison url found in template nbc.compare_page_1 needed +0s ... 0.069s
#20 no comparison url found in template nbc.compare_page_1 needed +0s ... 0.07s
#21 no comparison url found in template nbc.compare_page_1 needed +0s ... 0.07s
#22 no comparison url found in template nbc.compare_page_1 needed +0s ... 0.07s
#23 composed specs +0s ... 0.071s
#24 did output specs +0s ... 0.071s
#25 start showIntegratedCPUs +0s ... 0.071s
#26 getting avg benchmarks for device 11120 +0.036s ... 0.107s
#27 got single benchmarks 11120 +0.159s ... 0.265s
#28 got avg benchmarks for devices +0s ... 0.265s
#29 min, max, avg, median took s +1.284s ... 1.549s
#30 before gaming benchmark output +0.001s ... 1.55s
#31 Got 1558 rows for game benchmarks. +0.865s ... 2.414s
#32 composed SQL query for gamebenchmarks +0s ... 2.414s
#33 got data and put it in $dataArray +0.074s ... 2.488s
#34 benchmarks composed for output. +5.114s ... 7.602s
#35 no comparison url found in template nbc.compare_page_1 needed +0.011s ... 7.613s
#36 return log +0s ... 7.613s
Testés dans les ordinateurs portables : NVIDIA GeForce RTX 3070 Ti Laptop GPU carte graphique
Test du Razer Blade 15 OLED (début 2022) : PC portable de jeu compact avec RTX 3070 Ti L'incarnation actuelle du Blade 15 continue de s'appuyer sur le puissant matériel Alder Lake et Ampere, mais offre également une mise à niveau séduisante : Raze...
Intel Core i9-12900H | NVIDIA GeForce RTX 3070 Ti Laptop GPU | 15.60" | 2 kg
Test de l'Asus ProArt StudioBook 16 H7600ZW : l'alternative au MacBook Pro pour les créatifs Asus tente de courtiser le public du MacBook Pro avec le ProArt StudioBook 16, qui présente une combinaison de Core i9-12900H et de RTX 3070 Ti associée à un éc...
Intel Core i9-12900H | NVIDIA GeForce RTX 3070 Ti Laptop GPU | 16.00" | 2.4 kg
Test de l'Asus ROG Zephyrus M16 : un ordinateur portable de jeu bien équilibré Avec un Core i9-12900H, une RTX 3070 Ti et de la RAM DDR5, le Zephyrus M16 contient du matériel puissant. Notre test approfondi montre si l'ordinateur portable ...
Intel Core i9-12900H | NVIDIA GeForce RTX 3070 Ti Laptop GPU | 16.00" | 2.1 kg
Test de l'Aorus 15 XE5 : PC portable de jeu QHD compact avec Thunderbolt 4 Avec l'Aorus 15 XE5, Gigabyte met sur le marché un autre ordinateur portable de jeu compact de 15,6 pouces. L'ordinateur portable brille notamment par ses perfo...
Intel Core i7-12700H | NVIDIA GeForce RTX 3070 Ti Laptop GPU | 15.60" | 2.3 kg
Test du Schenker Vision 16 Pro : ultrabook de 16 pouces léger avec RTX 3070 Ti Le nouveau Vision 16 Pro de Schenker est un ordinateur portable multimédia de 16 pouces qui ne pèse que 1,6 kg. Cela ne signifie pas qu'il manque de performance...
Intel Core i7-12700H | NVIDIA GeForce RTX 3070 Ti Laptop GPU | 16.00" | 1.7 kg
Acer Predator Helios 300 (i7-12700H, RTX 3070 Ti) : Intel Core i7-12700H, 17.30", 3 kgCritique » Test de l'Acer Predator Helios 300 : PC portable de jeu overclocké avec un bon écran
Acer Nitro 5 AN515-46-R1A1 : AMD Ryzen 7 6800H, 15.60", 2.5 kgCritique » Test de l'Acer Nitro 5 AN515-46 : des jeux FHD puissants avec USB 4
SCHENKER XMG Neo 15 (Ryzen 9 6900HX, RTX 3070 Ti) : AMD Ryzen 9 6900HX, 15.60", 2.3 kgCritique » Test du Schenker XMG Neo 15 : Ryzen 6000 avec ports de refroidissement liquide
Lenovo Legion 5 Pro 16ARH7H RTX 3070 Ti : AMD Ryzen 7 6800H, 16.00", 2.6 kgCritique » Test du Lenovo Legion 5 Pro Gen 7 : Ryzen 7 6800H ou Ryzen 9 6900HX ?
MSI Creator Z17 A12UGST-054 : Intel Core i9-12900H, 17.00", 2.5 kgCritique » Test du MSI Creator Z17 : que peuvent obtenir les créatifs et les joueurs pour 4 000 € ?
HP Omen 17-ck1075ng : Intel Core i7-12700H, 17.30", 2.8 kgCritique » Test du HP Omen 17 (2022) : Un boîtier et un matériel élégants avec beaucoup de potentiel
Aorus 17X XES : Intel Core i9-12900HX, 17.30", 2.7 kgCritique » Test de l'Aorus 17X XES : PC portable de jeu avec i9-12900HX et des performances de pointe
Asus ROG Flow X16 GV601RW-M5082W : AMD Ryzen 9 6900HS, 16.10", 2.1 kgCritique » Test de l'Asus ROG Flow X16 : un gamer 2-en-1 avec mini-LED
MSI GE67 HX 12UGS : Intel Core i7-12800HX, 15.60", 2.5 kgCritique » L'Intel Core i7-12800HX est démentiel : test du MSI Raider GE67 HX 12UGS
Eurocom Raptor X15 : Intel Core i7-12700K, 15.60", 2.7 kgCritique » Test de l'Eurocom Raptor X15 : un Core i7-12700K LGA1700 dans un ordinateur portable
Acer Nitro 5 AN515-58-72QR : Intel Core i7-12700H, 15.60", 2.5 kgCritique » Test de l'Acer Nitro 5 AN515-58 : un ordinateur portable de jeu QHD puissant
MSI Katana GF66 12UGS : Intel Core i7-12700H, 15.60", 2.3 kgCritique » Test du MSI Katana GF66 12UGS : performances en hausse avec la mise à jour Alder Lake
Asus ROG Strix Scar 15 G533ZW-LN106WS : Intel Core i9-12900H, 15.60", 2.3 kgCritique » Test de l'Asus ROG Strix Scar 15 G533ZW : 1440p 240 Hz, Core i9 Alder Lake, RTX 3070 Ti 150 W
MSI Katana GF76 12UGS : Intel Core i7-12700H, 17.30", 2.7 kgCritique » Test du MSI Katana GF76 12UGS : l'un des PC portables RTX 3070 Ti les plus abordables vaut-il le coup ?
MSI Vector GP76 12UGS-434 : Intel Core i7-12700H, 17.30", 2.9 kgCritique » Test du MSI Vector GP76 12UGS : un ordinateur portable de jeu puissant
Razer Blade 17 (i7-12800H, RTX 3070 Ti) : Intel Core i7-12800H, 17.30", 2.8 kgCritique » Test du Razer Blade 17 : RTX 3070 Ti ou RTX 3080 Ti, quel est le meilleur Blade ?
Razer Blade 14 Ryzen 9 6900HX : AMD Ryzen 9 6900HX, 14.00", 1.8 kgCritique » Test du Razer Blade 14 : les débuts de l'AMD Ryzen 9 6900HX
HP Omen 16-b1090ng : Intel Core i7-12700H, 16.10", 2.3 kgCritique » HP Omen 16 (2022) : test : Un portable de jeu élégant avec un écran haute résolution de 165 Hz
Aorus 17 XE4 : Intel Core i7-12700H, 17.30", 2.6 kgCritique » Test de l'Aorus 17 XE4 : PC portable de jeu puissant avec un écran 360 Hz
Lenovo Legion 5 Pro 16 G7 i7 RTX 3070Ti : Intel Core i7-12700H, 16.00", 2.6 kgCritique » Test du Lenovo Legion 5i Pro 16 G7 : le PC portable de jeu avec Alder Lake et RTX 3070 Ti
MSI Vector GP66 12UGS : Intel Core i9-12900H, 15.60", 2.3 kgCritique » Test de l'ordinateur portable MSI Vector GP66 12UGS : 150 W TGP GeForce RTX 3070 Ti sweet spot
MSI Stealth GS66 12UGS : Intel Core i7-12700H, 15.60", 2.2 kgCritique » Test du MSI Stealth GS66 12UGS : Assez puissant pour la QHD
Acer Predator Helios 300 PH317-56-72QY : Intel Core i7-12700H, 17.30", 3 kgAutres tests » Acer Predator Helios 300 PH317-56-72QY
HP ZBook Studio 16 G9, i7-12700H RTX 3070 Ti : Intel Core i7-12700H, 16.00", 1.7 kgAutres tests » HP ZBook Studio 16 G9, i7-12700H RTX 3070 Ti
Acer Predator Helios 300 PH315-55-98R7 : Intel Core i9-12900H, 15.60", 2.6 kgAutres tests » Acer Predator Helios 300 PH315-55-98R7
Razer Blade 15 OLED (Early 2022) : Intel Core i9-12900H, 15.60", 2 kgAutres tests » Razer Blade 15 OLED (Early 2022)
HP Omen 16-k0097ng : Intel Core i9-12900H, 16.10", 2.4 kgAutres tests » HP Omen 16-k0097ng
HP Omen 17-ck1075ng : Intel Core i7-12700H, 17.30", 2.8 kgAutres tests » HP Omen 17-ck1075ng
Acer ConceptD 5 CN516-73G-70XD : Intel Core i7-12700H, 16.00", 2.4 kgAutres tests » Acer ConceptD 5 CN516-73G-70XD
Razer Blade 17 (i7-12800H, RTX 3070 Ti) : Intel Core i7-12800H, 17.30", 2.8 kgAutres tests » Razer Blade 17 (i7-12800H, RTX 3070 Ti)
HP Omen 16-k0168ng : Intel Core i7-12700H, 16.10", 2.4 kgAutres tests » HP Omen 16-k0168ng
MSI Raider GE77 HX 12UGS : Intel Core i7-12800HX, 17.30", 2.9 kgAutres tests » MSI Raider GE77 HX 12UGS
MSI Vector GP66 12UGSO-671RU : Intel Core i7-12700H, 15.60", 2.4 kgAutres tests » MSI Vector GP66 12UGSO-671RU
Lenovo Legion 7 16IAX7-82TD0075GE : Intel Core i7-12800HX, 16.00", 2.5 kgAutres tests » Lenovo Legion 7 16IAX7-82TD0075GE
HP Omen 16-n0007ns : AMD Ryzen 9 6900HX, 16.10", 2.3 kgAutres tests » HP Omen 16-n0007ns
HP Omen 16-n0598nd : AMD Ryzen 9 6900HX, 16.00", 2.3 kgAutres tests » HP Omen 16-n0598nd
MSI Vector GP76 12UGS-491ES : Intel Core i7-12700H, 17.30", 2.8 kgAutres tests » MSI Vector GP76 12UGS-491ES
Asus ROG Strix Scar 17 SE G733CW-LL044W : Intel Core i9-12950HX, 17.30", 2.9 kgAutres tests » Asus ROG Strix Scar 17 SE G733CW-LL044W
Lenovo Legion 5 Pro 16ARH7H RTX 3070 Ti : AMD Ryzen 7 6800H, 16.00", 2.6 kgAutres tests » Lenovo Legion 5 Pro 16ARH7H RTX 3070 Ti
Acer Predator Triton 300 SE PT316-51s-74RM : Intel Core i7-12700H, 16.00", 2.4 kgAutres tests » Acer Predator Triton 300 SE PT316-51s-74RM
Lenovo ThinkPad X1 Extreme G5, i7-12800H RTX 3070 Ti : Intel Core i7-12800H, 16.00", 1.9 kgAutres tests » Lenovo ThinkPad X1 Extreme G5, i7-12800H RTX 3070 Ti
Lenovo Legion 5 Pro 16IAH7H, i9-12900H RTX 3070 Ti : Intel Core i9-12900H, 16.00", 2.5 kgAutres tests » Lenovo Legion 5 Pro 16IAH7H, i9-12900H RTX 3070 Ti
Asus ROG Strix G17 G713RW-LL009 : AMD Ryzen 9 6900HX, 17.30", 2.8 kgAutres tests » Asus ROG Strix G17 G713RW-LL009
Acer Predator Helios 300 PH315-55-764C : Intel Core i7-12700H, 15.60", 2.6 kgAutres tests » Acer Predator Helios 300 PH315-55-764C
Gigabyte Aero 16 XE5 : Intel Core i7-12700H, 16.00", 2.3 kgAutres tests » Gigabyte Aero 16 XE5
Razer Blade 15 2022 RZ09-0421NGG3-R3G1 : Intel Core i9-12900H, 15.60", 2 kgAutres tests » Razer Blade 15 2022 RZ09-0421NGG3-R3G1
Acer Predator Helios 300 PH315-55-902L : Intel Core i9-12900H, 15.60", 2.6 kgAutres tests » Acer Predator Helios 300 PH315-55-902L
Lenovo Legion 5 Pro 16 G7 i7 RTX 3070Ti : Intel Core i7-12700H, 16.00", 2.6 kgAutres tests » Lenovo Legion 5 Pro 16 G7 i7 RTX 3070Ti
Acer Nitro 5 AN515-46-R606 : AMD Ryzen 7 6800H, 15.60", 2.5 kgAutres tests » Acer Nitro 5 AN515-46-R606
Dell G15 5520, i7-12700H RTX 3070 Ti : Intel Core i7-12700H, 15.60", 2.7 kgAutres tests » Dell G15 5520, i7-12700H RTX 3070 Ti
Acer Predator Helios 300 PH315-55-766X : Intel Core i7-12700H, 15.60", 2.4 kgAutres tests » Acer Predator Helios 300 PH315-55-766X
MSI Raider GE76 12UGS-018NL : Intel Core i7-12700H, 17.30", 2.9 kgAutres tests » MSI Raider GE76 12UGS-018NL
Alienware x15 R2 YMGXH : Intel Core i7-12700H, 15.60", 2.5 kgAutres tests » Alienware x15 R2 YMGXH
Asus ROG Flow X16 GV601RW-M5093W : AMD Ryzen 7 6800HS, 16.00", 2.1 kgAutres tests » Asus ROG Flow X16 GV601RW-M5093W
MSI Creator Z16P B12UGST : Intel Core i9-12900H, 16.00", 2.4 kgAutres tests » MSI Creator Z16P B12UGST
MSI Raider GE67 HX 12UGS-002 : Intel Core i7-12800HX, 15.60", 2.4 kgAutres tests » MSI Raider GE67 HX 12UGS-002
MSI Raider GE76 12UGS-070 : Intel Core i7-12800HX, 15.60", 2.9 kgAutres tests » MSI Raider GE76 12UGS-070
MSI Stealth GS66 12UGS-025 : Intel Core i9-12900H, 15.60", 2.1 kgAutres tests » MSI Stealth GS66 12UGS-025
MSI Stealth GS77 12UH-088ES : Intel Core i7-12700H, 17.30", 2.8 kgAutres tests » MSI Stealth GS77 12UH-088ES
Lenovo Legion 5 Pro 16IAH7H-82RF000TUS : Intel Core i7-12700H, 16.00", 2.5 kgAutres tests » Lenovo Legion 5 Pro 16IAH7H-82RF000TUS
Acer Predator Helios 300 PH315-55-79FW : Intel Core i7-12700H, 15.60", 2.6 kgAutres tests » Acer Predator Helios 300 PH315-55-79FW
Asus ROG Flow X16 GV601RW-M5082W : AMD Ryzen 9 6900HS, 16.10", 2.1 kgAutres tests » Asus ROG Flow X16 GV601RW-M5082W
MSI Katana GF66 12UGS : Intel Core i7-12700H, 15.60", 2.3 kgAutres tests » MSI Katana GF66 12UGS
Alienware m17 R5, 6900HX RTX 3070 Ti : AMD Ryzen 9 6900HX, 17.30", 3.3 kgAutres tests » Alienware m17 R5, 6900HX RTX 3070 Ti
Asus Zephyrus G15 GA503RW-LN030W : AMD Ryzen 9 6900HS, 15.60", 1.9 kgAutres tests » Asus Zephyrus G15 GA503RW-LN030W
MSI Vector GP66 12UGS-207XFR : Intel Core i7-12700H, 15.60", 2.4 kgAutres tests » MSI Vector GP66 12UGS-207XFR
MSI Vector GP76 12UGS-618 : Intel Core i9-12900HK, 17.30", 2.8 kgAutres tests » MSI Vector GP76 12UGS-618
Razer Blade 14 Ryzen 9 6900HX : AMD Ryzen 9 6900HX, 14.00", 1.8 kgAutres tests » Razer Blade 14 Ryzen 9 6900HX
HP Omen 16-b1090ng : Intel Core i7-12700H, 16.10", 2.3 kgAutres tests » HP Omen 16-b1090ng
Aorus 15 XE5 : Intel Core i7-12700H, 15.60", 2.3 kgAutres tests » Aorus 15 XE5
MSI Creator Z17 A12UGST-049 : Intel Core i7-12700H, 17.30", 2.5 kgAutres tests » MSI Creator Z17 A12UGST-049
Aorus 15 XE4 : Intel Core i7-12700H, 15.60", 2.4 kgAutres tests » Aorus 15 XE4
Acer Predator Helios 300 PH317-56-718D : Intel Core i7-12700H, 17.30", 3 kgAutres tests » Acer Predator Helios 300 PH317-56-718D
Asus ROG Strix Scar 15 G533ZW-AS94 : Intel Core i9-12900H, 15.60", 2.4 kgAutres tests » Asus ROG Strix Scar 15 G533ZW-AS94
Razer Blade 15 RZ09-0421NGD3-R3G1 : Intel Core i7-12800H, 15.60", 2 kgAutres tests » Razer Blade 15 RZ09-0421NGD3-R3G1
Asus ROG Strix G17 G713RW-LL103W : AMD Ryzen 9 6900HX, 17.30", 2.8 kgAutres tests » Asus ROG Strix G17 G713RW-LL103W
Asus ROG Strix G15 G513RW-HQ021W : AMD Ryzen 9 6900HX, 15.60", 2.3 kgAutres tests » Asus ROG Strix G15 G513RW-HQ021W
MSI Stealth GS77 12UGS-065 : Intel Core i7-12700H, 17.30", 2.8 kgAutres tests » MSI Stealth GS77 12UGS-065
MSI Raider GE76 12UGS-493 : Intel Core i7-12700H, 17.30", 2.9 kgAutres tests » MSI Raider GE76 12UGS-493
Acer Nitro 5 AN517-55-78NJ : Intel Core i7-12700H, 17.30", 3 kgAutres tests » Acer Nitro 5 AN517-55-78NJ
Alienware m15 R7-D8YK4 : Intel Core i7-12700H, 15.60", 2.7 kgAutres tests » Alienware m15 R7-D8YK4
Lenovo Legion 5 Pro 16IAH7H-82RF000VGE : Intel Core i7-12700H, 16.00", 2.5 kgAutres tests » Lenovo Legion 5 Pro 16IAH7H-82RF000VGE
Acer Predator Triton 500 SE PT516-52s-73YD : Intel Core i7-12700H, 16.00", 2.4 kgAutres tests » Acer Predator Triton 500 SE PT516-52s-73YD
MSI Stealth GS66 12UGS : Intel Core i7-12700H, 15.60", 2.2 kgAutres tests » MSI Stealth GS66 12UGS
Asus ROG Zephyrus M16 GU603ZW-K8062W : Intel Core i9-12900H, 16.00", 1.9 kgAutres tests » Asus ROG Zephyrus M16 GU603ZW-K8062W
Asus ROG Strix Scar 15 G533ZW-LN106WS : Intel Core i9-12900H, 15.60", 2.3 kgAutres tests » Asus ROG Strix Scar 15 G533ZW-LN106WS
Asus ROG Strix Scar 15 G533ZW-LN017W : Intel Core i9-12900H, 15.60", 2.4 kgAutres tests » Asus ROG Strix Scar 15 G533ZW-LN017W
Aorus 17 XE4 : Intel Core i7-12700H, 17.30", 2.6 kgAutres tests » Aorus 17 XE4
MSI Vector GP76 12UGS-434 : Intel Core i7-12700H, 17.30", 2.9 kgAutres tests » MSI Vector GP76 12UGS-434
Acer Predator Helios 300 PH305-55 : Intel Core i7-12700H, 15.60", 2.5 kgAutres tests » Acer Predator Helios 300 PH305-55
Asus ROG Strix G17 G733ZW-LL103W : Intel Core i9-12900H, 17.30", 2.9 kgAutres tests » Asus ROG Strix G17 G733ZW-LL103W
Alienware x17 R2, i7-12700H 3070 Ti 4K : Intel Core i7-12700H, 17.30", 3.1 kgAutres tests » Alienware x17 R2, 12900HK 3080 Ti FHD
Acer Nitro 5 AN515-58-75UH : Intel Core i7-12700H, 15.60", 2.5 kgAutres tests » Acer Nitro 5 AN515-58-75UH
MSI GE66 Raider 10UG-605ES : Intel Core i7-10870H, 15.60", 2.4 kgAutres tests » MSI GE66 Raider 10UG-605ES
SCHENKER Vision 16 Pro RTX 3070 Ti : Intel Core i7-12700H, 16.00", 1.7 kgLe Vision 16 Pro de Schenker montre qu'un ordinateur portable léger ne doit pas sacrifier les performances, les ports ou les options de maintenance
Lenovo Legion 5 Pro 16ARH7H RTX 3070 Ti : AMD Ryzen 7 6800H, 16.00", 2.6 kgLe Ryzen 9 6900HX est une perte d'argent par rapport au Ryzen 7 6800H et les benchmarks en sont la preuve
Razer Blade 14 Ryzen 9 6900HX : AMD Ryzen 9 6900HX, 14.00", 1.8 kgAMD Ryzen 9 6900HX vs. Core i7-12800H : Intel a toujours l'avantage
Lenovo Legion 5 Pro 16 G7 i7 RTX 3070Ti : Intel Core i7-12700H, 16.00", 2.6 kgLe nouveau Legion 5i Pro 16 G7 de Lenovo avec la RTX 3070 Ti est un très bon ordinateur portable de jeu
MSI Vector GP66 12UGS : Intel Core i9-12900H, 15.60", 2.3 kgMSI GP66 Leopard vs. Vector GP66 : Quelle est la différence ?
MSI Stealth GS66 12UGS : Intel Core i7-12700H, 15.60", 2.2 kgLes débuts de la RTX 3070 Ti : MSI Stealth GS66
Please share our article, every link counts!
Rang 1 GeForce RTX 2080 Super Mobile
Rang 2 M1 Max 32-Core GPU *
GeForce RTX 2070 Super Mobile
M1 Max 24-Core GPU *
Radeon RX 5700M *
M1 Pro 16-Core GPU *
Radeon PRO W6600M *
GeForce RTX 2070 Super Max-Q
M1 Pro 14-Core GPU *
GeForce GTX 1070 Mobile
Radeon RX 580X (Laptop) *
Radeon RX 580 (Laptop)
Radeon Pro 5300M
Radeon RX 5300M
Radeon RX 570X (Laptop) *
Radeon RX 570 (Laptop) *
Radeon RX 470 (Laptop) *
Rang 3 GeForce GTX 1050 Ti Mobile
Radeon 680M
Quadro P2000 Max-Q
Radeon R9 M395X
GeForce GTX 1050 Ti Max-Q *
Radeon R9 M485X
GeForce GTX 1050 Max-Q *
Radeon 660M
Radeon RX 560X (Laptop)
Radeon RX 560 (Laptop)
Radeon Pro 560X
Radeon Pro 560
Radeon Pro 460
Quadro P620 *
Radeon RX 550X (Laptop)
Radeon Pro 555X
Radeon Pro 555
Radeon Pro 455
Quadro P600
Radeon RX 540X *
Radeon Pro WX 2100 *
Radeon Pro 450
Radeon 630
Radeon 540X *
Quadro P520
Quadro P500 *
Iris Plus Graphics G7 (Ice Lake 64 EU) *
Vega 10 *
Iris Pro Graphics 580
Vega 9
UHD Graphics Xe G4 48EUs *
UHD Graphics 32EUs
UHD Graphics Xe 32EUs (Tiger Lake-H) *
UHD Graphics 750
Vega 7
Vega 8
Iris Plus Graphics G4 (Ice Lake 48 EU)
FirePro W4190M
Radeon R7 M445
UHD Graphics 24EUs (Alder Lake-N) *
Radeon R7 M460 *
Radeon R7 M340
Radeon 610M *
UHD Graphics G1 (Ice Lake 32 EU)
UHD Graphics Xe 16EUs (Tiger Lake-H) *
Adreno 690 *
Adreno 685 *
Adreno 680 *
Rang 4 UHD Graphics 730
Radeon R5 M315 *
Radeon R5 M420 *
UHD Graphics 617
UHD Graphics 615
Radeon R4 (Stoney Ridge)
Radeon R2 (Stoney Ridge)
Rang 5 * Position approximative de la carte graphique
Klaus Hinum, 2022-04- 2 (Update: 2022-04- 2)
 Deutsch
 English
 Español
 Français
 Italiano
 Nederlands
 Polski
 Português
 Русский
 Türkçe
 Svenska
 Chinese
 Magyar